
Leaf Area Estimation by Photographing Leaves Sandwiched between Transparent Clear File Folder Sheets


Abstract
1. Introduction
2. Materials and Methods
2.1. Study Species
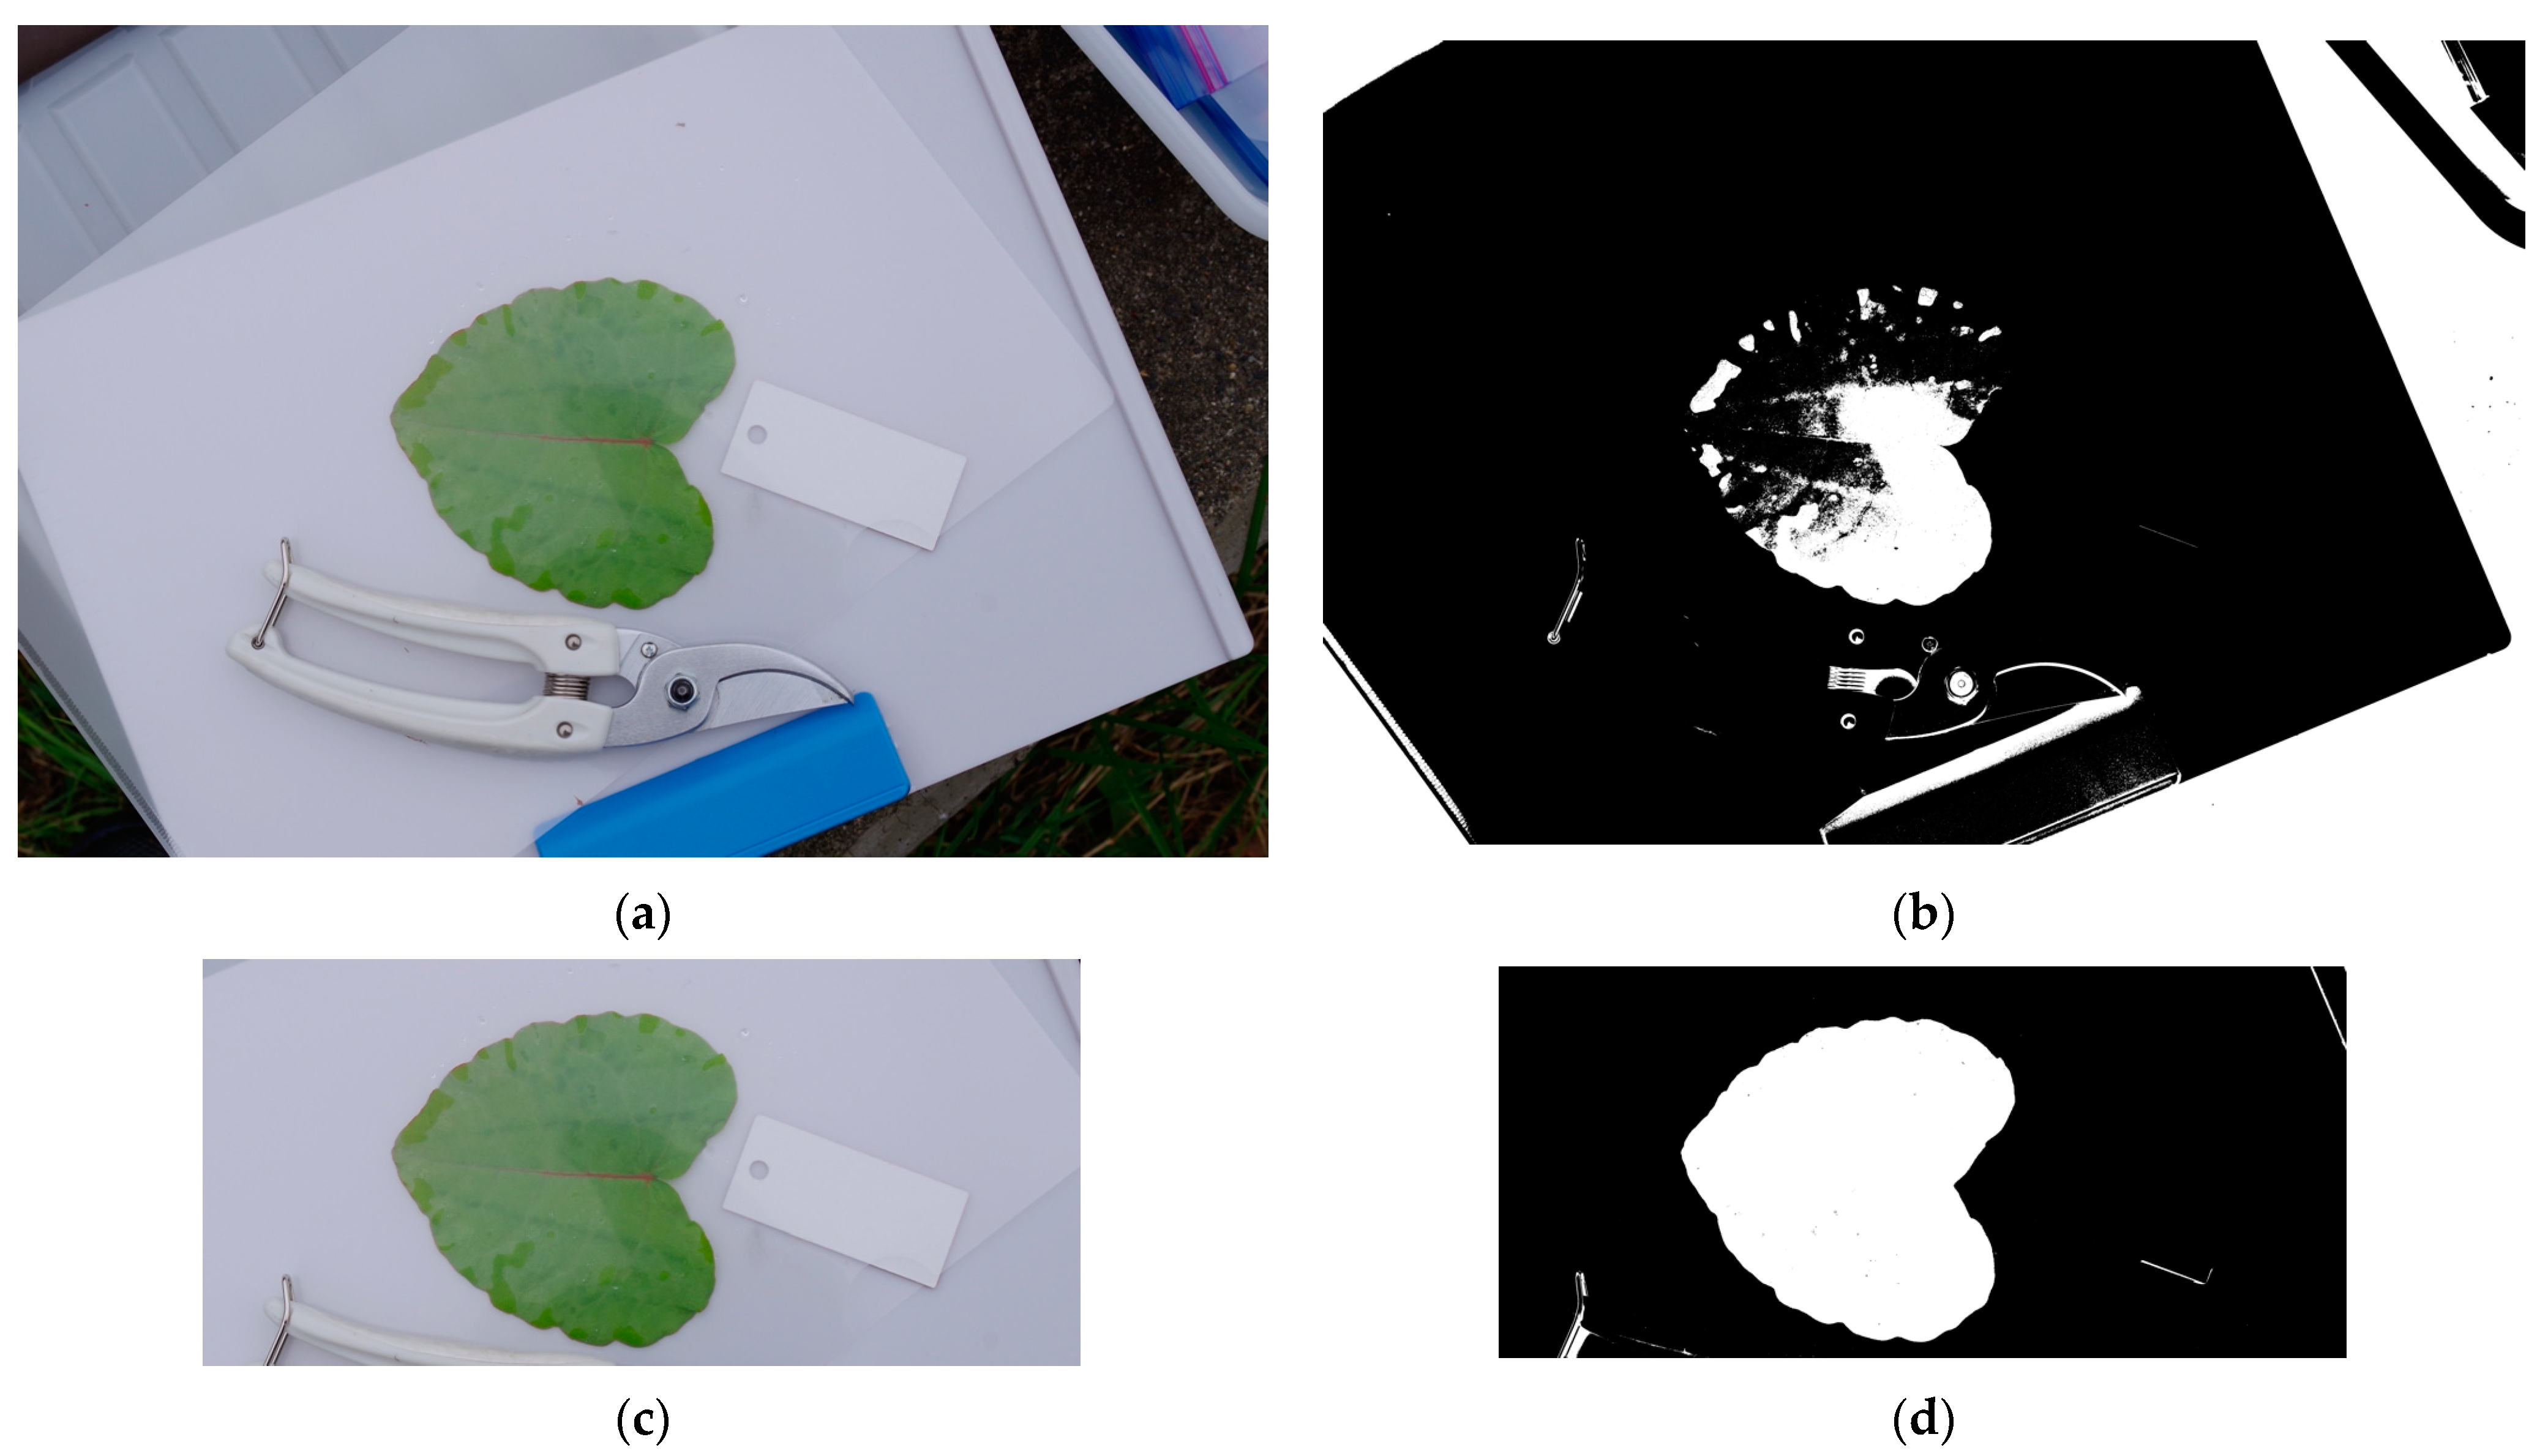
2.2. Leaf Photography
2.3. Scanning Leaves with a Flatbed Scanner
2.4. Leaf Size Measurement
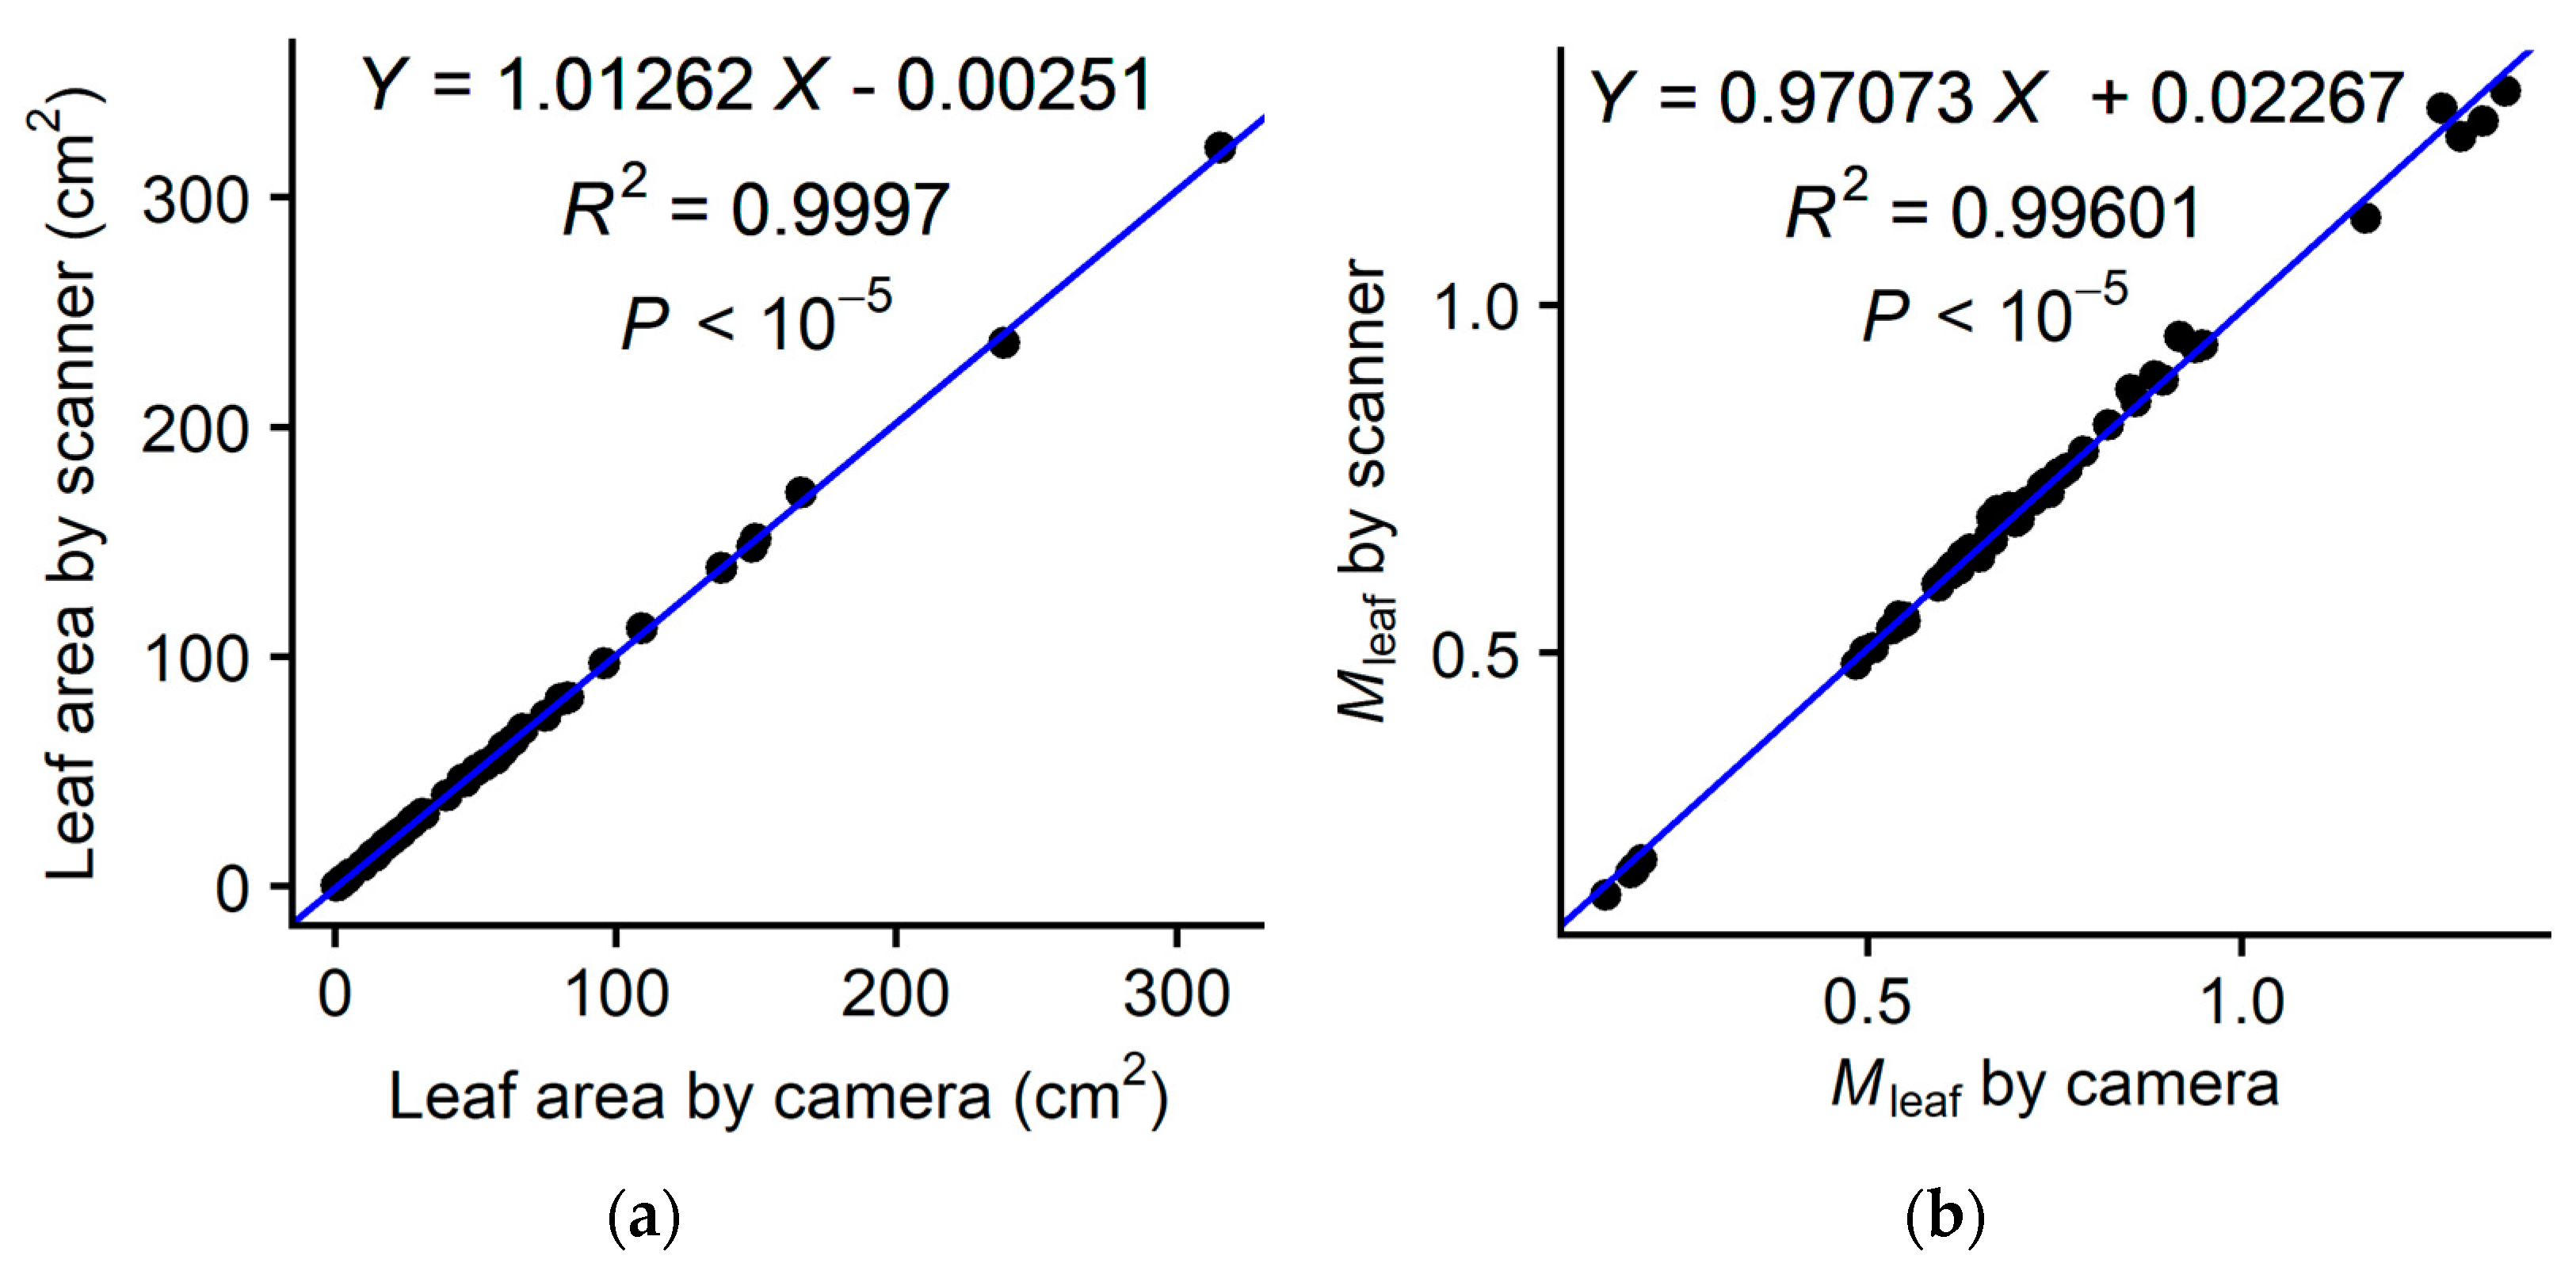
2.5. Comparison of the Two Methods (Camera vs. Scanner)
2.6. Estimation of the Montgomery Parameter from Five Images
3. Results
4. Discussion
Supplementary Materials
Funding
Data Availability Statement
Conflicts of Interest
Appendix A
Appendix A.1. Outline

Appendix A.2. Taking a Picture
Appendix A.3. Opening the Image File with ImageJ
- ImageJ is a free software (in public domain) developed by Schneider et al. [81] that can be downloaded via its official page.
- Drag and drop your image file (e.g., JPEG, PNG) onto the tool bar.

Appendix A.4. Measuring the Scale
- Select the “Straight tool” on the tool bar (Figure A3a);
- Left click the two endpoints of the 3 cm scale (Figure A3b). NOTE: Selection of the endpoints must be done precisely as this will affect the accuracy of the measurement;
- “Analyze” → “Measure” (or shortcut “Ctrl + M”); the “Results” window will appear (Figure A3c).

Appendix A.5. Measuring Leaf Length and Width
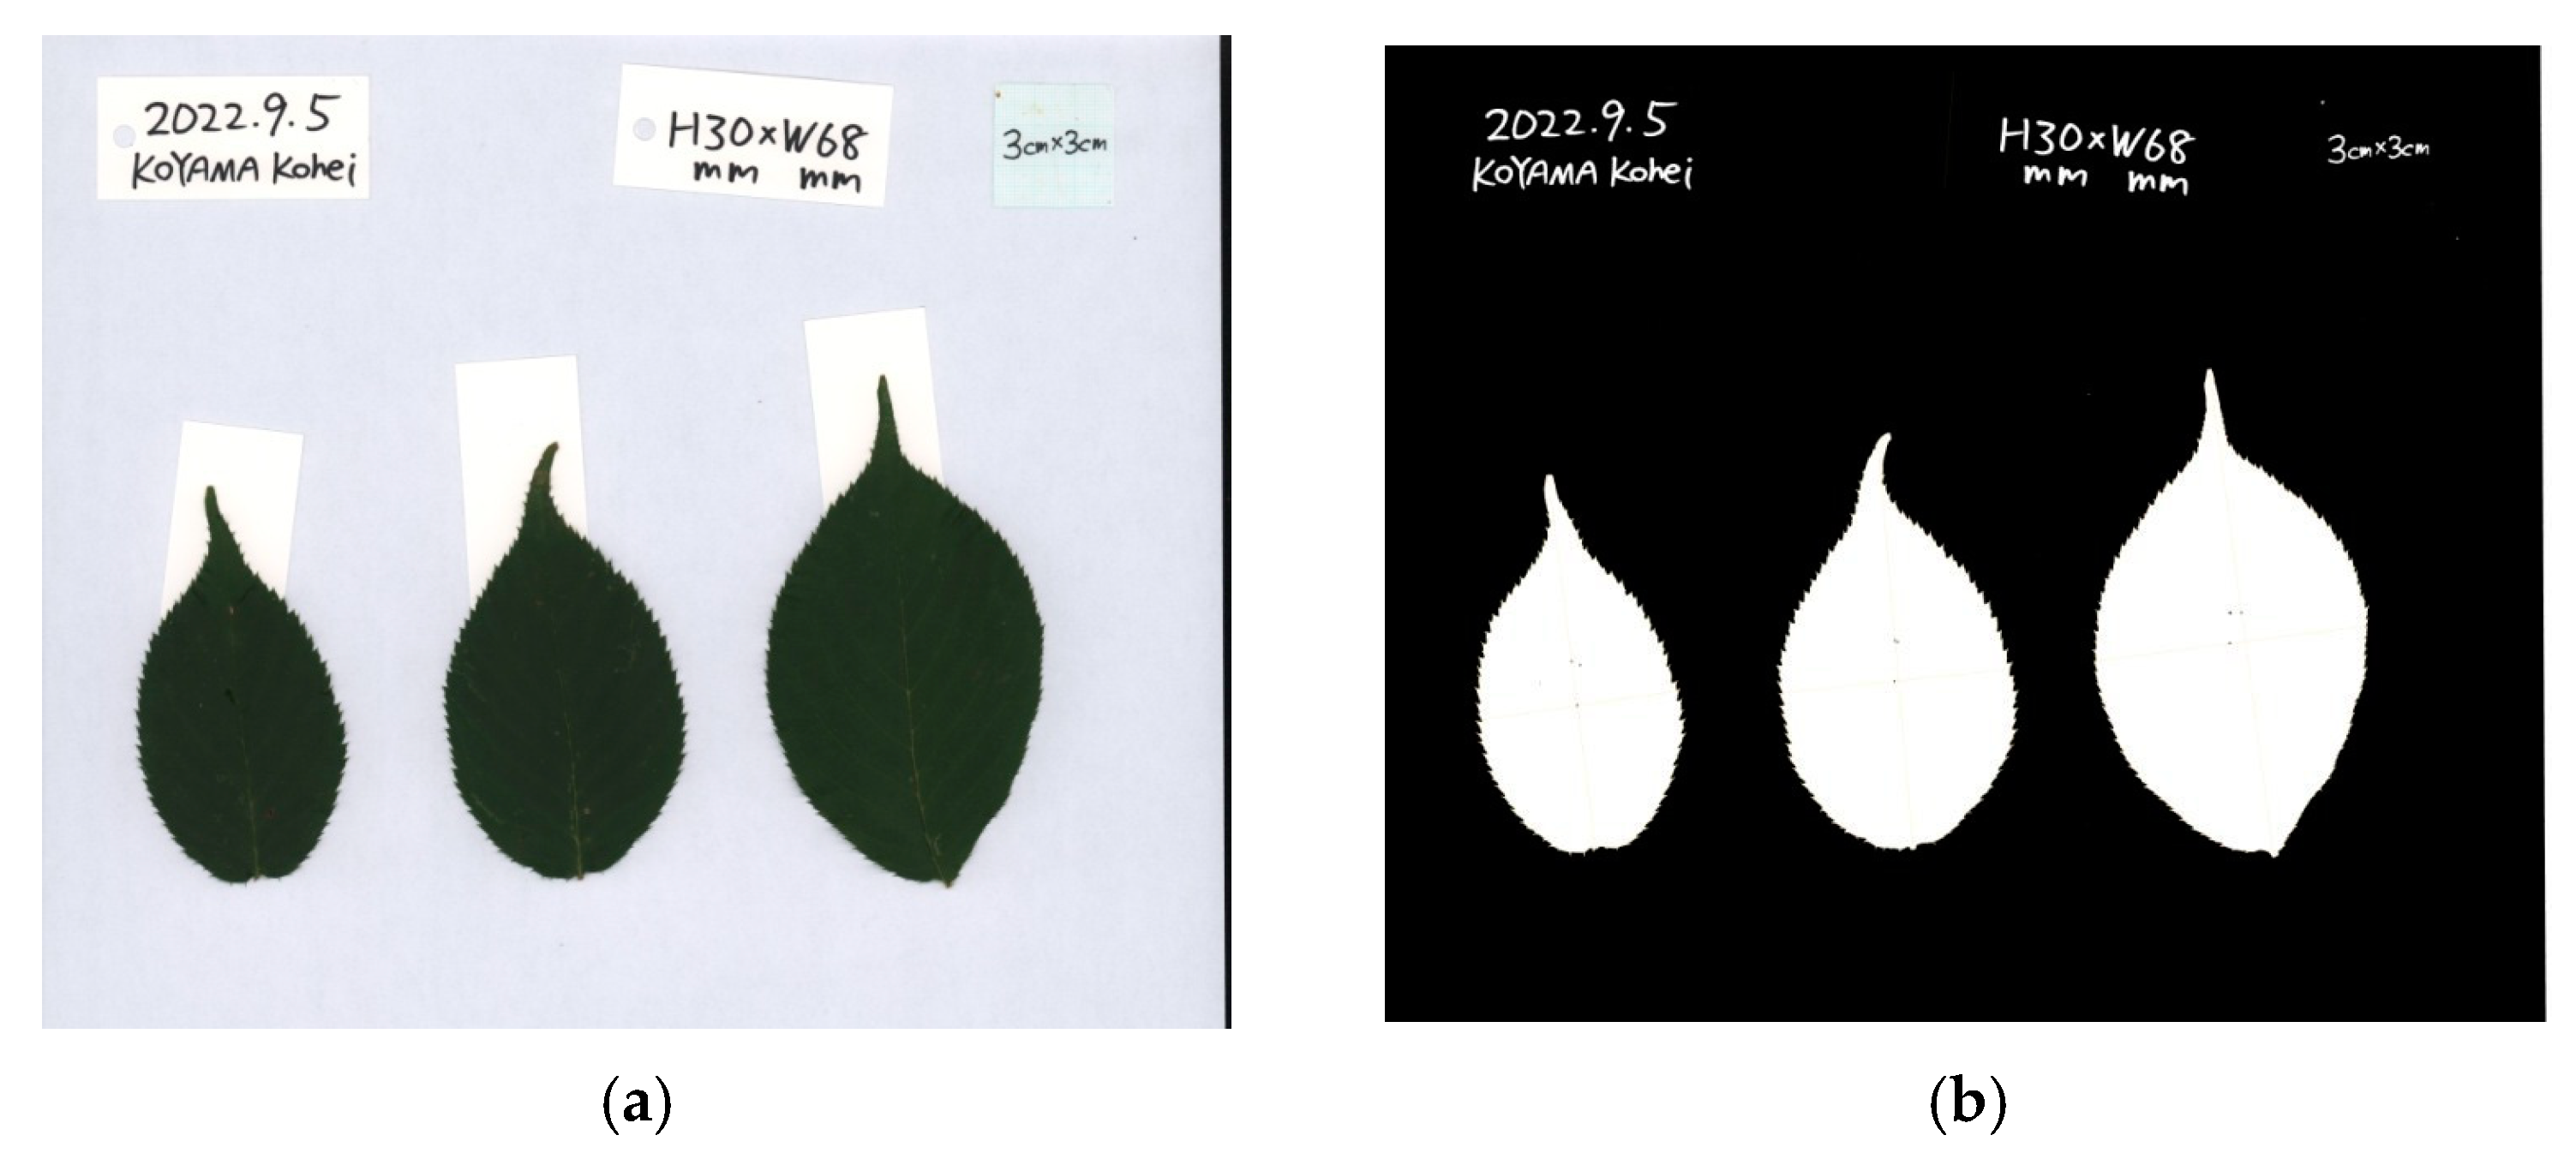
Appendix A.6. Automatic Binarization Using ImageJ
- A binarized image consists of black and white pixels (no intermediate gray pixels). After binarization, the area of the leaf lamina (i.e., leaf blade) can be automatically measured using Image by counting the number of white (or black) dots.
- “Process” → “Binary” → “Make Binary” (Figure A4). NOTE: In ImageJ, the “Undo” command does not always work. Save the image at each step of the process (e.g., before and after binarization) using a different filename;
- If the automatic binarization process fails, see Section A.7 “Image Cropping to Aid Automatic Binarization” below.

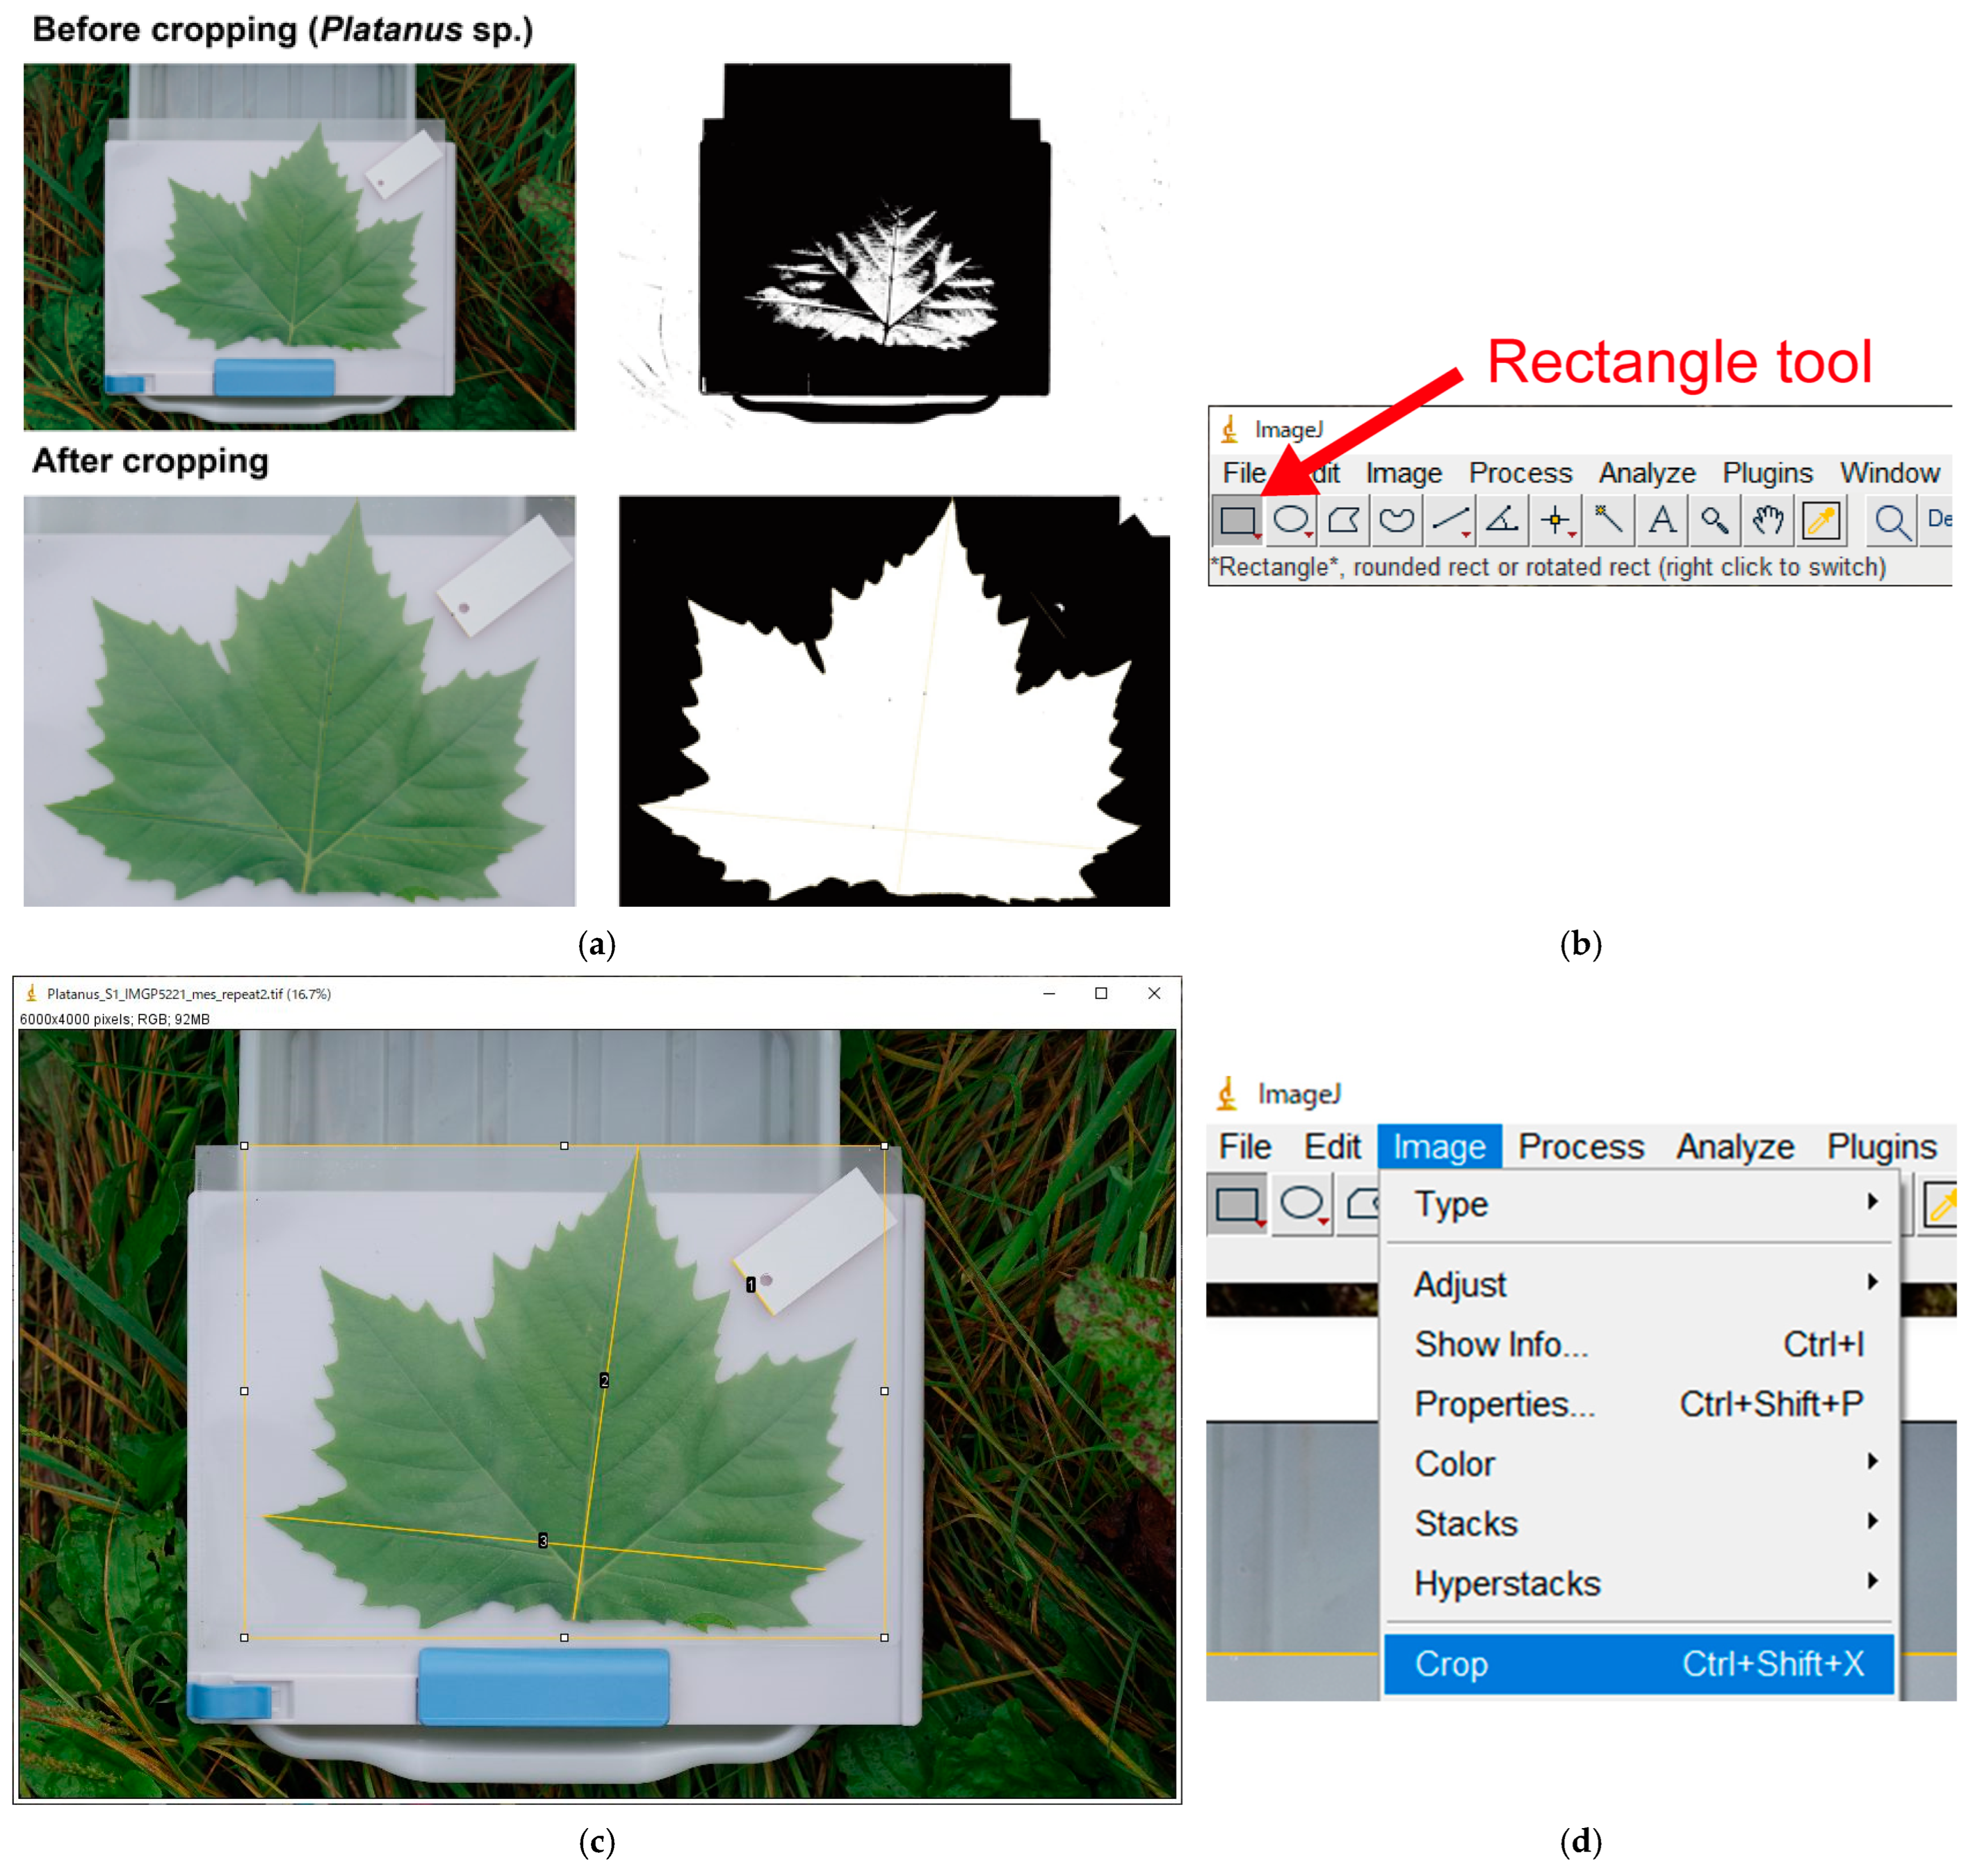
Appendix A.7. Image Cropping to Aid Automatic Binarization (Optional)
- Automatic binarization using ImageJ is not always successful. Cropping (trimming) the image often solves this problem (Figure A5a). This is because ImageJ automatically sets binarization threshold (unless it is manually specified) considering the entire image. Cropping background outside the white clipboard results in a “leaf vs. white background,” which makes it easier for ImageJ to distinguish the leaf;
- If binarization fails even after cropping, see Section A.12 “Manual Leaf Selection with Polygon Selections” below.

Appendix A.8. Measuring the Leaf Area
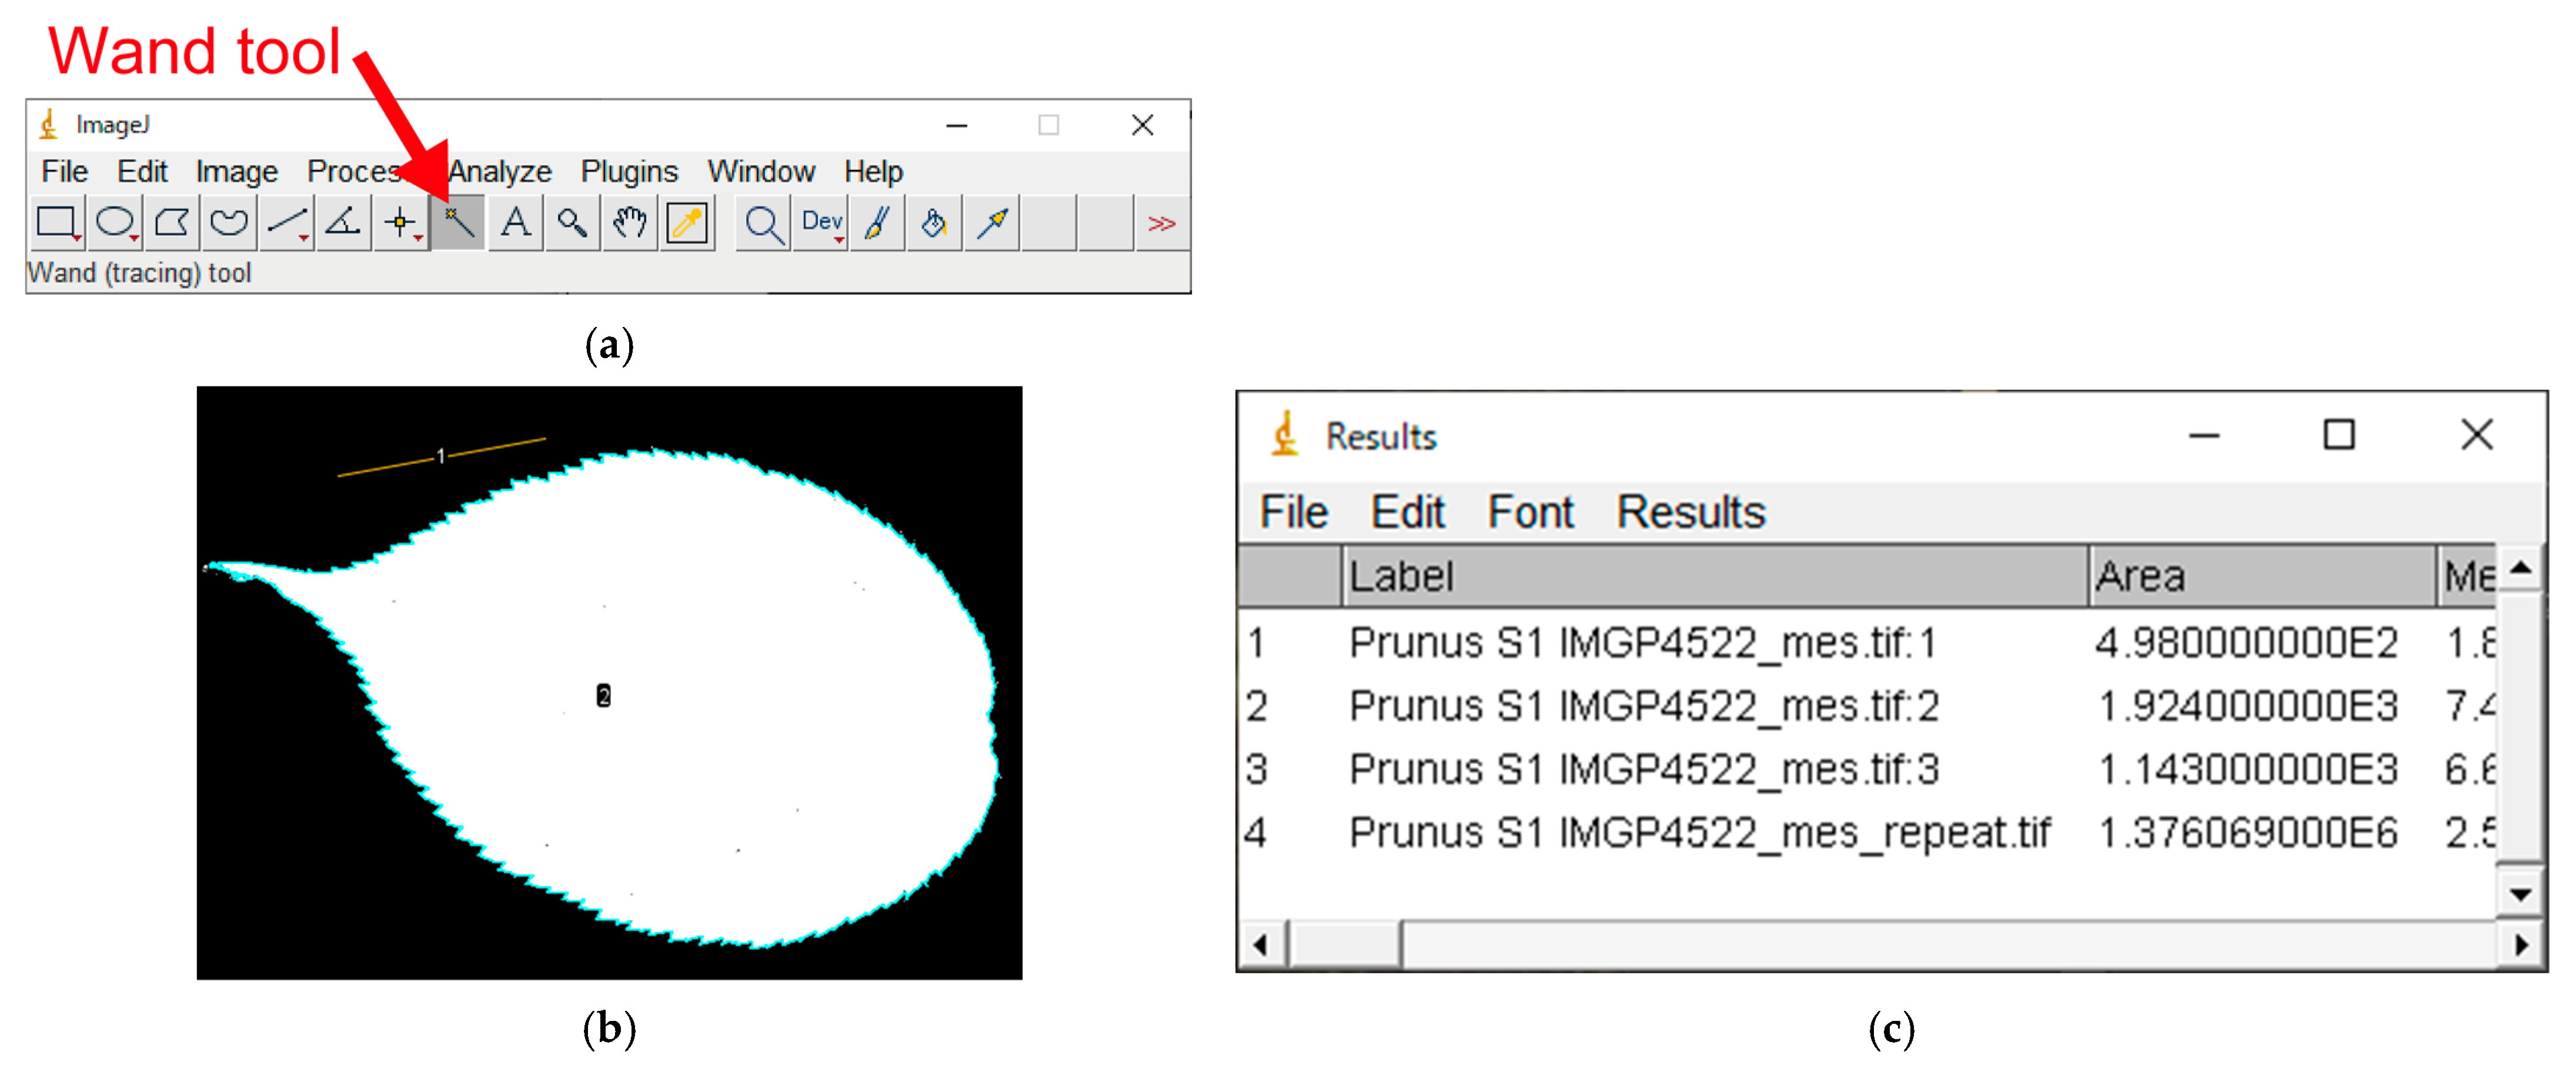
- Select the “Wand (tracing) tool”(Figure A6a);
- Activate the leaf silhouette by left clicking on it. If binarization is successful, ImageJ will automatically select the silhouette of the entire leaf lamina. Ensure that the circumference of the leaf lamina is correctly color-highlighted;
- Press the “Ctrl + M” keys (or “Analyze” → “Measure”); the circumference of the lamina is now highlighted in light blue (the color may differ due to software settings) (Figure A6b). The results will be added as a new row in the “Results” window (Figure A6c). The area of the leaf, expressed as the number of pixels (not in cm2), appears in the “Area” column in the last row in the Results window (i.e., the lamina silhouette consists of 1.376E6 = 1.376 × 106 = 1,376,000 pixels).

Appendix A.9. Exporting the Results as a CSV file

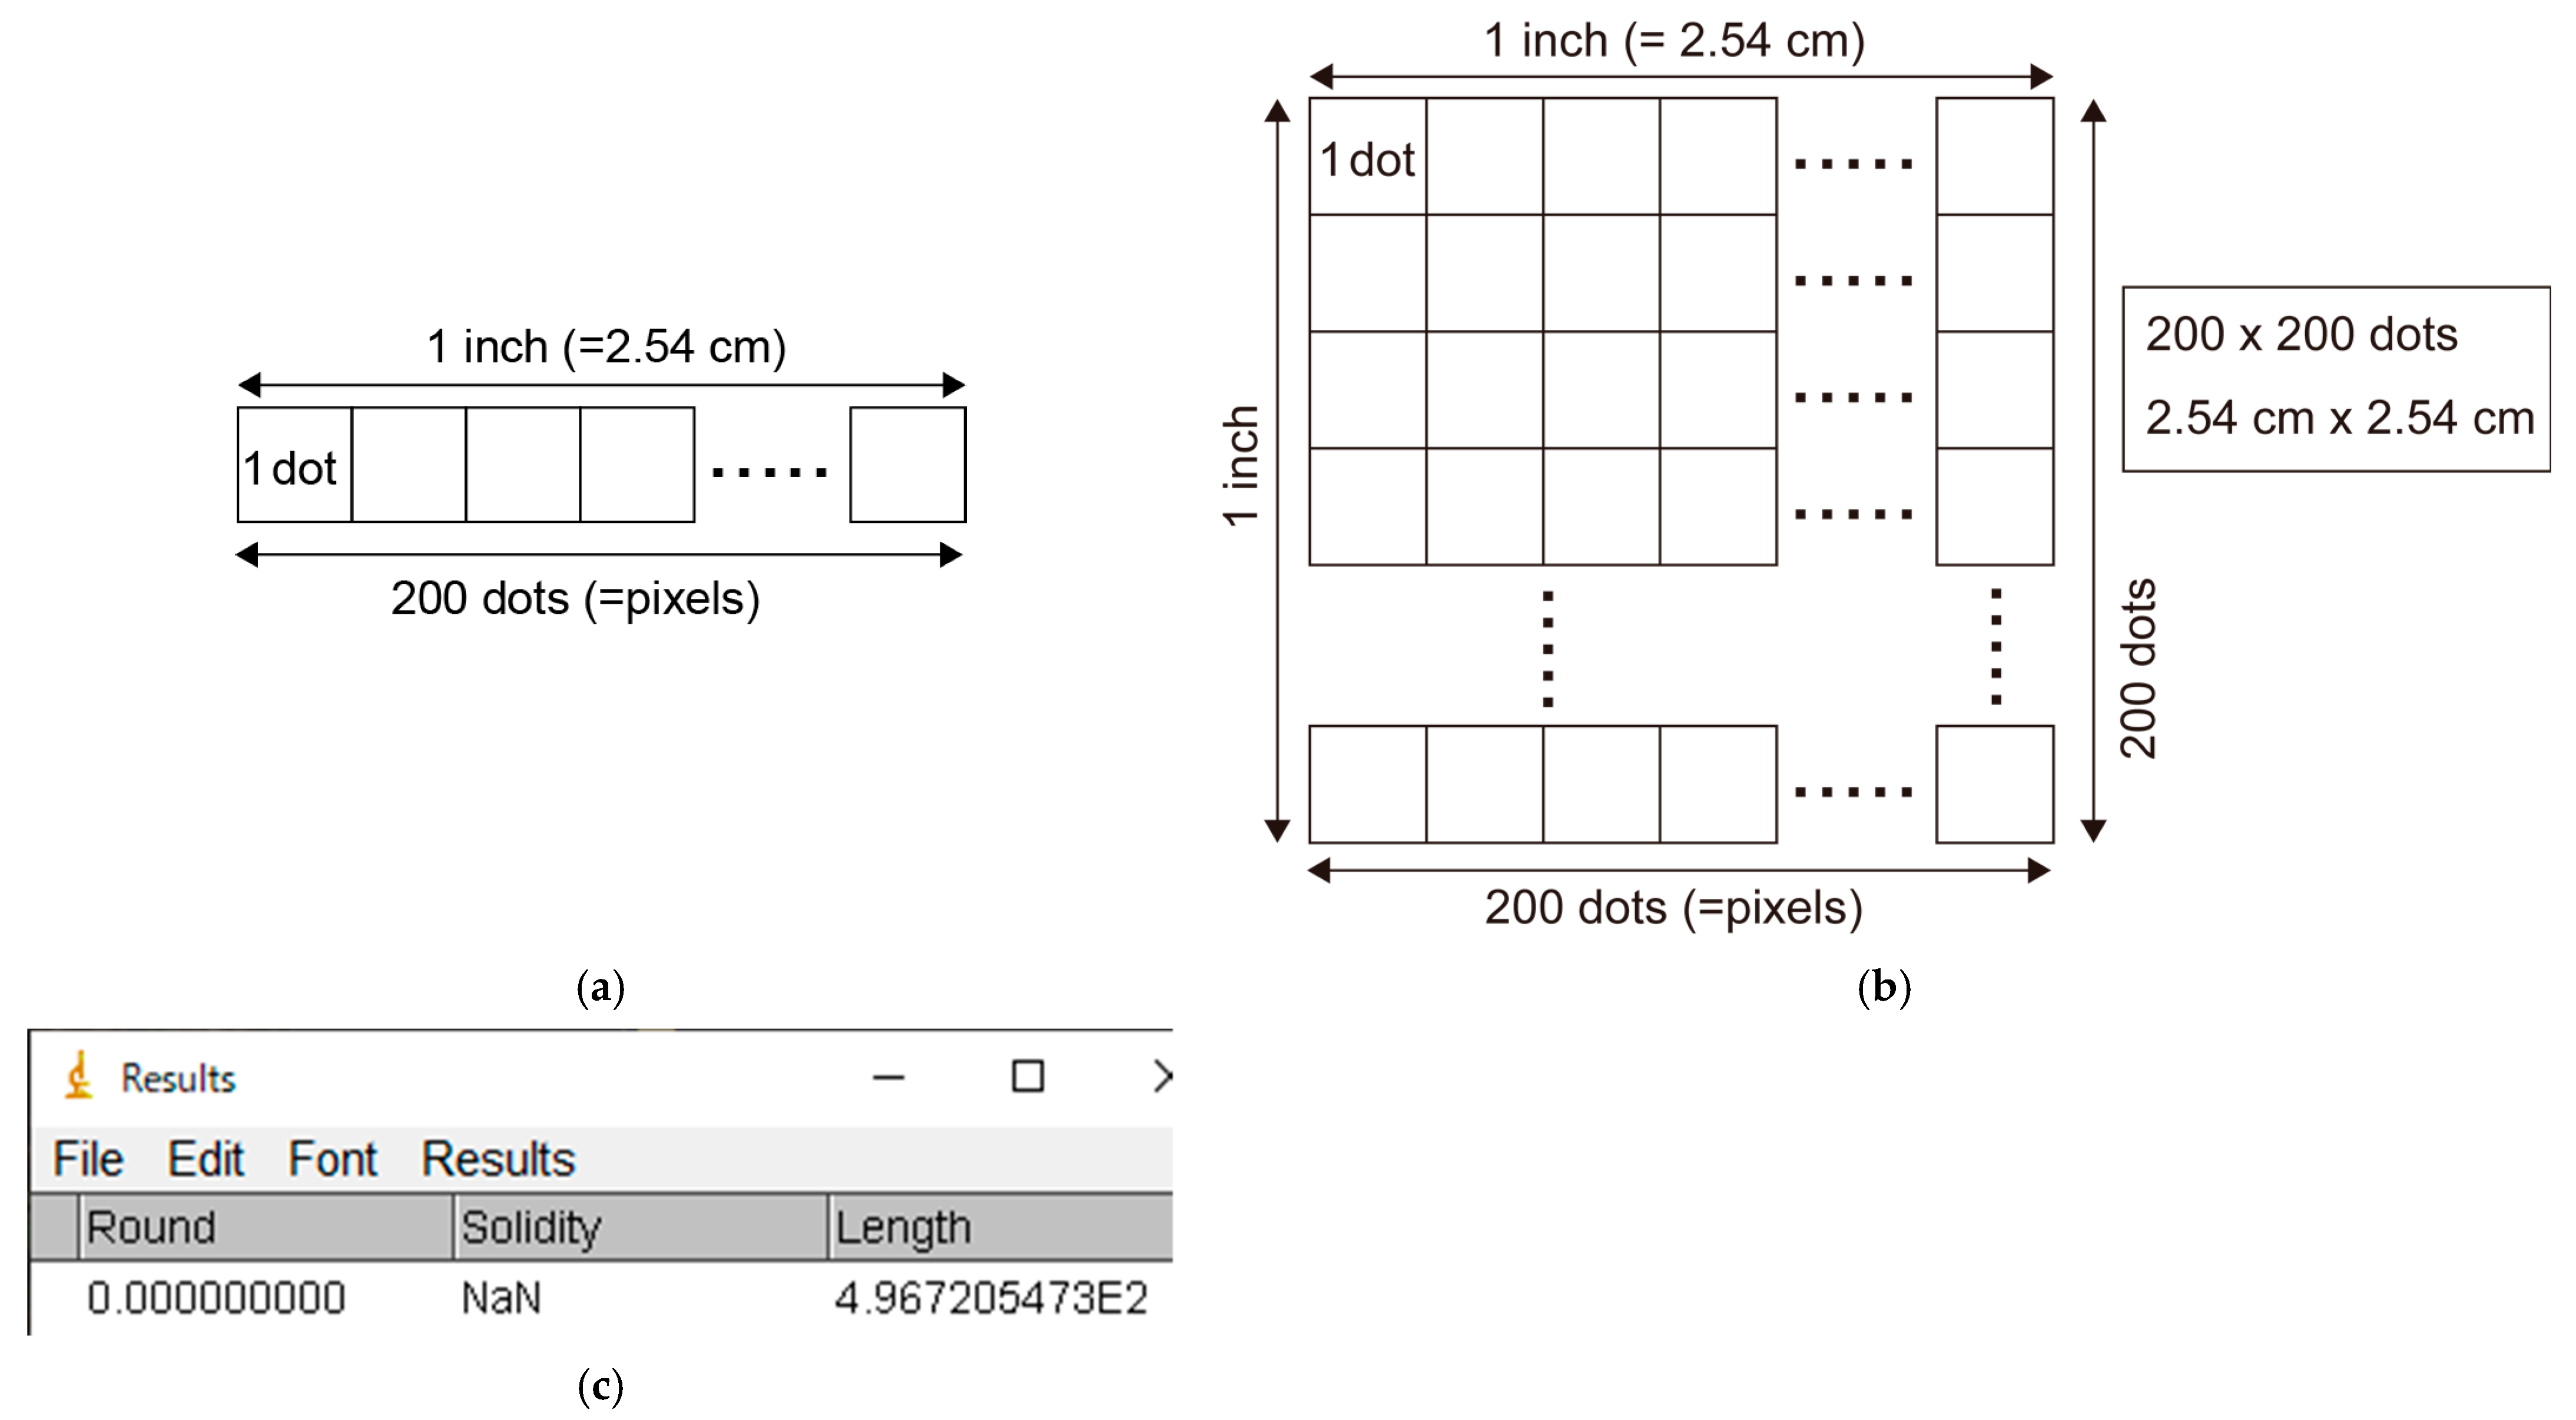
Appendix A.10. Calculating the Resolution of the Image
- The resolution of an image will differ depending on the image file. If a camera is closer to a leaf, the same leaf will appear “larger” and thus contain more pixels in your image. We are interested in the actual leaf area (expressed in cm2) not the number of pixels. Therefore, an image-specific conversion factor from pixels to cm2 is needed. This conversion factor is called the resolution of the image and expressed as dots per inch (dpi).
- In the Results window (or the exported CSV file), the first row presents the measurement results for the 3 cm scale (as we measured the scale first). The value in the “Length” column indicates how many pixels are placed on the distance of 3 cm on your image (Figure A8c).
- Calculate the resolution of your image using the result for the 3 cm scale bar. For example, if the measured length of the 3 cm scale was 497 pixels (appearing as “4.967E2” (=496.7) in the “Results” window; Figure A8c), the resolution is 497/3 = 165.6 dots per centimeter (=27,415 dots per cm2). This corresponds to 420.6 dpi.
- The actual leaf length and area are obtained by converting the units from pixels (dots) into cm (or cm2):Leaf length = 1923 pixels/165.6 dots per cm = 11.62 cm,Leaf area = 1,376,069 pixels/27415 dots per cm2 = 50.19 cm2.

Appendix A.11. Measuring Leaf Area using Scanned Images
- Remember the resolution (dpi) selected for scanning. Taking a screenshot of the scanner settings will save the dpi value together with the scanned images. This dpi value can be used to convert between units (dots into centimeters) without measuring the scale. Nevertheless, we recommend double-checking the dpi by measuring the scale bar even for scanned images. This is because the dpi of the image can be easily changed after editing the images.

Appendix A.12. Manual Leaf Selection Using Polygon Selections (Optional)
- If binarization fails even after image cropping, you can measure the leaf area by manually tracing all edges of the leaf lamina: “Polygon selections” (Figure A10a) → manually select all edges of the leaf lamina (Figure A10b) → “Ctrl + M”;
- Although this is time-consuming, this generic method will work for any image in which the target object cannot be automatically separated from the background (e.g., when the object is not on a white background);

References
- Wang, Y.; Jin, G.; Shi, B.; Liu, Z. Empirical models for measuring the leaf area and leaf mass across growing periods in broadleaf species with two life histories. Ecol. Indic. 2019, 102, 289–301. [Google Scholar] [CrossRef]
- Koyama, K.; Kikuzawa, K. Is whole-plant photosynthetic rate proportional to leaf area? A test of scalings and a logistic equation by leaf demography census. Am. Nat. 2009, 173, 640–649. [Google Scholar] [CrossRef]
- Koyama, K.; Kikuzawa, K. Geometrical similarity analysis of photosynthetic light response curves, light saturation and light use efficiency. Oecologia 2010, 164, 53–63. [Google Scholar] [CrossRef]
- Liu, Y.; Liu, H.; Baastrup-Spohr, L.; Li, Z.; Li, W.; Pan, J.; Cao, Y. Allometric relationships between leaf and petiole traits across 31 floating-leaved plants reveal a different adaptation pattern from terrestrial plants. Ann. Bot. 2023, 131, 545–552. [Google Scholar] [CrossRef]
- Okamoto, A.; Koyama, K.; Bhusal, N. Diurnal change of the photosynthetic light-response curve of buckbean (Menyanthes trifoliata), an emergent aquatic plant. Plants 2022, 11, 174. [Google Scholar] [CrossRef]
- Wang, M.; Mori, S.; Kurosawa, Y.; Ferrio, J.P.; Yamaji, K.; Koyama, K. Consistent scaling of whole-shoot respiration between Moso bamboo (Phyllostachys pubescens) and trees. J. Plant Res. 2021, 134, 989–997. [Google Scholar] [CrossRef]
- Kurosawa, Y.; Mori, S.; Wang, M.; Ferrio, J.P.; Yamaji, K.; Koyama, K.; Haruma, T.; Doyama, K. Initial burst of root development with decreasing respiratory carbon cost in Fagus crenata Blume seedlings. Plant Spec. Biol. 2021, 36, 146–156. [Google Scholar] [CrossRef]
- Kurosawa, Y.; Mori, S.; Wang, M.; Pedro Ferrio, J.; Nishizono, T.; Yamaji, K.; Koyama, K.; Haruma, T.; Doyama, K. Ontogenetic changes in root and shoot respiration, fresh mass and surface area of Fagus crenata. Ann. Bot. 2023, 131, 313–322. [Google Scholar] [CrossRef] [PubMed]
- Oikawa, S. Supra-optimal leaf area index of a temperate liana Pueraria lobata for competition with Solidago altissima at the expense of canopy photosynthesis. Tree Physiol. 2022, 42, 2446–2453. [Google Scholar] [CrossRef]
- Koyama, K.; Shirakawa, H.; Kikuzawa, K. Redeployment of shoots into better-lit positions within the crowns of saplings of five species with different growth patterns. Forests 2020, 11, 1301. [Google Scholar] [CrossRef]
- Iwabe, R.; Koyama, K.; Komamura, R. Shade avoidance and light foraging of a clonal woody species, Pachysandra terminalis. Plants 2021, 10, 809. [Google Scholar] [CrossRef]
- Chianucci, F.; Ferrara, C.; Puletti, N. coveR: An R package for processing digital cover photography images to retrieve forest canopy attributes. Trees 2022, 36, 1933–1942. [Google Scholar] [CrossRef]
- Chen, X.; Yang, Y.; Zhang, D.; Li, X.; Gao, Y.; Zhang, L.; Wang, D.; Wang, J.; Wang, J.; Huang, J. Response Mechanism of Leaf Area Index and Main Nutrient Content in Mangrove Supported by Hyperspectral Data. Forests 2023, 14, 754. [Google Scholar] [CrossRef]
- Lin, W.; Yuan, H.; Dong, W.; Zhang, S.; Liu, S.; Wei, N.; Lu, X.; Wei, Z.; Hu, Y.; Dai, Y. Reprocessed MODIS Version 6.1 Leaf Area Index Dataset and Its Evaluation for Land Surface and Climate Modeling. Remote Sens. 2023, 15, 1780. [Google Scholar] [CrossRef]
- Petrík, P.; Zavadilová, I.; Šigut, L.; Kowalska, N.; Petek-Petrik, A.; Szatniewska, J.; Jocher, G.; Pavelka, M. Impact of Environmental Conditions and Seasonality on Ecosystem Transpiration and Evapotranspiration Partitioning (T/ET Ratio) of Pure European Beech Forest. Water 2022, 14, 3015. [Google Scholar] [CrossRef]
- Hao, S.; Jia, X.; Mu, Y.; Zha, T.; Qin, S.; Liu, P.; Tian, Y.; Qi, J.; Zhao, H.; Li, X. Canopy greenness, atmospheric aridity, and large rain events jointly regulate evapotranspiration partitioning in a temperate semiarid shrubland. Agric. For. Meteorol. 2023, 333, 109425. [Google Scholar] [CrossRef]
- Ge, M.; Korrensalo, A.; Laiho, R.; Lohila, A.; Makiranta, P.; Pihlatie, M.; Tuittila, E.-S.; Kohl, L.; Putkinen, A.; Koskinen, M. Plant phenology and species-specific traits control plant CH4 emissions in a northern boreal fen. New Phytol. 2023, 238, 1019–1032. [Google Scholar] [CrossRef]
- Ma, T.; Nan, X.; Wu, R.; Yan, H.; Wu, N.; She, J.; Bao, Z. Quantifying the Impact of Canopy Structural Characteristics on Soil Temperature Variations in Different Bamboo Communities. Atmosphere 2023, 14, 445. [Google Scholar] [CrossRef]
- Manninen, T.; Roujean, J.-L.; Hautecoeur, O.; Riihelä, A.; Lahtinen, P.; Jääskeläinen, E.; Siljamo, N.; Anttila, K.; Sukuvaara, T.; Korhonen, L. Airborne Measurements of Surface Albedo and Leaf Area Index of Snow-Covered Boreal Forest. J. Geophys. Res. Atmos. 2022, 127, e2021JD035376. [Google Scholar] [CrossRef]
- Digrado, A.; Gonzalez-Escobar, E.; Owston, N.; Page, R.; Mohammed, S.B.; Umar, M.L.; Boukar, O.; Ainsworth, E.A.; Carmo-Silva, E. Cowpea leaf width correlates with above ground biomass across diverse environments. Legume Sci. 2022, 4, e144. [Google Scholar] [CrossRef]
- Migicovsky, Z.; Swift, J.F.; Helget, Z.; Klein, L.L.; Ly, A.; Maimaitiyiming, M.; Woodhouse, K.; Fennell, A.; Kwasniewski, M.; Miller, A.J.; et al. Increases in vein length compensate for leaf area lost to lobing in grapevine. Am. J. Bot. 2022, 109, 1063–1073. [Google Scholar] [CrossRef] [PubMed]
- Haghshenas, A.; Emam, Y. Accelerating leaf area measurement using a volumetric approach. Plant Methods 2022, 18, 61. [Google Scholar] [CrossRef]
- Yu, X.; Shi, P.; Schrader, J.; Niklas, K.J. Nondestructive estimation of leaf area for 15 species of vines with different leaf shapes. Am. J. Bot. 2020, 107, 1481–1490. [Google Scholar] [CrossRef] [PubMed]
- Shi, P.-J.; Li, Y.-R.; Niinemets, Ü.; Olson, E.; Schrader, J. Influence of leaf shape on the scaling of leaf surface area and length in bamboo plants. Trees 2021, 35, 709–715. [Google Scholar] [CrossRef]
- Koyama, K.; Smith, D.D. Scaling the leaf length-times-width equation to predict total leaf area of shoots. Ann. Bot. 2022, 130, 215–230. [Google Scholar] [CrossRef]
- Schrader, J.; Shi, P.; Royer, D.L.; Peppe, D.J.; Gallagher, R.V.; Li, Y.; Wang, R.; Wright, I.J. Leaf size estimation based on leaf length, width and shape. Ann. Bot. 2021, 128, 395–406. [Google Scholar] [CrossRef]
- Li, Y.; Niklas, K.J.; Gielis, J.; Niinemets, Ü.; Schrader, J.; Wang, R.; Shi, P. An elliptical blade is not a true ellipse, but a superellipse–Evidence from two Michelia species. J. For. Res. 2021, 33, 1341–1348. [Google Scholar] [CrossRef]
- Pinheiro, A.P.B.; Oliveira, V.d.S.; Santos, K.; Santos, J.S.H.; Santos, G.P.; Silva, J.V.G.; Jardim, A.d.S.; Longue, L.L.; Nunes, S.F.; Azeredo, A.L.R. Estimation leaf area by composite leaves of Canavalia rosea seedlings through linear dimensions from last leaflet. J. Agric. Sci. 2019, 11, 299–308. [Google Scholar] [CrossRef]
- Buzna, C.; Florin, S. Non-destructive method to determining the leaf area in hemp, Cannabis sativa L. Life Sci. Sustain. Dev. 2022, 3, 25–32. [Google Scholar] [CrossRef]
- Kitagawa, H.; Tanimoto, A.; Kubota, T.; Koyama, K.; Alfata, M.N.F. A field experiment on green walls taking into consideration wind flow in the hot-humid climate of Indonesia. IOP Conf. Ser. Earth Environ. Sci. 2019, 294, 012088. [Google Scholar] [CrossRef]
- Huang, L.; Niinemets, Ü.; Ma, J.; Schrader, J.; Wang, R.; Shi, P. Plant age has a minor effect on non-destructive leaf area calculations in Moso Bamboo (Phyllostachys edulis). Symmetry 2021, 13, 369. [Google Scholar] [CrossRef]
- Koyama, K.; Hidaka, Y.; Ushio, M. Dynamic scaling in the growth of a non-branching plant, Cardiocrinum cordatum. PLoS ONE 2012, 7, e45317. [Google Scholar] [CrossRef]
- Stewart, D.W.; Dwyer, L.M. Mathematical characterization of leaf shape and area of maize hybrids. Crop Sci. 1999, 39, 422–427. [Google Scholar] [CrossRef]
- de Souza Oliveira, V.; dos Santos, K.T.H.; de Morais, A.L.; Santos, G.P.; Santos, J.S.H.; Schmildt, O.; Czepak, M.P.; Gontijo, I.; Alexandre, R.S.; Schmildt, E.R. Non-destructive method for estimating the leaf area of pear cv.‘Triunfo’. J. Agric. Sci. 2019, 11, 14–21. [Google Scholar] [CrossRef]
- Teobaldelli, M.; Rouphael, Y.; Gonnella, M.; Buttaro, D.; Rivera, C.M.; Muganu, M.; Colla, G.; Basile, B. Developing a fast and accurate model to estimate allometrically the total shoot leaf area in grapevines. Sci. Hortic. 2020, 259, 108794. [Google Scholar] [CrossRef]
- Sala, F.; Dobrei, A.; Herbei, M.V. Leaf Area Calculation Models for Vines Based on Foliar Descriptors. Plants 2021, 10, 2453. [Google Scholar] [CrossRef]
- Chaudhary, P.; Godara, S.; Cheeran, A.; Chaudhari, A.K. Fast and accurate method for leaf area measurement. Int. J. Comput. Appl. 2012, 49, 22–25. [Google Scholar] [CrossRef]
- Olivoto, T. Lights, camera, pliman! An R package for plant image analysis. Methods Ecol. Evol. 2022, 13, 789–798. [Google Scholar] [CrossRef]
- Pohlmann, V.; Lago, I.; Lopes, S.J.; Martins, J.T.d.S.; Rosa, C.A.d.; Caye, M.; Portalanza, D. Estimation of common bean (Phaseolus vulgaris) leaf area by a non-destructive method. Semin. Cienc. Agrar. 2021, 42, 2163–2180. [Google Scholar] [CrossRef]
- Chiteri, K.O.; Chiranjeevi, S.; Jubery, T.Z.; Rairdin, A.; Dutta, S.; Ganapathysubramanian, B.; Singh, A. Dissecting the genetic architecture of leaf morphology traits in mungbean (Vigna radiata (L.) Wizcek) using genome-wide association study. Plant Phenome J. 2023, 6, e20062. [Google Scholar] [CrossRef]
- Mielewczik, M.; Friedli, M.; Kirchgessner, N.; Walter, A. Diel leaf growth of soybean: A novel method to analyze two-dimensional leaf expansion in high temporal resolution based on a marker tracking approach (Martrack Leaf). Plant Methods 2013, 9, 30. [Google Scholar] [CrossRef] [PubMed]
- Tomé, F.; Jansseune, K.; Saey, B.; Grundy, J.; Vandenbroucke, K.; Hannah, M.A.; Redestig, H. rosettR: Protocol and software for seedling area and growth analysis. Plant Methods 2017, 13, 13. [Google Scholar] [CrossRef] [PubMed]
- Easlon, H.M.; Bloom, A.J. Easy Leaf Area: Automated digital image analysis for rapid and accurate measurement of leaf area. Appl. Plant Sci. 2014, 2, 1400033. [Google Scholar] [CrossRef] [PubMed]
- Wang, Z.; Wang, K.; Yang, F.; Pan, S.; Han, Y. Image segmentation of overlapping leaves based on Chan–Vese model and Sobel operator. Inform. Process. Agric. 2018, 5, 1–10. [Google Scholar] [CrossRef]
- Wang, J.; He, J.; Han, Y.; Ouyang, C.; Li, D. An Adaptive Thresholding algorithm of field leaf image. Comput. Electron. Agric. 2013, 96, 23–39. [Google Scholar] [CrossRef]
- Graham, E.A.; Yuen, E.M.; Robertson, G.F.; Kaiser, W.J.; Hamilton, M.P.; Rundel, P.W. Budburst and leaf area expansion measured with a novel mobile camera system and simple color thresholding. Environ. Exp. Bot. 2009, 65, 238–244. [Google Scholar] [CrossRef]
- Costa, A.P.; Pôças, I.; Cunha, M. Estimating the leaf area of cut roses in different growth stages using image processing and allometrics. Horticulturae 2016, 2, 6. [Google Scholar] [CrossRef]
- Tech, A.R.B.; Silva, A.L.C.d.; Meira, L.A.; Oliveira, M.E.d.; Pereira, L.E.T. Methods of image acquisition and software development for leaf area measurements in pastures. Comput. Electron. Agric. 2018, 153, 278–284. [Google Scholar] [CrossRef]
- Liu, H.; Ma, X.; Tao, M.; Deng, R.; Bangura, K.; Deng, X.; Liu, C.; Qi, L. A Plant Leaf Geometric Parameter Measurement System Based on the Android Platform. Sensors 2019, 19, 1872. [Google Scholar] [CrossRef]
- Zheng, F.; Wang, X.; Ji, J.; Ma, H.; Cui, H.; Shi, Y.; Zhao, S. Synchronous Retrieval of LAI and Cab from UAV Remote Sensing: Development of Optimal Estimation Inversion Framework. Agronomy 2023, 13, 1119. [Google Scholar] [CrossRef]
- Moon, T.; Kim, D.; Kwon, S.; Ahn, T.I.; Son, J.E. Non-destructive monitoring of crop fresh weight and leaf area with a simple formula and a convolutional neural network. Sensors 2022, 22, 7728. [Google Scholar] [CrossRef]
- Rasti, S.; Bleakley, C.J.; Holden, N.M.; Whetton, R.; Langton, D.; O’Hare, G. A survey of high resolution image processing techniques for cereal crop growth monitoring. Inform. Process. Agric. 2022, 9, 300–315. [Google Scholar] [CrossRef]
- Vasseur, F.; Bresson, J.; Wang, G.; Schwab, R.; Weigel, D. Image-based methods for phenotyping growth dynamics and fitness components in Arabidopsis thaliana. Plant Methods 2018, 14, 63. [Google Scholar] [CrossRef]
- De Bei, R.; Fuentes, S.; Gilliham, M.; Tyerman, S.; Edwards, E.; Bianchini, N.; Smith, J.; Collins, C. VitiCanopy: A Free Computer App to Estimate Canopy Vigor and Porosity for Grapevine. Sensors 2016, 16, 585. [Google Scholar] [CrossRef]
- Green, J.M.; Appel, H.; Rehrig, E.M.; Harnsomburana, J.; Chang, J.-F.; Balint-Kurti, P.; Shyu, C.-R. PhenoPhyte: A flexible affordable method to quantify 2D phenotypes from imagery. Plant Methods 2012, 8, 45. [Google Scholar] [CrossRef]
- Hu, Y.; Wang, L.; Xiang, L.; Wu, Q.; Jiang, H. Automatic Non-Destructive Growth Measurement of Leafy Vegetables Based on Kinect. Sensors 2018, 18, 806. [Google Scholar] [CrossRef]
- Kaushalya Madhavi, B.G.; Bhujel, A.; Kim, N.E.; Kim, H.T. Measurement of Overlapping Leaf Area of Ice Plants Using Digital Image Processing Technique. Agriculture 2022, 12, 1321. [Google Scholar] [CrossRef]
- Yamaguchi, T.; Tanaka, Y.; Imachi, Y.; Yamashita, M.; Katsura, K. Feasibility of Combining Deep Learning and RGB Images Obtained by Unmanned Aerial Vehicle for Leaf Area Index Estimation in Rice. Remote Sens. 2021, 13, 84. [Google Scholar] [CrossRef]
- Zhang, Y.; Ta, N.; Guo, S.; Chen, Q.; Zhao, L.; Li, F.; Chang, Q. Combining Spectral and Textural Information from UAV RGB Images for Leaf Area Index Monitoring in Kiwifruit Orchard. Remote Sens. 2022, 14, 1063. [Google Scholar] [CrossRef]
- Nomura, K.; Saito, M.; Kitayama, M.; Goto, Y.; Nagao, K.; Yamasaki, H.; Iwao, T.; Yamazaki, T.; Tada, I.; Kitano, M. Leaf area index estimation of a row-planted eggplant canopy using wide-angle time-lapse photography divided according to view-zenith-angle contours. Agric. For. Meteorol. 2022, 319, 108930. [Google Scholar] [CrossRef]
- Apolo-Apolo, O.E.; Pérez-Ruiz, M.; Martínez-Guanter, J.; Egea, G. A Mixed Data-Based Deep Neural Network to Estimate Leaf Area Index in Wheat Breeding Trials. Agronomy 2020, 10, 175. [Google Scholar] [CrossRef]
- Baar, S.; Kobayashi, Y.; Horie, T.; Sato, K.; Suto, H.; Watanabe, S. Non-destructive Leaf Area Index estimation via guided optical imaging for large scale greenhouse environments. Comput. Electron. Agric. 2022, 197, 106911. [Google Scholar] [CrossRef]
- Nomura, K.; Wada, E.; Saito, M.; Yamasaki, H.; Yasutake, D.; Iwao, T.; Tada, I.; Yamazaki, T.; Kitano, M. Estimation of the Leaf Area Index, Leaf Fresh Weight, and Leaf Length of Chinese Chive (Allium tuberosum) Using Nadir-looking Photography in Combination with Allometric Relationships. HortScience 2022, 57, 777–784. [Google Scholar] [CrossRef]
- Cerutti, G.; Tougne, L.; Mille, J.; Vacavant, A.; Coquin, D. Understanding leaves in natural images—A model-based approach for tree species identification. Comput. Vis. Image Underst. 2013, 117, 1482–1501. [Google Scholar] [CrossRef]
- Tao, M.; Ma, X.; Huang, X.; Liu, C.; Deng, R.; Liang, K.; Qi, L. Smartphone-based detection of leaf color levels in rice plants. Comput. Electron. Agric. 2020, 173, 105431. [Google Scholar] [CrossRef]
- Müller-Linow, M.; Pinto-Espinosa, F.; Scharr, H.; Rascher, U. The leaf angle distribution of natural plant populations: Assessing the canopy with a novel software tool. Plant Methods 2015, 11, 11. [Google Scholar] [CrossRef]
- Fleck, S.; Niinemets, U.; Cescatti, A.; Tenhunen, J.D. Three-dimensional lamina architecture alters light-harvesting efficiency in Fagus: A leaf-scale analysis. Tree Physiol. 2003, 23, 577–589. [Google Scholar] [CrossRef]
- Deguchi, R.; Koyama, K. Photosynthetic and morphological acclimation to high and low light environments in Petasites japonicus subsp. giganteus. Forests 2020, 11, 1365. [Google Scholar] [CrossRef]
- Hu, Y.; Zhang, H.; Qian, Q.; Lin, G.; Wang, J.; Sun, J.; Li, Y.; Jang, J.-C.; Li, W. The Potential Roles of Unique Leaf Structure for the Adaptation of Rheum tanguticum Maxim. ex Balf. in Qinghai–Tibetan Plateau. Plants 2022, 11, 512. [Google Scholar] [CrossRef]
- Dörken, V.M.; Lepetit, B. Morpho-anatomical and physiological differences between sun and shade leaves in Abies alba Mill. (Pinaceae, Coniferales): A combined approach. Plant Cell Environ. 2018, 41, 1683–1697. [Google Scholar] [CrossRef]
- Song, Y.; Glasbey, C.A.; Polder, G.; van der Heijden, G.W.A.M. Non-destructive automatic leaf area measurements by combining stereo and time-of-flight images. IET Comput. Vis. 2014, 8, 391–403. [Google Scholar] [CrossRef]
- Apelt, F.; Breuer, D.; Nikoloski, Z.; Stitt, M.; Kragler, F. Phytotyping4D: A light-field imaging system for non-invasive and accurate monitoring of spatio-temporal plant growth. Plant J. 2015, 82, 693–706. [Google Scholar] [CrossRef]
- Nguyen, T.T.; Slaughter, D.C.; Max, N.; Maloof, J.N.; Sinha, N. Structured Light-Based 3D Reconstruction System for Plants. Sensors 2015, 15, 18587–18612. [Google Scholar] [CrossRef]
- Syed, T.N.; Jizhan, L.; Xin, Z.; Shengyi, Z.; Yan, Y.; Mohamed, S.H.A.; Lakhiar, I.A. Seedling-lump integrated non-destructive monitoring for automatic transplanting with Intel RealSense depth camera. Art. Intell. Agric. 2019, 3, 18–32. [Google Scholar] [CrossRef]
- Paulus, S.; Behmann, J.; Mahlein, A.-K.; Plümer, L.; Kuhlmann, H. Low-Cost 3D Systems: Suitable Tools for Plant Phenotyping. Sensors 2014, 14, 3001–3018. [Google Scholar] [CrossRef] [PubMed]
- Vázquez-Arellano, M.; Reiser, D.; Paraforos, D.; Garrido-Izard, M.; Griepentrog, H. Leaf Area Estimation of Reconstructed Maize Plants Using a Time-of-Flight Camera Based on Different Scan Directions. Robotics 2018, 7, 63. [Google Scholar] [CrossRef]
- Yau, W.K.; Ng, O.-E.; Lee, S.W. Portable device for contactless, non-destructive and in situ outdoor individual leaf area measurement. Comput. Electron. Agric. 2021, 187, 106278. [Google Scholar] [CrossRef]
- Tu, L.-F.; Peng, Q.; Li, C.-S.; Zhang, A. 2D in situ method for measuring plant leaf area with camera correction and background color calibration. Sci. Program. 2021, 2021, 6650099. [Google Scholar] [CrossRef]
- Siswantoro, J.; Artadana, I.B.M.; Siswantoro, M.Z.F.N. Leaf geometric properties measurement using computer vision system based on camera parameters. AIP Conf. Proc. 2022, 2470, 050008. [Google Scholar] [CrossRef]
- Koyama, K.; Masuda, T. The arrangement of lateral veins along the midvein of leaves is not related to leaf phyllotaxis. Sci. Rep. 2018, 8, 16417. [Google Scholar] [CrossRef]
- Schneider, C.A.; Rasband, W.S.; Eliceiri, K.W. NIH Image to ImageJ: 25 years of image analysis. Nat. Methods 2012, 9, 671–675. [Google Scholar] [CrossRef]
- R Core Team. R: A Language and Environment for Statistical Computing; R Foundation for Statistical Computing: Vienna, Austria, 2023. [Google Scholar]
- Wickham, H. ggplot2: Elegant Graphics for Data Analysis; Springer: New York, NY, USA, 2016. [Google Scholar]
- Wilke, C.O. cowplot: Streamlined Plot Theme and Plot Annotations for ‘ggplot2’, R package version 1.1.1; 2020. [Google Scholar]
- Auguie, B. gridExtra: Miscellaneous Functions for “grid” Graphics, R package version 2.3; 2017. [Google Scholar]
- Bylesjö, M.; Segura, V.; Soolanayakanahally, R.Y.; Rae, A.M.; Trygg, J.; Gustafsson, P.; Jansson, S.; Street, N.R. LAMINA: A tool for rapid quantification of leaf size and shape parameters. BMC Plant Biol. 2008, 8, 82. [Google Scholar] [CrossRef]
- Weight, C.; Parnham, D.; Waites, R. Technical Advance: LeafAnalyser: A computational method for rapid and large-scale analyses of leaf shape variation. Plant J. 2008, 53, 578–586. [Google Scholar] [CrossRef]
- Maloof, J.N.; Nozue, K.; Mumbach, M.R.; Palmer, C.M. LeafJ: An ImageJ Plugin for Semi-automated Leaf Shape Measurement. JoVE 2013, 71, e50028. [Google Scholar] [CrossRef]
- Varma, V.; Osuri, A.M. Black Spot: A platform for automated and rapid estimation of leaf area from scanned images. Plant Ecol. 2013, 214, 1529–1534. [Google Scholar] [CrossRef]
- Yu, K.; Reddy, G.V.P.; Schrader, J.; Guo, X.; Li, Y.; Jiao, Y.; Shi, P. A nondestructive method of calculating the wing area of insects. Ecol. Evol. 2022, 12, e8792. [Google Scholar] [CrossRef] [PubMed]


| Code | Species | Common Name | Higher Taxonomy | Order | |
|---|---|---|---|---|---|
| 1. Acpi | Acer pictum Thunb. | Maple | Core eudicots | Sapindales | |
| 2. ArtX | Artemisia sp.*1 | - | Core eudicots | Asterales | |
| 3. Comc | Commelina communis L. | Asiatic dayflower | Monocots | Commelinales | |
| 4. Fasa | Fallopia sachalinensis (F.Schmidt) Ronse Decr. | Giant knotweed | Core eudicots | Caryophyllales | |
| 5. Hoco | Houttuynia cordata Thunb. | Fish mint | Magnoliidae | Piperales | |
| 6. HydX | Hydrocotyle sp. | Water pennyworts | Core eudicots | Apiales | |
| 7. Mgkb | Magnolia kobus DC. | Kobushi magnolia | Magnoliidae | Magnoliales | |
| 8. Oxco | Oxalis corniculata L.*2 | Creeping woodsorrel | Core eudicots | Oxalidales | |
| 9. PlaX | Platanus sp. *3 | Plane tree | Basal eudicots | Proteales | |
| 10. Poav | Polygonum aviculare L. | Common knotgrass | Core eudicots | Caryophyllales | |
| 11. Prsa | Prunus sargentii Rehder | Sargent’s cherry | Core eudicots | Rosales | |
| 12. Trre | Trifolium repens L. | White clover | Core eudicots | Fabales | |
| Code | T: Tree H: Herb | Simple or Compound | Form of Leaf (or Leaflet) | Area of Individual Leaf or Leaflet (Range) (cm2) | Sample Size *4 |
| 1. Acpi | T | Simple | Lobed, protruding *5 | 3.601–112.561 | 60 |
| 2. ArtX | H | Simple | Highly dissected | 0.969–28.963 | 55 |
| 3. Comc | H | Simple | Parallel vein | 0.633–29.126 | 55 |
| 4. Fasa | H | Simple | Large, protruding | 74.491–236.997 | 5 |
| 5. Hoco | H | Simple | Entire, cordate | 2.205–80.546 | 60 |
| 6. HydX | H | Simple | Lobed, toothed | 0.167–11.507 | 56 |
| 7. Mgkb | T | Simple | Entire, obovate | 45.900–82.608 | 5 |
| 8. Oxco | H | Compound | Very small, obcordate | 0.073–1.336 | 60 |
| 9. PlaX | T | Simple | Large, lobed, protruding | 4.312–343.651 | 60 |
| 10. Poav | H | Simple | Very small | 0.0584–2.033 | 55 |
| 11. Prsa | T | Simple | Toothed | 31.653–63.937 | 5 |
| 12. Trre | H | Compound | Serrulate | 0.209–5.057 | 60 |
Disclaimer/Publisher’s Note: The statements, opinions and data contained in all publications are solely those of the individual author(s) and contributor(s) and not of MDPI and/or the editor(s). MDPI and/or the editor(s) disclaim responsibility for any injury to people or property resulting from any ideas, methods, instructions or products referred to in the content. |
© 2023 by the author. Licensee MDPI, Basel, Switzerland. This article is an open access article distributed under the terms and conditions of the Creative Commons Attribution (CC BY) license (https://creativecommons.org/licenses/by/4.0/).
Share and Cite
Koyama, K. Leaf Area Estimation by Photographing Leaves Sandwiched between Transparent Clear File Folder Sheets. Horticulturae 2023, 9, 709. https://doi.org/10.3390/horticulturae9060709
Koyama K. Leaf Area Estimation by Photographing Leaves Sandwiched between Transparent Clear File Folder Sheets. Horticulturae. 2023; 9(6):709. https://doi.org/10.3390/horticulturae9060709
Chicago/Turabian StyleKoyama, Kohei. 2023. "Leaf Area Estimation by Photographing Leaves Sandwiched between Transparent Clear File Folder Sheets" Horticulturae 9, no. 6: 709. https://doi.org/10.3390/horticulturae9060709
APA StyleKoyama, K. (2023). Leaf Area Estimation by Photographing Leaves Sandwiched between Transparent Clear File Folder Sheets. Horticulturae, 9(6), 709. https://doi.org/10.3390/horticulturae9060709