Abstract
Regulating plant factories is crucial for optimal plant growth and yield. Although LEDs (light-emitting diode) are called cold light sources, more than 80% of the heat is still emitted into the surrounding environment. In high-density vertical agricultural facilities, the crop canopy is positioned close to the light source to maximize light absorption and promote plant growth. LED heat dissipation can cause disturbances in the microclimate of crop canopies, which can lead to tip burn disease in plant crops and result in economic losses for plant factories. CFD (computational fluid dynamics) is used as the main technical tool to simulate and optimize the environment of agricultural facilities. This study utilized Star-ccm+ to simulate the microclimate of plant factories under different light treatments. Uniformity coefficient UI and disturbance coefficient θ were proposed to quantitatively analyze LED heat dissipation’s impact on microclimate. In the T5 treatment group, which had a PPFD of 350 μmol/m2·s in the growth zone and 250 μmol/m2·s in the seedling zone, the relative humidity (RH), airflow, and temperature uniformity coefficients UI were 0.6111, 0.3259, and 0.5354, respectively, with corresponding disturbance coefficients θ of 0.0932, 0.1636, and 0.1533. This study clarifies the degree of perturbation caused by LED heat dissipation on microclimate, providing a theoretical basis for regulating plant factory light and promoting sustainability.
1. Introduction
Food safety is a growing concern due to environmental pollution and decreasing cultivation land [,,]. Artificial light plant factories allow for sustainable agriculture by providing a controlled environment with regulated lighting, temperature, and humidity, allowing for year-round plant production regardless of external weather conditions [,]. Precisely regulating environmental factors such as temperature, humidity, airflow, and light levels is crucial for creating ideal conditions for plant growth in artificial light plant factories []. Crops have a strong coupling with environmental factors such as light, temperature, humidity, and airflow during photosynthesis. These factors affect the rate of photosynthesis and plant growth. The microclimate around plants is in constant flux due to changes in these factors, but it remains in a dynamic equilibrium state as plants adapt to these changes through physiological responses [,]. Stagnant airflow around crop canopies can limit plant growth potential and cause irregular microclimates within the crop canopy, reducing plant quality and potentially leading to plant tip burn disease. Adequate air movement is necessary to optimize climate control with minimal negative effects on plant growth, as observed by Bake et al. [,,,]. Domestic and foreign scholars explored the environmental factors of plant factories mostly in airflow fields, but less often in a microclimate considering plant obstruction and light transition heat dissipation [,]. Light-emitting diodes (LEDs) are a recent lighting technology that has entered the arena of artificial agricultural lighting. The majority of heat emitted from LEDs is conductive heat, which must be directed away from the lamp and the heat exchange with the surrounding air. The direct radiation of heat by LEDs is not seen, but LEDs do produce heat that has to be effectively removed from the system for better functionality []. The electric energy of an artificial light source put into the plant factory is converted into light energy PAR (400–700 nm), sensible heat QSL, and net long-wave radiation L []. LEDs have achieved an efficiency of 38% (red) to 50% (blue), converting electrical energy to photons [,,]. Graamans et al. developed a crop transpiration model to study the relationship between sensible and latent heat exchange and corresponding vapor flux in lettuce production within closed systems using LED as the only heat source. The model considered the plant’s transpiration, crop canopy microclimate, and thermal buoyancy of the air caused by the LED as a heat source, which could aggravate uneven microclimates in the crop canopy []. Fang H. et al. used a computational fluid dynamics (CFD) model to analyze the airflow pattern on the crop canopy in a single cultivation bed under different ventilation modes, by inputting LED heat dissipation parameters into the simulation model []. Taking the heat dissipation of the LED light source into account is important for accurately analyzing the energy balance equation of the crop canopy, which can help researchers to better understand the microclimate environment of the crop canopy and optimize growth conditions for crops []. Plant factories have a high indoor planting density and excessive lighting can cause an uneven microclimate if air conditioning-fresh air system design is improper [,]. Kitaya et al. found that a uniform and stable airflow field can effectively improve plant tip burn by promoting plant transpiration [,]. Zhang Y et al. evaluated five different air distribution system designs for indoor workshops and found that arranging the inlet and outlet alternately in rows can eliminate heat dissipation in lighting, but it does not improve average airflow velocity or uniformity []. Benyamin et al. used the RNG turbulent model to simulate the airflow and temperature in each cultivation area, taking into account the influence of obstacles and turbulence within the computational domain. They also introduced an objective uniformity coefficient to assess the uniformity of each cultivation area []. Some scholars have overlooked the impact of LED heat dissipation on plant and crop canopy microclimate uniformity, believing that LEDs are cold light sources that do not emit heat. However, recent research has shown that LED heat dissipation can disrupt the microclimate uniformity of plant factories. Although there have been simulation analyses and actual monitoring of plant factories, no one has yet quantitatively analyzed the microclimate disturbance caused by LED heat dissipation in the crop canopy [,]. Computational fluid dynamics (CFD) is an effective tool for simulating physical complex phenomena with reasonable accuracy and analyzing environmental uniformity in controlled environments [,,]. The aim of this study is to examine how LED heat dissipation affects canopy airflow based on the energy balance equation for the crop canopy microclimate. By quantifying the perturbation of LED heat dissipation on the crop canopy airflow field, this study provides essential insights for designing artificial light source arrangements in plant factories.
2. Materials and Methods
2.1. The Plant Factory
The Jilin University Plant Factory, located inside a building, served as the basis for this study. However, it should be noted that this facility does not account for heat exchange caused by solar thermal radiation.
2.2. Experimental Measurements and Data Analysis
This study selected temperature, airflow, and relative humidity (RH) as indicators for the crop canopy microclimate environment. To measure the temperature and indoor relative humidity in the plant factory, an indoor air quality meter IAQ-CALC 7525 was used with a retention rate of 2%. For measuring microclimate airflow, a heat wire handheld anemometer RA620 with an accuracy of 1% was employed.
2.3. Theory
2.3.1. Crop Canopy Microclimate Model
Farquhar et al. proposed a biochemical model for estimating the net photosynthetic rate, which resolved the relationship between photosynthesis and transpiration. This model was then transformed from the leaf scale to the canopy scale by assuming the basic principles of the “large leaf” model [,]. The Penman–Monteith (P–M) model is a widely used evapotranspiration model that provides a simple method for reflecting the distribution of light energy intercepted by plants between sensible and latent heat. This model combines equations for both energy and mass transfer from the canopy. The parameters of stomatal resistance and aerodynamic resistance in the P-M model are typically estimated through their relationships with specific environmental variables within the canopy, as they are difficult to measure directly. In plant factories, the microclimate of a canopy, which includes LED radiation, air temperature, and air humidity has been found to be related to stomatal resistance [,].
Crop Canopy Microclimate Energy Balance
Plant factories are enclosed systems that rely on forced ventilation through air conditioning-fresh air systems. Crops grown inside building structures are isolated from mass heat exchange with the external environment due to insulated walls. Therefore, the microclimate of the crop canopy inside a plant factory is crucial in determining the quality of plant growth [,]. When constructing a model based on the interaction between the crop canopy and microclimate, it is important to treat the crop canopy as a closed, structurally homogeneous, and stable system. This enables a specific description of the crop canopy microclimate using meteorological data such as temperature, humidity, and wind speed. Environmental factors such as humidity, temperature, airflow, and light are coupled with the crop canopy [,]. During the light period, crops undergo photosynthetic physiological activities where water vapor from transpiration serves as the source of humidity in the crop canopy, and the LED light source is the only source of heat and light [,]. As shown in Figure 1, we established an energy balance equation for each environmental factor of the crop canopy microclimate. WL refers to the power consumption of the LED light source, while WC refers to the power consumption of other facilities such as air conditioning. The calculations of sensible heat and heat dissipation caused by LED heat dissipation are the basis for subsequent simulations.
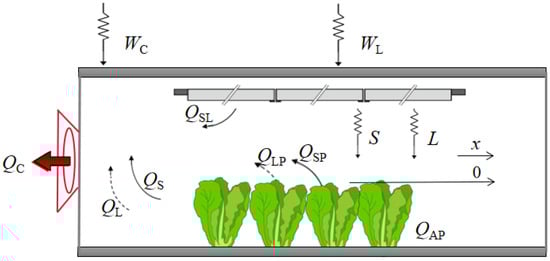
Figure 1.
Crop canopy microclimate energy balance.
In this study, there are no additional volumetric heat sources or sinks besides the LED lights. For the crop canopy, the LED light source electrical energy is converted into light energy S (Par, wavelength 400–700 nm), sensible heat QSL, and net long-wave radiant energy L, the energy balance for the crop canopy microclimate is represented by the following equation:
where QLP is the latent heat exchange between the crop canopy and surrounding air, while QSP refers to the sensible heat exchange between the crop canopy and surrounding air. A portion of the sensible heat and long-wave radiant energy transferred to the crop canopy and cultivation frame is consumed as latent heat, serving as a heat source for transpiration dissipation. Compared to latent heat, sensible heat increases with an increasing transpiration rate. The transpiration rate of plants is strongly coupled with the microclimate of the crop canopy and the size of the plant’s leaves. Most of the WL is expelled from the air conditioning system as sensible heat QC outside the closed system, while some of it is absorbed by the plant as chemical energy QAP.
Plant Crop Energy Balance
In order to maintain the energy balance of the crop canopy, the latent and sensible heat entering the crop must be balanced with other forms of effective energy. Ball et al. proposed an empirical model based on the principle of electrical analogy for estimating net photosynthetic rate and stomatal conductivity. This model resolves the relationship between photosynthesis, coupled with transpiration, and stomatal conductance [].The core of the crop microclimate balance equation involves obtaining sensible heat exchange using the aerodynamic method, followed by calculating net radiation using a suitable equation. The residual term of the heat balance equation is then used to calculate latent heat exchange, which leads to total water evaporation. The energy balance equation for a transpiring plant surface involves net radiation Rnet, sensible heat exchange H, and latent heat exchange , and can be represented by the following equation:
The sensible heat flux H can be expressed as the difference in temperature between the surrounding climate and the crop canopy using the following equation:
To calculate latent heat exchange, it is necessary to determine the transfer of vapor. This transfer can be represented by the following equation:
where Ta is air temperature of microclimate, K; Tcrop is temperature of crop canopy, K; is air density, kg/m3; is atmospheric pressure heat ratio, J/kg·K; is the saturated water content of the air at canopy, g/kg; is the air water vapor content, g/kg; Lv is the latent heat of vaporization of water, J/kg; ra is the aerodynamic resistance, s/m; rs is the leaf stomatal resistance, s/m. The aerodynamic drag for the crop canopy is related to the plant’s leaf area index LAI, which is a dimensionless quantity.
The entry of water from the crop into the plant microclimate through transpiration is subject to crop canopy stomatal resistance as well as aerodynamic resistance , both kinds of resistance are described separately below:
where is the characteristic length of the leaf, m; is the interior air speed, m/s; is the air thermal conductivity, W/m·K.
where Ti refers to interior air temperature (K). The minimum stomatal resistance is 150 s/m; is 10 hPa [].
2.3.2. CFD Theory
CFD Control Equation
The CFD solver (Star-ccm+) was used for simulations. The following generalized governing equation, continuity, momentum, and energy equations were applied to predict variables such as velocity, pressure, and temperature. The realizable turbulence model is applied to our model. The time-averaged governing equations of continuity, momentum, and energy can be derived in a three-dimensional cartesian coordinate system as the following:
Crop Canopy Parameters
Therefore, the simulation of plant factory fluid must account for plant occlusion on airflow. After establishing plants as porous media, the resistance coefficients in all directions can be artificially defined to replace the resistance of solids to fluids in porous media, i.e., a momentum sink related to velocity is added, and its expression formula is:
where Si is the source term of the momentum equation in the i (x,y,z) direction and v is the velocity value; the air density is 1.205 kg/m3 and the air viscosity μ is 17.9 × 10⁻⁶ Pa·s. D and are specified coefficient matrices: D represents the coefficient for the viscous loss term, and represents the coefficient for the inertial loss term.
For the plant crop canopy, this momentum source Si can be rewritten as an equation related to the plant leaf area density:
where LAI is the leaf area index; U is the air speed; is the drag coefficient of the vegetation set to = 0.32.
LED Simulation Model and Boundary Conditions
The experiment was conducted at Jilin University’s artificial light plant factory, which had dimensions of 5575 mm × 3950 mm × 3175 mm, as shown in Figure 2. The cultivation rack in the plant factory was a steel frame structure with an LED light source placed at the top. A simulation of the crop canopy microclimate model is based on heat transfer between the crop and surrounding airflow. Since the plant factory is located in an indoor building, the plant factory walls are set to be insulated. The plant factory boundary conditions are shown in Table 1. The impact of LED heat dissipation on the crop canopy microclimate was quantitatively analyzed under different lighting conditions for both seedling and growing areas, as illustrated in Table 2.
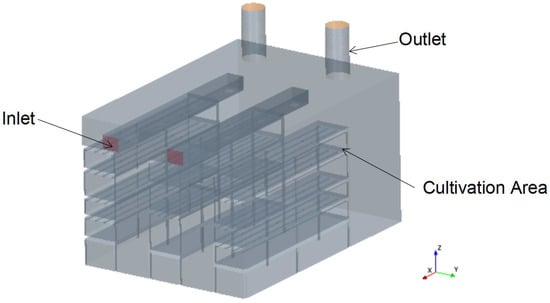
Figure 2.
Three-dimensional of plant factory.

Table 1.
Boundary conditions of CFD simulations for crop canopy microclimate.
Table 2.
LED lighting treatments.
2.4. Monitoring Point Layout
The cultivation area of the plant factory covers the seedling stage and growth stage, and there are differences in the distance between the monitoring points in different areas and the surface height of the cultivation rack. The numbering of cultivation racks and the positions of monitoring points are shown in Figure 3. The monitoring point in the seedling area is positioned 10 cm above the height of the cultivation rack, while the monitoring point in the crop cultivation area during the growth stage is located 20 cm above the height of the cultivation rack.
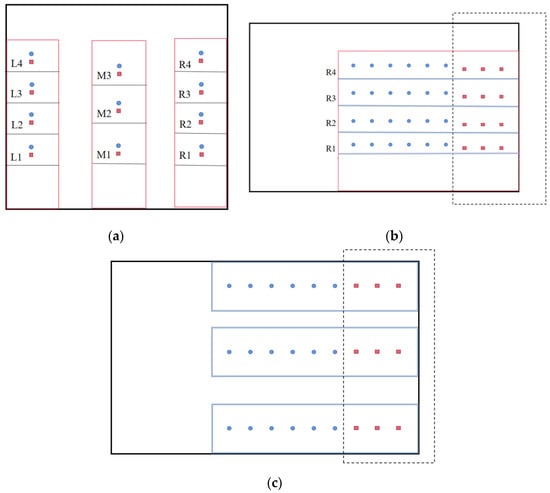
Figure 3.
Monitoring point arrangement: (a) monitoring point layout front view; (b) monitor point layout side view; (c) monitoring point layout top view. The dotted line represents the seedling area, while the remaining cultivated area is the growth stage cultivation area.
2.5. Data Analysis
Previous studies have indicated that maintaining a uniform and stable microclimate is crucial for crop growth in plant factories. However, LED heat dissipation can increase the instability of the crop canopy microclimate. Therefore, this study established comfort zone thresholds for each environmental factor of the crop canopy microclimate based on previous research. In the seedling cultivation area, the air velocity should fall within the range of 0.1–0.5 m/s, the temperature should be maintained at 20 ± 1 °C, and the relative humidity should be between 80–90%. In the growth stage cultivation area, the air velocity range should be 1.1–1.4 m/s, the temperature should be maintained at 20 ± 1 °C, and the relative humidity (RH) at 50–55% [,]. This study analyzed the uniformity of airflow, temperature, and RH of the crop canopy microclimate and defined the uniformity coefficient UI of physical indicators of the crop canopy microclimate under each treatment as follows:
where represents the percentage of suitable growth threshold intervals in each cultivation frame, i.e., growth comfort zone as a percentage of the area of the cultivation frame. The environmental factors can be represented as temperature (T), relative humidity (RH), and airflow (V). UI represents the uniformity of the proportion of the suitable growth zone in the cultivation frame, is the standard deviation of the percentage of the suitable growth zone for an environmental factor in microclimate, and is the mean value of the percentage of the suitable growth zone for an environmental factor in microclimate. is the percentage of microclimate environmental factors of the suitable growth zone for cultivation frame j. To express the quantitative disturbance of LED heat dissipation on the microclimate, a quantitative disturbance coefficient θ was defined as follows:
where is the quantitative disturbance of LED heat dissipation in the case i for the crop canopy microclimate comfort zone , where can be percentage of suitable growth zone for temperature, relative humidity, or airflow; represents the percentage of suitable growth zone for the crop canopy on the j-th cultivation frame under lighting treatment i; and is the percentage of suitable growth zone of the j-th cultivation frame under the control CK lighting treatment.
To convert the wet air humidity ratio (W) to relative humidity (RH) at standard atmospheric pressure and 20 °C, we can use the following equation:
where is the saturation vapor pressure at the given temperature, and is the atmospheric pressure.
where e represents the partial pressure of water vapor in the air. Using data for standard atmospheric pressure (101,325 Pa) and 20 °C, is 2339 Pa.
3. Results
3.1. Relative Humidity (RH) Fields
Figure 4 shows that the heat dissipation of LED lights has a significant impact on the humidity field of the plant factory, leading to notable variations under different working conditions. The results indicate that the humidity field of the plant varied significantly depending on the operational parameters. As shown in Figure 5, when the LED light source was turned on and the PPFD increased, the uniformity index of relative humidity in the plant factory decreased significantly. The relative humidity disturbance coefficient first decreased and then stabilized under the T4 treatment group (LEDS is 200 μmol/m2·s, LEDG is 300 μmol/m2·s) and T5 treatment group (LEDS is 250 μmol/m2·s, LEDG is 350 μmol/m2·s). The disturbance coefficient was 0.087 for the T4 treatment group and 0.093 for T5 treatment group.
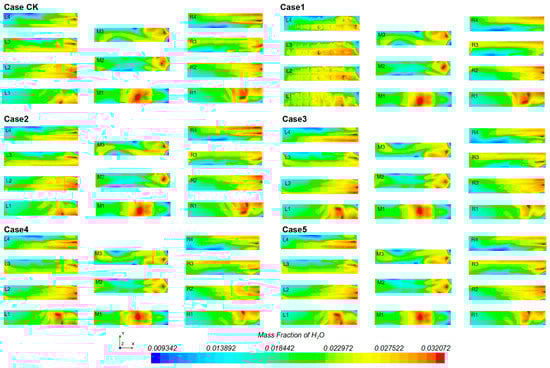
Figure 4.
Wet air humidity ratio under different treatments.
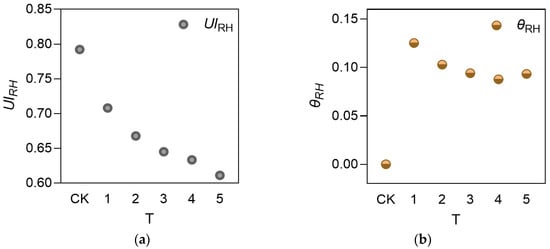
Figure 5.
Relative humidity (RH): (a) uniformity index of relative humidity; (b) disturbance coefficient of relative humidity. T represents different treatment groups, same for the following.
3.2. Airflow Fields
As shown in Figure 6, the simulation results demonstrate the impact of LED heat dissipation on the airflow dynamics in the plant growth environment under various conditions. The findings revealed that the impact of LED heat dissipation on airflow in plant factories was significant, as shown in Figure 7. Specifically, as the PPFD increased, the uniformity coefficient of airflow decreased notably, and the disturbance coefficient increased significantly. Under the T5 treatment group (LEDS is 250 μmol/m2·s, LEDG is 350 μmol/m2·s), the uniformity coefficient has been reduced to 0.326 and the disturbance coefficient has reached 0.164.
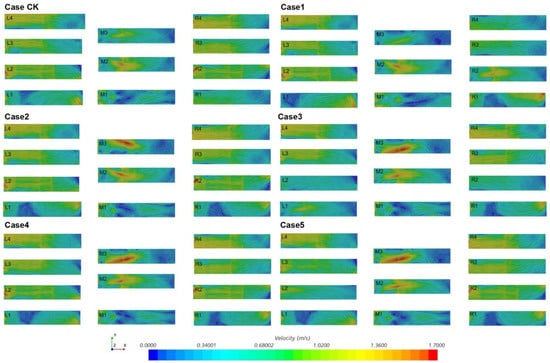
Figure 6.
Airflow fields under different treatments.
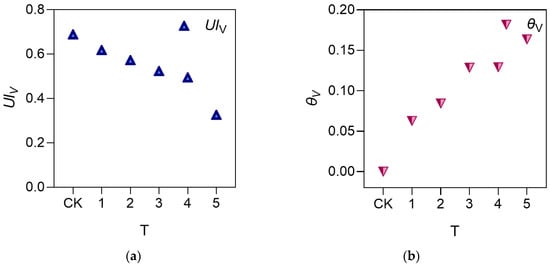
Figure 7.
Airflow: (a) uniformity index of airflow; (b) disturbance coefficient of airflow.
3.3. Temperature Fields
The impact of LED heat dissipation on the temperature field of plants under various operating conditions is illustrated in Figure 8. As shown in Figure 9, as the PPFD of the treatment group increases, the coefficients of temperature field non-uniformity and disturbance reach their extreme values in the T5 treatment group (LEDS is 250 μmol/m2·s, LEDG is 350 μmol/m2·s). The coefficient of uniformity decreased to 0.5354 while the coefficient of disturbance increased to 0.1533.
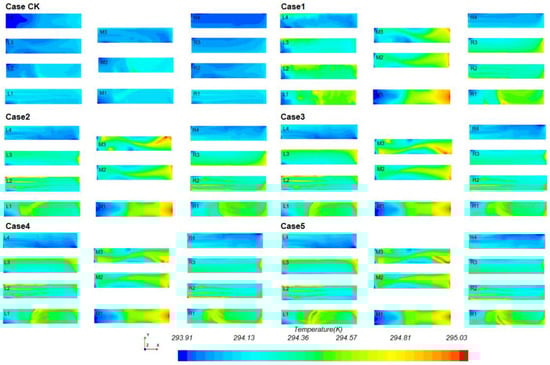
Figure 8.
Temperature fields under different treatments.
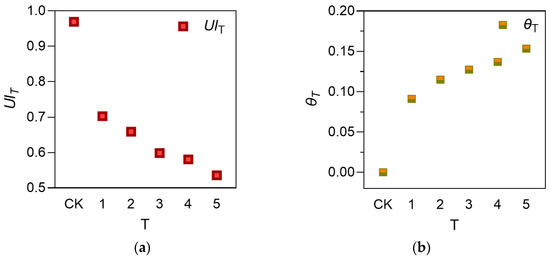
Figure 9.
Temperature: (a) uniformity index of temperature; (b) disturbance coefficient of temperature.
3.4. Simulation Model Validation
To verify the accuracy of the simulation models for humidity, airflow, and temperature environments used in this study, the mean square error (RMSE) was calculated by comparing the simulated values with actual measured values at monitoring points under each working condition. As shown in Figure 10, the mean RMSE for the humidity field was 9.21, for the airflow field was 5.39, and for the temperature field was 5.86. Based on these RMSE values, the regression results of each model in this study are reliable and accurate.
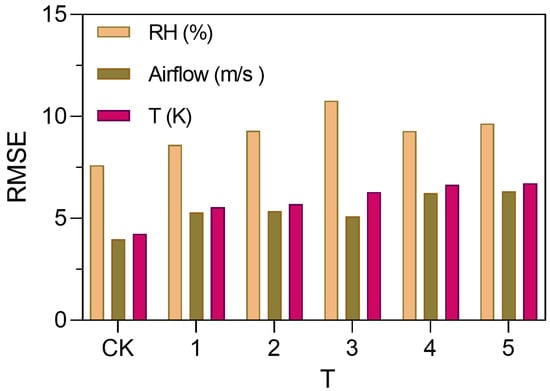
Figure 10.
Simulation model validation.
4. Discussion
With the increasing popularity of plant factories in recent years, more and more researchers considered the issue of LED light source heat dissipation during experimental production []. Seungmi et al. aimed to minimize differences in growing environment by measuring airflow distribution and environmental factors such as temperature, humidity, and CO2 at each level of the planting lots within a fully artificial plant factory. They achieved this by controlling various combinations of devices such as air conditioning and fans for proper airflow []. However, scholars have only considered LED heat dissipation and set it as a boundary condition in CFD simulation boundary conditions. Nevertheless, there has been a lack of quantitative analysis regarding the extent of crop canopy microclimate perturbation resulting from LED heat dissipation []. In this study, we proposed a uniformity coefficient UI and a disturbance coefficient θ to quantitatively analyze the effects of LED heat dissipation on the microclimate of plant factories in the research center. To maximize the simulation and detection of microclimate changes in the plant factory, we established 33 monitoring points in each cultivation frame. Moreover, to account for mass heat exchange between plants and the surrounding microclimate environment, as well as the mixed planting of seedlings at different ages within the plant factory, we conducted this study.
Regarding the impact of LED heat dissipation on the microclimate of crop canopies in various environmental physical fields, it was found that with the increase of PPFD, the disturbance of LED heat dissipation on the microclimate is not simply proportional to a linear change. Tip burn in plant factory crops was mainly caused by humidity, which plays a crucial role in determining crop quality. As LED light sources increased, the uniformity coefficient of the humidity field showed a significant decreasing trend. The T5 treatment group had a decreased uniformity coefficient of 0.6111, which was caused by the enhancement in PPFD. This increase in PPFD led to a significant perturbation of LED heat dissipation on the humidity field, but eventually resulted in a smooth state under the T4 treatment group with a disturbance coefficient of 0.0877. The changes in crop transpiration with an increase in PPFD may have contributed to the complexity of the humidity field inside the plant when coupled with crops and microclimate factors.
The increased heat dissipation from LED light sources caused the surrounding air to float upward, disturbing plant airflow. Experimental results showed that as PPFD increased, the airflow field uniformity coefficient decreased linearly, and the disturbance coefficient increased linearly. The group at T5 had an airflow uniformity coefficient of 0.3259 and a disturbance coefficient of 0.1636. Although the airflow field is the main means of regulating humidity, the uniformity and disturbance coefficients of both fields did not exhibit significant non-linearity. This could be due to enhanced transpiration caused by the increased light, which changed the crop canopy microclimate humidity field. The study highlights the complex coupling relationship between crop canopy and microclimate in plant factories.
Temperature increases and airflow stagnation caused by the large temperature variations between cultivation beds and close irradiation from artificial lighting in vertical-type plant factories are chief factors contributing to the deterioration of crop quality and growth []. Under the control group (CK) condition, when the LED light source is turned off, the uniformity coefficient of the temperature field in the plant factory is 0.9693. With the opening of the light source and the increase of PPFD, the uniformity coefficient of crop canopy temperature decreases significantly, and the disturbance coefficient increases significantly. In the T5 treatment group, where the PPFD in the seedling area is 250 μmol/m2·s and the PPFD in the growth area is 350 μmol/m2·s, the temperature uniformity coefficient is 0.5354 and the disturbance coefficient is 0.1533.
5. Conclusions
In this study, two coefficient values for uniformity coefficient UI and disturbance coefficient were proposed to analyze the effect of LED heat dissipation on crop microclimate. Simulation was conducted under six LED lighting treatments to observe changes in crop canopy microclimate. Results showed that as PPFD increased, humidity, airflow, and temperature uniformity significantly decreased while the disturbance coefficient significantly increased. In the T5 treatment group, which had a PPFD of 350 μmol/m2·s in the growth zone and 250 μmol/m2·s in the seedling zone, the relative humidity (RH), airflow, and temperature uniformity coefficients UI were 0.6111, 0.3259, and 0.5354, respectively, with corresponding disturbance coefficients θ of 0.0932, 0.1636, and 0.1533. Overall, this study concluded that LED heat dissipation has a significant impact on plant microclimate, particularly on airflow and relative humidity. Based on the findings of this study, the regulation of lighting modes in plant factories should consider the photosynthetic physiological needs of different stages of plants. Appropriate lighting can better avoid excessive heat dissipation of LED light sources and reduce the electricity cost of removing these heat losses. These findings provide a theoretical basis for regulating the selection and arrangement of LED light sources in plant factories.
Author Contributions
Conceptualization, H.Y. (Haibo Yu) and H.Y. (Haiye Yu); methodology, B.Z.; software, M.C.; validation, Y.L., H.Y. (Haibo Yu) and Y.S.; formal analysis, H.Y. (Haibo Yu); investigation, B.Z.; resources, H.Y. (Haibo Yu); data curation, H.Y. (Haibo Yu); writing—original draft preparation, H.Y. (Haiye Yu).; writing—review and editing, B.Z.; visualization, H.Y. (Haiye Yu); supervision, H.Y. (Haiye Yu); project administration H.Y. (Haibo Yu) and H.Y. (Haiye Yu); funding acquisition, B.Z. All authors have read and agreed to the published version of the manuscript.
Funding
This research was funded by “Key Research and Development Focus for the 14th Five-Year Plan period: Research and Development of Key Technologies and Devices for Mobile Phenotype Platform’s Active Collaborative Data Collection”, grant number 2022YFD2002305-2 and “Research on Self-regulation Mechanism for Efficient Nitrogen Use in Symbiotic Hydroponically—Grown Vegetables Based on Trophic Niche Differentiation”, grant number 32171913 and “Jiangsu Province and Education Ministry Co-sponsored Synergistic Innovation Center of Modern Agriculture Equipment”, grant number XTCX1006.
Conflicts of Interest
The authors declare no conflict of interest.
Abbreviations
| WC | energy consumption of air conditioning ventilation systems |
| WL | energy consumption of LED lights |
| QSL | heat exchange between light sources and surrounding air |
| S | effective radiation energy for photosynthesis |
| L | net long-wave radiant energy |
| QLP | latent heat exchange between crop canopy and surrounding air |
| QSP | latent heat exchange between plants and the surrounding air |
| QL | latent heat generated within the system. |
| QS | sensible heat generated internally within the system |
| QC | the heat rejected by a heat pump in the form of sensible heat |
| QAP | chemical energy contained in plants |
| Rnet | net radiation |
| H | sensible heat flux |
| λE | latent heat exchange |
| Ta | air temperature of microclimate, K |
| Tcrop | temperature of crop canopy, K |
| ρ | air density, kg/m3 |
| ωcrop | the saturated water content of the air at canopy, g/kg |
| ω | air water vapor content, g/kg |
| cρ | atmospheric pressure heat rati, J/kg·K |
| Lv | latent heat of vaporization of water, J/kg |
| LAI | plant leaf area index |
| ra | aerodynamic resistance, s/m |
| rs | leaf stomatal resistance, s/m |
| Ui | interior air speed, m/s |
| λ | air thermal conductivity, W/m·K |
| μ | air viscosity, 17.9 × 10⁻⁶ Pa·s |
| D | coefficient representing the viscous loss term |
| C2 | coefficient representing the inertial loss term |
| UI | disturbance coefficient |
| θ | uniformity coefficient |
| LEDS | seedling area LED light intensity, 250 μmol/m2·s |
| LEDG | growth area LED light intensity, 250 μmol/m2·s |
| W | wet air quality score |
References
- Ahmad, I.; Ahmad, B.; Boote, K.; Hoogenboom, G. Adaptation strategies for maize production under climate change for semi-arid environments. Eur. J. Agron. 2020, 115, 126040. [Google Scholar] [CrossRef]
- Berquist, J.; Cassidy, N.; Touchie, M.; O’Brien, W.; Fine, J. High-rise residential building ventilation in cold climates: A review of ventilation system types and their impact on measured building performance. Indoor Air 2022, 32, e13158. [Google Scholar] [CrossRef]
- Cagri Tolga, A.; Basar, M. The assessment of a smart system in hydroponic vertical farming via fuzzy MCDM methods. IFS 2021, 42, 1–12. [Google Scholar] [CrossRef]
- Bouhoun Ali, H.; Bournet, P.-E.; Cannavo, P.; Chantoiseau, E. Development of a CFD crop submodel for simulating microclimate and transpiration of ornamental plants grown in a greenhouse under water restriction. Comput. Electron. Agric. 2018, 149, 26–40. [Google Scholar] [CrossRef]
- Fatnassi, H.; Poncet, C.; Bazzano, M.M.; Brun, R.; Bertin, N. A numerical simulation of the photovoltaic greenhouse microclimate. Sol. Energy 2015, 120, 575–584. [Google Scholar] [CrossRef]
- Li, K.; Fang, H.; Zou, Z.; Cheng, R. Optimization of rhizosphere cooling airflow for microclimate regulation and its effects on lettuce growth in plant factory. J. Integr. Agric. 2021, 20, 2680–2695. [Google Scholar] [CrossRef]
- Tadj, N.; Bartzanas, T.; Fidaros, D.; Draoui, B.; Kittas, C. Influence of Heating System on Greenhouse Microclimate Distribution. Trans. ASABE 2010, 53, 225–238. [Google Scholar] [CrossRef]
- Xi, C.; Ding, J.; Wang, J.; Feng, Z.; Cao, S.-J. Nature-based solution of greenery configuration design by comprehensive benefit evaluation of microclimate environment and carbon sequestration. Energy Build. 2022, 270, 112264. [Google Scholar] [CrossRef]
- Baek, M.S.; Kim, K.M.; Kwon, S.Y.; Kong, H.; Lim, J.-H. CFD Based Internal Fan Control Simulation for Improvement of Cultivation Environment in Plant Factory. Adv. Sci. Technol. Lett. 2015, 120, 550–553. [Google Scholar] [CrossRef]
- Ahmed, H.A.; Yu-Xin, T.; Qi-Chang, Y. Lettuce plant growth and tipburn occurrence as affected by airflow using a multi-fan system in a plant factory with artificial light. J. Therm. Biol. 2020, 88, 102496. [Google Scholar] [CrossRef]
- Assimakopoulou, A.; Kotsiras, A.; Nifakos, K. Incidence of Lettuce Tipburn as Related to Hydroponic System and Cultivar. J. Plant Nutr. 2013, 36, 1383–1400. [Google Scholar] [CrossRef]
- Borkowski, J.; Dyki, B.; Oskiera, M.; Machlańska, A.; Felczyńska, A. The Prevention of Tipburn on Chinese Cabbage (Brassica rapa L. var. pekinensis (Lour.) Olson) with Foliar Fertilizers and Biostimulators. J. Hortic. Res. 2016, 24, 47–56. [Google Scholar] [CrossRef]
- Wang, Y.; Folta, K.M. Contributions of green light to plant growth and development. Am. J. Bot. 2013, 100, 70–78. [Google Scholar] [CrossRef]
- Tamimi, E.; Kacira, M. Analysis of Climate Uniformity in a Naturally Ventilated Greenhouse Equipped with High Pressure Fogging System Using Computational Fluid Dynamics. Acta Hortic. 2013, 177–183. [Google Scholar] [CrossRef]
- Bian, Z.H.; Yang, Q.C.; Liu, W.K. Effects of light quality on the accumulation of phytochemicals in vegetables produced in controlled environments: A review: Effects of Light on Vegetable Phytochemicals. J. Sci. Food Agric. 2015, 95, 869–877. [Google Scholar] [CrossRef] [PubMed]
- Boulard, T.; Wang, S. Greenhouse crop transpiration simulation from external climate conditions. Agric. For. Meteorol. 2000, 100, 25–34. [Google Scholar] [CrossRef]
- Katzin, D.; van Mourik, S.; Kempkes, F.; van Henten, E.J. GreenLight—An open source model for greenhouses with supplemental lighting: Evaluation of heat requirements under LED and HPS lamps. Biosyst. Eng. 2020, 194, 61–81. [Google Scholar] [CrossRef]
- Morgan Pattison, P.; Hansen, M.; Tsao, J.Y. LED lighting efficacy: Status and directions. Comptes Rendus Phys. 2018, 19, 134–145. [Google Scholar] [CrossRef]
- Al Murad, M.; Razi, K.; Jeong, B.R.; Samy, P.M.A.; Muneer, S. Light Emitting Diodes (LEDs) as Agricultural Lighting: Impact and Its Potential on Improving Physiology, Flowering, and Secondary Metabolites of Crops. Sustainability 2021, 13, 1985. [Google Scholar] [CrossRef]
- Graamans, L.; van den Dobbelsteen, A.; Meinen, E.; Stanghellini, C. Plant factories; crop transpiration and energy balance. Agric. Syst. 2017, 153, 138–147. [Google Scholar] [CrossRef]
- Fang, H.; Li, K.; Wu, G.; Cheng, R.; Zhang, Y.; Yang, Q. A CFD analysis on improving lettuce canopy airflow distribution in a plant factory considering the crop resistance and LEDs heat dissipation. Biosyst. Eng. 2020, 200, 1–12. [Google Scholar] [CrossRef]
- Chen, J.; Jin, L.; Yang, B.; Chen, Z.; Zhang, G. Influence of the Internal Structure Type of a Large-Area Lower Exhaust Workbench on Its Surface Air Distribution. Int. J. Environ. Res. Public Health 2022, 19, 11395. [Google Scholar] [CrossRef]
- Benke, K.; Tomkins, B. Future food-production systems: Vertical farming and controlled-environment agriculture. Sustain. Sci. Pract. Policy 2017, 13, 13–26. [Google Scholar] [CrossRef]
- Heng, T.G. Implementation of Lean Manufacturing Principles in a Vertical Farming System to Reduce Dependency on Human Labour. Int. J. Adv. Trends Comput. Sci. Eng. (IJATCSE) 2020, 9, 512–520. [Google Scholar] [CrossRef]
- Kitaya, Y.; Tsuruyama, J.; Shibuya, T.; Yoshida, M.; Kiyota, M. Effects of air current speed on gas exchange in plant leaves and plant canopies. Adv. Space Res. 2003, 31, 177–182. [Google Scholar] [CrossRef]
- Kitaya, Y.; Tsuruyama, J.; Shibuya, T.; Kiyota, M. Effects of Air Current Speed, Light Intensity and co2 Concen-Tration on Photosynthesis and Transpiration of Plant Leaves; The University of Hong Kong: Hong Kong, China, 2004. [Google Scholar] [CrossRef]
- Zhang, Y.; Kacira, M. Analysis of climate uniformity in indoor plant factory system with computational fluid dynamics (CFD). Biosyst. Eng. 2022, 220, 73–86. [Google Scholar] [CrossRef]
- Naranjani, B.; Najafianashrafi, Z.; Pascual, C.; Agulto, I.; Chuang, P.-Y.A. Computational analysis of the environment in an indoor vertical farming system. Int. J. Heat Mass Transf. 2022, 186, 122460. [Google Scholar] [CrossRef]
- Son, Y.W.; Chang, S.-M.; Kim, J. Uniforming thermal distribution by air-convection aspirated in partially hollowed tetrahedral lattice porous cold plates for the drone battery. Int. J. Heat Mass Transf. 2022, 199, 123447. [Google Scholar] [CrossRef]
- Song, X.; Huang, D.; Liu, X.; Chen, Q. Effect of non-uniform air velocity distribution on evaporator performance and its improvement on a residential air conditioner. Appl. Therm. Eng. 2012, 40, 284–293. [Google Scholar] [CrossRef]
- Kim, K.; Yoon, J.-Y.; Kwon, H.-J.; Han, J.-H.; Son, J.E.; Nam, S.-W.; Giacomelli, G.A.; Lee, I.-B. 3-D CFD analysis of relative humidity distribution in greenhouse with a fog cooling system and refrigerative dehumidifiers. Biosyst. Eng. 2008, 100, 245–255. [Google Scholar] [CrossRef]
- Sago, Y. Effects of Light Intensity and Growth Rate on Tipburn Development and Leaf Calcium Concentration in Butterhead Lettuce. HortScience 2016, 51, 1087–1091. [Google Scholar] [CrossRef]
- Peiro, E.; Pannico, A.; Colleoni, S.G.; Bucchieri, L.; Rouphael, Y.; De Pascale, S.; Paradiso, R.; Gòdia, F. Air Distribution in a Fully-Closed Higher Plant Growth Chamber Impacts Crop Performance of Hydroponically-Grown Lettuce. Front. Plant Sci. 2020, 11, 537. [Google Scholar] [CrossRef]
- Farquhar, G.D.; von Caemmerer, S.; Berry, J.A. Models of Photosynthesis. Plant Physiol. 2001, 125, 42–45. [Google Scholar] [CrossRef] [PubMed]
- Farquhar, G.D.; Von Caemmerer, S.; Berry, J.A. A biochemical model of photosynthetic CO2 assimilation in leaves of C3 species. Planta 1980, 149, 78–90. [Google Scholar] [CrossRef] [PubMed]
- Langensiepen, M.; Fuchs, M.; Bergamaschi, H.; Moreshet, S.; Cohen, Y.; Wolff, P.; Jutzi, S.C.; Cohen, S.; Rosa, L.M.G.; Li, Y.; et al. Quantifying the uncertainties of transpiration calculations with the Penman–Monteith equation under different climate and optimum water supply conditions. Agric. For. Meteorol. 2009, 149, 1063–1072. [Google Scholar] [CrossRef]
- Qiu, R.; Kang, S.; Du, T.; Tong, L.; Hao, X.; Chen, R.; Chen, J.; Li, F. Effect of convection on the Penman–Monteith model estimates of transpiration of hot pepper grown in solar greenhouse. Sci. Hortic-Amst. 2013, 160, 163–171. [Google Scholar] [CrossRef]
- Kozai, T. Sustainable Plant Factory: Closed Plant Production Systems with Artificial Light for High Resource Use Efficiencies and Quality Produce. In ISHS Acta Horticulturae 1004-International Symposium on Soilless Cultivation; International Society for Horticultural Science: Shanghai, China. [CrossRef]
- Hassanien, R.; Ming, L. Influences of Greenhouse-Integrated Semi-Transparent Photovoltaics on Microclimate and Lettuce Growth. Int. J. Agric. Biol. Eng. 2017, 10, 11–22. [Google Scholar] [CrossRef]
- Kumazaki, T.; Yamada, Y.; Karaya, S.; Tokumitsu, T.; Hirano, T.; Yasumoto, S.; Katsuta, M.; Michiyama, H. Ef-fects of Day Length and Air Temperature on Stem Growth and Flowering in Sesame. Plant Prod. Sci. 2008, 11, 178–183. [Google Scholar] [CrossRef]
- Sang, G.L.; Chang, S.C.; Lee, H.J.; Jang, Y.A.; Lee, J.G. Effect of Air Temperature on Growth and Phytochemical Content of Beet and Ssamchoo. Wonye Kwahak Kisulchi = Korean J. Hortic. Sci. Technol. 2015, 33, 303–308. [Google Scholar] [CrossRef]
- Bautista, A.S.; Gromaz, A.; Ferrarezi, R.S.; López-Galarza, S.; Pascual, B.; Maroto, J.V. Effect of Cropping System and Humidity Level on Nitrate Content and Tipburn Incidence in Endive. Agronomy 2020, 10, 749. [Google Scholar] [CrossRef]
- Carins Murphy, M.R.; Jordan, G.J.; Brodribb, T.J. Acclimation to humidity modifies the link between leaf size and the density of veins and stomata: VPD Alters the Link between Leaf Size and Anatomy. Plant Cell Environ. 2013, 37, 124–131. [Google Scholar] [CrossRef] [PubMed]
- Ball, J.T.; Berry, J.A. The Ci/Cs Ratio: A Basis for Predicting Stomatal Control of Photosynthesis. In Year Book; Carnegie Institution of Washington: Washington, DC, USA, 1982; Available online: https://agris.fao.org/agris-search/search.do?recordID=US201302596370 (accessed on 8 May 2023).
- Fatnassi, H.; Boulard, T.; Bouirden, L. Simulation of climatic conditions in full-scale greenhouse fitted with insect-proof screens. Agric. For. Meteorol. 2003, 118, 97–111. [Google Scholar] [CrossRef]
- Haibo, Y.; Lei, Z.; Haiye, Y.; Yucheng, L.; Chunhui, L.; Yuanyuan, S. Sustainable Development Optimization of a Plant Factory for Reducing Tip Burn Disease. Sustainability 2023, 15, 5607. [Google Scholar] [CrossRef]
- Kang, Y.; Wu, Q.; Qin, J.; Zhong, M.; Yang, X.; Chai, X. High relative humidity improves leaf burn resistance in flowering Chinese cabbage seedlings cultured in a closed plant factory. PeerJ 2022, 10, e14325. [Google Scholar] [CrossRef]
- Yoon, C.G.; Choi, H.K. A Study on the Various Light Source Radiation Conditions and use of LED Illumination for Plant Factory. J. Korean Inst. Illum. Electr. Install. Eng. 2011, 25, 14–22. [Google Scholar] [CrossRef]
- Seungmi, M.; Kiyoun, C.; Sookyoun, K.; Kong, H.T.; Jaehyun, L. An Experimental Study on Environmental Elements and Airflow Distribution Characteristics in a Fully Artificial Plant Factory. In Proceedings of the International Conference on Convergence Technology, Seoul, Republic of Korea, 28–30 September 2011. [Google Scholar]
- Zhang, Y.; Kacira, M.; An, L. A CFD study on improving air flow uniformity in indoor plant factory system. Biosyst. Eng. 2016, 147, 193–205. [Google Scholar] [CrossRef]
- Baek, M.-S.; Kwon, S.-Y.; Lim, J.-H. Improvement of the Crop Growth Rate in Plant Factory by Promoting Air Flow inside the CultivationImprovement of the Crop Growth Rate in Plant Factory by Promoting Air Flow inside the Cultivation. Int. J. Smartcare Home (IJSH) 2016, 10, 63–74. [Google Scholar] [CrossRef]
Disclaimer/Publisher’s Note: The statements, opinions and data contained in all publications are solely those of the individual author(s) and contributor(s) and not of MDPI and/or the editor(s). MDPI and/or the editor(s) disclaim responsibility for any injury to people or property resulting from any ideas, methods, instructions or products referred to in the content. |
© 2023 by the authors. Licensee MDPI, Basel, Switzerland. This article is an open access article distributed under the terms and conditions of the Creative Commons Attribution (CC BY) license (https://creativecommons.org/licenses/by/4.0/).