Article

Effects of Exogenously Applied Copper in Tomato Plants’ Oxidative and Nitrogen Metabolisms under Organic Farming Conditions

1
GreenUPorto—Sustainable Agrifood Production Research Centre and Inov4Agro, Departamento de Biologia, Faculdade de Ciências da Universidade do Porto, Rua do Campo Alegre s/n, 4169-007 Porto, Portugal
2
CIQ-UP—Research Center in Chemistry, Departamento de Química e Bioquímica, Faculdade de Ciências, Universidade do Porto, Rua do Campo Alegre s/n, 4169-007, Porto, Portugal
3
INESC TEC—Instituto de Engenharia de Sistemas e Computadores, Tecnologia e Ciência, Campus da FEUP, Rua Dr. Roberto Frias s/n, 4200-465 Porto, Portugal
4
Faculdade de Ciências da Universidade do Porto, Rua do Campo Alegre s/n, 4169-007 Porto, Portugal
*
Author to whom correspondence should be addressed.
These authors contributed equally to this work.
Horticulturae 2023, 9(3), 323; https://doi.org/10.3390/horticulturae9030323
Submission received: 30 January 2023 / Revised: 17 February 2023 / Accepted: 20 February 2023 / Published: 1 March 2023

Abstract

:
Currently, copper is approved as an active substance among plant protection products and is considered effective against more than 50 different diseases in different crops, conventional and organic. Tomato has been cultivated for centuries, but many fungal diseases still affect it, making it necessary to control them through antifungal agents, such as copper, making it the primary form of fungal control in organic farming systems (OFS). The objective of this work was to determine whether exogenous copper applications can affect AOX mechanisms and nitrogen use efficiency in tomato plant grown in OFS. For this purpose, plants were sprayed with ‘Bordeaux’ mixture (SP). In addition, two sets of plants were each treated with 8 mg/L copper in the root substrate (S). Subsequently, one of these groups was also sprayed with a solution of ‘Bordeaux’ mixture (SSP). Leaves and roots were used to determine NR, GS and GDH activities, as well as proline, H2O2 and AsA levels. The data gathered show that even small amounts of copper in the rhizosphere and copper spraying can lead to stress responses in tomato, with increases in total ascorbate of up to 70% and a decrease in GS activity down to 49%, suggesting that excess copper application could be potentially harmful in horticultural production by OFS.

1. Introduction

Tomato is an economically important crop, with its global production valued at USD 92.8 billion in 2018 [1]. Moreover, in 2020, 16.5 million tons of tomatoes were harvested in the EU, with Italy being the lead producer with 37.8%, followed by Spain with 26.1% and by Portugal, which occupies the third spot on the list, with 8.5% of the total production [2]. Even though tomato has been grown and selected for several centuries, many fungal diseases still affect it, such as late blight, early blight, Septoria leaf spot, fusarium wilt and verticillium wilt [3], making it necessary to control these diseases through antifungal agents, such as copper. This is aggravated by the fact that tomato is a crop that has been gaining worldwide popularity in organic farming systems [4].
With the discovery of copper’s fungicidal effect in the late 19th century, its agricultural use became widespread as a means of controlling mildew diseases inexpensively, especially in grapevine [5], and remains the primary form of fungal disease control in organic farming systems.
In the cell environment, Cu can exist in two oxidation states, Cu2+ and Cu+. The cupric ion (Cu2+) is the active principle in copper-based fungicides [1]. Copper ions or Cu chelates interact with membrane proteins in a non-specific manner, leading to alterations in membrane permeability. If dissolved in water, copper ions can enter fungi cells, such as oomycetes and bacteria. Copper ions in these cells affect multiple enzymatic processes, respiration and block spore germination [6], with a low risk of resistance [1].
Copper-based fungicides can only be used as protectants (contact) since they lack any curative or systemic activity, meaning copper must be applied before the pathogen infects the plant. It is very leachable, so its protective effect on the plant is short-lived and with a high risk of reaching the soil. Furthermore, copper’s low mobility in soil contributes to its accumulation [7].
The majority of research into copper’s accumulation in the soil as a consequence of agriculture has mostly been carried out on grapevine, where its intensive usage to prevent fungal diseases dates back 150 years [8,9]. As a result, land that has seen several centuries worth of grapevine farming possesses the largest levels of soil contamination [10], with values ranging from the low tens (9 mg kg−1) up to a few thousand (3215 mg kg−1) with average concentrations around 150 mg kg−1 [11,12,13,14].
The application of copper as a fungicide has spread to different crops in different crop systems. The use of repeated foliar application of copper fungicides in conventional farming has resulted in rates oscillated between 20 to 30 kg per hectare per year (kg ha−1 yr−1), reaching maximum levels of 80 kg ha−1 yr−1 in countries such as Germany [15]. Recently, due to their advantages (low cost, low risk of potential resistance), copper-based fungicides have had widespread use in organic farming [8]. In this production system, copper is used repeatedly without alternating the active substances available in other non-copper fungicides [16].
These widespread and intensive copper application rates could negatively affect the surrounding ecosystems since increased soil concentrations are toxic to insects, especially to the soil fauna and beneficial soil microbiota [17] and promote plant toxicity [18]. As a result, government entities such as the European Union have imposed limits on the amounts of copper that can be applied to a specific area. In 2018 a limit was set to 28 kg of copper per hectare over a seven-year span, translating to 4 kg per hectare per year on average. This allows farmers to adjust the dose above this threshold in years with severe disease outbreaks, provided that the dose is reduced in other years. However, in some cases, farmers can request permission to use the older limit of 6 kg per hectare per year [16,19].
Despite being primarily used in the control of plant diseases [8,9], copper can also be used as a plant micronutrient leaf fertiliser [20] and in feed additives [21]. Copper (Cu) is a cofactor in several important enzymes such as plastocyanin, copper/zinc superoxide dismutase (Cu/ZnSOD), ethylene receptors and ascorbate oxidase [22]. Within the plant cell, Cu is required in at least six locations: the cytosol, endoplasmic reticulum (ER), mitochondrial inner membrane, chloroplast stroma, thylakoid lumen and apoplast [22].
However, both accumulation of Cu in the soil and excessive foliar application rate can lead to plant toxicity. In these conditions, there is a tendency for root growth to decrease before shoot growth due to preferential Cu accumulation in that organ [23,24]. Copper toxicity can also reduce Fe uptake, leading to deficiency [22]. In shoots, the thylakoid membrane in the chloroplast, especially photosystem II (PSII), is a primary target of Cu toxicity [25,26].
Data from [27,28] on Corchorus capsularis L. and Menta spicata L. crop yields under copper toxicity indicated that high levels of Cu2+ resulted in decreased yield and plant productivity, accompanied by reduced plant biomass. The data gathered show that even small amounts of copper in the rhizosphere and copper spraying can lead to stress responses in tomato, with alterations in oxidase mechanisms [29] and a decrease in the nitrogen assimilation process [30,31].
Plants utilise many different molecules as nitrogen sources, such as nitrate, nitrite, ammonium and amino acids [32]. These molecules are absorbed, stored and converted into necessary compounds for the organism’s normal function. Nitrate is the preferred nitrogen form for plant N uptake. The first step of its assimilation is performed by nitrate reductase (NR; EC 1.7.1.1), followed by nitrite reductase (NiR; EC 1.7.1.4), resulting in its reduction into ammonia. The glutamine synthetase (GS; EC 6.3.1.2)–glutamate synthase (GOGAT; EC 1.4.1.13) cycle is then incorporated into nitrogenous organic molecules. Ammonia can also be incorporated by glutamate dehydrogenase (GDH; EC 1.4.1.4) when present at high levels within the cell. GS has been implicated as a key enzyme regulating nitrogen use efficiency (NUE) in higher plants [33,34], meaning that if compromised it may result in a decreased yield and plant productivity.
Moreover, the static life of plants has led to the development of a complex antioxidant defence system (AOX), constituting numerous enzymatic and non-enzymatic mechanisms, crucial for overcoming many stress conditions. These mechanisms function to minimise, buffer and scavenge reactive oxygen species (ROS), such as H2O2, efficiently. These tolerance mechanisms include many enzymatic components, such as glutathione reductase (GR; EC 1.8.1.7), which catalyses the reduction of oxidised glutathione (GSSG; dimeric) to reduced glutathione (GSH; monomeric), and non-enzymatic components, such as ascorbic acid (AsA), glutathione (GSH) and proline [35]. It is known that copper causes oxidative stress by increasing the content of reactive oxygen species (ROS), such as superoxide anions (O2), singlet oxygen (1O2), hydrogen peroxide (H2O2) and hydroxyl radicals (.OH) [36,37].
However, there is a lack of research on the effects of this accumulated copper in the soil corresponding to the amounts seen on organic farmland regarding plant AOX mechanisms and NUE. As such, it is necessary to understand whether NUE and plant productivity can be impaired in plants grown under organic farming conditions. In this context, this work seeks to determine whether the recent changes in EU legislation had merit and should be enforced more strictly.
This work intends to shine a light on the impact of this heavy metal on the AOX mechanisms and NUE in tomato plants grown under organic farming conditions.

2. Materials and Methods

One week-old seedlings germinated in agar plates were transferred into pots and separated into 4 groups: a control group, a group with a copper-contaminated root substrate, a group where plants were sprayed with Bordeaux mixture every 10 days and a combined exposure case where plants were exposed both through the contaminated substrate and spraying. Following the end of the treatment, leaf and root samples were collected to assess the nitrogen use efficiency by quantifying nitrate, GDH and proline, as well as determining nitrate reductase and glutamine synthetase activities. Furthermore, hydrogen peroxide and ascorbate were also quantified in conjunction with GR expression to better understand the effects on the AOX mechanisms.

2.1. Copper Quantification

Copper content in the plants’ tissues was determined to assess the preferential organ for its accumulation. To do this, plant material from shoots, roots and fruits that was dried in the previous step was ground to a fine powder and kept in a desiccator until the next step. After this, aliquots were subjected to acid digestion with a HCl/HNO3 (1:3) mixture to release the metal bound to any biological material. The digests were dissolved in a precise volume of water and then used in a flame atomic absorption spectrometer with a suitable external standard solution (Perkin Elmer, AAnalyst 200 model, Shelton, CT, USA, according to manufacturer’s instructions) [38].

2.2. Plant Material and Copper Exposition

Solanum lycopersicum L., cultivar ‘Gold Nugget’ seeds were surface-disinfected by immersing them in 70% ethanol for 10 min followed by 3 min washing in a solution of 20% bleach and 0.02% Tween-20 with constant agitation and repeated rinses in sterile distilled water until all the bleach solution was removed, at which point the seeds were then dried and stored at 4 °C until further use.
The surface-disinfected seeds were distributed in Petri dishes containing Hoagland solution 0.5x, solidified with agar 0.625% (w/v) [39]. After this, the seeds were incubated for 2 days in a dark environment at 4 °C to allow stratification to synchronise germination. The Petri dishes were transferred into a growth chamber (16 h light/8 h dark) at 25 °C and 120 μmol/m2/s photosynthetically active radiation for 2 weeks. Then, they were transplanted to pots containing a mixture of expanded vermiculite/perlite (1:1). These plants were watered with Hoagland solution 0.5x for their first week, and then following the first week, 1x Hoagland solution was used.
Afterwards, the plants were separated into four groups. Each group was composed of 8 plants: The first group (SP) was only sprayed with ‘Bordeaux’ mixture every 10 days until a total of 5 applications was reached. The number of applications was calculated to achieve the maximum amount of copper allowed to be administered per hectare/year, equal to 6 kg of Cu in organic farming programs [20]. Two sets of plants were each watered with 2 L of Hoagland solution containing copper sulphate pentahydrate with 8 mg/L copper ion concentration to raise the copper content of the root substrate (S) to about 10 mg of Cu ions per Kg of soil. Subsequently, one of these groups was also sprayed with a solution of Bordeaux mixture every 10 days (SSP). The fourth and final group was the control (C). At the end of the treatment period, leaflets from the 3rd, 4th and 5th leaves and root samples were harvested, frozen and stored at −80 °C until they were used for biochemical and gene expression analysis.

2.3. Nitrate Quantification

To quantify the nitrate in the plant’s leaf and root tissues, frozen aliquots of approximately 100 mg were homogenised with 1 mL of ddH2O in a mortar and pestle with the aid of quartz sand. Following this, the samples were incubated at 100 °C for 15 min and then centrifuged at 15,000× g for another 15 min at RT after which the SN was collected into separate tubes. The colour reaction was carried out by mixing 100 μL of SN with 400 μL of salicylic acid 5% (w/v) in concentrated H2SO4. It was then vortexed briefly to mix thoroughly and then allowed to incubate at RT for 20 min. When this time had elapsed, the mixture was decanted into 15 mL tubes containing 9.5 mL of 2 M NaOH. After allowing the mixture to cool back to room temperature, the absorbance was measured at 410 nm, and a calibration curve was obtained with solutions of NO3 of known concentrations. The content of NO3 was calculated in mg/g f.w.

2.4. Protein Extraction and Quantification

In order to obtain the protein extracts necessary to determine GS and NR activities of root and leaf tissues, aliquots of 300 mg were homogenised with a mortar and pestle over ice and chilled extraction buffer (750 μL for shoots and 500 μL for roots) comprising 25 mM Tris-HCl (pH 6.4), 10 mM magnesium chloride (MgCl2), 1 mM dithiothreitol (DTT), 10% glycerol, 0.05% Triton X-100 with quartz sand and 1% (w/v) polyvinylpolypyrrolidone (PVPP). Following this, the homogenates were centrifuged at 15,000× g at 4 °C for 20 min, and the supernatant (SN) was collected in a separate tube. Following the preparation of the extracts, 75 μL of 1:20 diluted SN were added to new tubes containing 750 μL of Bradford solution, and the protein content was determined using the Bradford method [40].

2.5. Nitrate Reductase Quantification

The previously obtained protein extracts were used to determine NR activities by adding 100 μL to 900 μL of reaction mix composed of 25 mM Trizma-Base, 500 μM NADH, 10 μM FAD and 2 mM KNO3 and measuring the variation in absorbance at 340 nm in intervals of 15 s during 1 min and 30 s using this variation, together with the coefficient of extinction (ε) of 6.22 mM−1 cm−1, to express NR activity in µmol/min/mg of protein. A blank was prepared using an extraction buffer instead of SN.

2.6. Glutamine Synthetase Quantification

Using the extracts obtained in the previously explained step, GS activity was quantified by reacting 50 μL of SN with 50 μL of 6.4% (w/v) sodium arsenate (pH 6.4) and 400 μL of reaction mixture composed of 100 mM Trizma-Base, 125 mM L-glutamine, 157 mM hydroxylamine, 0.26 mM manganese chloride tetrahydrate and 1.25 μM adenosine 5′-diphosphate sodium salt (ADP), (pH 6.4). Therefore, three replicates were prepared from each SN, and a blank with the protein extract was replaced with extraction buffer. All the reactions were then incubated at 30 °C for 30 min (shoots) and for 60 min (roots). After this time was elapsed, 500 μL of stop solution (0.16 M iron chloride (FeCl3) and 0.25 M trichloroacetic acid in 3.33% HCl) were added. The absorbances were measured at 500 nm, and the transferase activity of GS was expressed in μmol/min/mL [41].

2.7. Glutamate Dehydrogenase Quantification

To quantify GDH present, it is first necessary to extract the proteins from the tissue; as such, frozen aliquots of root and leaf tissue weighing approximately 200 mg were homogenised over ice with the aid of quartz sand, PVPP and 400 μL extraction solution composed of 5% glycerol, 1 mM EDTA, 0.05% Triton X-100 and 40 mM Tris-HCl (pH = 7.2). After this, the samples were centrifuged at 13,000× g for 10 min at 6 °C, and the SN was transferred to new tubes and kept on ice. For the GDH quantification, 25 μL of SN was added to tubes containing 75 μL ddH2O and 900 μL of reaction mix containing 50 mM (NH4)2SO4, 13 mM 2-oxoglutarate, 0.25 mM NADH, 1 mM CaCl2 and 100 mM Tris-HCl (pH = 8), and the variation in absorbance at was measured 340 nm in intervals of 15 s during 1 min. Using this variation, together with the coefficient of extinction (ε) 6.22 mM−1 cm−1, GDH activity was expressed in µmol/min/mg of protein. A blank was prepared using extraction buffer instead of SN.

2.8. Proline Quantification

The method described by [42] was utilised for quantifying proline levels. As such, 3% (w/v) sulfosalicylic acid was used to homogenise 200 mg of frozen aliquots of leaf and root tissue (1.5 mL for shoots and 1 mL for roots), in conjunction with quartz sand and over ice. After that, the SN was centrifuged at 500× g for 10 min. Afterwards, 200 μL of the SN was mixed with 200 μL of glacial acetic acid and 200 μL of ninhydrin, and then this mix was incubated for 1 h at 96 °C. Following this, the samples were briefly cooled on ice so that 1 mL of toluene was able to be added and vortexed for 15 s. The tubes were set at RT until the upper phase was formed, at which point it was collected, and, together with a toluene blank, its absorbance was measured at 520 nm. Proline contents were determined via a standard curve created using known proline concentrations, and the results were expressed as mg/g f.w.

2.9. Hydrogen Peroxide Quantification

To quantify H2O2, 200 mg of frozen aliquots of root and leaf tissues were homogenised over ice with 1.2 mL of phosphate buffer 50 mM (pH = 6.5) and quartz sand. Subsequently, the samples were centrifuged at 6500× g for 20 min at 6 °C, and the SN was collected. Afterwards, 500 μL of SN was added to 500 μL of TiSO4 0.1% (w/v) dissolved in H2SO4 20% (w/v) and vortexed for 15 s. Following this, the solution was centrifuged again at 6000× g for 15 min a 6 °C, and then the SN was read at 410 nm. The H2O2 levels were quantified using the ε value of 0.28 μM−1 cm−1 and expressed as nmol/g f.w. using extraction buffer instead of SN as blank.

2.10. Ascorbate Quantification

The quantification of ascorbate was carried out by following the methodology outlined by Gillespie and Ainsworth [43]. For this approach, frozen aliquots of 200 mg were homogenised in 6% TCA (w/v) (1.5 mL for shoots and 1 mL for roots) at 4 °C, in a mortar and pestle over ice. Subsequently, the homogenates were centrifuged at 15,000× g for 10 min at 4 °C, and the SN was collected into new tubes. From this point forward, two sets of reactions were prepared: one to quantify the total amount of ascorbate and another to quantify the reduced ascorbate (AsA). To quantify total ascorbate, 100 μL of SN was added to 50 μL of 75 mM PK buffer (pH 7.0) and 50 μL of 10 mM 1,4-dithiothreitol (DTT). The mixture was then briefly vortexed and incubated at RT for 10 min, and 50 μL of 0.5% (w/v) N-ethylmaleimide (NEM) was added. Similarly, to determine AsA, 100 μL of SN was mixed with 50 μL of 75 mM PK buffer (pH = 7.0) and 100 μL of ddH2O, followed by 750 μL of reaction mixture containing 10% (w/v) TCA, 43% H3PO4, 4% (w/v) 2,2′-bipyridine (BIP) and 3% (w/v) FeCl3. All the samples were then incubated at 37 °C for 1 h, after which the absorbance was read at 525 nm. Through a calibration curve obtained using known concentrations of ascorbate, it is possible to obtain the content of reduced and oxidised ascorbate in μmol/g f.w. The blanks were prepared using 6% TCA (w/v) instead of SN.

2.11. Semi-Quantitative Polymerase Chain Reaction (PCR)

The RNA extraction was accomplished with NZYol (NZytech®, Lisbon, Portugal) in accordance with the instructions supplied by the manufacturer. Using the previously obtained RNA samples, reverse transcription reactions were performed to obtain cDNA using a SuperScript™ IV VILO™ Master Mix kit and following the manufacturer’s instructions (ThermoFisher, Carcavelos, Portugal).
Semi-quantitative reverse-transcriptase PCR was utilised to ascertain the accumulation of mRNA coding for GR. The PCR conditions were optimised for previously designed primers; the final conditions used are described in Table 1. The reactions were composed of 5 μL of 2x Taq Master Mix (Bioron®, Frilabo, Maia, Portugal), 0.4 μL of 10 μM forward and reverse primers, 0.5 μL cDNA from each sample and sterile distilled water to make up the final volume of 10 μL and carried out on a MJ Mini thermocycler (Bio-Rad®, Amadora, Portugal) using the following program: heated lid 112 °C; initial denaturation 94 °C, 2′; 30 cycles of 94 °C, 10′; 57 °C, 20′; 72 °C, 45′; final extension 72 °C 2′. To ensure that the variations observed were indeed due to differential gene expression, it was necessary to normalise the amount of cDNA used for the samples. As such, the elongation factor 1 (EF1) housekeeping gene was used for this effect [44]. The amplification products were loaded onto 2% (w/v) agarose gels prepared on sodium boric acid (SB) buffer and stained with GreenSafe (NZytech®, Lisbon, Portugal). GeneRuler 1 kb DNA Ladder (ThermoFisher, Carcavelos, Portugal) was used as a reference for accessing the size of the amplicons. The gels were then run at 300 V and non-limiting amperage. This process was repeated until volumes that give rise to uniform bands across all situations for EF1 were determined.

2.12. Statistical Analysis

For every parameter, at least three biological replicates (n ≥ 3), with at least three technical replicates, were used per assay. The results were expressed as mean ± standard deviation (SD). Significant differences were monitored through a one-way ANOVA followed by Dunnett’s multiple comparison tests with C as the control group. These analyses were performed using Prism® 8 (GraphPad Software Inc., Boston, MA, USA), considering the statistically significant differences at p ≤ 0.05.

3. Results

3.1. Copper Quantification

Copper accumulation was evident in both shoot and root tissues, with shoots being greatly impacted, especially in growth conditions where the tissue was exposed to the contaminant through spraying, with SP registering an 11-fold (1029%) increase in copper content and SSP a 7-fold (693%) uptick. This value was also elevated due to the plants not being washed since no copper was visible. Finally, the plants that grew on contaminated substrate (S) exhibited the lowest accumulation of copper in the shoots, with a 47% increase (Figure 1).
Regarding root tissue, all growth conditions showed significant increases in copper content. The S group plants registered the smallest one, corresponding to 104%, followed by the plants sprayed with copper-based fungicides (SP), exhibiting a 152% uptick and, finally, the growth condition that accumulated the most copper, SSP, with an increase of 290%.
Upon reaching fruit maturity, achieved simultaneously in all the tested growth conditions, it was observed that plants did not show visible growth differences or foliage volume, suggesting that copper did not have an apparent impact on the plant’s physical characteristics.

3.2. Nitrate Quantification

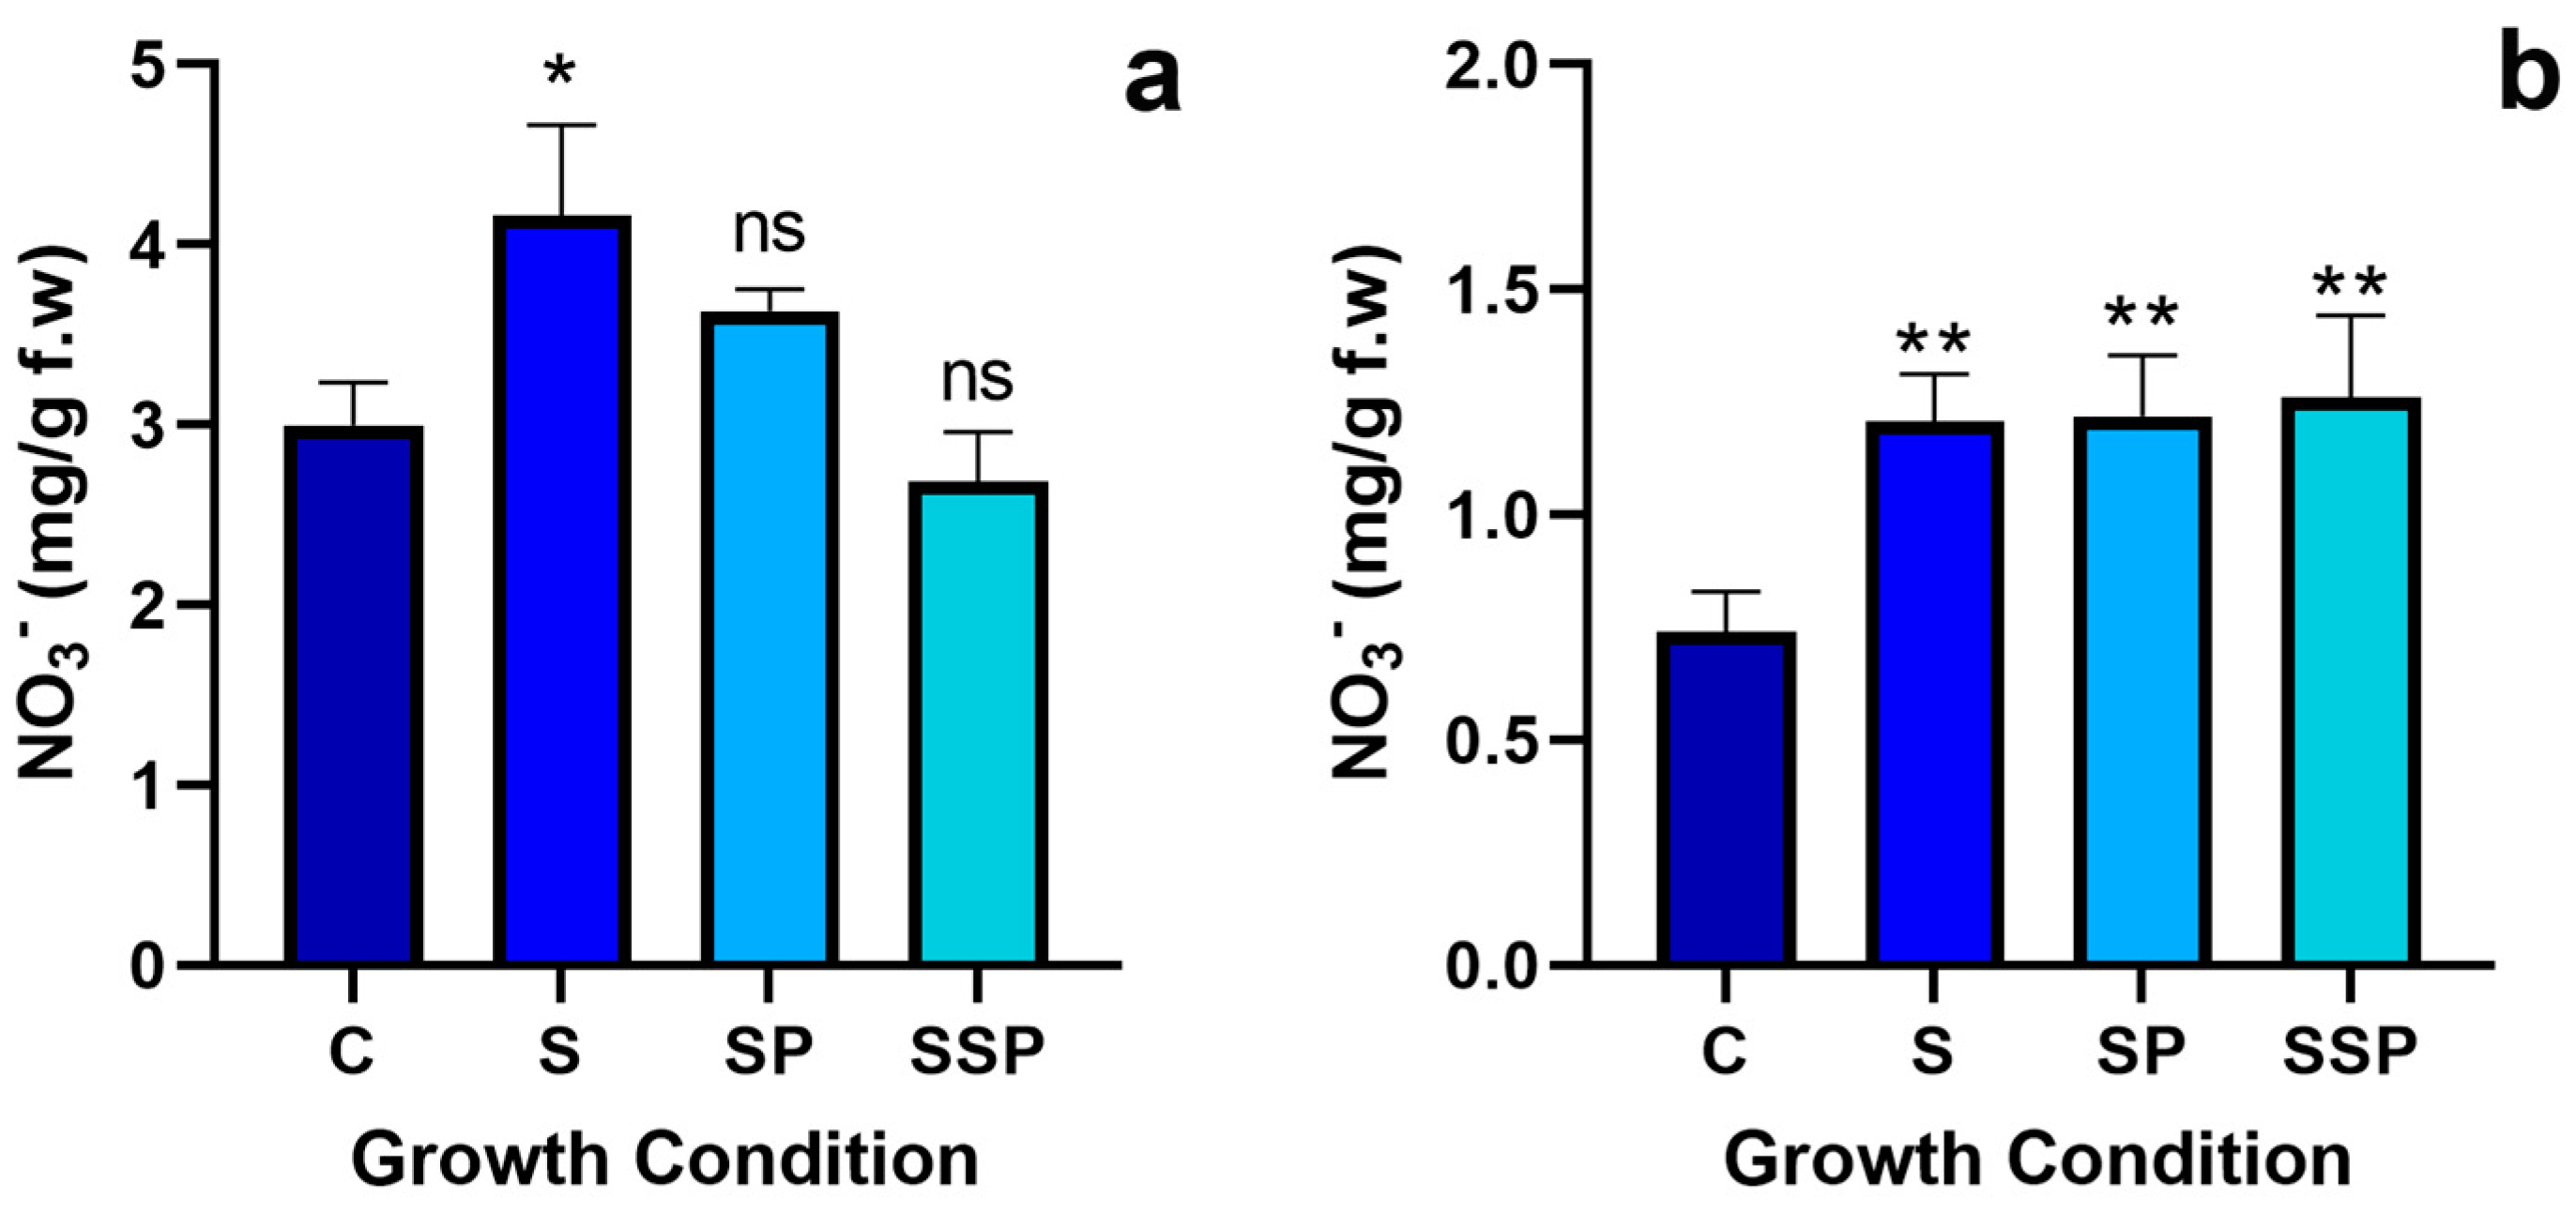
Plants’ leaves exposed to copper through spraying (SP) and combined exposure (SSP) did not present statistically significant changes in nitrate content. This was not the case for the root substrate treatment (S), which showed an increase in nitrate levels of 38% (Figure 2).
In roots, all tested copper growth conditions revealed statistically significant results. Plants that grew on a copper-contaminated substrate (S) showed a 63% increase in nitrate content, with sprayed plants (SP) closely matching this result with a 64% uplift. Finally, the combined exposure group (SSP) showed a slightly higher increase of 70%.

3.3. Nitrate Reductase Activity

In both leaf and root tissues, all tested growth conditions showed no statistical differences in nitrate reductase activity (Figure 3). Despite the 131% increase observed in S plants’ roots, the high SD value causes the result to be not statistically significant and cannot be considered.

3.4. Glutamine Synthetase Activity

Copper significantly influenced GS activity in leaves with significant reductions across all treatments (Figure 4). In leaves, the SSP group was most affected by copper, showing a 49% decrease in GS activity, closely matched by the SP group, registering a 46% decrease. Finally, the least impacted were the plants exposed to copper through contaminated substrate (S), displaying a 28% decrease in the enzyme’s activity. In roots, the results were similar in the S group, with plants again showing a 34% decrease in activity. The two other tested growth conditions showed no statistically significant changes.

3.5. Glutamate Dehydrogenase Activity

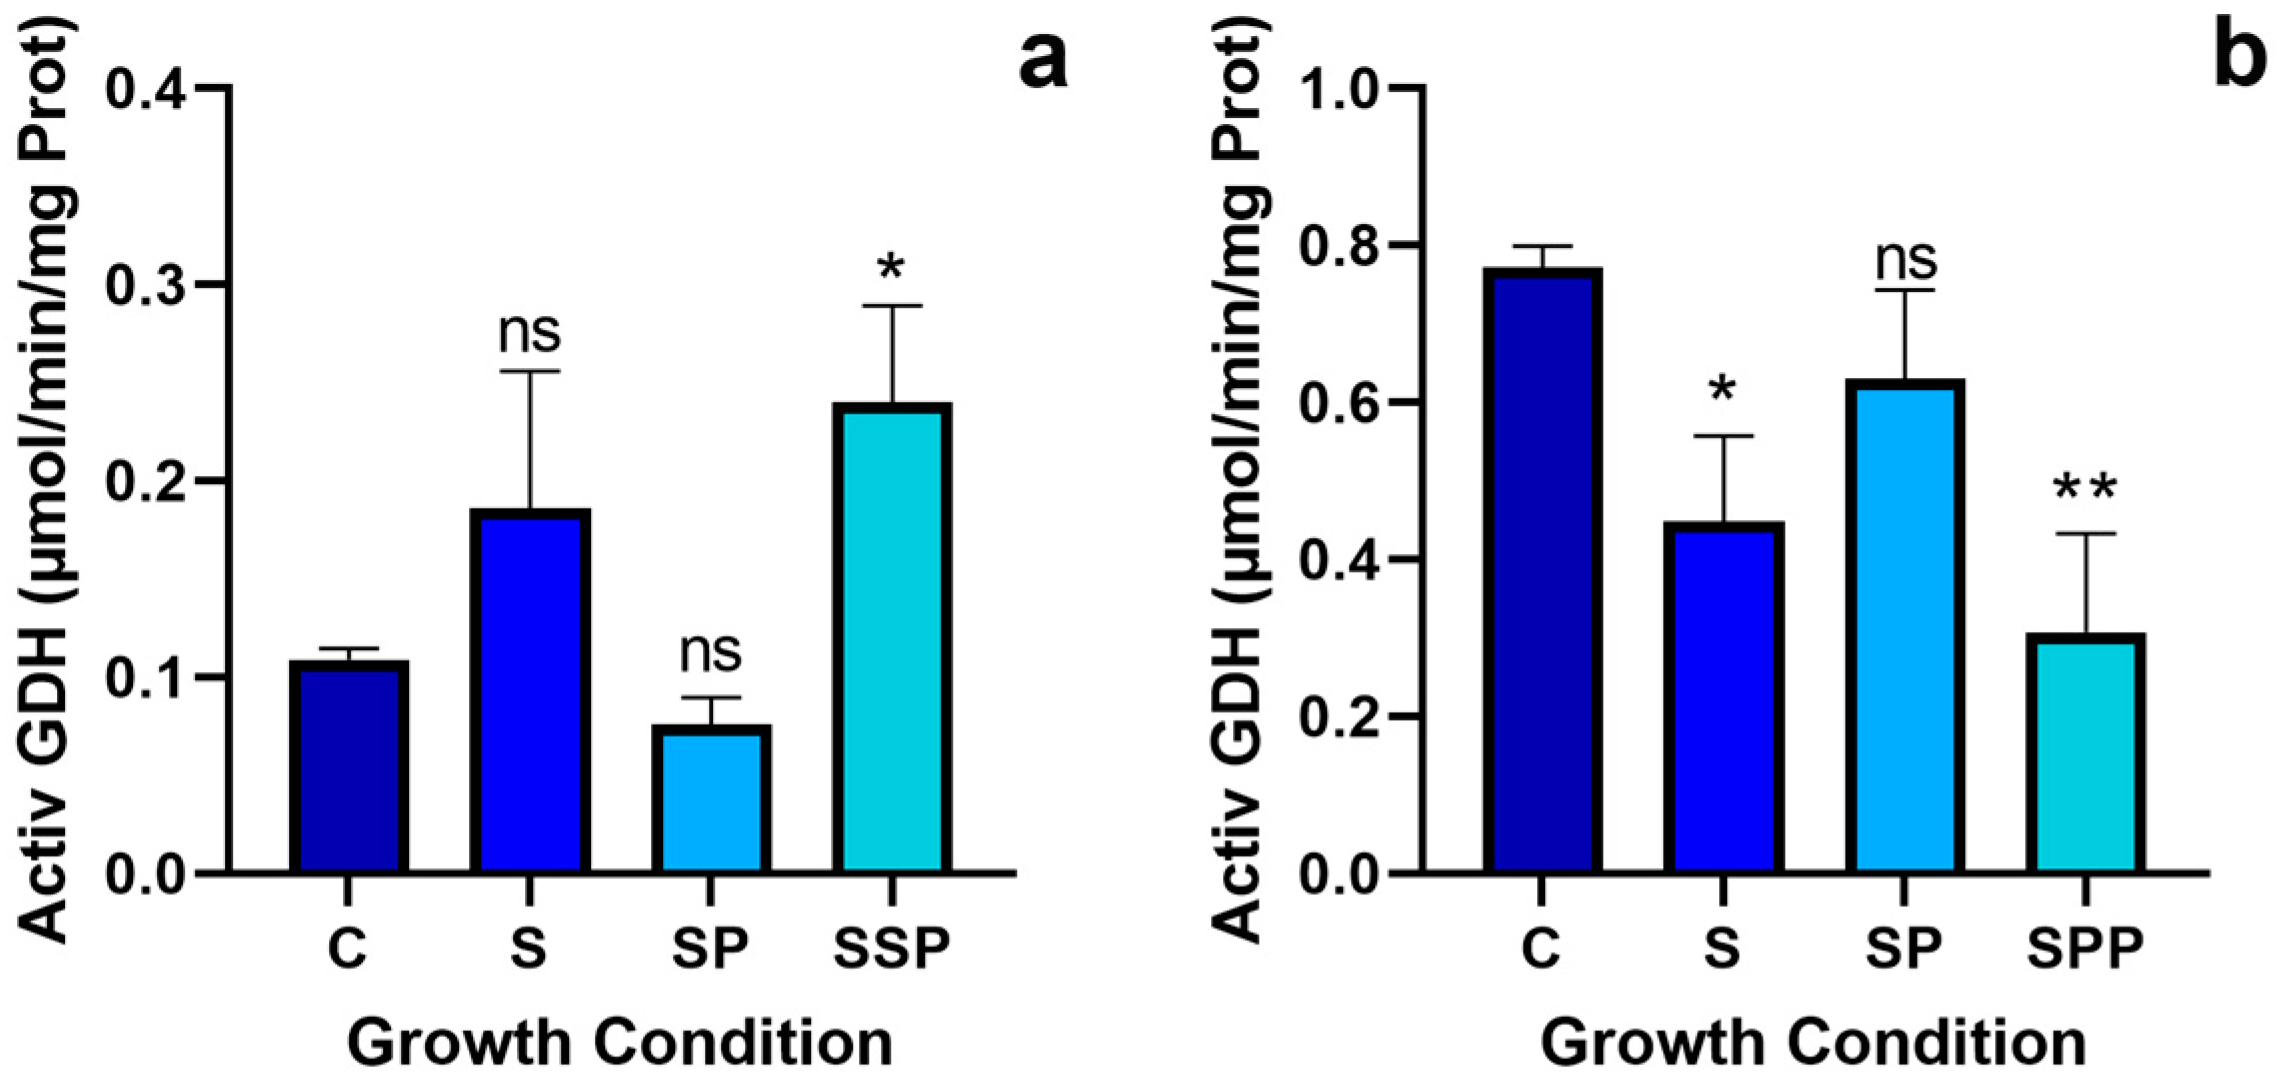
GDH activity in plant roots sprayed with copper-based fungicides did not show statistically significant changes among treatments. Despite this, decreases in root GDH activity were observed with the SSP group, registering a 60% decrease and plants grown in copper-contaminated substrate (S) exhibited a 33% reduction in GDH activity (Figure 5).
In leaf tissue, only the combined copper exposure group plants (SSP) showed a significant increase of 120% in GDH activity, and no impact on GDH was found in the other tested modalities of copper exposure.

3.6. Proline Levels

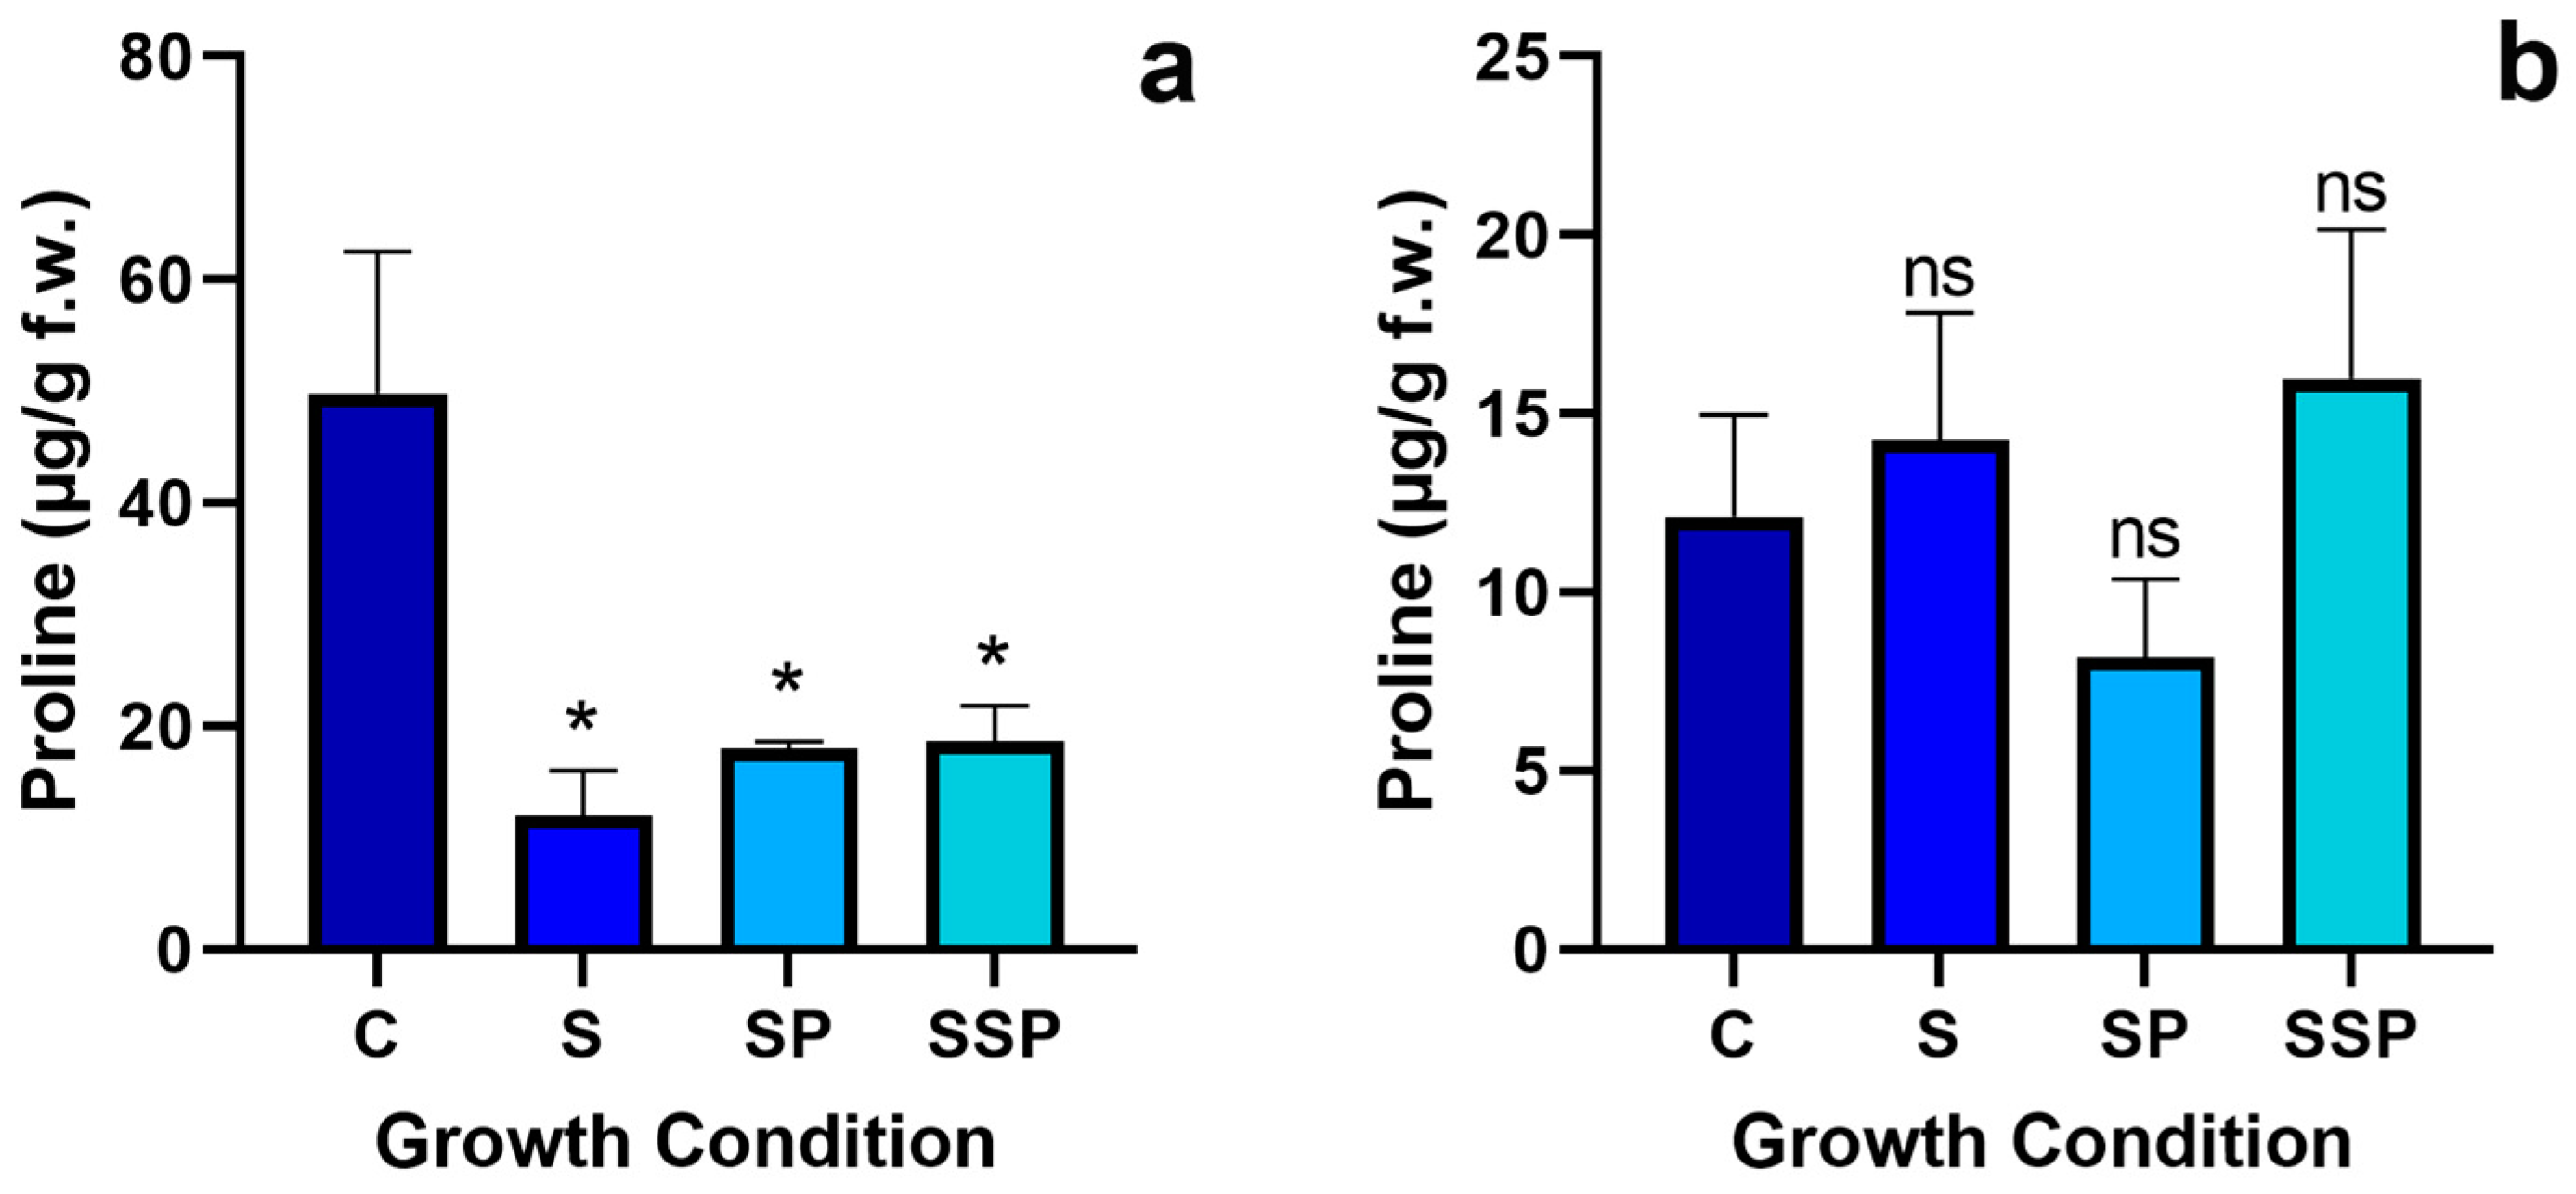
Proline content in leaves was affected by copper’s presence, with significant decreases observed in all tested conditions (Figure 6).
The most significant decrease observed was detected in S plants, corresponding to 76%. Plants sprayed with copper-based fungicides (SP) showed a smaller decrease of 63%. Finally, SSP group plants exhibited the smallest reduction in proline content, equal to 48%.
No significant variations were gleaned from the tests performed on roots.

3.7. Hydrogen Peroxide Levels

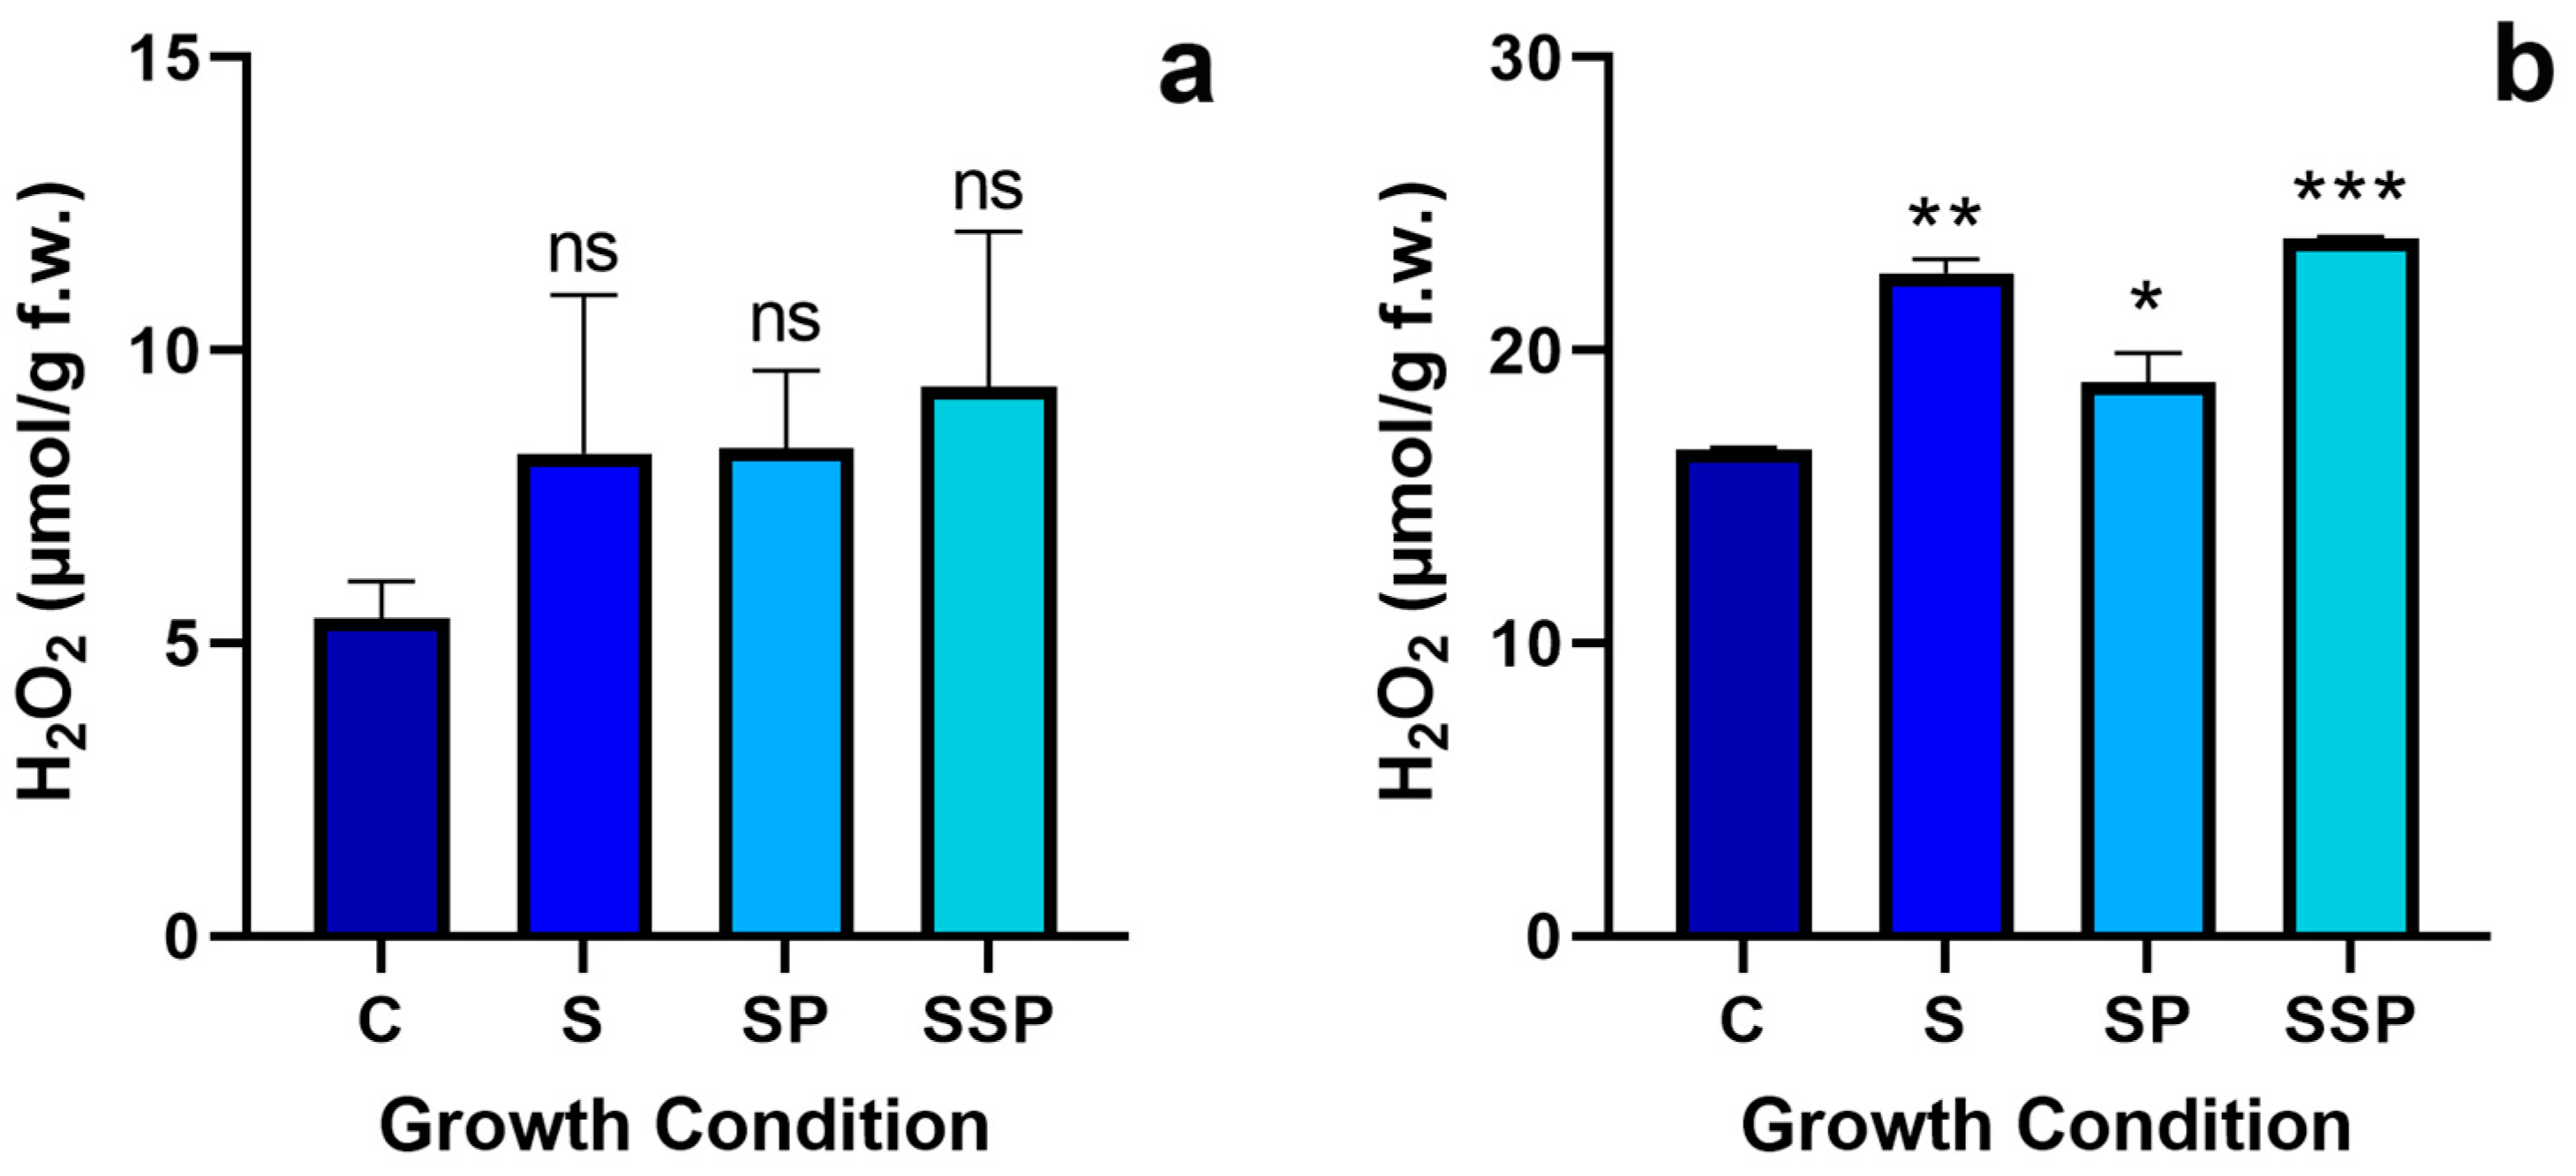
For hydrogen peroxide content, leaf tissue showed no statistically significant changes in any treatment performed, in contrast with the root tissue samples, which showed significant differences in all tested growth conditions. The SP treatment exhibited the lowest increase in H2O2 of 13%, followed by the S treatment with a rise in H2O2 levels of 36% for and 43% for the SSP plants (Figure 7).

3.8. Ascorbate Quantification

3.8.1. Total Ascorbate Quantification

Leaves showed significant changes in total ascorbate content when exposed to copper through spraying (S), registering an increase of 70%, followed by SSP group plants with a 64% increase in total ascorbate (Figure 8). Roots exhibited similar results to those observed in leaves, with S plants showing no significant changes in total ascorbate content, SP plants showing an increase of 30% and the combined exposure plants exhibiting a 43% increase.

3.8.2. Reduced Ascorbate Quantification

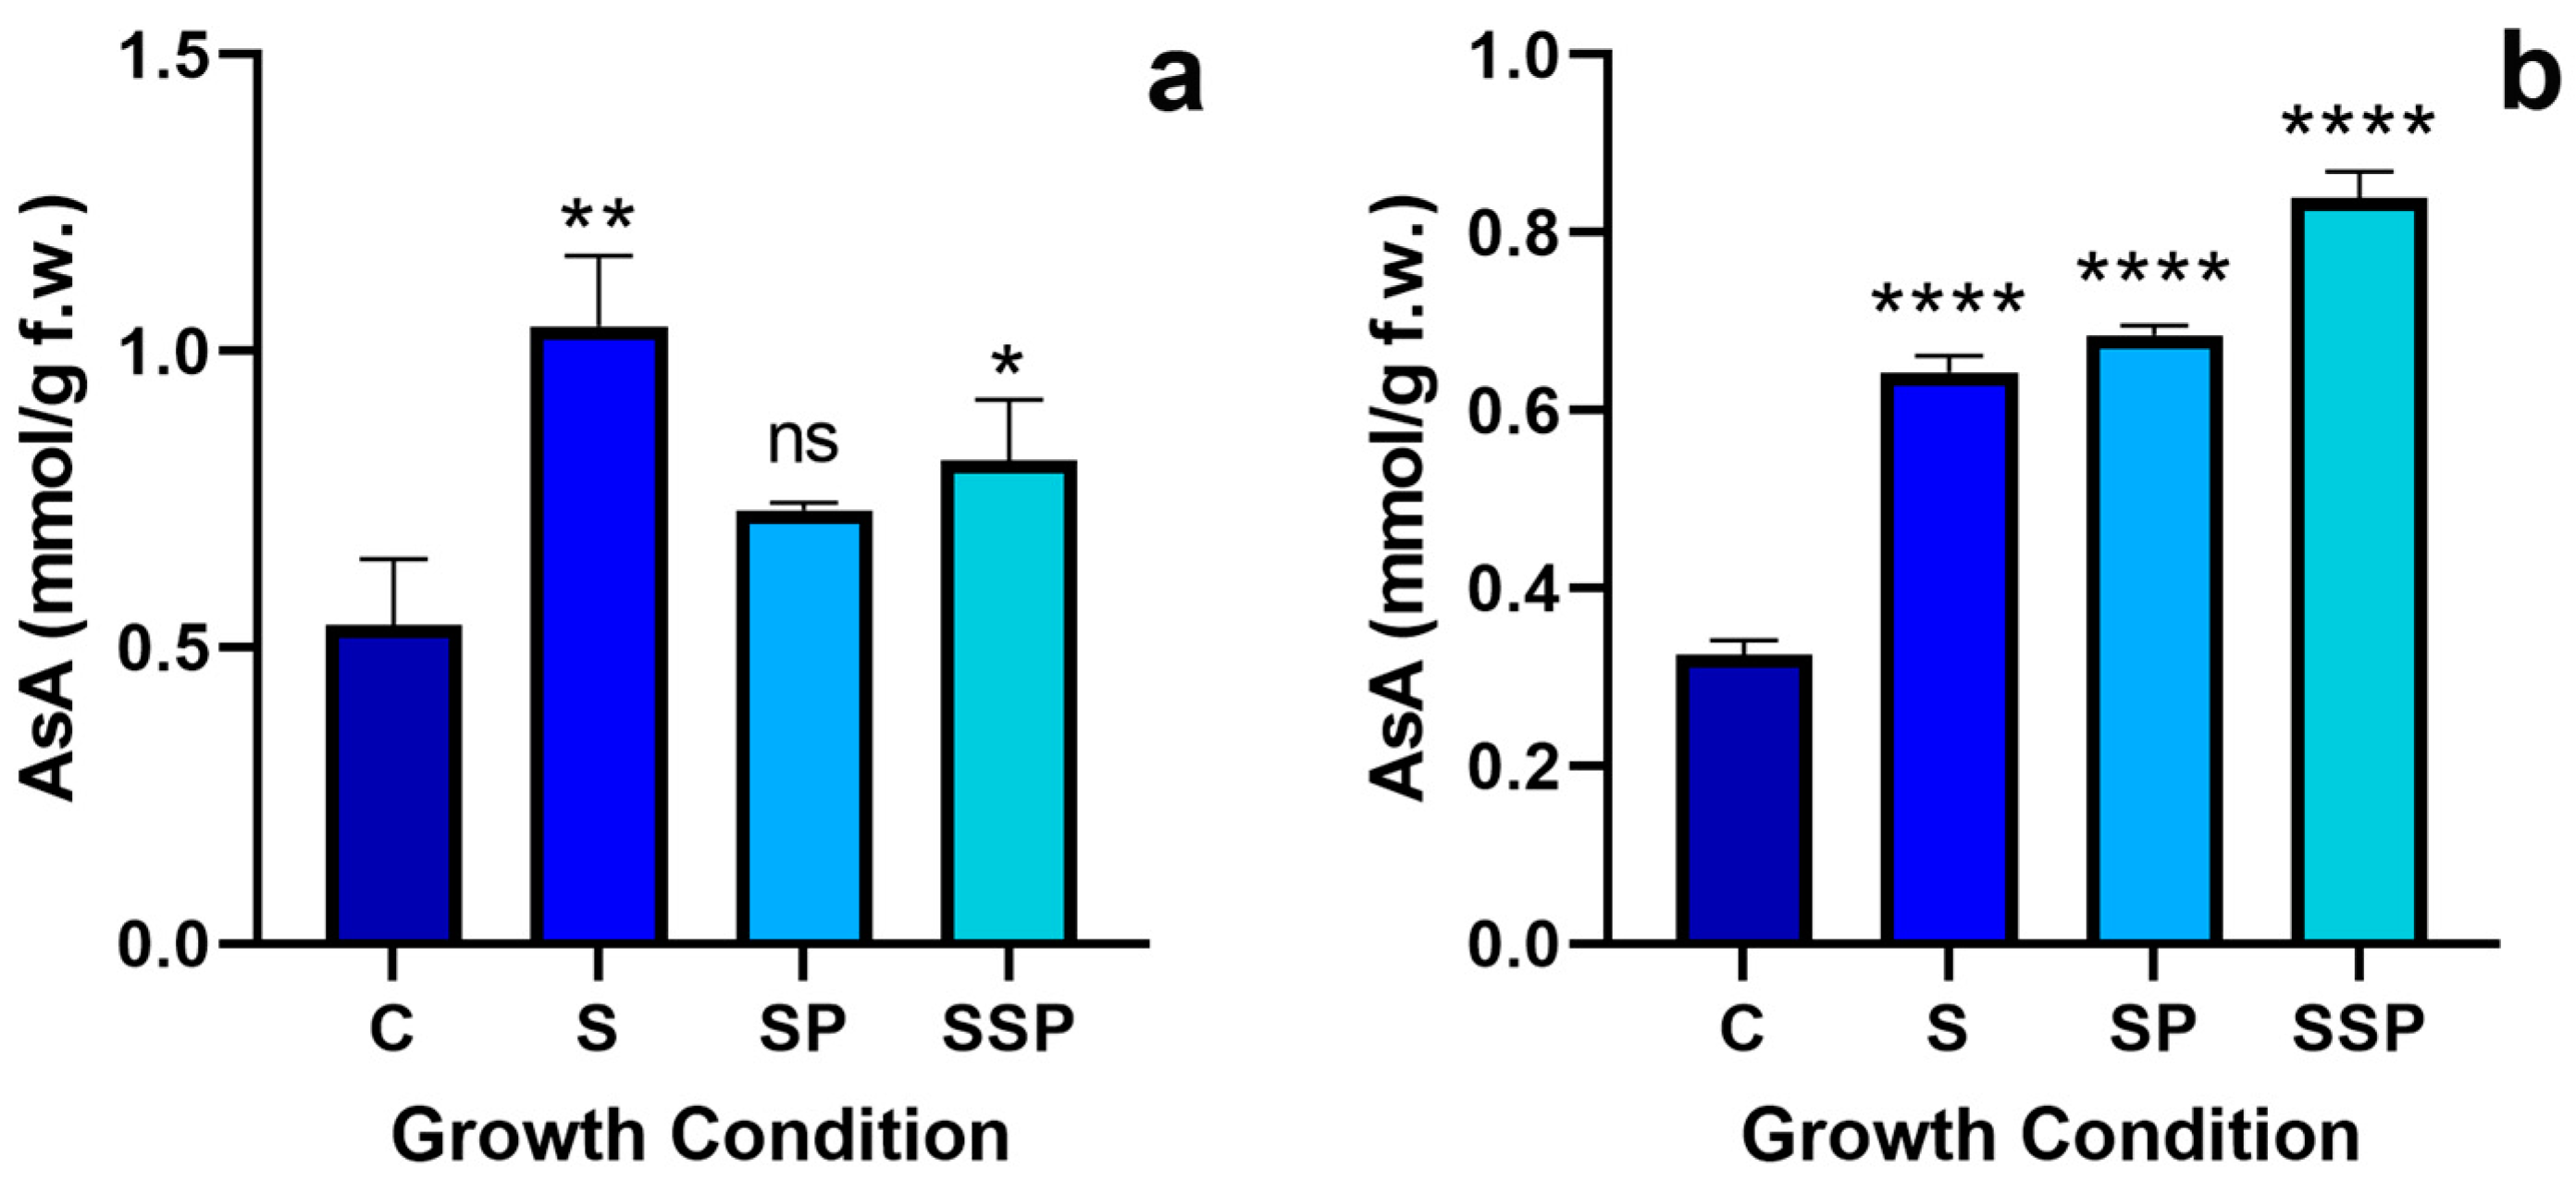
Copper exposure significantly increased (except SP in leaves) in the reduced ascorbate levels. Still, its tested impacts across modalities differed for leaves and roots (Figure 9).
Roots were most impacted, with the SSP treatment showing the greatest significant increase, corresponding to 157%. Plants sprayed with copper fungicides (SP) and plants that grew on a substrate contaminated with copper (S) also revealed increases in ASA content, 110% for SP and 97% for S.
There were no statistically significant changes in SP group plants for leaf tissue. However, S-treated plants showed a 93% increase, and the SSP group exhibited a 51% increase in ascorbate levels.

3.8.3. Oxidised Ascorbate

The ratio between reduced ascorbate and total in leaf tissue did not change in SP and SSP plants, but S group plants showed a 65% increase in this ratio (Figure 10).
In roots, the ratio increased for all tested growth conditions, with SSP exhibiting the highest one, corresponding to 89%, followed by the group of plants that were sprayed with copper fungicides (SP) with a 65% increase and by S plants that showed a 62% increase in this ratio.

3.9. Glutathione Levels

In leaves, GSH content showed no statistically significant changes. Furthermore, even though root samples were tested with increased amounts of tissue, no GSH was detected in these tissues (Figure 11).

3.10. Semi-Quantitative Polymerase Chain Reaction (PCR) for GR

In leaves, it was possible to observe that spraying the plants with copper (SP) decreased the expression of the GR-encoding gene (Figure 12). The same was verified in the combined exposure group (SSP) with a much more significant reduction in expression. However, S plants appear to show higher gene expression than in control. Regarding roots, expression appears to have increased across all tested growth conditions, with SSP showing the highest increase.

4. Discussion

4.1. Copper’s Effect on Nitrogen Use Efficiency

Nitrate is the preferred nitrogen source of plants [45]. Its increase in all tested growth conditions in roots and S plants’ leaves indicates that nitrate is accumulated in these tissues. The nitrate accumulation in roots is in accordance with what was verified in Luffa cylindrica roots [46], where copper induced nitrate accumulation in the lower tested concentrations. It is also worth mentioning that, in roots, nitrate increases in conjunction with the copper content of the tissues. Despite this, copper generally leads to lower nitrate uptake and accumulation in plants [31,47].
The absorbed nitrate is then converted to nitrite by nitrate reductase (NR). Because the activity of this enzyme did not show any statistically significant changes with any treatment, it is possible to assert that copper did not impact the function of NR under these conditions. Burzyński et al. [48] stated that nitrate supply regulates NR activity, and since an increase in nitrate was verified, a non-variation in NR activity would contradict this. Moreover, the results depicted in this report are contrary to the findings o Xiong et al. [49] (2006), who suggested that Cu directly affects the enzyme by attaching itself to the SH groups. Vajpayee et al. [50] also affirmed that reductions in NR activity in plants under chromium stress were due to lower chlorophyll production, which led to lower photosynthesis and, thus, a lower supply of photosynthates.
A decrease in glutamine synthase activity was observed in leaves from all tested growth conditions, as well as in roots of plants that were exposed to copper in their rhizosphere (S), even though gene expression of GS family genes increased in leaves, suggesting the existence of post-transcriptional regulatory events. The expression in roots was generally reduced, but only those from the S group suffered a decreased activity, also pointing to post-transcriptional regulatory events. A reason for this reduction in activity may be due to copper directly inhibiting GS by interfering with the SH groups of the enzymes, or by decreasing the activity of GOGAT, which in turn can cause GS activity to also decrease since their activities are concerted [51]. This reduction in activity as a consequence of copper stress is corroborated by several other reports, such as in rice [52,53] and in cucumber [54], as well as in other heavy metal stress situations [55,56].
GDH increased in SSP leaves and decreased in S and SSP roots. It has been described that GDH activity is highly dependent on the species, cultivar, tissue and duration of exposure to heavy metals [57]. The increased activity observed in leaves, which were affected by combined exposure to copper (SSP), may be due to the GDH aminating activity to compensate for the lower GS activity. Similar increases in GDH activity were observed in bean [58] and maize under Cd stress [59]. Nevertheless, the decrease in activity in roots is in accordance with what was observed in pea under lead stress [60]. These results should be supplemented with a Western blot for GDH, plus the quantification of ammonium in the analysed tissues, to better elucidate whether GDH is performing amination or deamination reactions.
Proline content was reduced in leaves across all conditions, although no changes were observed in roots. These results contradict what is expected of plants under heavy metal stress, as proline levels tend to increase in these situations [61]. For example, proline increased in Brassica under cadmium stress [62] and lead stress in wheat [63]. These increases usually translate into higher heavy metal tolerances, possibly due to proline’s role in osmoregulation and as a free radical scavenger [64,65]. A possible explanation for the decrease in proline content observed is given by [66] who concluded that a decrease in GS activity in the phloem leads to a decrease in proline in plant tissues due to less available glutamate. Considering this, leaves, which registered the highest decreases in GS activity, had a substantial decrease in proline content.

4.2. Copper’s Effect on the Ascorbate–Glutathione Pathway

Roots showed increased H2O2, revealing an increase in ROS in this organ. The ascorbate–glutathione pathway is a critical mechanism in dealing with ROS; its changes indicate possible oxidative stress [35]. Total ascorbate content increased in all tested growth conditions, with significant changes in plants sprayed with copper (SP) and those that suffered combined exposure (SSP) in both shoots and roots, indicating that foliar the application of copper was responsible for an increase in ascorbate production. This increase in total ascorbate is due mainly to the rise in AsA. This conclusion is reinforced by the increases in AsA/TA ratios, with all tested conditions showing increases in roots and S and SSP following this trend in leaves.
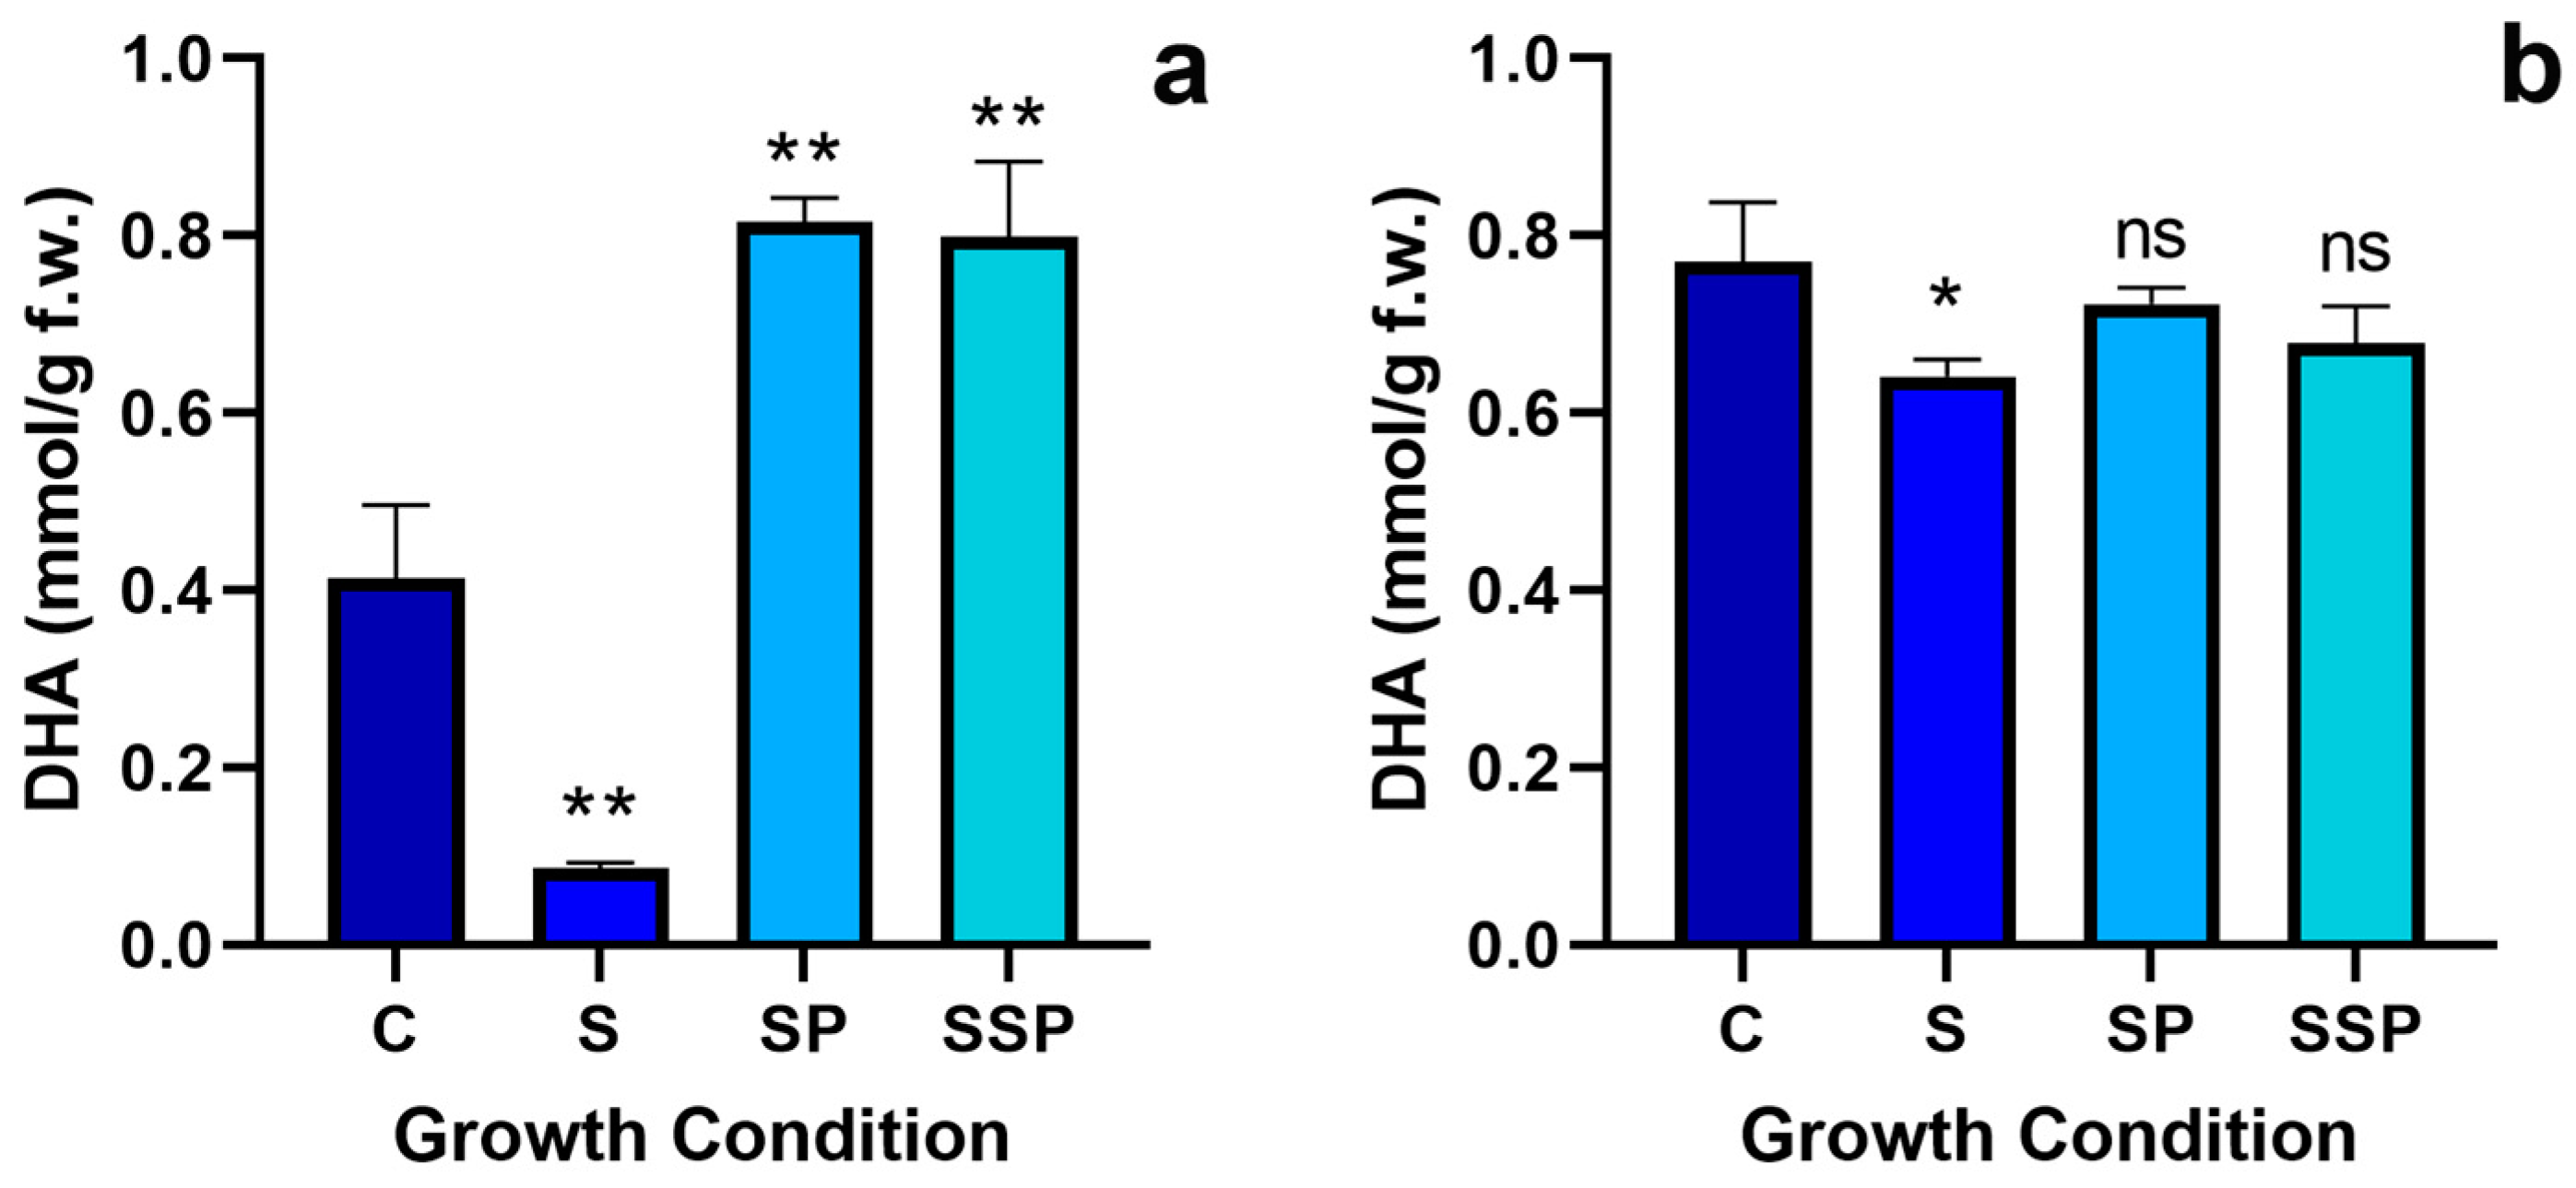
Oxidised ascorbate (DHA) content was reduced very slightly in roots, with only S plants showing significant changes; however, in leaves, SP and SSP plants showed increases, while the content of DHA in S plants decreased. This decrease was observed in S leaves. All the root samples are indicative of AsA being regenerated from DHA. In contrast, SP and SSP leaves show much higher oxidative stress due to their increases in oxidised and reduced ascorbate contents.
The increases in the AsA/DHA ratio observed in S leaves and all root samples can be attributed to the plant’s response to oxidative stress since such a high ratio may be the key to efficiently protecting tissues from the accumulation of ROS caused by abiotic stress [67].
These changes in the ascorbate cycle are in line with what was observed in tomato plants that suffered heavy metal stress [68], as well as roots and leaves of Phaseolus vulgaris exposed to copper [69,70].
The role of glutathione (GSH) in this pathway is that of an electron donor in reducing DHA back into AsA by DHAR, becoming oxidised and then being regenerated again into GSH by GR [71]. Even though GSH did not show any significant changes in its contents in leaves, the changes in the expression of GR appear to correlate with the DHA content in leaf tissue, as SP and SSP plants show decreases in expression, thus explaining the increase in DHA that was observed in these group’s leaves. This also explains the reduction in DHA in S leaves due to the increase in GR gene expression. Lastly, the increase in GR expression observed in roots aligns with the results obtained in tomato plants under salt stress [72].

5. Conclusions

This research provides novel information on the effects of exposure to copper on S. lycopersicum through spraying and combined exposure to copper-based fungicides and copper contaminated rhizosphere. This field of study is yet mostly unexplored and of high interest due to humanity’s growing reliance on organic farming and its associated use of copper products for food production. The data gathered show that even small amounts of copper in the rhizosphere and copper spraying can lead to stress responses in tomato, with alterations in AOX mechanisms and a decrease in the nitrogen assimilation process. Data on other plants crops suggest similar, albeit with some variations, decreases in crop yield, suggesting that excess copper application could potentially be harmful to the horticultural system since low-dose copper is essential for plant life, particularly for nitrogen functionality. According to the presented results, the doses used in organic farming are much higher than plants’ needs. In addition, copper’s soil accumulation and its subsequent toxicity increases with each growing season in which copper-based fungicides are used, thus highlighting the measures to decrease the maximum allowed copper application amount by the EU to 4 kg ha−1 yr−1.
Furthermore, alternative copper application methods with similar pesticides and fungicide functions such as cooper nanoparticles could be explored to assess their potential use in organic farming.

Author Contributions

A.A.—Conceptualization, formal analysis, investigation, visualization, writing—original draft, writing—review and editing. R.R.—Conceptualization, formal analysis, investigation, visualization, writing—original draft, writing—review and editing. M.A.—Investigation. M.C.—Supervision, project administration, writing—review and editing. J.T.—Conceptualization, supervision, project administration, writing—review and editing. All authors have read and agreed to the published version of the manuscript.

Funding

This research was partially supported through national funds by Foundation for Science and Technology (FCT), within the scope of UIDB/05748/2020 and UIDP/05748/2020 (GreenUPorto).

Data Availability Statement

Data are available on request due to privacy restrictions. The data presented in this study are available on request from the corresponding author. The data are not publicly available due to unpublished results that are being prepared.

Acknowledgments

GreenUPorto and CIQ-UP are recognised for equipment support. All individuals included in this section have consented to the data presented in this report.

Conflicts of Interest

The authors declare that they have no known competing financial interests or personal relationships that could have appeared to influence the work reported in this paper. The funders had no role in the design of the study; in the collection, analyses, or interpretation of data; in the writing of the manuscript or in the decision to publish the results.

References

  1. FAOSTAT. Available online: https://www.fao.org/faostat/en/#data/QV (accessed on 10 January 2022).
  2. Eurostat. Key Figures on the European Food Chain; Eutostat: Luxembourg, 2021; pp. 1–105. [Google Scholar] [CrossRef]
  3. Panthee, D.R.; Chen, F. Genomics of Fungal Disease Resistance in Tomato. Curr. Genom. 2009, 11, 30–39. [Google Scholar] [CrossRef] [Green Version]
  4. Gatahi, D.M. Challenges and Opportunities in Tomato Production Chain and Sustainable Standards. Int. J. Hortic. Sci. Technol. 2020, 7, 235–262. [Google Scholar] [CrossRef]
  5. Lamichhane, J.R.; Osdaghi, E.; Behlau, F.; Köhl, J.; Jones, J.B.; Aubertot, J.N. Thirteen Decades of Antimicrobial Copper Compounds Applied in Agriculture. A Review. Agron. Sustain. Dev. 2018, 38, 28. [Google Scholar] [CrossRef] [Green Version]
  6. La Torre, A.; Iovino, V.; Caradonia, F. Copper in Plant Protection: Current Situation and Prospects. Phytopathol. Mediterr. 2018, 57, 201–236. [Google Scholar] [CrossRef]
  7. Ballabio, C.; Panagos, P.; Lugato, E.; Huang, J.-H.; Orgiazzi, A.; Jones, A.; Fernández-Ugalde, O.; Borrelli, P.; Montanarella, L. Copper Distribution in European Topsoils: An Assessment Based on LUCAS Soil Survey. Sci. Total Environ. 2018, 636, 282–298. [Google Scholar] [CrossRef]
  8. Kühne, S.; Strassemeyer, J.; Rossberg, D. Anwendung Kupferhaltiger Pflanzenschutzmittel in Deutschland. Nachr. Dtsch. Pflanz. 2009, 61, 126–130. [Google Scholar]
  9. Speiser, B.; Schärer, H.-J.; Tamm, L. Direct Plant Protection in Organic Farming. In Improving Organic Crop Cultivation; Burleigh Dodds Science Publishing: Cambridge, UK, 2018; pp. 1–21. ISBN 178676184X. [Google Scholar]
  10. Vavoulidou, E.; Avramides, E.J.; Papadopoulos, P.; Dimirkou, A.; Charoulis, A.; Konstantinidou-Doltsinis, S. Copper Content in Agricultural Soils Related to Cropping Systems in Different Regions of Greece. Commun. Soil Sci. Plant Anal. 2005, 36, 759–773. [Google Scholar] [CrossRef]
  11. Chaignon, V.; Sanchez-Neira, I.; Herrmann, P.; Jaillard, B.; Hinsinger, P. Copper Bioavailability and Extractability as Related to Chemical Properties of Contaminated Soils from a Vine-Growing Area. Environ. Pollut. 2003, 123, 229–238. [Google Scholar] [CrossRef]
  12. Fernández-Calviño, D.; Nóvoa-Muñoz, J.C.; López-Periago, E.; Arias-Estéves, M. Changes in Copper Content and Distribution in Young, Old and Abandoned Vineyard Acid Soils Due to Land Use Changes. Land Degrad. Dev. 2008, 19, 165–177. [Google Scholar] [CrossRef]
  13. Mirlean, N.; Roisenberg, A.; Chies, J.O. Metal Contamination of Vineyard Soils in Wet Subtropics (Southern Brazil). Environ. Pollut. 2007, 149, 10–17. [Google Scholar] [CrossRef]
  14. Deluisa, A.; Giandon, P.; Aichner, M.; Bortolami, P.; Bruna, L.; Lupetti, A.; Nardelli, F.; Stringari, G. Copper Pollution in Italian Vineyard Soils. Commun. Soil Sci. Plant Anal. 2008, 27, 1537–1548. [Google Scholar] [CrossRef]
  15. Gessler, C.; Pertot, I.; Perazzolli, M. Plasmopara Viticola: A Review of Knowledge on Downy Mildew of Grapevine and Effective Disease Management. Phytopathol. Mediterr. 2011, 50, 3–44. [Google Scholar]
  16. Tamm, L.; Thuerig, B.; Apostolov, S.; Blogg, H.; Borgo, E.; Corneo, P.E.; Fittje, S.; de Palma, M.; Donko, A.; Experton, C.; et al. Use of Copper-Based Fungicides in Organic Agriculture in Twelve European Countries. Agronomy 2022, 12, 673. [Google Scholar] [CrossRef]
  17. Kandeler, F.; Kampichler, C.; Horak, O. Influence of Heavy Metals on the Functional Diversity of Soil Microbial Communities. Biol. Fertil. Soils 1996, 23, 299–306. [Google Scholar] [CrossRef]
  18. Tugbaeva, A.; Ermoshin, A.; Wuriyanghan, H.; Maleva, M.; Borisova, G.; Kiseleva, I. Copper Stress Enhances the Lignification of Axial Organs in Zinnia Elegans. Horticulturae 2022, 8, 558. [Google Scholar] [CrossRef]
  19. European Commission. Commission Implementing Regulation (EU) 2018/1981—Of 13 December 2018—Renewing the Approval of the Active Substances Copper Compounds, as Candidates for Substitution, in Accordance with Regulation (EC) No 1107/2009 of the European Parliament and of the Council Concerning the Placing of Plant Protection Products on the Market, and Amending the Annex to Commission Implementing Regulation (EU) No 540/2011. Off. J. Eur. Union 2018, 317, 1–5. [Google Scholar]
  20. European Commission. Commission Regulation (EC) No 889/2008 of 5 September 2008 Laying down Detailed Rules for the Implementation of Council Regulation (EC) No 834/2007 on Organic Production and Labelling of Organic Products with Regard to Organic Production, Labelling and Co. Off. J. Eur. Union 2008, 250, 1–84. [Google Scholar]
  21. EFSA Panel on Additives and Products or Substances used in Animal Feed. Revision of the Currently Authorised Maximum Copper Content in Complete Feed. EFSA J. 2016, 14, e04563. [Google Scholar] [CrossRef]
  22. Clarkson, D.T.; Hanson, J.B. The Mineral Nutrition of Higher Plants. Annu. Rev. Plant Physiol. 1980, 31, 239–298. [Google Scholar] [CrossRef]
  23. Alaoui-Sossé, B.; Genet, P.; Vinit-Dunand, F.; Toussaint, M.L.; Epron, D.; Badot, P.M. Effect of Copper on Growth in Cucumber Plants (Cucumis sativus) and Its Relationships with Carbohydrate Accumulation and Changes in Ion Contents. Plant Sci. 2004, 166, 1213–1218. [Google Scholar] [CrossRef]
  24. Navari-Izzo, F.; Cestone, B.; Cavallini, A.; Natali, L.; Giordani, T.; Quartacci, M.F. Copper Excess Triggers Phospholipase D Activity in Wheat Roots. Phytochemistry 2006, 67, 1232–1242. [Google Scholar] [CrossRef] [PubMed]
  25. Bernal, M.; Ramiro, M.V.; Cases, R.; Picorel, R.; Yruela, I. Excess Copper Effect on Growth, Chloroplast Ultrastructure, Oxygen-Evolution Activity and Chlorophyll Fluorescence in Glycine Max Cell Suspensions. Physiol. Plant 2006, 127, 312–325. [Google Scholar] [CrossRef] [Green Version]
  26. Yruela, I.; Pueyo, J.J.; Alonso, P.J.; Picorel, R. Photoinhibition of Photosystem II from Higher Plants. J. Biol. Chem. 1996, 271, 27408–27415. [Google Scholar] [CrossRef] [Green Version]
  27. Saleem, M.H.; Ali, S.; Irshad, S.; Hussaan, M.; Rizwan, M.; Rana, M.S.; Hashem, A.; Abd_allah, E.F.; Ahmad, P. Copper Uptake and Accumulation, Ultra-Structural Alteration, and Bast Fibre Yield and Quality of Fibrous Jute (Corchorus capsularis L.) Plants Grown under Two Different Soils of China. Plants 2020, 9, 404. [Google Scholar] [CrossRef] [PubMed] [Green Version]
  28. Chrysargyris, A.; Papakyriakou, E.; Petropoulos, S.A.; Tzortzakis, N. The Combined and Single Effect of Salinity and Copper Stress on Growth and Quality of Mentha Spicata Plants. J. Hazard. Mater. 2019, 368, 584–593. [Google Scholar] [CrossRef]
  29. Pádua, M.; Aubert, S.; Casimiro, A.; Bligny, R.; Millar, A.H.; Day, D.A. Induction of Alternative Oxidase by Excess Copper in Sycamore Cell Suspensions. Plant Physiol. Biochem. 1999, 37, 131–137. [Google Scholar] [CrossRef]
  30. Nazir, F.; Hussain, A.; Fariduddin, Q. Hydrogen Peroxide Modulate Photosynthesis and Antioxidant Systems in Tomato (Solanum lycopersicum L.) Plants under Copper Stress. Chemosphere 2019, 230, 544–558. [Google Scholar] [CrossRef]
  31. Hippler, F.W.R.; Mattos-Jr, D.; Boaretto, R.M.; Williams, L.E. Copper Excess Reduces Nitrate Uptake by Arabidopsis Roots with Specific Effects on Gene Expression. J. Plant Physiol. 2018, 228, 158–165. [Google Scholar] [CrossRef]
  32. Mcallister, C.H.; Beatty, P.H.; Good, A.G. Engineering Nitrogen Use Efficient Crop Plants: The Current Status. Plant Biotechnol. J. 2012, 10, 1011–1025. [Google Scholar] [CrossRef]
  33. Zhang, Z.; Xiong, S.; Wei, Y.; Meng, X.; Wang, X.; Ma, X. The Role of Glutamine Synthetase Isozymes in Enhancing Nitrogen Use Efficiency of N-Efficient Winter Wheat. Sci. Rep. 2017, 7, 1000. [Google Scholar] [CrossRef] [Green Version]
  34. Chattha, M.S.; Ali, Q.; Haroon, M.; Afzal, M.J.; Javed, T.; Hussain, S.; Mahmood, T.; Solanki, M.K.; Umar, A.; Abbas, W.; et al. Enhancement of Nitrogen Use Efficiency through Agronomic and Molecular Based Approaches in Cotton. Front. Plant Sci. 2022, 13, 1–24. [Google Scholar] [CrossRef]
  35. Rajput, V.D.; Harish; Singh, R.K.; Verma, K.K.; Sharma, L.; Quiroz-Figueroa, F.R.; Meena, M.; Gour, V.S.; Minkina, T.; Sushkova, S.; et al. Recent Developments in Enzymatic Antioxidant Defence Mechanism in Plants with Special Reference to Abiotic Stress. Biology 2021, 10, 267. [Google Scholar] [CrossRef]
  36. Apel, K.; Hirt, H. Reactive Oxygen Species: Metabolism, Oxidative Stress, and Signal Transduction. Annu. Rev. Plant Biol. 2004, 55, 373–399. [Google Scholar] [CrossRef] [PubMed] [Green Version]
  37. Miotto, A.; Ceretta, C.A.; Brunetto, G.; Nicoloso, F.T.; Girotto, E.; Farias, J.G.; Tiecher, T.L.; De Conti, L.; Trentin, G. Copper Uptake, Accumulation and Physiological Changes in Adult Grapevines in Response to Excess Copper in Soil. Plant Soil 2014, 374, 593–610. [Google Scholar] [CrossRef] [Green Version]
  38. Martins, M.L.R. Metabolic Pinpointing of Solanum lycopersicum L. Response to High Zn Levels—The Relevance of Metallothioneins, GSH Metabolism and the Antioxidant System. Master’s Thesis, Faculdade de Ciências da Universidade do Porto, Porto, Portugal, 2017. [Google Scholar]
  39. Taiz, L.; Zeiger, E. Plant Physiology and Development; Sinauer Associates Incorporated: Sunderland, MA, USA, 2019; Volume 53, ISBN 9788578110796. [Google Scholar]
  40. Bradford, M.M. A Rapid and Sensitive Method for the Quantitation of Microgram Quantities of Protein Utilizing the Principle of Protein-Dye Binding. Anal. Biochem. 1976, 72, 248–254. [Google Scholar] [CrossRef] [PubMed]
  41. Martins, M.; Lopes, J.; Sousa, B.; Soares, C.; Valente, I.M.; Rodrigues, J.A.; Fidalgo, F.; Teixeira, J. Cr (VI)-Induced Oxidative Damage Impairs Ammonia Assimilation into Organic Forms in Solanum lycopersicum L. Plant Stress 2021, 2, 100034. [Google Scholar] [CrossRef]
  42. Bates, L.S.; Waldren, R.P.; Teare, I.D. Rapid Determination of Free Proline for Water-Stress Studies. Plant Soil 1973, 39, 205–207. [Google Scholar] [CrossRef]
  43. Gillespie, K.M.; Ainsworth, E.A. Measurement of Reduced, Oxidized and Total Ascorbate Content in Plants. Nat. Protoc. 2007, 2, 871–874. [Google Scholar] [CrossRef]
  44. Løvdal, T.; Lillo, C. Reference Gene Selection for Quantitative Real-Time PCR Normalization in Tomato Subjected to Nitrogen, Cold, and Light Stress. Anal. Biochem. 2009, 387, 238–242. [Google Scholar] [CrossRef]
  45. Good, A.G.; Shrawat, A.K.; Muench, D.G. Can Less Yield More? Is Reducing Nutrient Input into the Environment Compatible with Maintaining Crop Production? Trends Plant Sci. 2004, 9, 597–605. [Google Scholar] [CrossRef]
  46. Zhang, L.L.; He, X.-J.; Chen, M.; An, R.-D.; An, X.-L.; Li, J. Responses of Nitrogen Metabolism to Copper Stress in Luffa Cylindrica Roots. J. Soil Sci. Plant Nutr. 2014, 14, 616–624. [Google Scholar] [CrossRef]
  47. Huo, K.; Shangguan, X.; Xia, Y.; Shen, Z.; Chen, C. Excess Copper Inhibits the Growth of Rice Seedlings by Decreasing Uptake of Nitrate. Ecotoxicol. Environ. Saf. 2020, 190, 110105. [Google Scholar] [CrossRef] [PubMed]
  48. Burzyński, M.; Burzyński, M. The Uptake and Accumulation of Phosphorous and Nitrates and the Activity of Nitrate Reductase in Cucumber Seedlings Treated with PbCl2 or CdCl2. Acta Soc. Bot. Pol. 2014, 57, 349–359. [Google Scholar] [CrossRef] [Green Version]
  49. Xiong, Z.-T.; Liu, C.; Geng, B. Phytotoxic Effects of Copper on Nitrogen Metabolism and Plant Growth in Brassica Pekinensis Rupr. Ecotoxicol. Environ. Saf. 2006, 64, 273–280. [Google Scholar] [CrossRef] [PubMed]
  50. Vajpayee, P.; Tripathi, R.D.; Rai, U.N.; Ali, M.B.; Singh, S.N. Chromium (VI) Accumulation Reduces Chlorophyll Biosynthesis, Nitrate Reductase Activity and Protein Content in Nymphaea alba L. Chemosphere 2000, 41, 1075–1082. [Google Scholar] [CrossRef]
  51. Hussain, S.; Khaliq, A.; Noor, M.A.; Tanveer, M.; Hussain, H.A.; Hussain, S.; Shah, T.; Mehmood, T. Metal Toxicity and Nitrogen Metabolism in Plants: An Overview. In Carbon and Nitrogen Cycling in Soil; Springer: Singapore, 2020; pp. 221–248. [Google Scholar]
  52. Yu, C.C.; Hung, K.T.; Kao, C.H. Nitric Oxide Reduces Cu Toxicity and Cu-Induced NH4+ Accumulation in Rice Leaves. J. Plant Physiol. 2005, 162, 1319–1330. [Google Scholar] [CrossRef]
  53. Miflin, B.J.; Lea, P.J.; Wallsgrove, R.M. The Role of Glutamine in Ammonia Assimilation and Reassimilation in Plants. In Glutamine: Metabolism, Enzymology, and Regulation; Elsevier: Amsterdam, The Netherlands, 1980; pp. 213–234. [Google Scholar]
  54. Burzyński, M.; Buczek, J. Uptake and Assimilation of Ammonium Ions by Cucumber Seedlings from Solutions with Different PH and Addition of Heavy Metals. Acta Soc. Bot. Pol. 1998, 67, 197–200. [Google Scholar] [CrossRef] [Green Version]
  55. Chaffei, C.; Pageau, K.; Suzuki, A.; Gouia, H.; Ghorbel, M.H.; Masclaux-Daubresse, C. Cadmium Toxicity Induced Changes in Nitrogen Management in Lycopersicon esculentum Leading to a Metabolic Safeguard Through an Amino Acid Storage Strategy. Plant Cell Physiol. 2004, 45, 1681–1693. [Google Scholar] [CrossRef]
  56. Jha, A.B.; Dubey, R.S. Arsenic Exposure Alters Activity Behaviour of Key Nitrogen Assimilatory Enzymes in Growing Rice Plants. Plant Growth Regul. 2004, 43, 259–268. [Google Scholar] [CrossRef]
  57. Miflin, B.J.; Habash, D.Z. The Role of Glutamine Synthetase and Glutamate Dehydrogenase in Nitrogen Assimilation and Possibilities for Improvement in the Nitrogen Utilization of Crops. J. Exp. Bot. 2002, 53, 979–987. [Google Scholar] [CrossRef] [Green Version]
  58. Gouia, H.; Habib Ghorbal, M.; Meyer, C. Effects of Cadmium on Activity of Nitrate Reductase and on Other Enzymes of the Nitrate Assimilation Pathway in Bean. Plant Physiol. Biochem. 2000, 38, 629–638. [Google Scholar] [CrossRef]
  59. Boussama, N.; Ouariti, O.; Suzuki, A.; Ghorbal, M.H. Cd-Stress on Nitrogen Assimilation. J. Plant Physiol. 1999, 155, 310–317. [Google Scholar] [CrossRef]
  60. Mittal, S.; Sawhney, S.K. Influence of Lead on Enzymes of Nitrogen Metabolism in Germinating Pea Seeds. Plant Physiol. Biochem. 1990, 17, 75–81. [Google Scholar]
  61. Szabados, L.; Savouré, A. Proline: A Multifunctional Amino Acid. Trends Plant Sci. 2010, 15, 89–97. [Google Scholar] [CrossRef] [PubMed]
  62. Singh, P.K.; Tewari, R.K. Cadmium Toxicity Induced Changes in Plant Water Relations and Oxidative Metabolism of Brassica juncea L. Plants. J. Environ. Biol. 2003, 24, 107–112. [Google Scholar] [PubMed]
  63. Yang, Y.; Zhang, Y.; Wei, X.; You, J.; Wang, W.; Lu, J.; Shi, R. Comparative Antioxidative Responses and Proline Metabolism in Two Wheat Cultivars under Short Term Lead Stress. Ecotoxicol. Environ. Saf. 2011, 74, 733–740. [Google Scholar] [CrossRef] [PubMed]
  64. Hare, P.D.; Cress, W.A. Metabolic Implications of Stress-Induced Proline Accumulation in Plants. Plant Growth Regul. 1997, 21, 79–102. [Google Scholar] [CrossRef]
  65. Delauney, A.J.; Verma, D.P.S. Proline Biosynthesis and Osmoregulation in Plants. Plant J. 1993, 4, 215–223. [Google Scholar] [CrossRef]
  66. Brugière, N.; Dubois, F.; Limami, A.M.; Lelandais, M.; Roux, Y.; Sangwan, R.S.; Hirel, B. Glutamine Synthetase in the Phloem Plays a Major Role in Controlling Proline Production. Plant Cell 1999, 11, 1995–2011. [Google Scholar] [CrossRef] [PubMed] [Green Version]
  67. Szalai, G.; Kellos, T.; Galiba, G.; Kocsy, G. Glutathione as an Antioxidant and Regulatory Molecule in Plants Under Abiotic Stress Conditions. J. Plant Growth Regul. 2009, 28, 66–80. [Google Scholar] [CrossRef]
  68. Ullah Qadir, S.; Raja, V.; Siddiqui, W.A.; Shah, T.; Alansi, S.; El-Sheikh, M.A. Ascorbate Glutathione Antioxidant System Alleviates Fly Ash Stress by Modulating Growth Physiology and Biochemical Responses in Solanum Lycopersicum. Saudi J. Biol. Sci. 2022, 29, 1322–1336. [Google Scholar] [CrossRef] [PubMed]
  69. Gupta, M.; Cuypers, A.; Vangronsveld, J.; Clijsters, H. Copper Affects the Enzymes of the Ascorbate-Glutathione Cycle and Its Related Metabolites in the Roots of Phaseolus vulgaris. Physiol. Plant 1999, 106, 262–267. [Google Scholar] [CrossRef]
  70. Cuypers, A.; Vangronsveld, J.; Clijsters, H. Biphasic Effect of Copper on the Ascorbate-Glutathione Pathway in Primary Leaves of Phaseolus Vulgaris Seedlings during the Early Stages of Metal Assimilation. Physiol. Plant 2000, 110, 512–517. [Google Scholar] [CrossRef]
  71. Latowski, D.; Surówka, E.; Strzałka, K. Regulatory Role of Components of Ascorbate-Glutathione Pathway in Plant Stress Tolerance. In Ascorbate-Glutathione Pathway and Stress Tolerance in Plants; Springer: Dordrecht, The Netherlands, 2010; pp. 1–53. [Google Scholar] [CrossRef]
  72. Shalata, A.; Neumann, P.M. Exogenous Ascorbic Acid (Vitamin C) Increases Resistance to Salt Stress and Reduces Lipid Peroxidation. J. Exp. Bot. 2001, 52, 2207–2211. [Google Scholar] [CrossRef] [PubMed]
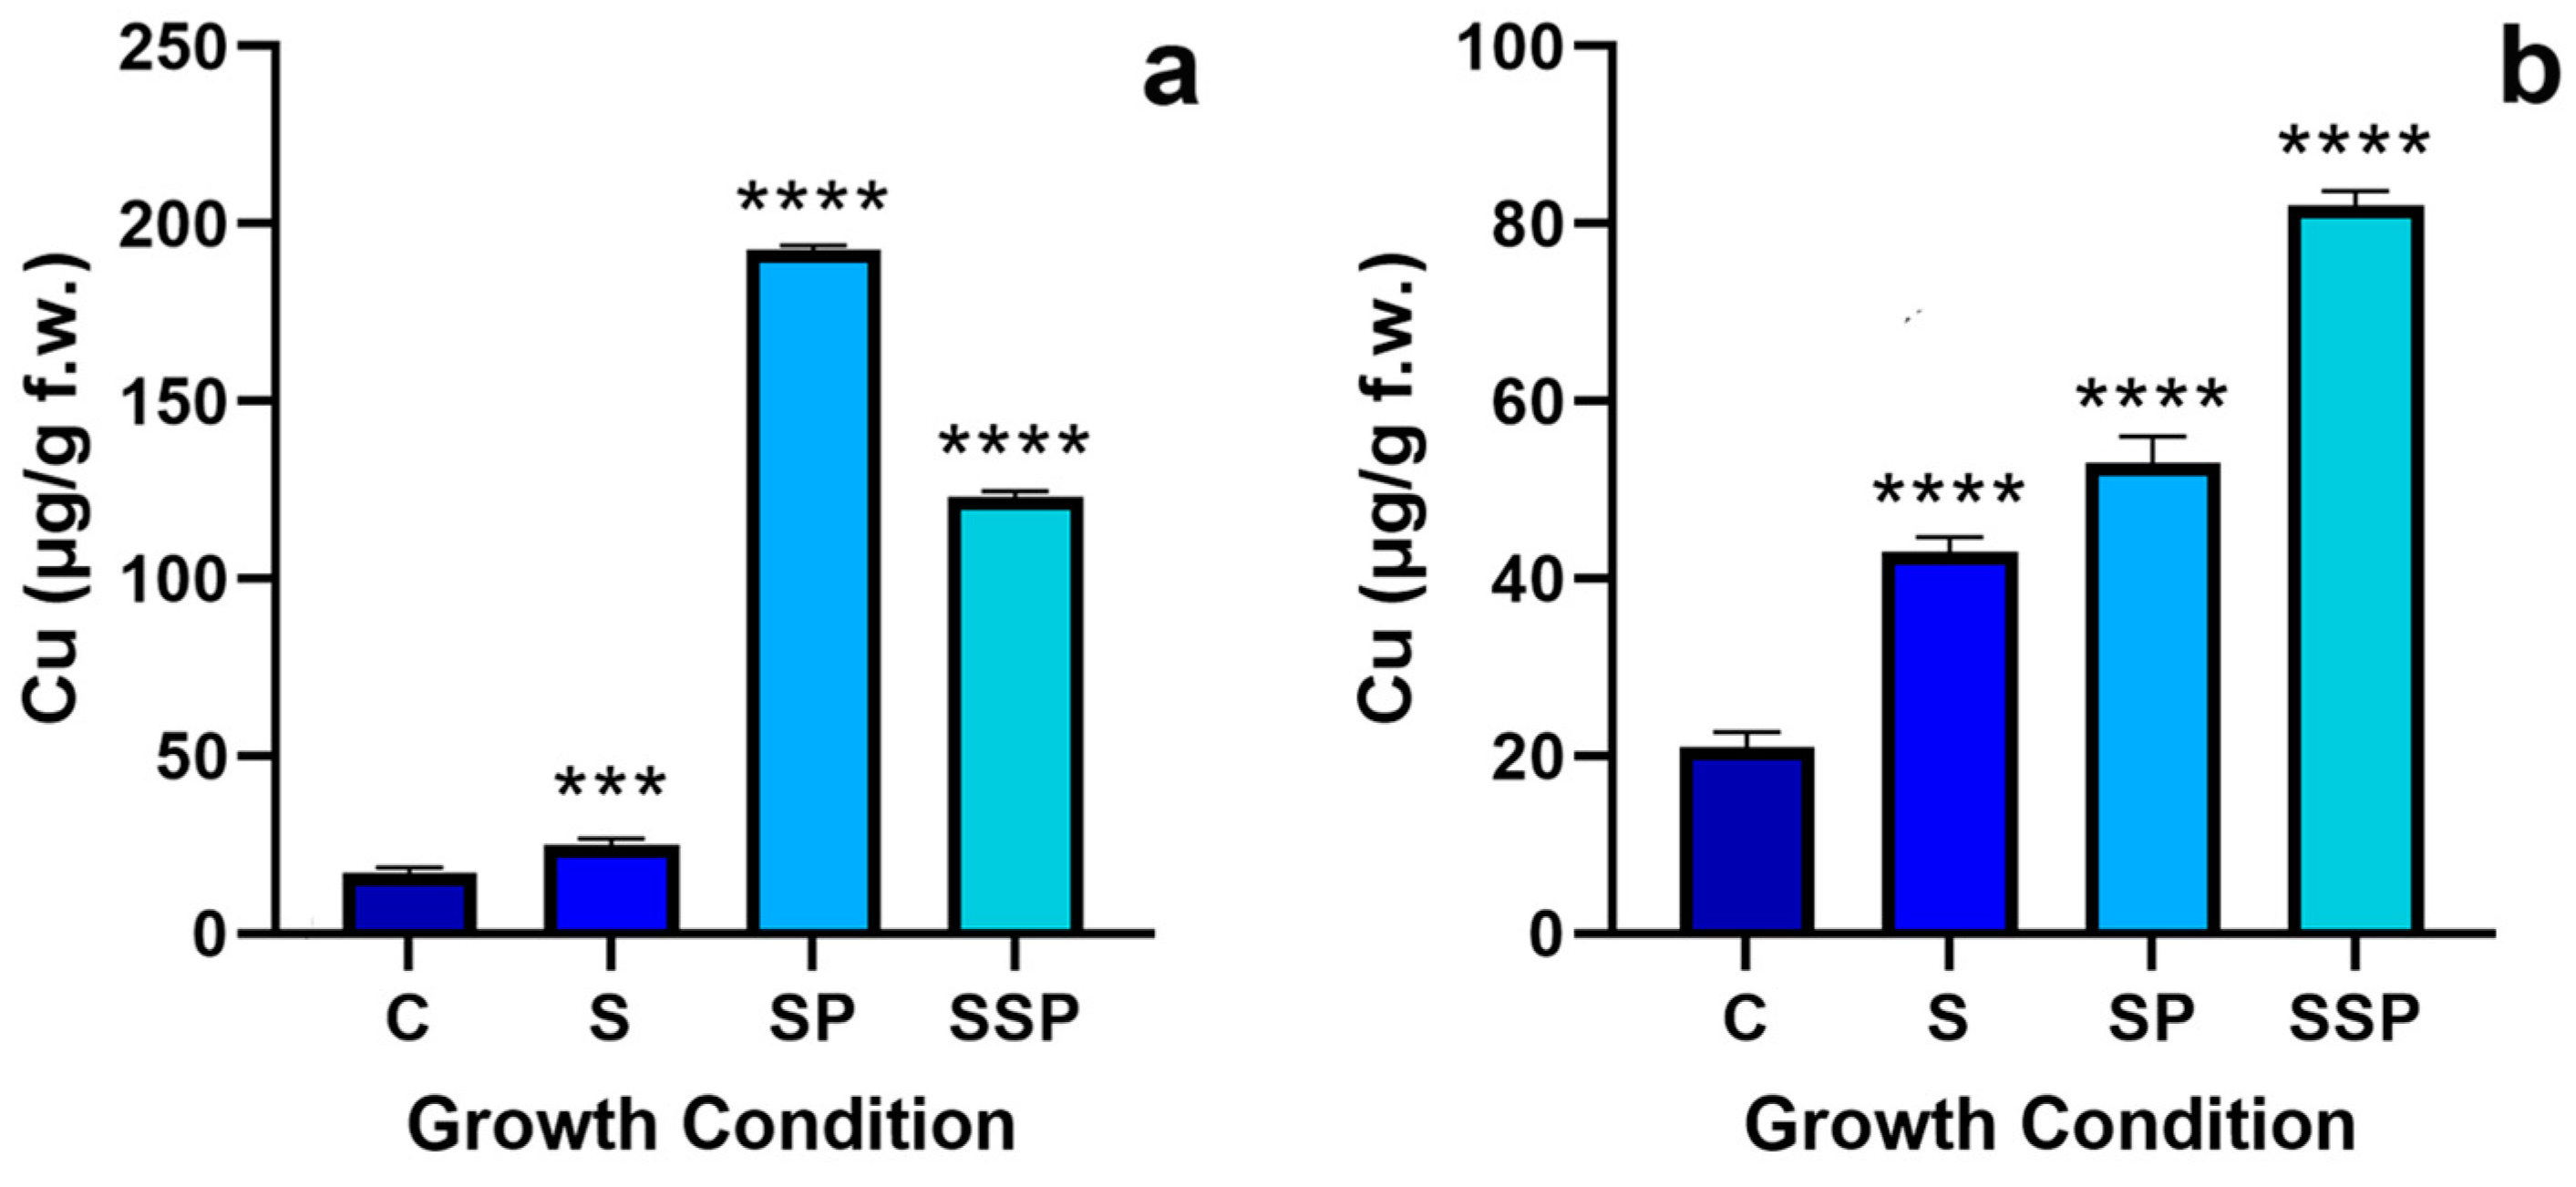
Figure 1. Copper (Cu) content in shoots (a) and roots (b) of S. lycopersicum (cv. Gold Nugget) plants grown in a nutrient medium (C), nutrient medium supplemented with 8 mg/L Cu ions (S), nutrient medium sprayed with the equivalent of 6 kg/ha/year of Cu (SP) and nutrient medium supplemented with 8 mg/L Cu ions and sprayed with the equivalent of 6 kg/ha/year of Cu (SSP). Values presented are mean ± SD. * above bars represent significant differences from the control at *** p < 0.001, **** p < 0.0001.
Horticulturae 09 00323 g001
Figure 2. Nitrate (NO3) content in leaves (a) and roots (b) of S. lycopersicum (cv. Gold Nugget) plants grown in nutrient medium (C), nutrient medium supplemented with 8 mg/L Cu ions (S), nutrient medium sprayed with the equivalent of 6 kg/ha/year of Cu (SP) and nutrient medium supplemented with 8 mg/L Cu ions and sprayed with the equivalent of 6 kg/ha/year of Cu (SSP). Values presented are mean ± SD. * and ns (not significant, p > 0.05) above bars represent significant differences from the control at * p < 0.05, ** p < 0.01.
Horticulturae 09 00323 g002
Figure 3. Nitrate reductase (NR) activity in leaves (a) and roots (b) of S. lycopersicum (cv. Gold Nugget) plants grown in nutrient medium (C), nutrient medium supplemented with 8 mg/L Cu ions (S), nutrient medium sprayed with the equivalent of 6 kg/ha/year of Cu (SP) and nutrient medium supplemented with 8 mg/L Cu ions and sprayed with the equivalent of 6 kg/ha/year of Cu (SSP). Values presented are mean ± SD. ns (not significant, p > 0.05).
Horticulturae 09 00323 g003
Figure 4. Glutamine synthetase (GS) activity in leaves (a) and roots (b) of S. lycopersicum (cv. Gold Nugget) plants grown in nutrient medium (C), nutrient medium supplemented with 8 mg/L Cu ions (S), nutrient medium sprayed with the equivalent of 6 kg/ha/year of Cu (SP) and nutrient medium supplemented with 8 mg/L Cu ions and sprayed with the equivalent of 6 kg/ha/year of Cu (SSP). Values presented are mean ± SD. * and ns (not significant, p > 0.05) above bars represent statistically significant differences from the control at * p < 0.05, **** p < 0.0001.
Horticulturae 09 00323 g004
Figure 5. Glutamate dehydrogenase (GDH) activity in leaves (a) and roots (b) of S. lycopersicum (cv. Gold Nugget) plants grown in nutrient medium (C), nutrient medium supplemented with 8 mg/L Cu ions (S), nutrient medium sprayed with the equivalent of 6 kg/ha/year of Cu (SP) and nutrient medium supplemented with 8 mg/L Cu ions and sprayed with the equivalent of 6 kg/ha/year of Cu (SSP). Values presented are mean ± SD. * and ns (not significant, p > 0.05) above bars represent significant differences from the control at * p < 0.05, ** p < 0.01.
Horticulturae 09 00323 g005
Figure 6. Proline content in leaves (a) and roots (b) of S. lycopersicum (cv. Gold Nugget) plants grown in nutrient medium (C), nutrient medium supplemented with 8 mg/L Cu ions (S), nutrient medium sprayed with the equivalent of 6 kg/ha/year of Cu (SP) and nutrient medium supplemented with 8 mg/L Cu ions and sprayed with the equivalent of 6 kg/ha/year of Cu (SSP). Values presented are mean ± SD. * and ns (not significant, p > 0.05) above bars represent significant differences from the control at * p < 0.05.
Horticulturae 09 00323 g006
Figure 7. Hydrogen peroxide (H2O2) content in leaves (a) and roots (b) of S. lycopersicum plants grown in nutrient medium (C), nutrient medium supplemented with 8 mg/L Cu ions (S), nutrient medium sprayed with the equivalent of 6 kg/ha/year of Cu (SP) and nutrient medium supplemented with 8 mg/L Cu ions and sprayed with the equivalent of 6 kg/ha/year of Cu (SPP). Values presented are mean ± SD. * and ns (not significant, p > 0.05) above bars represent significant differences from the control at * p < 0.05, ** p < 0.01, *** p < 0.001.
Horticulturae 09 00323 g007
Figure 8. Total ascorbate (TA) content in leaves (a) and roots (b) of S. lycopersicum plants grown in nutrient medium (C), nutrient medium supplemented with 8 mg/L Cu ions (S), nutrient medium sprayed with the equivalent of 6 kg/ha/year of Cu (SP) and nutrient medium supplemented with 8 mg/L Cu ions and sprayed with the equivalent of 6 kg/ha/year of Cu (SPP). Values presented are mean ± SD. * and ns (not significant, p > 0.05) above bars represent significant differences from the control at ** p < 0.01, *** p < 0.001.
Horticulturae 09 00323 g008
Figure 9. Reduced ascorbate (AsA) content in leaves (a) and roots (b) of S. lycopersicum plants grown in nutrient medium (C), nutrient medium supplemented with 8 mg/L Cu ions (S), nutrient medium sprayed with the equivalent of 6 kg/ha/year of Cu (SP) and nutrient medium supplemented with 8 mg/L Cu ions and sprayed with the equivalent of 6 kg/ha/year of Cu (SPP). Values presented are mean ± SD. * and ns (not significant, p > 0.05) above bars represent significant differences from the control at * p < 0.05, ** p < 0.01, **** p < 0.0001.
Horticulturae 09 00323 g009
Figure 10. Oxidised ascorbate (DHA) content in leaves (a) and roots (b) of S. lycopersicum plants grown in nutrient medium (C), nutrient medium supplemented with 8 mg/L Cu ions (S), nutrient medium sprayed with the equivalent of 6 kg/ha/year of Cu (SP) and nutrient medium supplemented with 8 mg/L Cu ions and sprayed with the equivalent of 6 kg/ha/year of Cu (SSP). Values presented are mean ± SD. * and ns (not significant, p > 0.05) above bars represent significant differences from the control at * p < 0.05, ** p < 0.01.
Horticulturae 09 00323 g010
Figure 11. Glutathione (GSH) content in leaves of S. lycopersicum plants grown in nutrient medium (C), nutrient medium supplemented with 8 mg/L Cu ions (S), nutrient medium sprayed with the equivalent of 6 kg/ha/year of Cu (SP) and nutrient medium supplemented with 8 mg/L Cu ions and sprayed with the equivalent of 6 kg/ha/year of Cu (SPP). Values presented are mean ± SD. ns (not significant, p > 0.05).
Horticulturae 09 00323 g011
Figure 12. Typical results for the GR semi-quantitative RT-PCR analysis by 1% (w/v) agarose gel electrophoresis in leaves (a) and roots (b) of S. lycopersicum plants grown in nutrient medium (C), nutrient medium supplemented with 8 mg/L Cu ions (S), nutrient medium sprayed with the equivalent of 6 kg/ha/year of Cu (SP) and nutrient medium supplemented with 8 mg/L Cu ions and sprayed with the equivalent of 6 kg/ha/year of Cu (SSP). EF1 stands for elongation factor 1; GR stands for glutathione reductase.
Horticulturae 09 00323 g012
Table 1. Gene-specific primers for glutathione reductase (GR; accession number: NM_001321394.1) and elongation factor 1 (EF1 [44]) and expected amplicon sizes produced by each primer pair for the performed semi-quantitative polymerase chain reactions.
GenePrimerSequenceAmplicon Size (bp)
GRForward5′-AAAGACCGAGGAGATTGTACG-3′322
Reverse5′-CATTCCTCGCCATATAGAAGC-3′
EF1Forward5′-GGAACTTGAGAAGGAGCCTAAG-3′158
Reverse5′-CAACACCAACAGCAACAGTCT-3′
Disclaimer/Publisher’s Note: The statements, opinions and data contained in all publications are solely those of the individual author(s) and contributor(s) and not of MDPI and/or the editor(s). MDPI and/or the editor(s) disclaim responsibility for any injury to people or property resulting from any ideas, methods, instructions or products referred to in the content.