Article

Nutrient Changes in Berries of “Anab-e-Shahi” and “Perllete” Varieties of Grapes with Advancing Phenology in the Growing Season

1
Division of Fruit Science, Sher-e-Kashmir University of Agricultural Sciences & Technology of Kashmir, Shalimar, Srinagar 190025, India
2
Central Institute of Temperate Horticulture, Rangreth, Srinagar 190007, India
3
KVK Shopian, Sher-e-Kashmir University of Agricultural Sciences & Technology of Kashmir, Shalimar, Srinagar 190025, India
4
Division of Food Science and Technology, Sher-e-Kashmir University of Agricultural Sciences & Technology of Kashmir, Shalimar, Srinagar 190025, India
5
Division of Plant Pathology, Sher-e-Kashmir University of Agricultural Sciences & Technology of Kashmir, Shalimar, Srinagar 190025, India
6
Department of Zoology, College of Science, King Saud University, Riyadh 11421, Saudi Arabia
*
Author to whom correspondence should be addressed.
Horticulturae 2023, 9(2), 178; https://doi.org/10.3390/horticulturae9020178
Submission received: 29 August 2022 / Revised: 25 January 2023 / Accepted: 27 January 2023 / Published: 30 January 2023
(This article belongs to the Special Issue Advancements in the Sustainable Viticulture of Grapes)

Abstract

:
Understanding how nutrients accumulate and change throughout the developmental stages according to the BBCH scale can be a very effective technique for developing fertilization programmes for high-quality, marketable grape production. Accordingly, the macro- and micronutrient concentrations at different growth stages were analyzed for two commercial grape cultivars, viz., “Anab-e-Shahi” and “Perlette”, by using an extended BBCH scale. The results show nitrogen content was reduced during the sampling period (D1 to D6) from 1.76 percent to 1.09 percent. Potassium concentration in developing berries kept on increasing from 0.15%, at principal growth stage 7 with BBCH code 73 (D1), to 0.26% at principal growth stage 8 code 89 (D6). The lowest phosphorus content of 253.88 ppm and the highest of 338.43 ppm were found in growth stages D1 and D6, respectively. The berry Ca however showed an increase first and thereafter decreased to 225.18 ppm at harvest. Mg content also recorded a similar trend from stages D1 to D6 of the BBCH scale and decreased to 116.08 ppm at D6. B and Cu concentrations increased from D1 to D6, and Mn and Zn increased first and decreased thereafter until harvest. No specific trend was recorded in Fe concentration. The concentration of nutrients in berries at different developmental stages can be used as the standard reference for growing berries using proper fertilization.

1. Introduction

Different physiological processes in plants are highly dependent on nutrient availability and accumulation, particularly the macronutrients [1,2] for increasing growth as well as yield potential [3]. Indicators of nutrient requirements at each stage of plant development, such as nutrient accumulation or depletion curves, are useful [4]. Understanding the accumulation of macro and micronutrients can help in framing a suitable fertilization program for table grapes [5]. Berries need to be defect-free in order to be considered marketable, which is impossible without berries developing properly until harvest. The overall development, physiology, and quality of vines are significantly influenced by the supply and accumulation of various macro- and micronutrients [6]. The soil mineral composition has an essential influence on grape quality [7]. However, the varying mobility of nutrients to the sink (berries) makes it important to understand and predict concentrations of such nutrients at different developmental stages in the berries as well. The essential nutrient elements can have higher mobility in the phloem (e.g., magnesium, phosphorus, sulfur, and potassium) or lower mobility in the phloem (e.g., calcium and manganese) and may also have variable and conditional mobility in the phloem (e.g., zinc, boron, iron, and copper) [8]. Grapevines have been the subject of extensive research throughout the years, as grape production worldwide is continuously increasing. According to the market survey, larger and sweeter table grape berries have more consumer acceptability. Therefore, the precision and timely assessment of vine nutrition needs to be worked out so that quality berry production is achieved. Little information is available regarding the accumulation patterns of different nutrients in berries of grapes. This two-year study aimed to find out the different macro- and micronutrients in berries at different phenological stages. This data will help sustainable management of production and in defining the demand for macro- and micronutrients of table grapes at various developmental stages. The data also shall familiarize us with the metabolic norms associated thereof.

2. Materials and Methods

The experiment was carried out on two varieties of grape, viz., Perlette and Anab-e-Shahi, in the experimental orchard of the Division of Fruit Science, SKUAST-K. The experimental farm is located at an elevation of 1570 m above mean sea level and between 34°75′ north latitude and 74°50′ east longitudes. Uniform and standard cultural operations were given to all the experimental materials. Vines were trained under a bower system with north–south orientation, planted at a spacing of 3 m × 3 m (1111 plants per hectare). The experimental vines were supplied with 1000 g urea, 500 g DAP, and 800 g MOP per vine during the growing year [9]. The vines were irrigated twice per week until two weeks before harvest. The pH of the soil was 6.7, while electrical conductivity and organic carbon were 0.27 dsm−1 and 0.75%, respectively, which were found to be in the optimum range. Grape berries from both cultivars were harvested at different growth stages from D1 to D6 (D1—Stage 7 code 73, D2—Stage 7 code 75, D3—Stage 7 code 79, D4—Stage 8 code 81, D5—Stage 8 code 83, and D6—stage 8 code 89) according to the BBCH scale. Five uniform-size berry bunches were visually selected from each vine plant under experimentation and harvested at each sampling date for further evaluation. A 25 g sample of fresh berries harvested from the experimental vines was crushed and processed into dry samples for nutrient estimation. The N content was analyzed with the Kjeldahl method. Micronutrients and other macronutrients (K, P, Mg, Ca) were analyzed by preparing a 0.5 g sample and digesting it in a flask of 100 mL, with a di-acid mixture containing nitric acid and perchloric acid at a ratio of 9:4. Thereafter, at 115–118 °C it was put on the hot plate. The filtered sample diluted with double distilled water was used to prepare a 50 mL volume and used for the estimation of nutrients. The P content was analyzed with the ammonium molybdate/ammonium metavanadate method, and K and Ca were analyzed with the help of flame photometry. An atomic absorption spectrophotometer was used to find out the Mg content and micronutrients, except for B which was analyzed with a double beam spectrophotometer. Methods applied with respective LOD, LOQ, and wavelength for each nutrient analyzed are given as supplementary data (Supplementary Data S1). The treatments were subjected to a randomized complete block design with three replications and ten plants per replication. Statistical analysis was done on the two-year pooled data at a critical difference of 5% level of significance using SPSS software and as recommended by Gomez and Gomez, 1983 [10].

3. Results

3.1. Macronutrient Changes in Developing Berries of Different Cultivars of Grapes

3.1.1. Nitrogen

The total N content in the berries after fruit set at 30 days from full bloom (D1, Figure 1) was 1.77% dry weight in Perllete and 1.76% in Anab-e-Shahi (Table 1). It represented the highest N content in berries analyzed in the season, indicating a high demand for nitrogen content at the initial stage of berry development. The N content showed a continuous declining trend thereafter until harvest, with an intermittent increase at D3 (Figure 1) when berries were of pea size and begin to hang. The lowest concentration of N was found during the harvesting/maturity of grape berries (D6). The N content at harvest was the lowest in the season (1.14% in Anab-e-Shahi and 1.04% in Perlette). The trend in N concentration shows that earlier in the season, there is a strong movement of N to sink.

3.1.2. Phosphorus

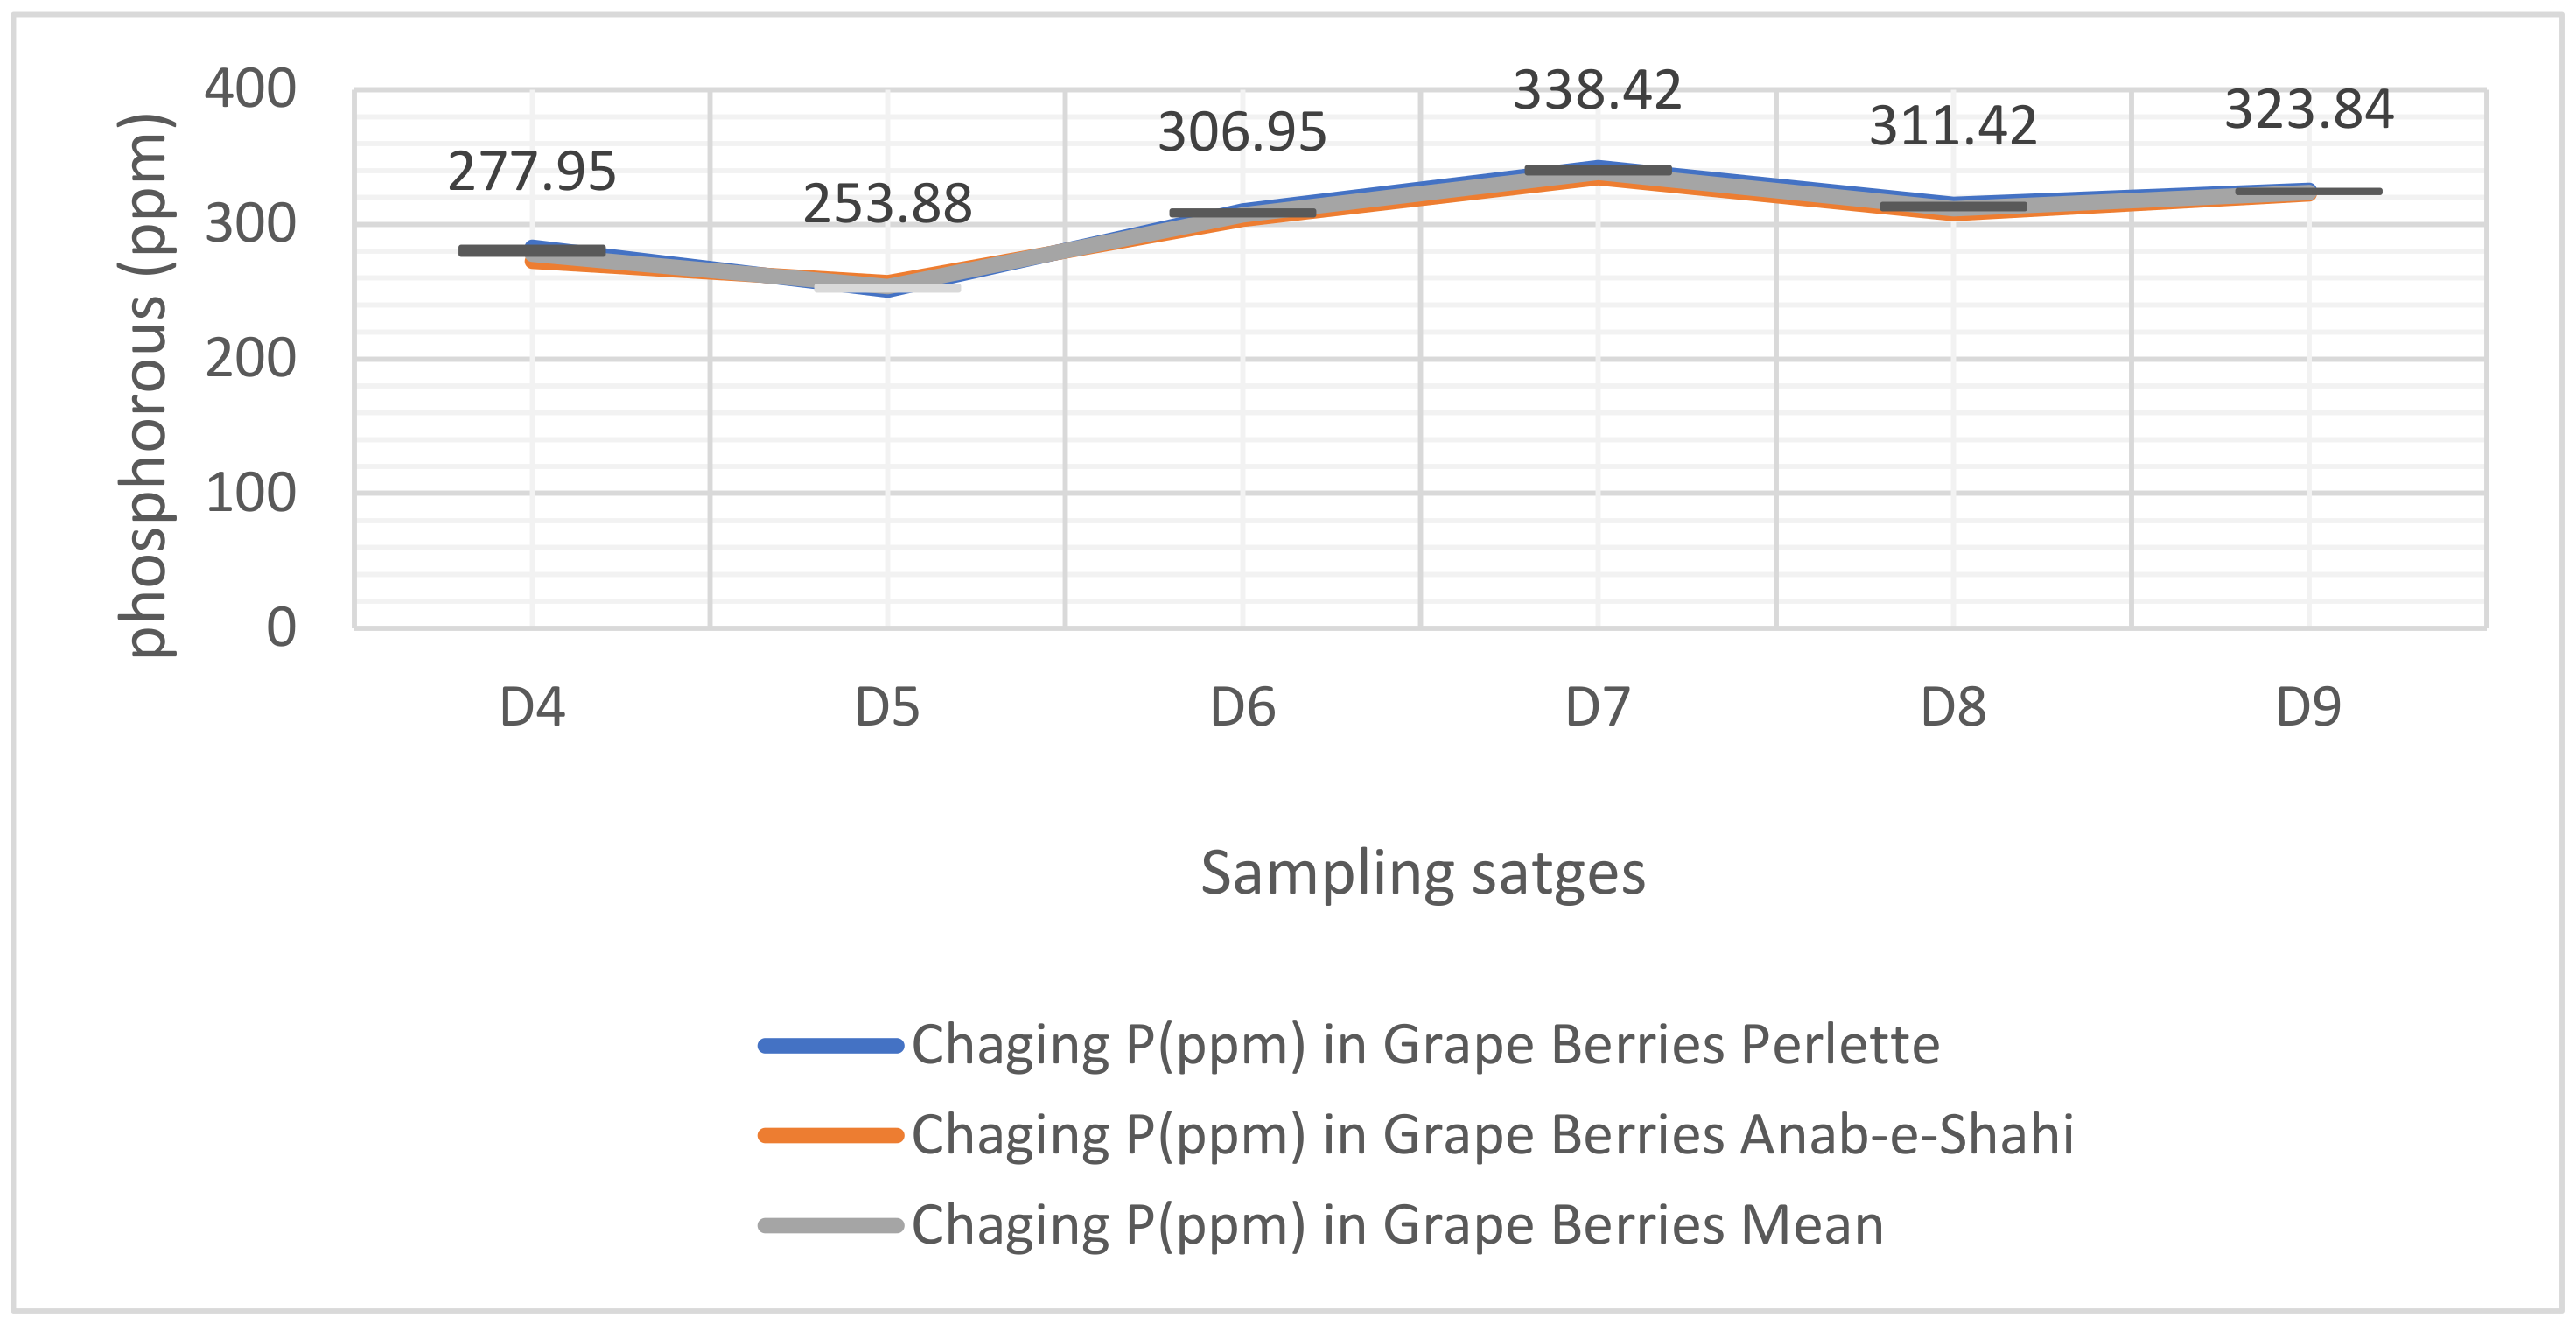
As is evident from Figure 2, the P content in berries kept on accumulating steadily until veraison, and the trend followed by cultivars, viz., Perlette and Anab-e-Shahi, throughout the development was similar, which confirms the movement of P from petiole/leaf to fruit. The P content in the berries at D1 (Figure 2) was 283.19 ppm in Perllete and 272.70 ppm in Anab-e-Shahi (Table 1). Thereafter, 15 days after the earlier sampling, a decrease was recorded in both cultivars (D2), and a sudden upsurge 60 days after full bloom (D3) when berries were of pea size and begin to hang. The sudden increase in berry P content on D3 was due to a slowdown in the physical development of berries concerning breadth, weight, and length in the stage (see Supplementary Data S2). The highest P content of berries was recorded in D4 corresponding to 75 days after full bloom.

3.1.3. Potassium

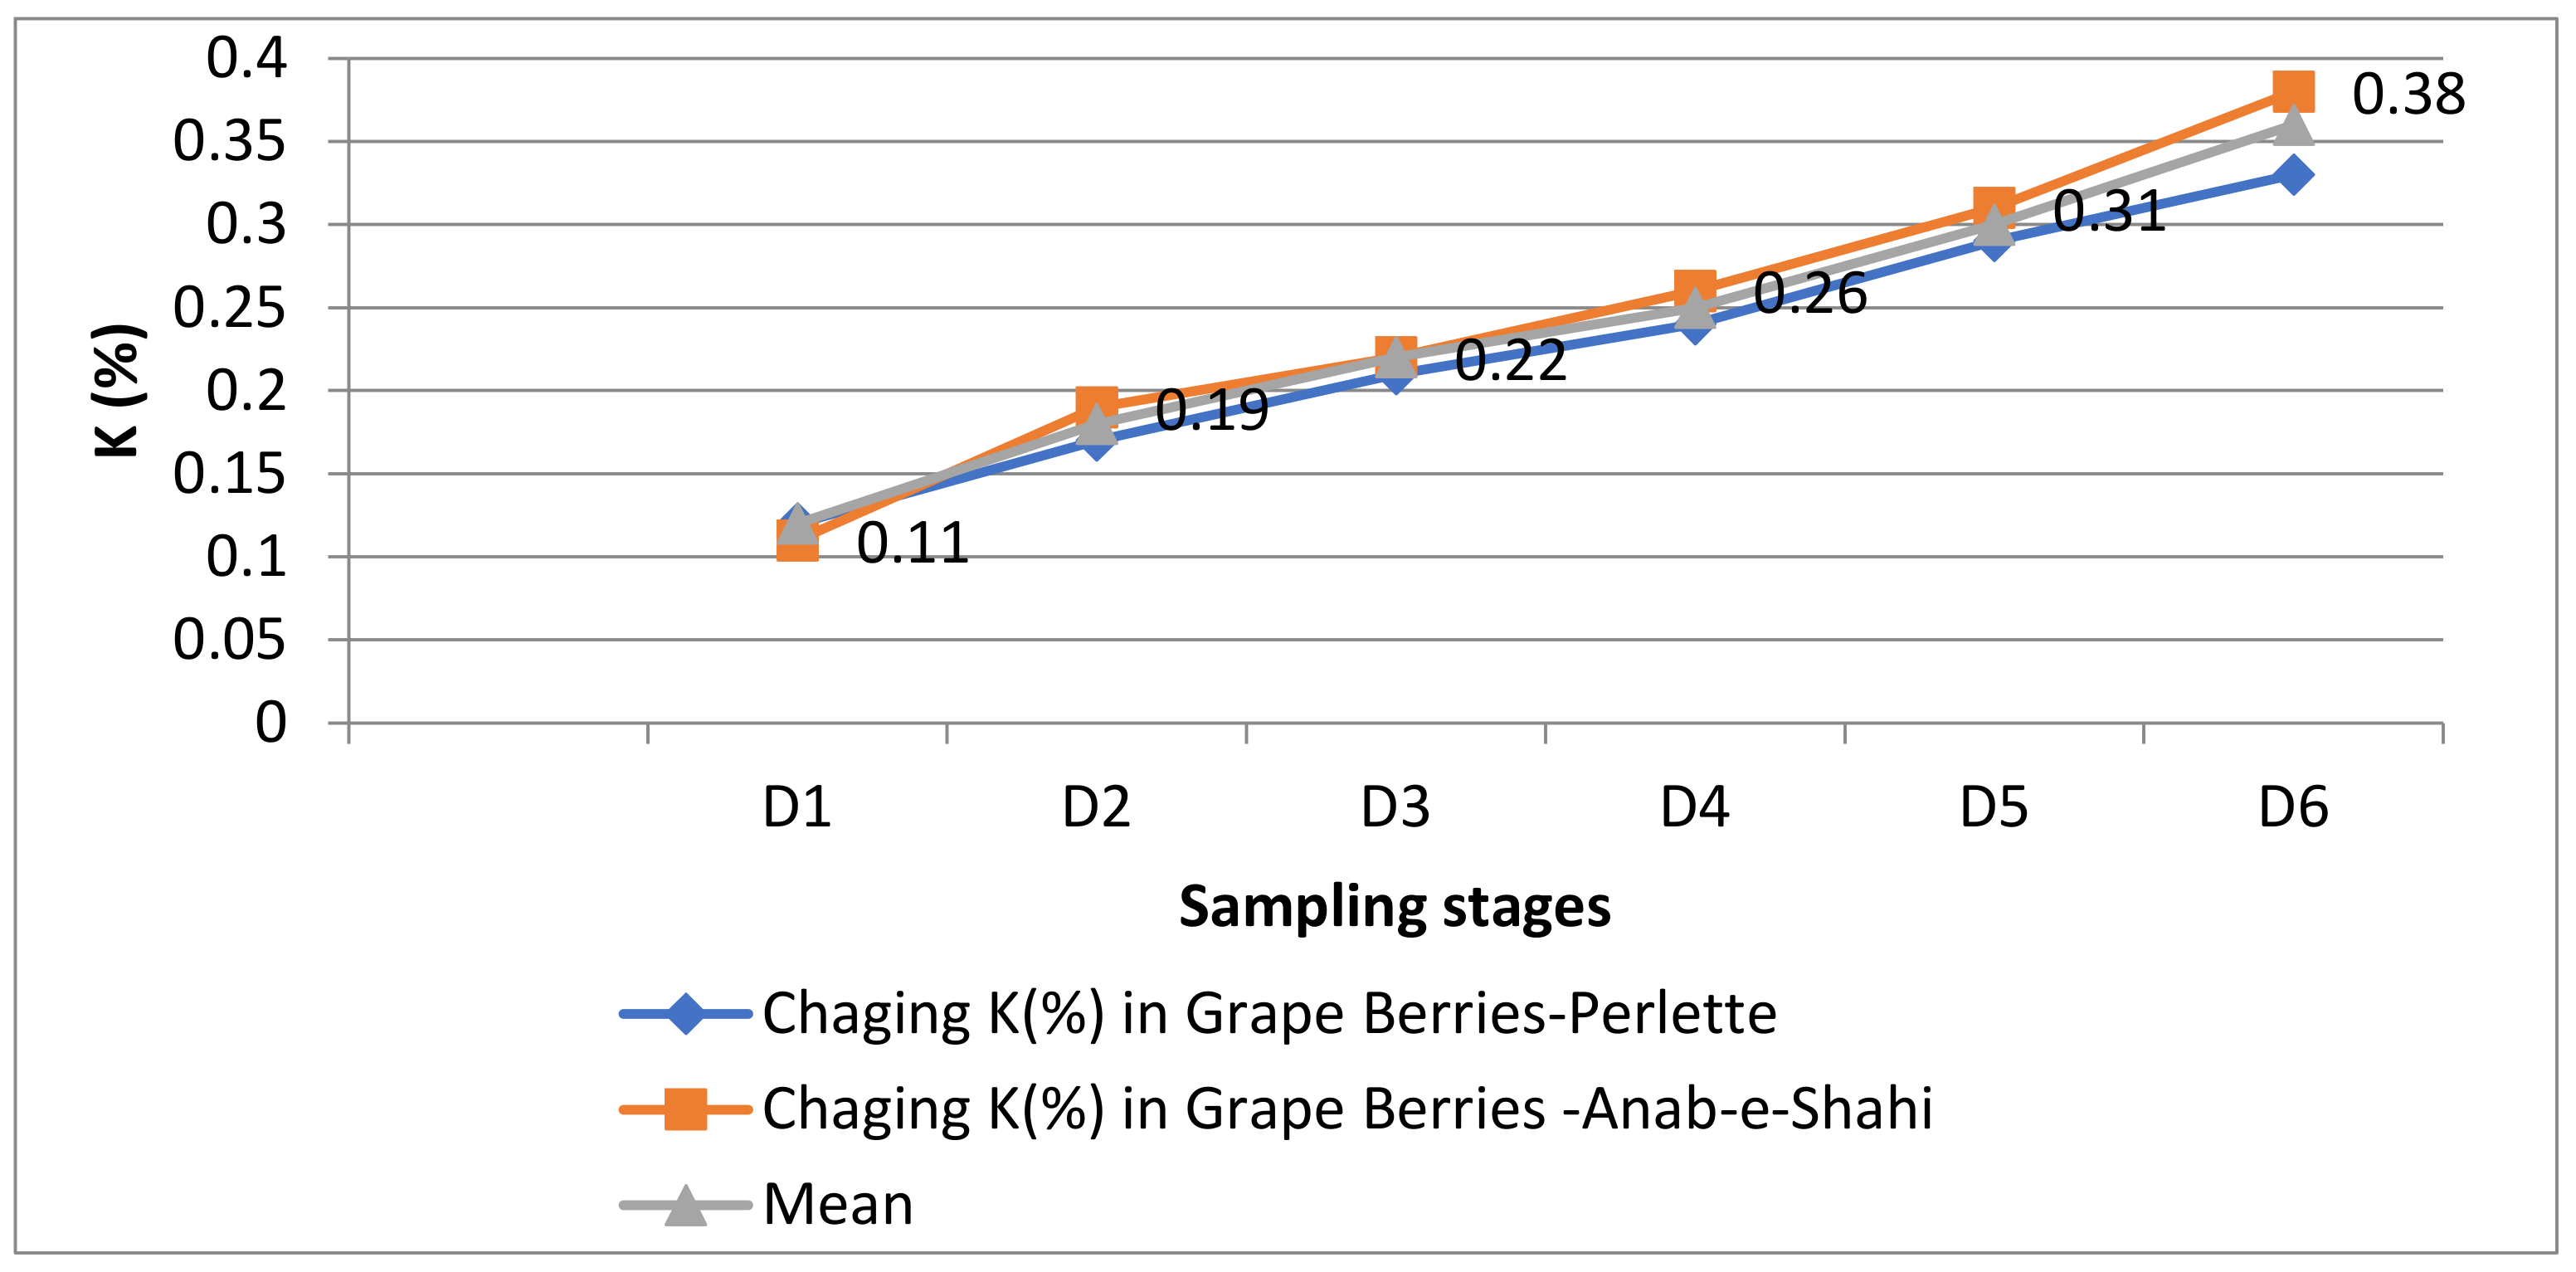
The K content in berries of Anab-e-Shahi and Perlette cultivars kept on accumulating throughout the advancement of developmental stages even after the veraison (Figure 3). The K content at D1 was lowest (0.12%), and the highest K (0.36%) content in berries was recorded after veraison (Figure 3). The potassium content as such shows an increase threefold at maturity when compared to its concentration at (D1) (Table 1). Therefore the potassium content accumulated by the berry is as such greater than the rate of berry growth, thereby nullifying the growth dilution effect. Furthermore, potassium is the second highest nutrient in grape berries after nitrogen. The Anab-e-Shahi cultivar of grape accumulated higher berry potassium content (0.38%). The accumulation in Anab-e-Shahi was higher than Perlette throughout the development and at every phenological stage, with the highest K content after veraison (0.33%).

3.1.4. Calcium

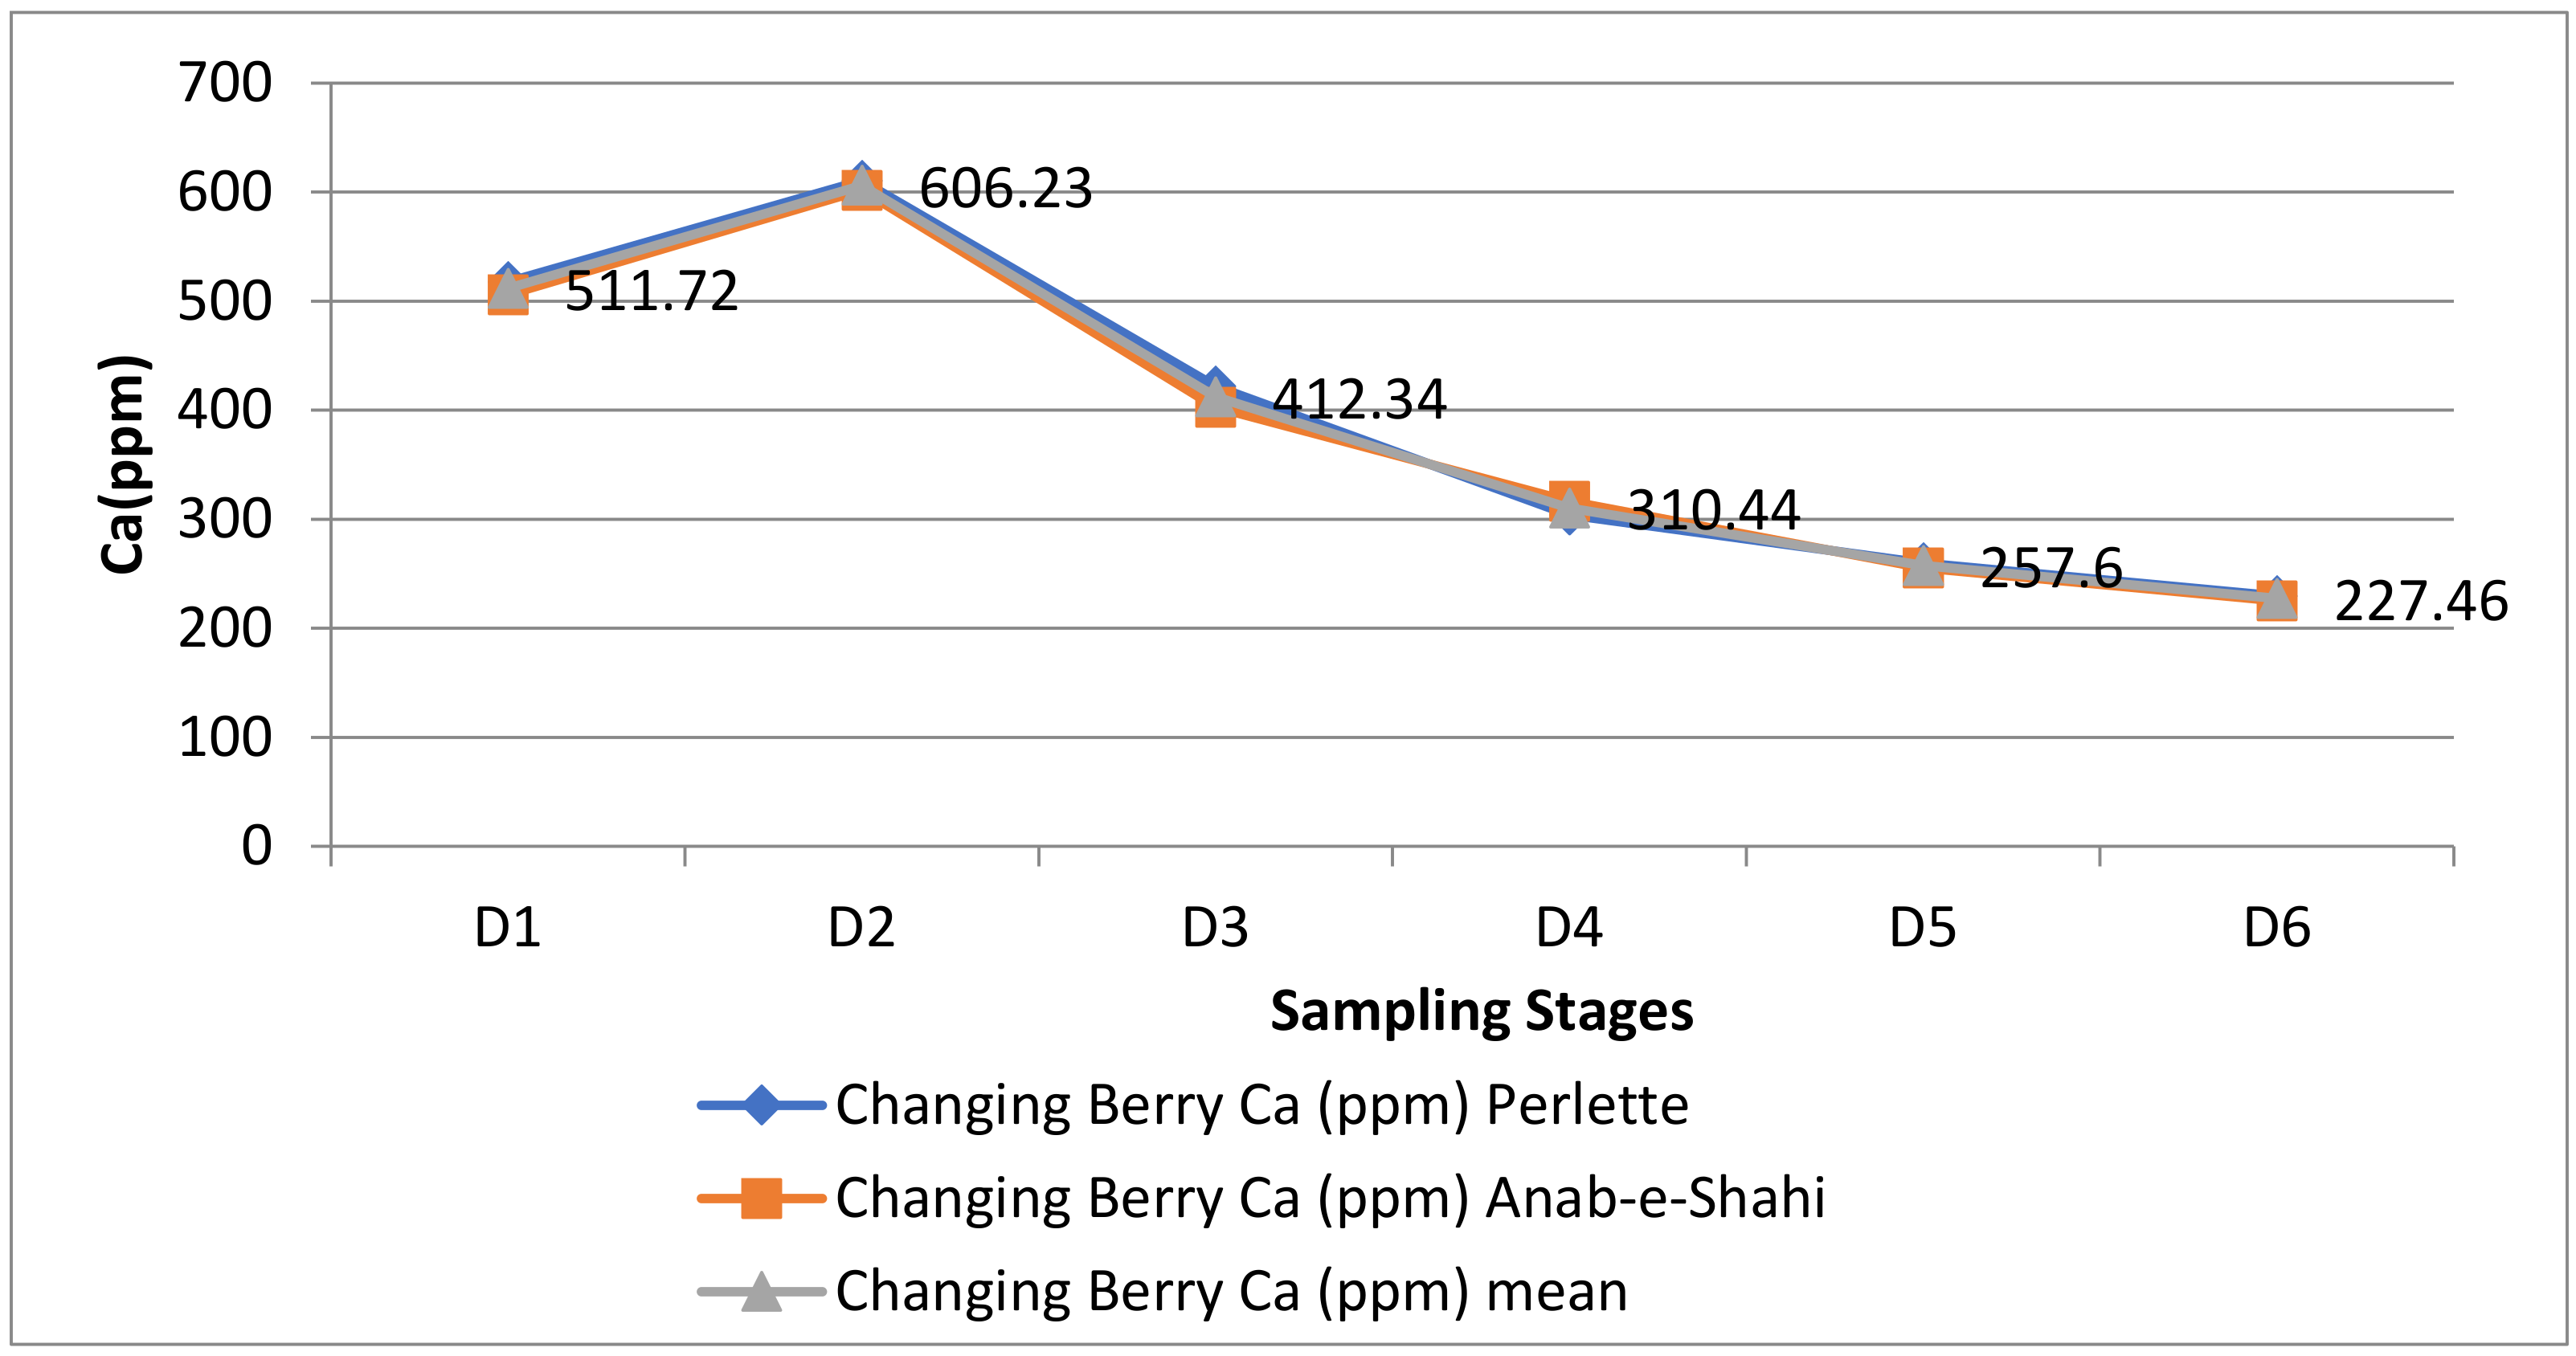
The Ca content in berries of grapes increased at first from D1 to D2. The Ca content in berries decreased (up to 40%) through the season thereafter from 606.23 ppm at D2 to the lowest content of 225.18 ppm at the time of harvest (D6) (Figure 4). Change in Ca content with respect to interaction (date x varieties) was also found significant. The inflow of Ca into the berries is usually attributed to the transport of Ca from the source, viz., petiole/leaf. It can be seen that Perlette has a higher Ca content of 610.92 ppm in D1 compared to Anab-e-Shahi (601.92 ppm) on the same sampling date (Table 2).

3.1.5. Magnesium

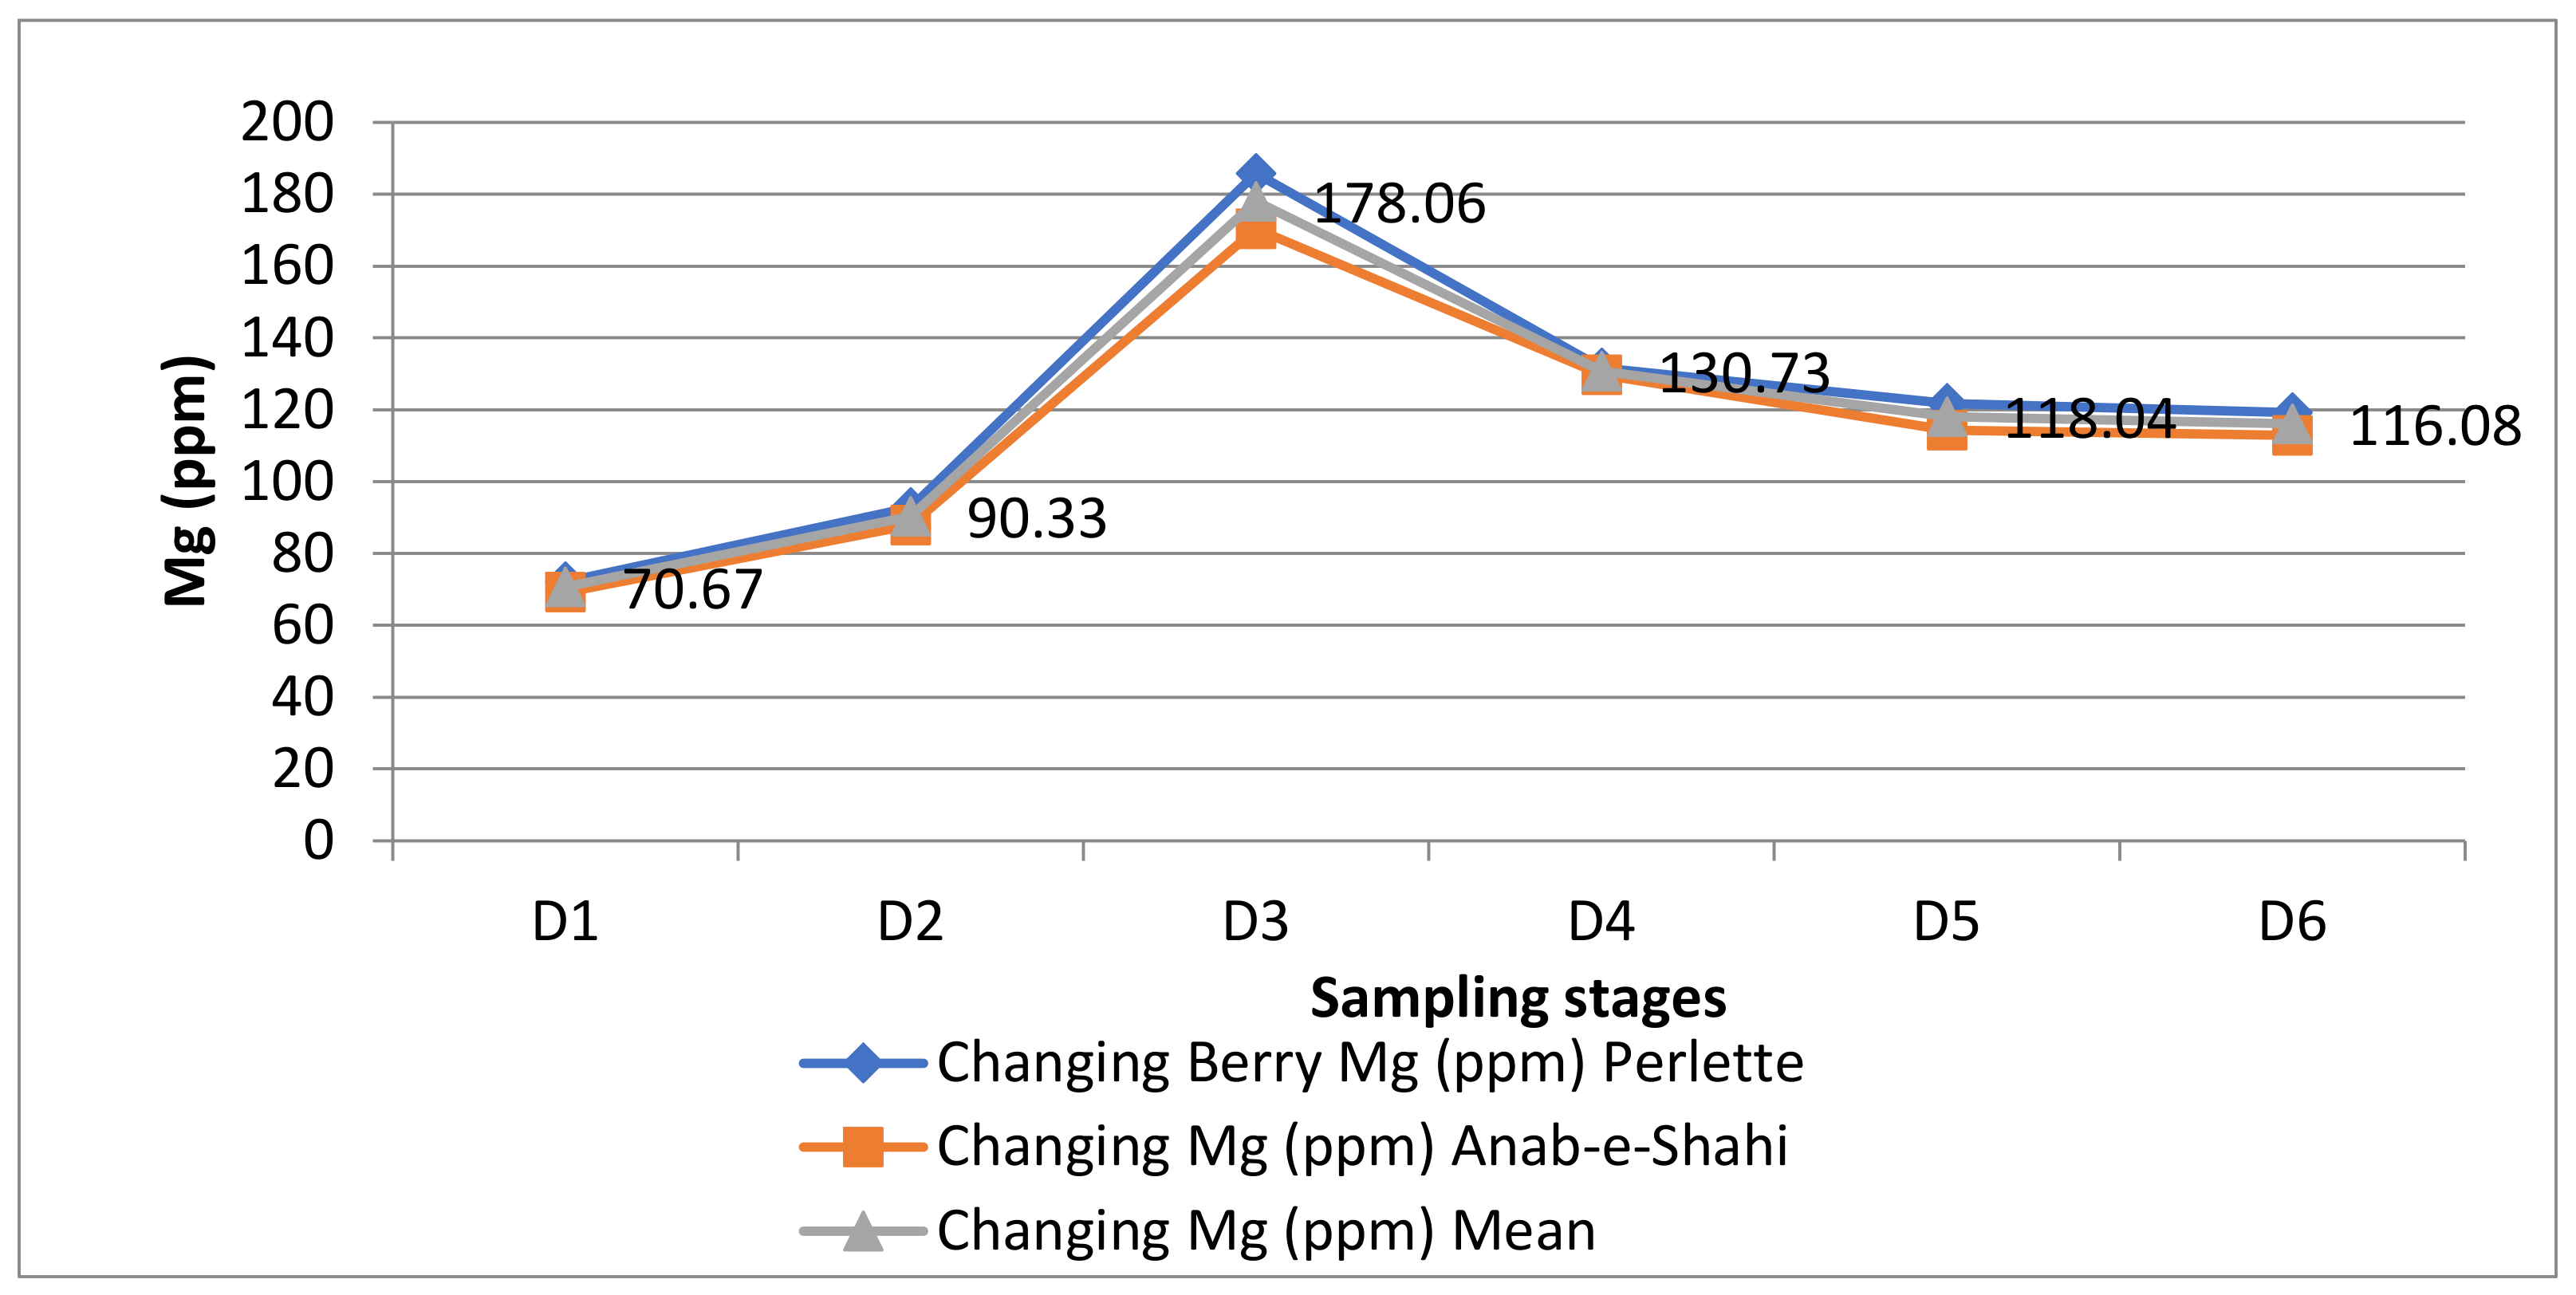
Magnesium is a phloem-mobile element. The concentration of Mg content in the berries (Figure 5) revealed an increase in Mg content until D3, having Mg of 178.06 ppm. Thereafter it decreased to reach its minimum on maturity (D6) (116.08 ppm). The Mg content, however, decreased by 34.12% until harvest to what was observed before the veraison stage. Among the two varieties, Perlette was found to have higher berry Mg all along the developmental stages when compared to Anab-e-Shahi, and recorded peak Mg content (185.74 ppm) when berries were D2 and lowest at growth stage 7 with BBCH code 73 on the extended BBCH Scale (D1) (70.12 ppm). A similar trend was recorded in Anab-e-Shahi with the highest berry Mg content at D3 (170.38 ppm) and lowest (69.17 ppm) at D1 (Table 2).

3.2. Micronutrient Changes in Developing Berries of Grapes

3.2.1. Zinc

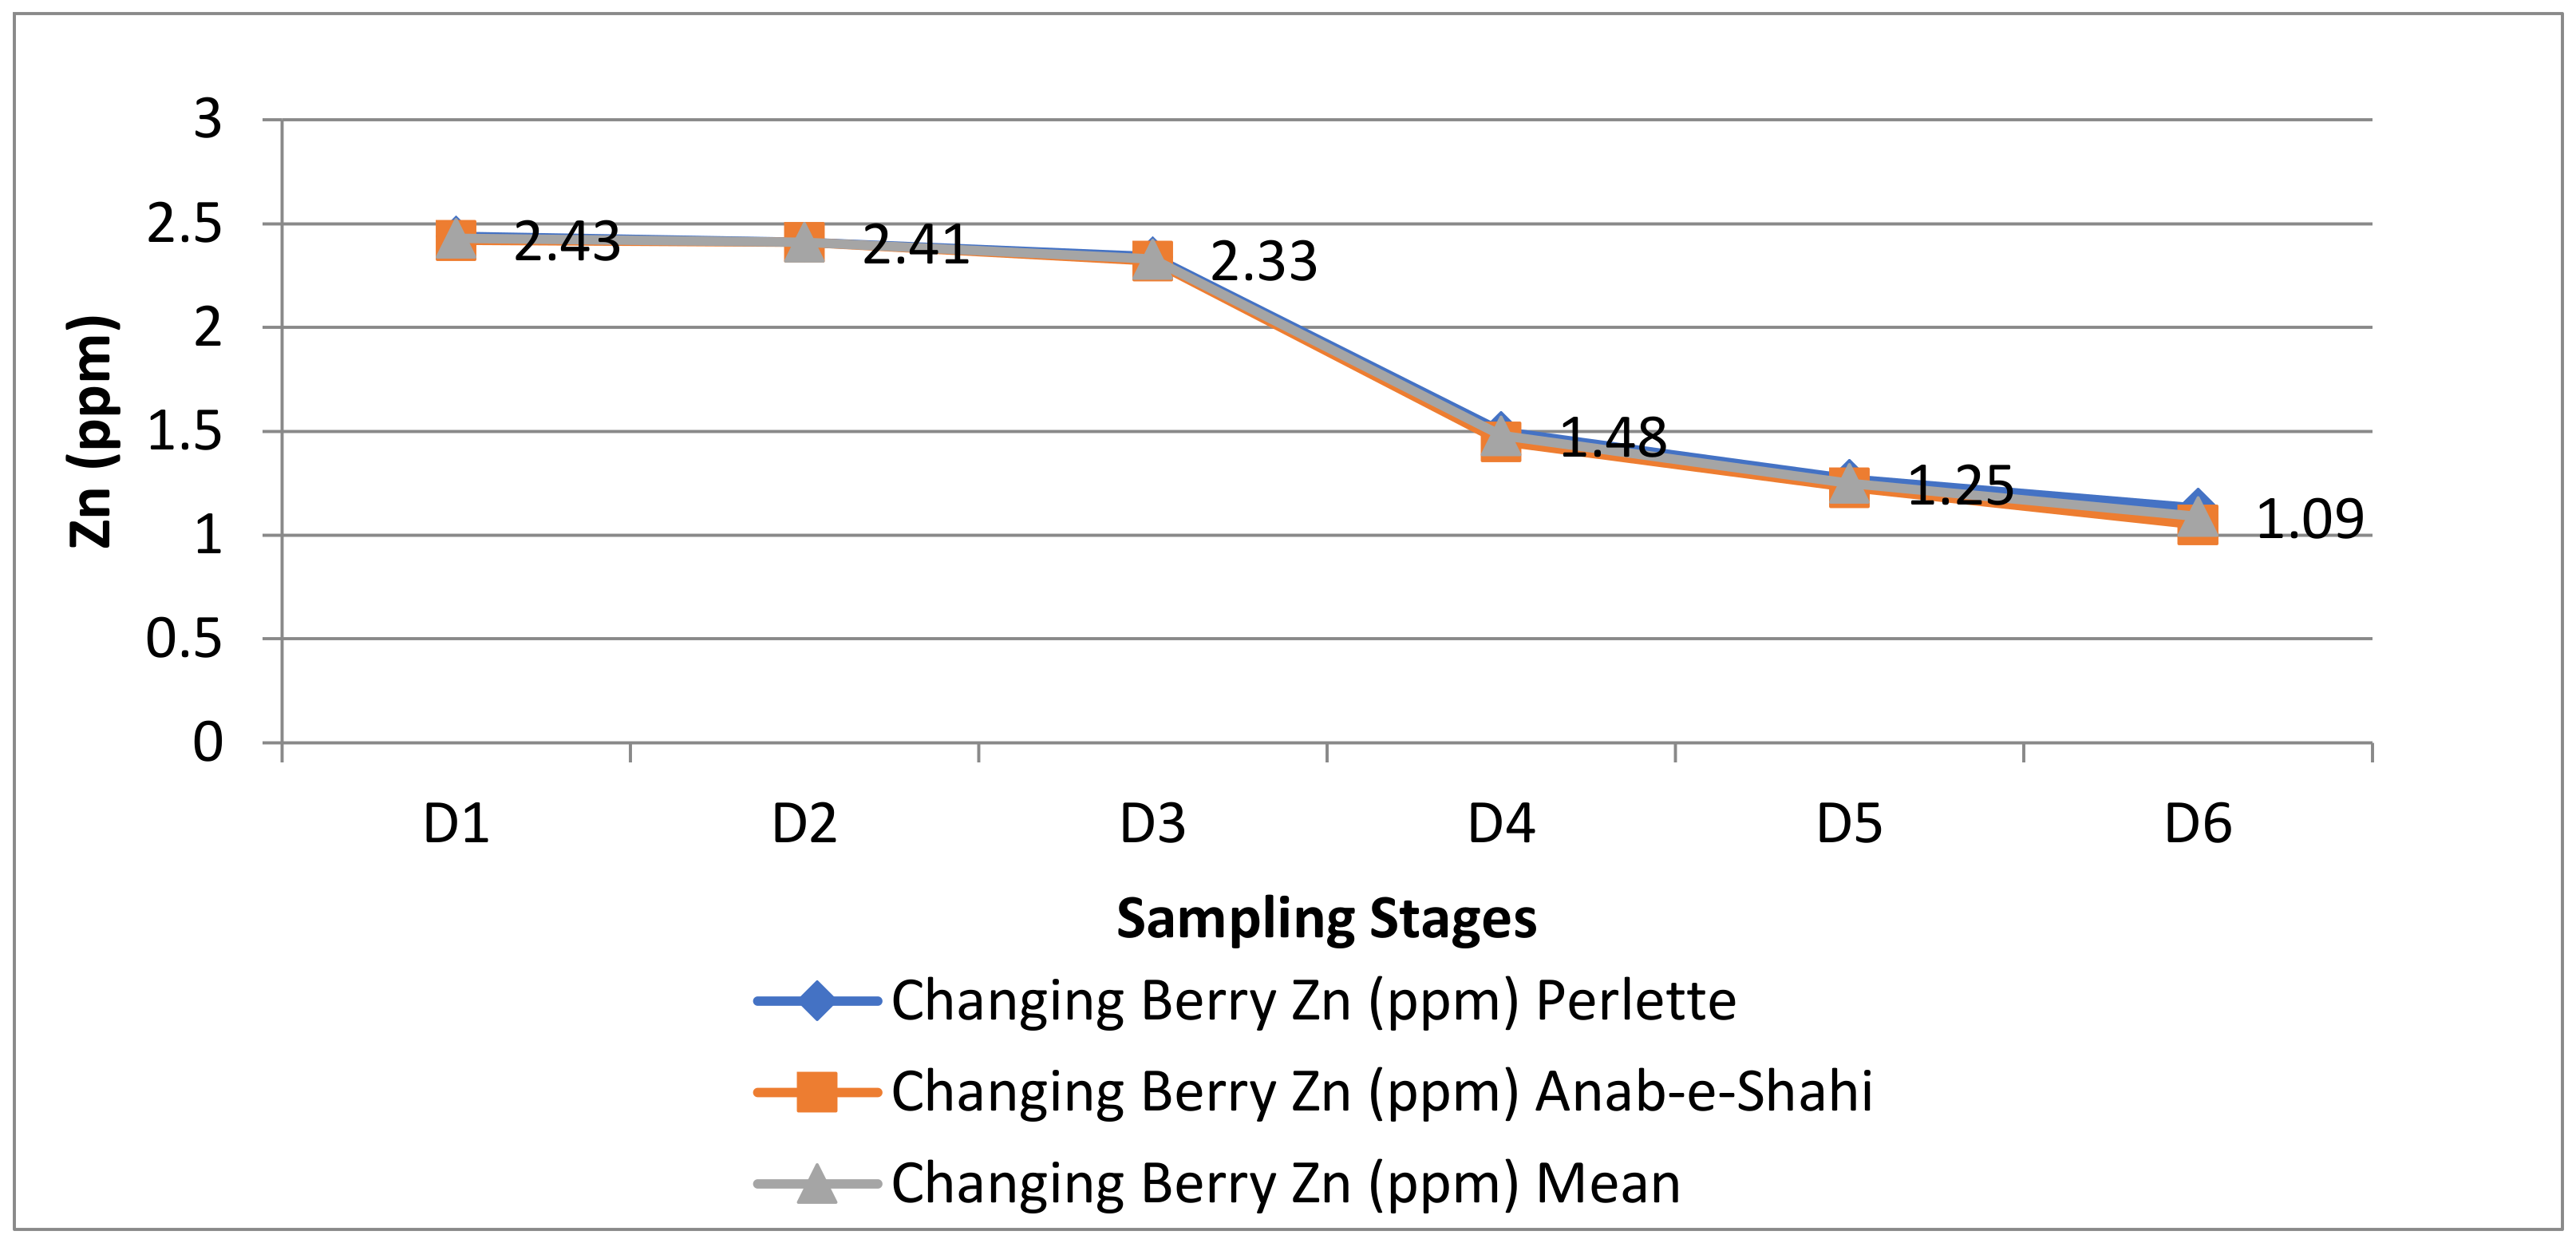
The Zn content in grape berries kept on decreasing immediately after the fruit was set for harvesting (Figure 6). The highest Zn content (2.43 ppm) was recorded on the first sampling date, viz., D1 at 30 days from full bloom, and least (1.09 ppm) in D6. The corresponding decline in the cultivar Perlette was gradual, from a concentration of 2.44 ppm in berries in D1 to 1.13 ppm at D6, compared to the cultivar Anab-e-Shahi from a concentration of 2.42 ppm to 1.05 ppm (Table 3).

3.2.2. Copper

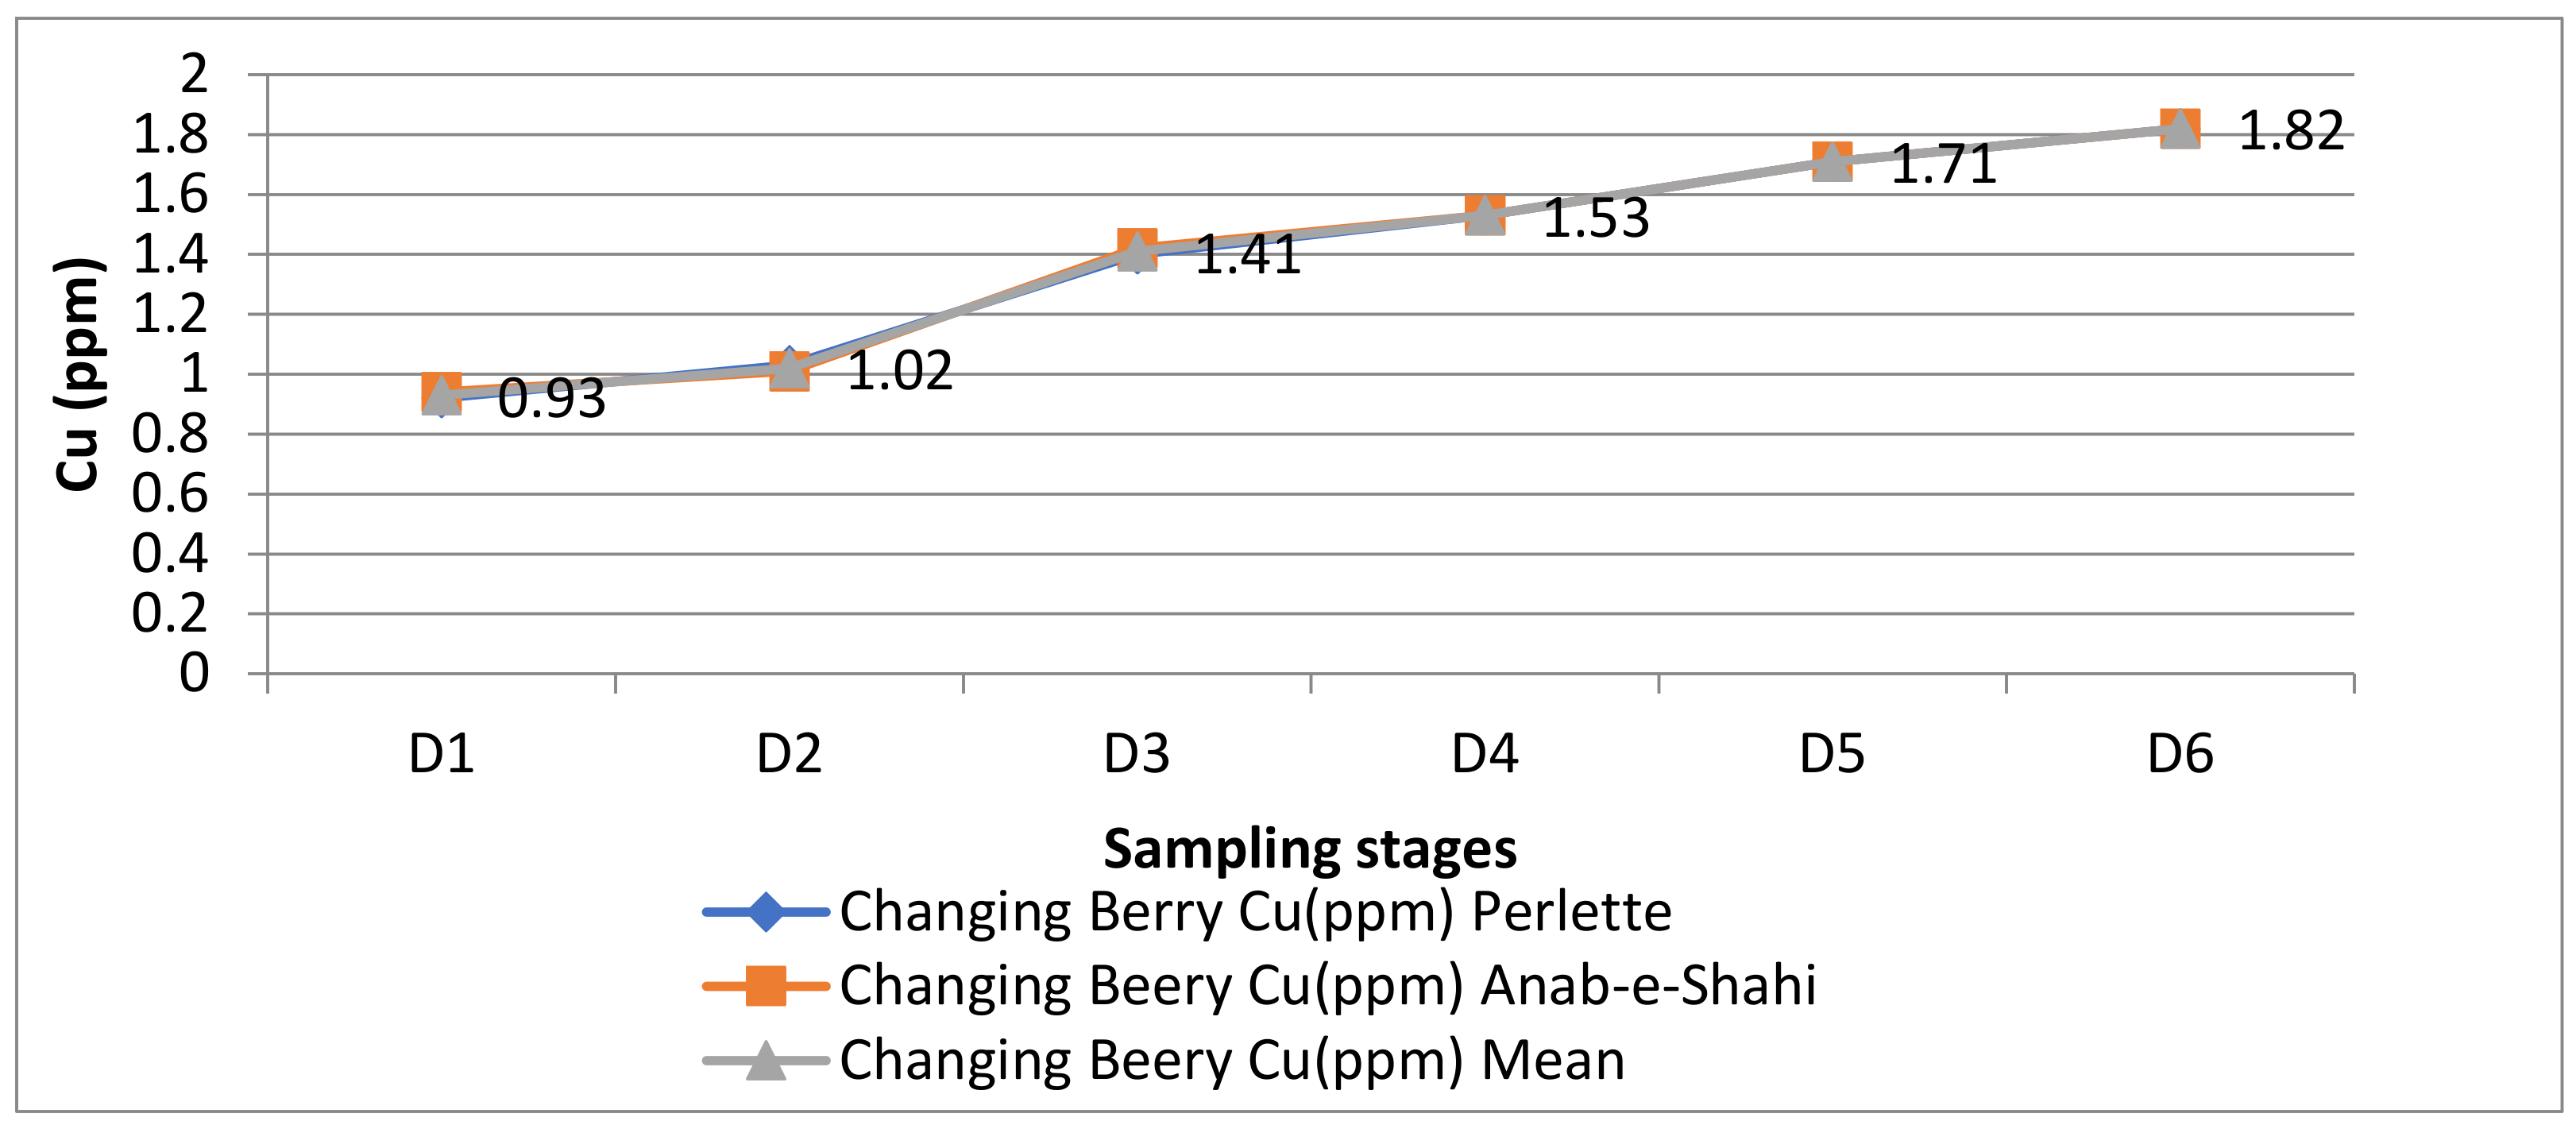
The copper content in the berries of grapes increased with the advancement of the growing season. Accordingly, the highest concentration of copper (1.82 ppm) occurred during D6, and the lowest on record occurred on the first sampling date, viz., D1 at 30 days from full bloom, corresponding to principal growth stage 7 with BBCH code 73 on the extended BBCH Scale (0.93 ppm) (Figure 7) (Table 3). The copper concentration was higher (1.82 ppm) at D6 in both cultivars and lowest in D1 according to the BBCH scale.

3.2.3. Manganese

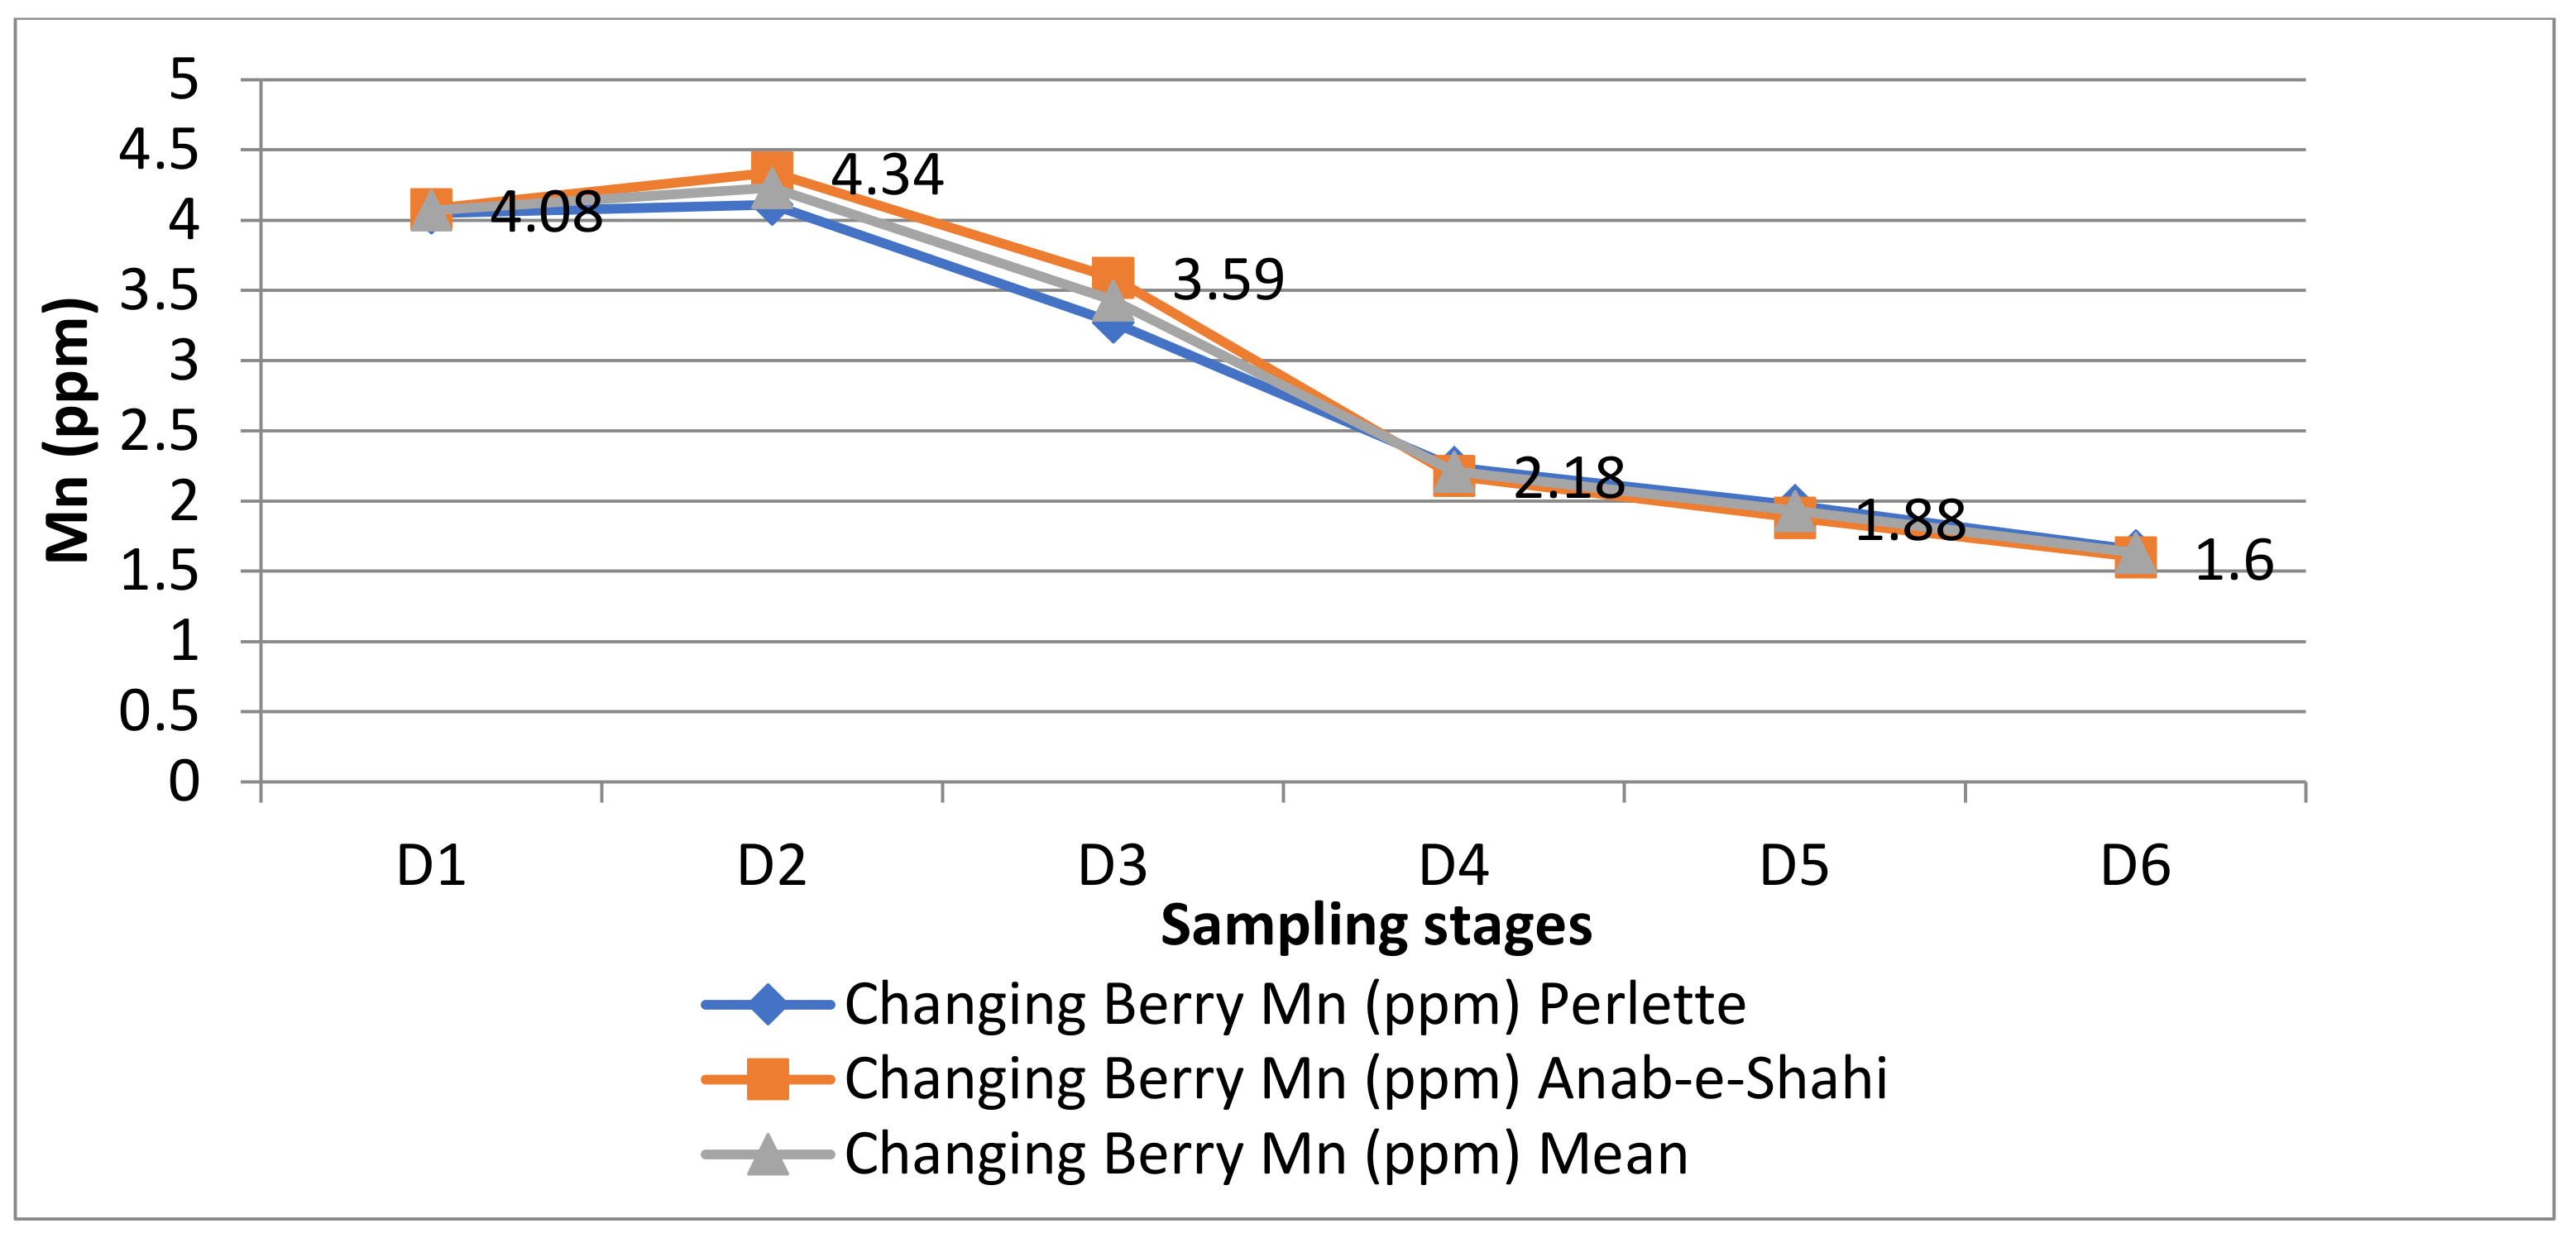
Manganese (Figure 8) varied from a concentration of 4.23 ppm during principal growth stage 7 with BBCH code 73 (D1) to 1.63 ppm at principal growth stage 8 code 89 (D6) on the extended BBCH Scale. A little increment was observed in berry manganese concentration earlier, and, thereafter throughout the growing season, it kept on decreasing (Table 3).

3.2.4. Boron

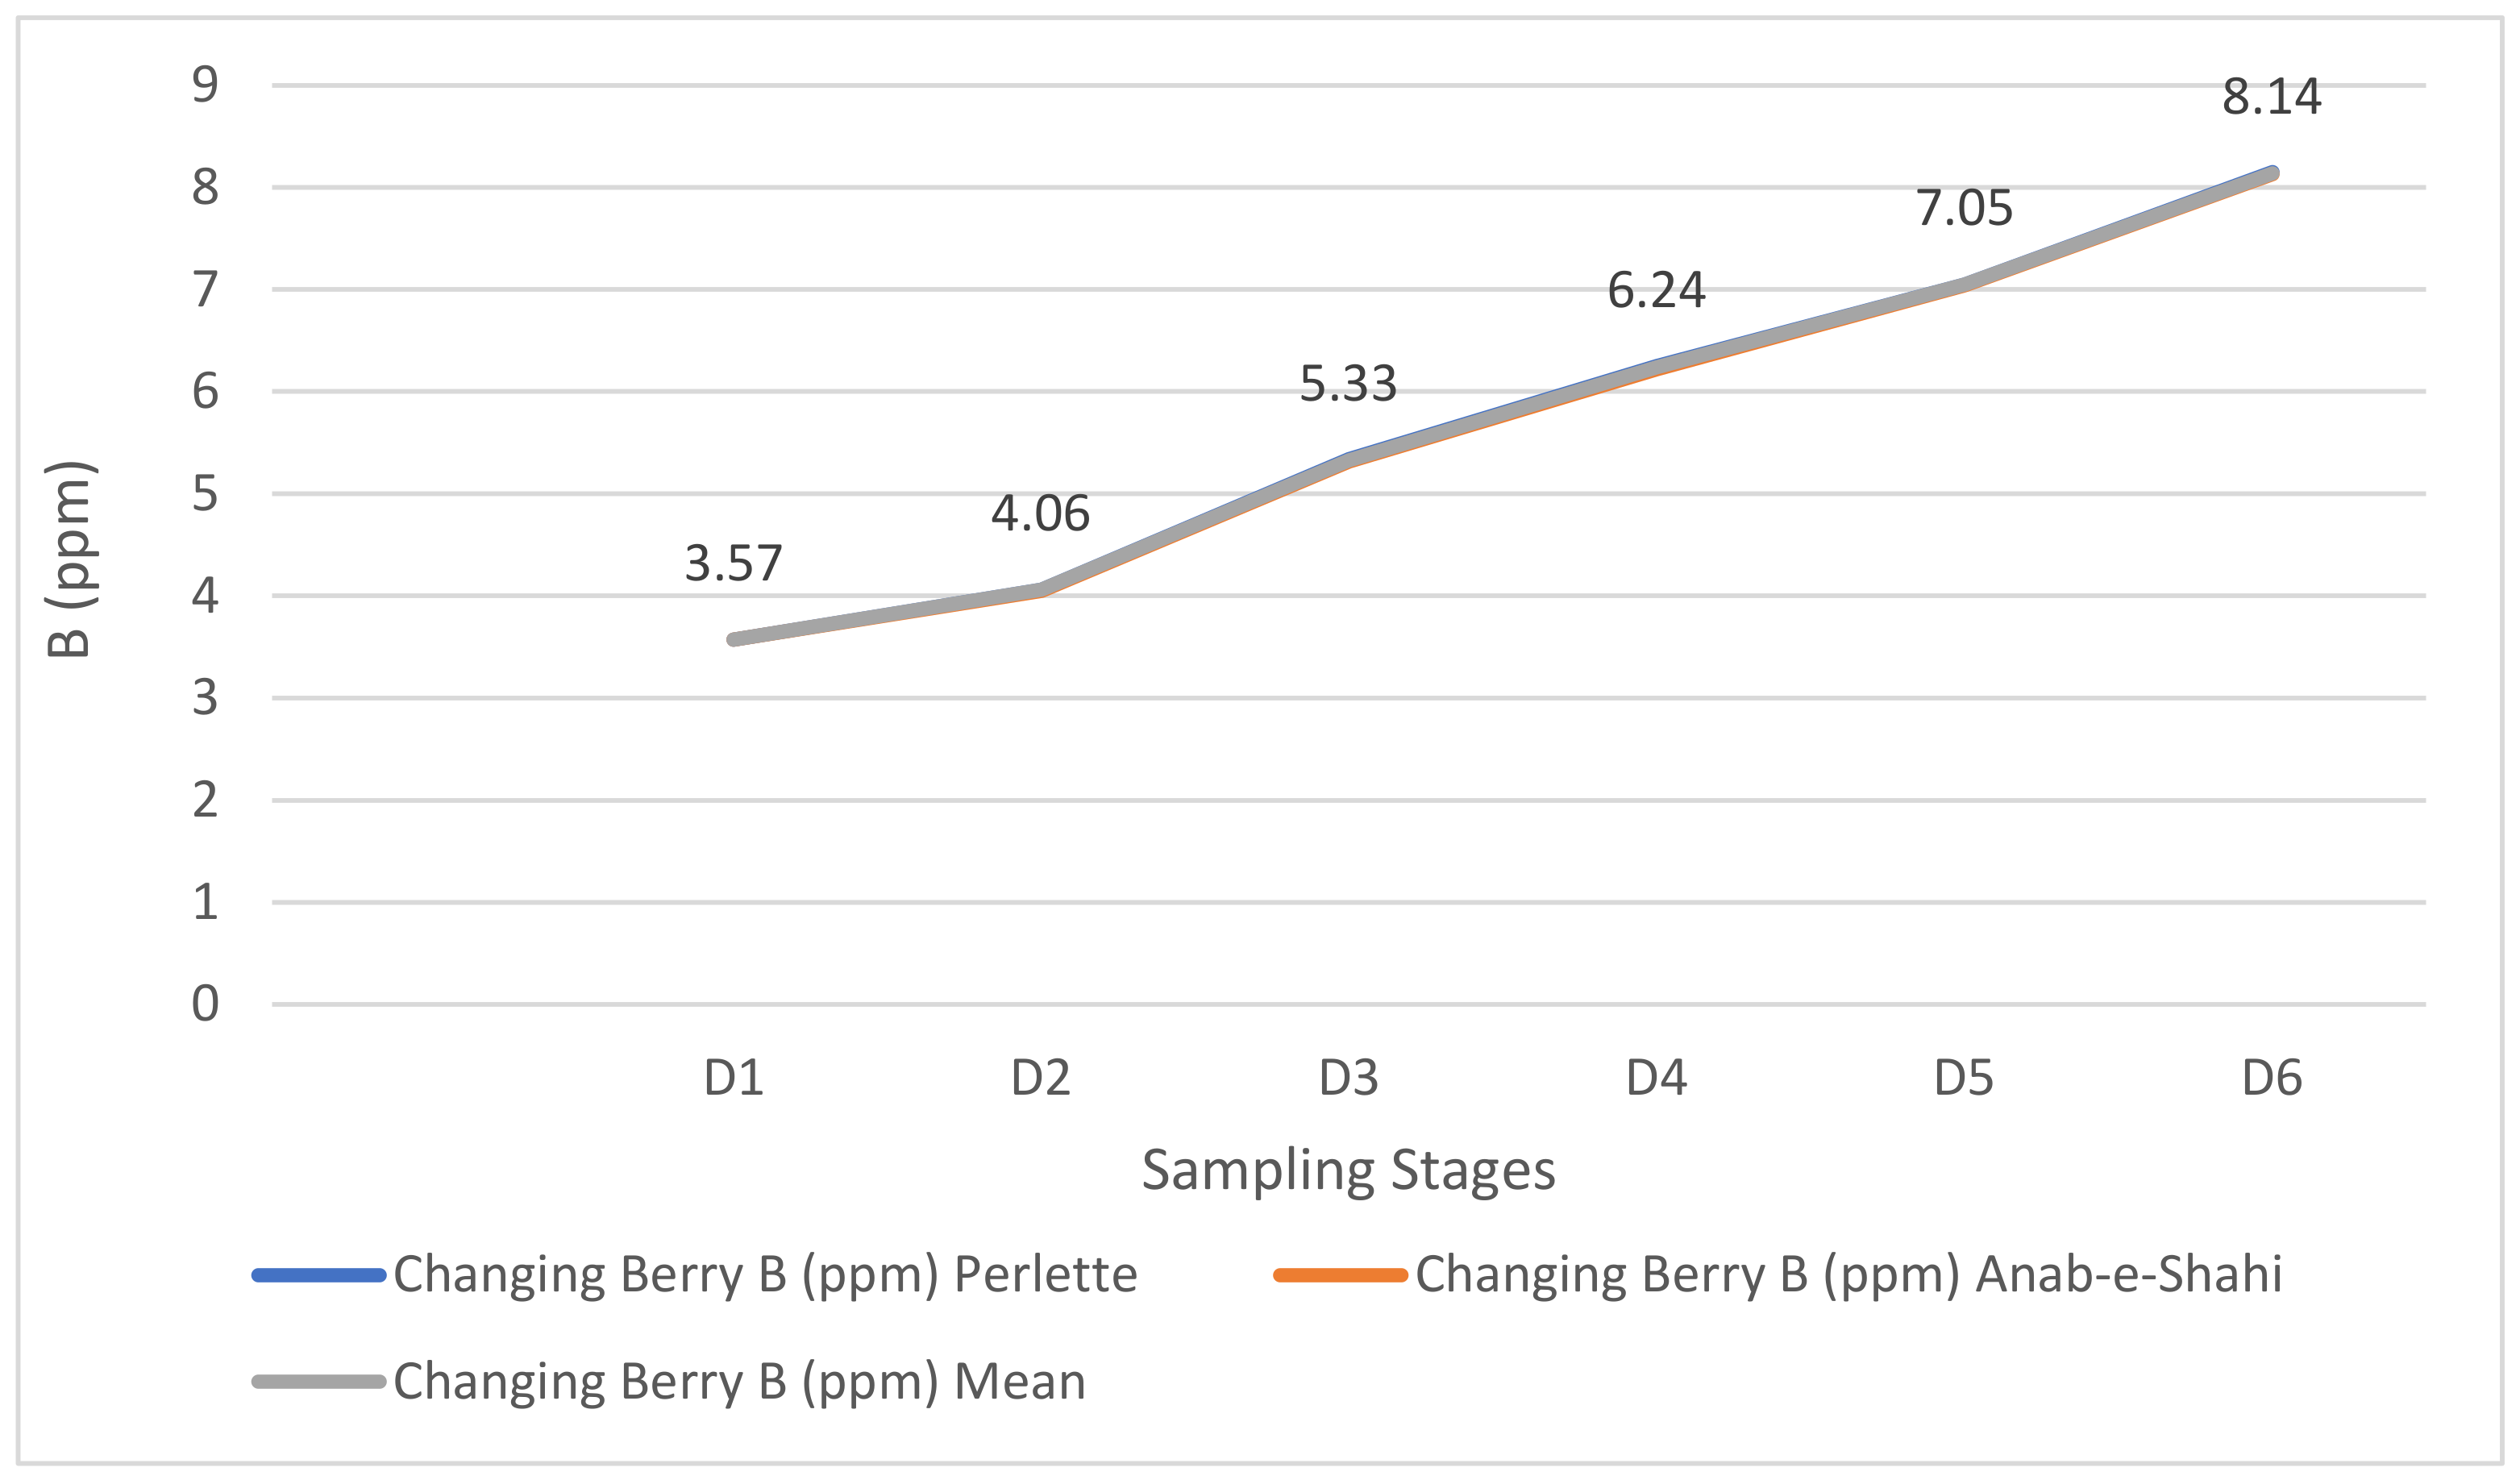
The Boron content in berries of the grapes started accumulating at D1 and continued to increase all along the growth stages and developmental period in the season (Figure 9). The highest boron content was found at maturity in the principal growth stage 8 code 89 on the extended BBCH scale (D6) (8.14 ppm), while the lowest concentration of 3.59 ppm was recorded in principal growth stage 7 with BBCH code 73 (D1) earliest in season (Table 4).

3.2.5. Iron

The iron content of berries does not show any definite trend during developmental stages. Berry Fe was observed to be highest in D3 (5.25 ppm), while the lowest content of Fe was recorded at D6 (2.91 ppm). Anab-e-Shahi was found to accumulate higher Fe than Perlette at most of the growth stages, indicating a different requirement for different varieties. However, at principal growth stage 8 code 89 on the extended BBCH Scale (D6), Perlette was found to have more iron (3.97 ppm) than Anab-e-Shahi cultivar of grapes (3.83 ppm) (Table 4).

4. Discussion

From the nutrient analysis carried out on grape berries during two-year studies, the higher N during fruit set indicates the strong initial movement of N from source to sink, signifying the importance of the application of fertilizers in spring in temperate regions where the plant enters dormancy and also the importance of the previous year’s nutrient status vis a vis remobilized N nutrient content into the tissues. Young growing points usually monopolize different nutrients [11], particularly nitrogen from surrounding tissues. Furthermore, rapid cell division taking place at the early stages of grape berry development accumulate larger amounts of nitrogen [12]. An insufficient supply of N during bud break to bloom or from bloom to veraison is usually compensated by the permanent structures that fulfill the high demand of N at initial stages of berry development [13]. In addition, Conradie, 1992 [14] established that roots, permanent wood, leaves, and shoots all play an important part in satisfying the N demand of bunches, even with an adequate supply of soil N being available. This highlights the fact that N-fertilization will only indirectly affect the N-status of bunches. These results are further supported by Hale and Weaver, 1962 [15], who also concluded that berries tend to be stronger sinks towards which there is a flow of photosynthates. The declining trend in berry N can be due to the growth dilution effect and not due to the movement of N from the sink to other parts of the vine. A growth dilution effect comes from the N content by weight in berries continuing to rise throughout the growing season, which implies the rate of increase (%) cannot keep up with the rate of increase in berry weight. The accumulation of P content in berries was recorded and attributed to the mobility of phosphorus in the phloem [16]. The high rates of accumulation of this element after veraison are thus consistent with the flow through the phloem into grape berries after veraison [17]. Similar results for potassium showed that skin and flesh cells in grape berries accumulate K during the process of ripening [18]. That cell expansion, which is a consequence of K+ accumulation into the cells, is required for pH stabilization in the cytoplasm, and also the enhancement of vacuole osmotic potential is one of the reasons for the continuous increase and influx of the potassium content of berries. Thus, the dynamics and distribution of potassium in fruits will be related to the extension of cells for the regulation of their osmotic potential [19]. Cation, viz., potassium, is osmotically more active in berry phloem, which contributes to the loading of soluble sugars and as such helps in maintaining the osmotic gradient between sink and source [20]. The accumulation rates after veraison are therefore in concurrence with their flow in phloem after veraison into the grape berries [17]. Furthermore, enlarging cells need potassium to balance cells’ electrical charge and also for helping to keep active proton pumps [21].
The quickly expanding fruit needs calcium for cell division and growth as well as for strengthening the cell wall. As a result, it is assumed that the Ca concentration rises steadily during the early season. The rise in Ca content earlier in the season is further influenced by its low mobility through the phloem and low mobility through the xylem. Later, xylem vessels are destroyed, which causes a drop in berry Ca. Perlette accumulated more calcium than Anab-e-Shahi out of the two cultivars. Cultivar differences in the apple in accumulation patterns of nutrients in their leaves have also been reported [22]. However, the decrease in berry calcium was 37.43 percent in Anab-e-Shahi and 37.62 percent in Perlette. A continuous decrease in Ca in apples throughout the season has also been reported [23]. The grapevine has a narrow window to uptake Ca (6–7 weeks), even though the most active uptake of Ca is between bud burst to veraison [13]. Various studies have concluded that the accumulation of Ca in grape berries takes place throughout their developmental stages [18,24]. The post-veraison increase, however, has been attributed to the accumulation of seeds [25]. Contrary to that, some studies have found that calcium accumulation stops after green berry softening starts, which is uniform before veraison, attributing the same to decreased xylem flow [26] and growth dilution effect. Results obtained for magnesium were following those reported for navel oranges by [19].
Percentage-wise higher reduction in zinc concentration was found in the cultivar Anab-e-Shahi (56.61%) compared to Perlette (54.13%) which might be due to the attainment of larger sizes and higher growth dilution in Anab-e-Shahi. Many other studies have recorded a declining xylem flow of Zn after veraison [27]. Recently, it has been proposed that diminished xylem flow after veraison is caused by a loss of a hydrostatic pressure gradient in the berry apoplast rather than by a loss of xylem function [28]. Present studies show both possibilities. Throughout the development of grape berries, there was no cultivar difference in accumulating trends of copper. Since the accumulation of Cu content in berries continued all along the development, the accumulation might have been through the phloem, keeping in view the fact that Cu has conditional or variable phloem mobility [8].
The grape berry, a strong sink for manganese content, has higher content during early growth stages after fruit set. A similar trend was recorded in both cultivars of grapes. Xylem mobility of Mn might be contributing to its early season increase. The loss of xylem vessels later in the season contributes to a decrease in the manganese content of berries. It has recently been hypothesized that a hydrostatic pressure gradient loss in the apoplast in berries rather than a loss of function of the xylem results in the xylem after veraison [28]. The grape berries have a higher demand for boron content, which gets reflected in its accumulating patterns in grapes berries. Therefore the nutrient keeps on increasing throughout the developmental stages of berries of both cultivars, viz., Anab-e-Shahi and Perlette. Furthermore, B has low mobility or conditional mobility in the phloem. The nutrient element, viz., B, is transported primarily in the xylem. However, it is commonly translocated in the phloem of organs, viz., sink that does not transpire readily. The present results are consistent with the findings on phloem mobility patterns of B in grapes. Since iron accumulation occurred throughout berry growth, the majority of the iron accumulation into the berry would appear to have been through the phloem, as supported by Welch, 1986 [8], who also believed that iron had variable or conditional phloem mobility.

5. Conclusions

High-quality marketable grapes are important to have a successful grape industry, which is possible when vines perform better with proper berry development at all growth stages and better post-harvest quality. The mineral nutrient content present during various growth stages will all determine the vine’s physiology, development, and quality of berries. The nutrient accumulation pattern of both macro- and micro nutrients in berries of two commercial-growing cultivars of grapes reflects that nitrogen content decreases drastically with the advancement of berry growth. Higher rates of P are recorded after the veraison. Potassium, which is an important nutrient for berry development, increases with the advancing berry development to the tune of threefold. Ca and Mg increase towards veraison and then drastically decrease with advancing maturity. Berries in general have less concentrations of micronutrients moving through phloem towards maturity, which can be compensated through foliar sprays. The study presents an idea about accumulating patterns of nutrients in berries of grapes, which shall help orchardists in planning a better grape orchard with higher standards of quality with fertilization patterns.

Supplementary Materials

The following supporting information can be downloaded at: https://www.mdpi.com/article/10.3390/horticulturae9020178/s1.

Author Contributions

Conceptualization, A.R.M.; methodology, A.R.M. and K.M.B.; software, S.N.K.; validation, A.R.M. and R.M.; formal analysis, A.R.M. and M.A.G.; investigation, A.R.M. and S.M.W.; resources, R.B. and H.E.-S.; data curation, A.S.S. and R.M.; writing—original draft preparation, A.R.M. and R.M.; writing—review and editing, A.R.M., R.M. and H.E.-S.; visualization, S.B. and S.M.W.; supervision, A.R.M. and K.M.B.; project administration, A.R.M., R.B. and S.N.K.; funding acquisition, A.R.M., R.M. and H.E.-S. All authors have read and agreed to the published version of the manuscript.

Funding

This study was financially supported by King Saud University, Riyadh, Saudi Arabia, through the Researchers Supporting Project Number (RSP2023R19).

Data Availability Statement

Data will be made available on genuine request.

Conflicts of Interest

Authors declare no conflict of interest.

References

  1. Hawke, M.A.; Maun, M.A. Some aspects of nitrogen, phosphorus, and potassium nutrition of three colonizing beach species. Can. J. Bot. 1988, 66, 1490–1496. [Google Scholar] [CrossRef]
  2. Zaman, M.; Kurepin, L.V.; Catto, W.; Pharis, R.P. Enhancing crop yield with the use of N-based fertilizers co-applied with plant hormones or growth regulators. J. Sci. Food Agric. 2014, 95, 1777–1785. [Google Scholar] [CrossRef]
  3. Liu, Z.; Zhou, G.; Chen, J. Effect of different fertilizations on the quantitative characters and yield of adzuki bean. J. Beijing Univ. Agric. 2012, 27, 4–6. [Google Scholar]
  4. Malik, A.R.; Ahmad, M.F.; Raja, R.H.S.; Bangroo, S.A.; Kirmani, S.; Mushtaq, R. Seasonality of nutrients in the leaves of apple trees cultivars Red Delicious and Benoni. J. Pharmacogn. Phytochem. 2018, 7, 3185–3188. [Google Scholar]
  5. Verdenal, T.; Dienes-Nagy, Á.; Spangenberg, J.E.; Zufferey, V.; Spring, J.L.; Viret, O.; Marin-Carbonne, J.; van Leeuwen, C. Understanding and managing nitrogen nutrition in grapevine: A review. OENO One 2021, 55, 1–43. [Google Scholar] [CrossRef]
  6. Holzapfel, B.P.; Smith, J.P.; Field, S.K. Seasonal vine nutrient dynamics and distribution of Shiraz grapevines: This article is published in cooperation with the 21th GIESCO International Meeting, Thessaloniki, Greece. Guests editors: Stefanos Koundouras and Laurent Torregrosa. OENO One 2019, 53, 363–372. [Google Scholar] [CrossRef] [Green Version]
  7. Martins, V.; Cunha, A.; Gerós, H.; Hanana, M.; Blumwald, E. Mineral compounds in grape berry. In The Biochemistry of the Grape Berry; Bentham Science Publishers: Sharjah, United Arab Emirates, 2012; pp. 23–43. [Google Scholar]
  8. Welch, R.M. Effects of nutrient deficiencies on seed production and quality. Adv. Plant Nutr. 1986, 2, 205–247. [Google Scholar]
  9. Anonymous 2021, Grapes. In Package of Practice: Temperate Fruits; Extension Pub No.: DEx/B/2021/26A.SKU; AST Press: Moscow, Russia, 2021; Volume 1, pp. 141–145.
  10. Gomez, K.A.; Gomez, A.A. Statistical Procedures for Agricultural Research, 2nd ed.; John Wiley and Sons: New York, NY, USA, 1983. [Google Scholar]
  11. Nitch, J.P. Growth and development of in vitro excised ovaries. Am. J. Bot. 1951, 38, 566–577. [Google Scholar] [CrossRef]
  12. Karimi, R.; Koulivand, M.; Ollat, N. Soluble sugars, phenolic acids and antioxidant capacity of grape berries as affected by iron and nitrogen. Acta Physiol. Plant 2019, 41, 117. [Google Scholar] [CrossRef]
  13. Conradie, W.J. Translocation and Storage of Nitrogen by Grapevines as Affected by Time of Application. In Proceedings of the International Symposium on Nitrogen in Grapes and Wine, Seattle, WA, USA, 18–19 June 1991; pp. 32–42. [Google Scholar]
  14. Conradie, W.J. Partitioning of nitrogen in grapevines during autumn and the utilisation of nitrogen reserves during the following growing season. S. Afr. J. Enol. Vitic. 1992, 13, 45–51. [Google Scholar] [CrossRef] [Green Version]
  15. Hale, C.R.; Weaver, R.J. The effect of developmental stages on the direction of translocation of photosynthates in Vitis vinifera. Hilgardia 1962, 33, 89–131. [Google Scholar] [CrossRef] [Green Version]
  16. Rogiers, S.Y.; Greer, D.H.; Hatfield, J.M.; Orchard, B.A.; Keller, M. Mineral sinks within ripening grape berries (Vitis vinifera L.). Vitis 2006, 45, 115–123. [Google Scholar]
  17. Greenspan, M.D.; Shackel, K.A.; Matthews, M.A. Developmental changes in the diurnal water budget of the grape berry exposed to water deficits. Plant Cell Environ. 1994, 17, 811–820. [Google Scholar] [CrossRef]
  18. Doneche, B.; Chardonnet, C. Evolution and localization or the main cations during grape berry development. Vitis 1992, 31, 175–181. [Google Scholar]
  19. Xiao, J.X.; Yan, X.; Peng, S.A.; Fang, Y.W. Seasonal changes of mineral nutrients in fruit and leaves of ‘Newhall’and ‘Skagg’s Bonanza’navel oranges. J. Plant Nutr. 2007, 30, 671–690. [Google Scholar] [CrossRef]
  20. Very, A.A.; Sentenac, H. Molecular mechanisms and regulation of K+ transport in higher plants. Annu. Rev. Plant Biol. 2003, 54, 575–603. [Google Scholar] [CrossRef]
  21. Stiles, K.A.; Van Volkenburgh, E. Role of K+ in leaf growth: K+ uptake is required for light-stimulated H+ efflux but not solute accumulation. Plant Cell Environ. 2004, 27, 315–325. [Google Scholar] [CrossRef]
  22. Malik, A.R.; Ahmad, M.F.; Ganai, M.A.; Bangroo, S.A.; Nazir, N.; Khalik, A.; Raja, R.H.S. Seasonal variation in leaf mineral nutrient and optimization of sampling dates for better indexing of pear leaf. Int. J. Curr. Microbiol. Appl. Sci. 2019, 8, 1152–1157. [Google Scholar] [CrossRef]
  23. Nachtigall, G.R.; Dechen, A.R. Seasonality of nutrients in leaves and fruits of apple trees. Sci. Agric. 2006, 63, 493–501. [Google Scholar] [CrossRef] [Green Version]
  24. Cabanne, C.; Doneche, B. Calcium accumulation and redistribution during the development of the grape berry. Vitis 2003, 42, 19–21. [Google Scholar]
  25. Etchebarne, F.; Ojeda, H.; Deloire, A. Grape Berry Mineral Composition in Relation to Vine Water Status & Leaf Area/Fruit Ratio. In Grapevine Molecular Physiology & Biotechnology; Roubelakis-Angelakis, K.A., Ed.; Springer: Dordrecht, The Netherlands, 2009. [Google Scholar] [CrossRef]
  26. Possner, D.R.E.; Kliewer, W.M. The localization of acids, sugars, potassium and calcium in developing grape berries. Vitis 1985, 24, 229–240. [Google Scholar]
  27. Lang, A.; During, H. Partitioning control by water potential gradient; evidence for compartmentation breakdown in grape berries J. Exp. Bot. 1991, 42, 1117–1122. [Google Scholar] [CrossRef]
  28. Bondada, R.B.; Matthews, M.A.; Shackel, A.K. Fuctional xylem in the post-veraison grape berry. J. Exp. Bot. 2005, 56, 2949–2957. [Google Scholar] [CrossRef] [PubMed]
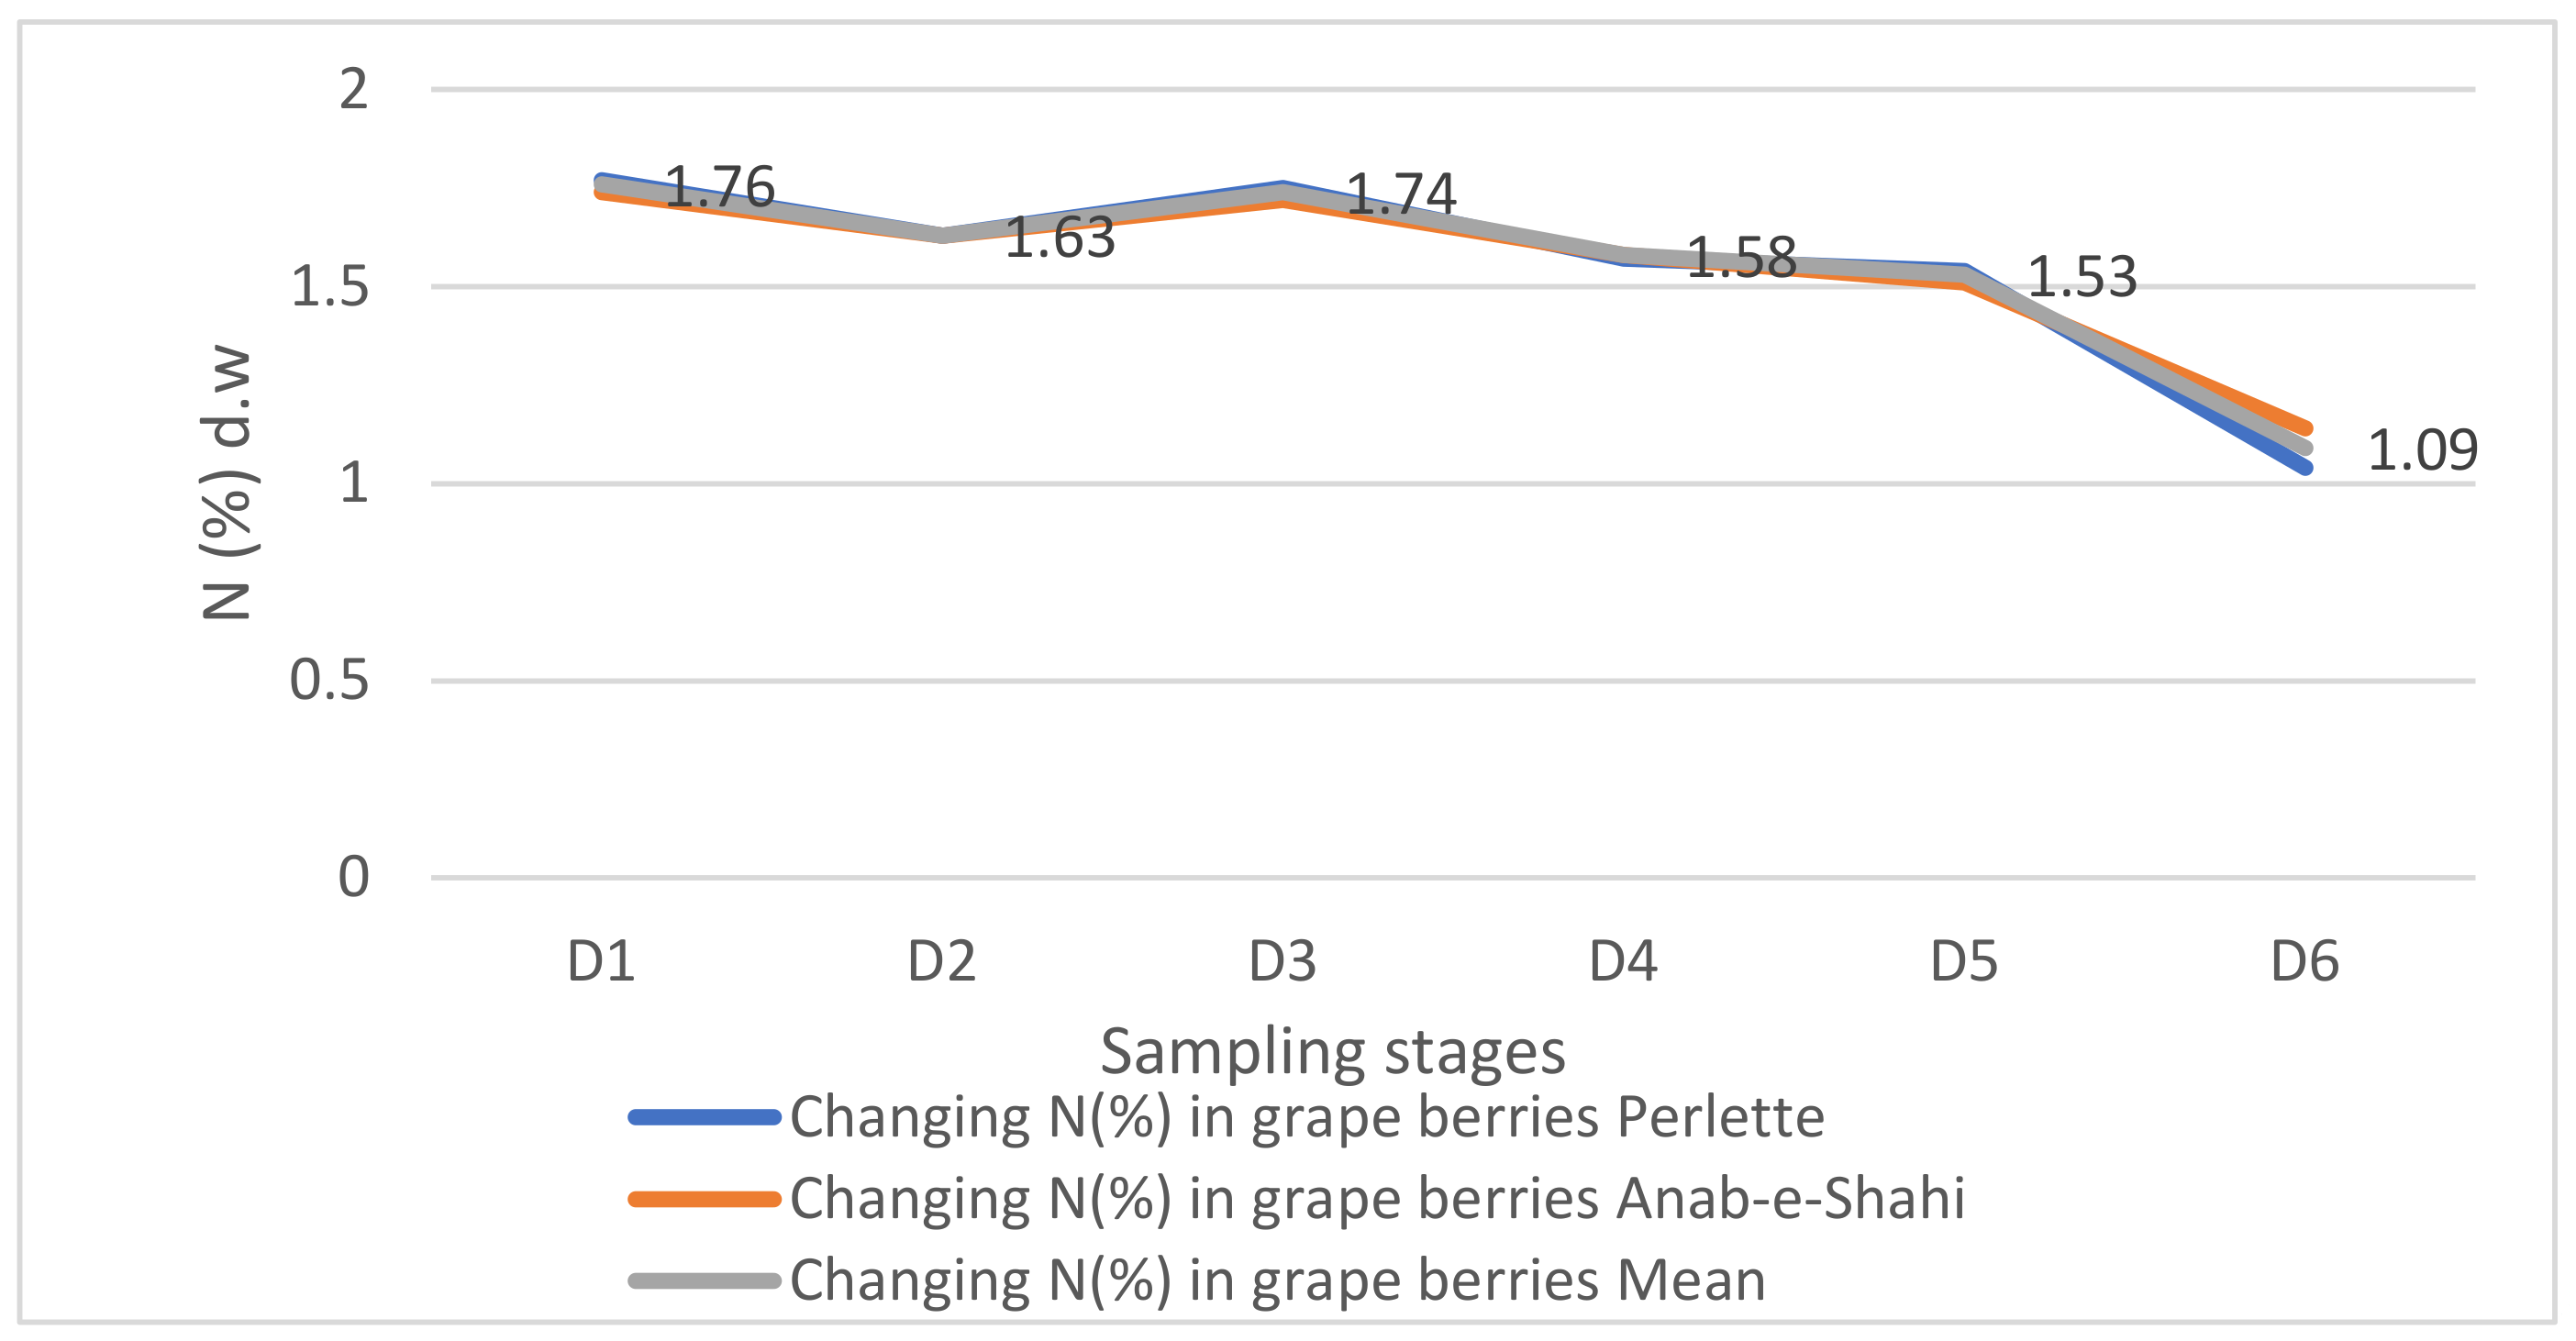
Figure 1. Change of Nitrogen (N%) concentration during the development of berries in grapes, cv. Perlette and Anab-e-Shahi.
Horticulturae 09 00178 g001
Figure 2. Change of Phosphorus (ppm) concentration during the development of berries in grapes cv. Perlette and Anab-e-Shahi.
Horticulturae 09 00178 g002
Figure 3. Chance of Potassium (%) concentration during the development of berries in grapes, cv. Perlette and Anab-e-Shahi.
Horticulturae 09 00178 g003
Figure 4. Change of Calcium (ppm) during the development of berries in grapes, cv. Perlette and Anab-e-Shahi.
Horticulturae 09 00178 g004
Figure 5. Dynamics of Magnesium (ppm) during the development of berries in grapes cv. Perlette and Anab-e-Shahi.
Horticulturae 09 00178 g005
Figure 6. Dynamics of Zinc (ppm) during development of berries in grapes cv. Perlette and Anab-e-Shahi.
Horticulturae 09 00178 g006
Figure 7. Change of copper (ppm) during the development of berries in grapes, cv. Perlette and Anab-e-Shahi.
Horticulturae 09 00178 g007
Figure 8. Change of Mn (ppm) during the development of berries in grapes cv. Perlette and Anab-e-Shahi.
Horticulturae 09 00178 g008
Figure 9. Dynamics of Boron (ppm) during the development of berries in grapes, cv. Perlette and Anab-e-Shahi.
Horticulturae 09 00178 g009
Table 1. Periodical variation of primary nutrients in developing berries of grapes during the growing season.
Sampling DatesN (%)P (ppm)K (%)
PerletteAnab-e-ShahiMeanPerletteAnab-e-ShahiMeanPerletteAnab-e-ShahiMean
D11.771.741.76283.19272.70277.950.120.110.12
D21.631.631.63251.12256.63253.880.170.190.18
D31.751.721.74309.98303.91306.950.210.220.22
D41.571.581.58342.14334.71338.420.240.260.25
D51.541.511.53314.82308.02311.420.290.310.30
D61.041.141.09325.14322.54323.840.330.380.36
Mean1.551.550.95304.40299.80196.700.230.250.15
C.D(p ≤ 0.05)Dates = 0.010
Varieties = 0.08
Dates × Varieties = 0.012
Dates = 38.102
Varieties = 32.120
Dates × Varieties = 39.212
Dates = 0.035
Varieties = 0.024
Dates × Varieties = 0.041
Table 2. Periodic variation of secondary nutrients in developing berries of grapes during the growing season.
Sampling DatesCa (ppm)Mg (ppm)
PerletteAnab-e-ShahiMeanPerletteAnab-e-ShahiMean
D1517.70505.74511.7272.1869.1770.67
D2610.53601.92606.2392.7787.8990.33
D3421.80402.87412.34185.74170.38178.06
D4304.18316.69310.44131.66129.80130.73
D5259.69255.18257.60121.78114.29118.04
D6229.73225.18227.46119.27112.90116.08
Mean390.60384.60258.4120.60114.1078.20
C.D(p ≤ 0.05)Dates = 30.912
Varieties = 28.276
Dates × Varieties = 35.125
Dates = 15.172
Varieties = 12.211
Dates × Varieties = 20.192
Table 3. Periodic variation of micronutrients (Zn, Mn, and Cu) in developing berries of grapes during the growing season.
Sampling DatesZn (ppm)Mn (ppm)Cu (ppm)
PerletteAnab-e-ShahiMeanPerletteAnab-e-ShahiMeanPerletteAnab-e-ShahiMean
D12.442.422.434.054.084.070.920.940.93
D22.412.412.414.114.344.231.031.011.02
D32.342.322.333.273.593.431.401.421.41
D41.501.451.482.242.182.211.531.531.53
D51.271.231.251.971.881.931.711.711.71
D61.131.051.091.651.601.631.821.821.82
Mean1.851.811.222.882.951.941.401.400.93
C.D(p ≤ 0.05)Dates = 0.152
Varieties = 0.142
Dates × varieties = 0.155
Dates = 0.302
Varieties = 0.212
Dates × varieties = 0.335
Dates = 0.126
Varieties = 0.103
Dates × varieties = 0.129
Table 4. Periodic variation of micronutrients (B and Fe) in developing berries of grapes during the growing season.
Sampling DatesB (ppm)Fe (ppm)
PerletteAnab-e-ShahiMeanPerletteAnab-e-ShahiMean
D13.573.573.573.723.853.78
D24.064.054.064.584.404.49
D35.345.325.335.225.275.25
D46.256.226.243.003.163.08
D57.057.047.052.922.892.91
D68.158.138.143.973.833.90
Mean5.745.723.823.903.902.60
C.D(p ≤ 0.05)Dates = 0.313
Varieties = 0.202
Dates × varieties = 0.293
Dates = 0.185
Varieties = 0.098
Dates × varieties = 0.284
Disclaimer/Publisher’s Note: The statements, opinions and data contained in all publications are solely those of the individual author(s) and contributor(s) and not of MDPI and/or the editor(s). MDPI and/or the editor(s) disclaim responsibility for any injury to people or property resulting from any ideas, methods, instructions or products referred to in the content.