Article

The Molecular Mechanism of Relatively Low-Temperature-Induced Broccoli Flower Bud Differentiation Revealed by Transcriptomic Profiling

1
College of Horticulture, Shanxi Agricultural University, Taigu 030801, China
2
Key Laboratory of Innovation and Utilization for Vegetable and Flower Germplasm Resources in Shanxi, Taiyuan 030000, China
3
Institute of Vegetables, Zhengzhou 450000, China
*
Author to whom correspondence should be addressed.
These authors contributed equally to this work.
Horticulturae 2023, 9(12), 1353; https://doi.org/10.3390/horticulturae9121353
Submission received: 18 November 2023 / Revised: 11 December 2023 / Accepted: 15 December 2023 / Published: 18 December 2023
(This article belongs to the Section Genetics, Genomics, Breeding, and Biotechnology (G2B2))

Abstract

:
Broccoli (Brassica oleracea L. var. italica) has a large, edible green flower head, which is one of its critical economic traits. A prerequisite of broccoli flower head formation is flower bud differentiation (FBD). Low-temperature treatment is an effective way to induce FBD in broccoli. However, the molecular mechanism underlying low-temperature-induced broccoli FBD remains largely unclear. In this study, using broccoli cultivar Zhongqing 10 as the experimental material, we investigated the effects of low-temperature treatment on FBD by comparing the plants grown at low temperatures (17 °C/9 °C, 16 h/8 h) with the control plants grown under normal temperature conditions (25 °C/17 °C, 16 h/8 h). After 15 days of different temperature treatments, the flower buds of the plants growing under the low-temperature condition started to differentiate. However, the control plants remained in the vegetative growth stage, indicating that low temperature successfully induced flower bud formation. Subsequently, a global transcriptomic analysis was conducted to detect the differentially expressed genes (DEGs) during low-temperature-induced FBD in broccoli. A total of 14 DEGs in five phytohormone signaling pathways, 42 DEGs in nine transcription factor families, and 16 DEGs associated with the floral development pathways were identified. More DEGs were present in the auxin signaling pathway than in other phytohormone signaling pathways, which indicated that the auxin signaling pathway played a critical role in modulating low-temperature-induced FBD in broccoli. Furthermore, four TF classes, including bZIP, GCM domain factors, MADS-box factors, and C2H2 zinc finger factors, possessed enriched motifs, indicating that their closely related DETFs ABI5, HY5L, WRKY11, WRKY15, WRKY22, SOC1, AGL8, FLC, SPL8, and SPL15 may be directly involved in the transcription regulation of broccoli FBD. This study provides an important basis for further investigation of the molecular regulatory mechanism of broccoli flower development under low temperatures.

1. Introduction

Broccoli (Brassica oleracea L. var. italica) is a member of the cruciferous vegetable family. It is consumed around the world and is a mild-climate species originating in the Mediterranean region [1,2]. It is a highly nutritious vegetable crop, valued primarily for its flower head, which contains high quantities of vitamins, minerals, and anti-cancer substances such as sulforaphane and glucosinolates [3,4]. Broccoli leaves also contain nutrients such as protein, fiber, and phenolic compounds [5]. Therefore, broccoli has substantial nutritional and dietary value and has a higher economic value than similar vegetables. Broccoli is a vernalizing plant, meaning that its yield can only be achieved when the plant body undergoes vernalization, during which the advancement of FBD will determine subsequent flower bud development and quality. Significantly, inflorescence development of cruciferous vegetables not only affects reproduction, but also affects the yield and quality of the commodity organs. The timing and quality of FBD also affect inflorescence development [6,7].
Broccoli is a cool-season plant that prefers full sunlight; however, the light requirement for its vernalization is not strict. The plants vernalize properly at low temperatures, and their flower buds differentiate after a certain period of vegetative growth. The vegetative stage depends on the particular broccoli cultivar and on the time of cultivation. In addition, the major environmental factor affecting the development of inflorescences is temperature [8,9,10], and low temperature is an essential factor determining the transition from vegetative growth to reproductive growth [11]. This transition is a crucial physiological change in broccoli plants.
FBD is a physiological and morphological indicator of the transition from vegetative to reproductive growth and is a response to diverse endogenous and exogenous signals that lead to flowering [12,13]. Present studies indicate that there are six regulatory pathways of FBD in Arabidopsis thaliana, namely, the vernalization pathway, photoperiod pathway, gibberellin (GA) pathway, autonomic pathway, temperature pathway, and age pathway [14,15,16]. These pathways are independent but cross-linked to form a precise network for regulating floral development. For the cruciferous plants, low temperatures and long light periods are essential for FBD [17]. Moreover, the transcription regulation of gene expression in the vernalization pathway plays a significant role in the cruciferous plant FBD. FLOWERING LOCUS C (FLC), a central regulator of the vernalization pathway, is mainly expressed in the shoot apical meristem (SAM) and vascular tissues. In addition, FLC directly inhibits the expression of FLOWERING LOCUS T (FT) in leaves, as do SUPPRESSOR OF OVEREXPRESSION OF CONSTANS 1 (SOC1) and FLOWERING LOCUS D (FD) in the SAM [18,19,20]. CONSTANS (CO) and FT are the most researched genes in the photoperiod pathway. Zinc finger transcription factors (TFs) encoded by CO play a key role in regulating FBD in response to photoperiod signals [17,21]. The prolongation of illumination time brings about the accumulation of CO, which directly activates the expression of SOC1 and FT in the flowering pathway [22]. However, the functions of CO-like (COL) genes differ from those of CO [23]. Notably, in Arabidopsis thaliana, COL4 and COL9 are transcriptional inhibitors of flowering [24,25].
At present, the molecular mechanisms of FBD in Arabidopsis thaliana, Brassica oleracea L., Brassica oleracea L. var. botrytis, Brassica juncea cv. Varuna, and other cruciferous plants have been researched [15,26,27,28,29]. However, studies on broccoli FBD mainly focus on physiology and cytology [30,31,32], and the molecular mechanism of broccoli FBD remains unclear.
In this study, the broccoli cultivar Zhongqing 10 was used as the research subject to investigate the effects of relatively low temperatures on broccoli FBD, and this differentiation process was observed and identified using a stereomicroscope and paraffin sections. Based on them, RNA-seq technology was used to analyze the differentially expressed genes (DEGs) after different treatment durations at relatively low temperatures, and the key genes regulating broccoli FBD were sifted. In addition, the regulation mechanism of broccoli FBD at relatively low temperatures was explored, which provided an important basis for high-quality and high-yield broccoli cultivation and enhanced our understanding of the molecular mechanism of broccoli floral development.

2. Materials and Methods

2.1. Plant Materials and Treatment

The broccoli cultivar used was Zhongqing 10, and the seeds were purchased from China Vegetable Seed Technology (Beijing) Co., Ltd. (Beijing, China). The seeds were soaked in water for five hours and then sown into a 50-hole substrate tray for germination and seedling growth in a sunlit greenhouse (maximum daytime temperature: 30 °C and minimum nighttime temperature: 15 °C) for routine management.
Five-leaf broccoli seedlings of uniform size were placed in incubators for growth. In the control group, the seedlings were incubated under a set photoperiod [16 h of light at (25.0 ± 1) °C and 8 h of dark at (17.0 ± 1) °C] and designated as CK. In the relatively low-temperature group (the treatment group), the seedlings were also incubated under a set photoperiod [16 h of light at (17.0 ± 1) °C and 8 h of dark at (9.0 ± 1) °C] and designated as V.

2.2. Paraffin Sectioning

The morphological changes of the broccoli shoot tips were observed by Olympus SZX16 stereomicroscopy (Olympus, Shinjuku-ku, Tokyo, Japan), to define the developmental stages. In the first ten days, six plants were observed every two days. After ten days of treatment, six plants were observed every day. This process was repeated three times. The shoot tips of the two groups treated for 0 days, 8 days, 14 days, 15 days, and 22 days were photographed. When the tissues at a specific developmental stage were discovered, they were fixed, sliced, and dewaxed according to the modified protocol described by Garcês and Sinha [33]. The tissue staining methods were as follows: 0.1% toluidine blue staining for 11 min, distilled water rinsing for 2 min, deionized water washing for 2 min, deionized water washing for another 2 min, 70% (v/v) ethanol dehydrating for 1 min, 85% (v/v) ethanol dehydrating for 1 min, 100% ethanol dehydrating for 2 min, xylene soaking for 3 min, and xylene soaking for another 3 min. Finally, the slides were placed in neutral balsam and observed and photographed using the Olympus IX81 microscope (Olympus, Shinjuku-ku, Tokyo, Japan).

2.3. Sampling for Transcriptomic Analysis

The broccoli shoot tips treated at relatively low temperatures for 0 days, 8 days, 14 days, 15 days, 22 days, and 15 days under the control condition were sampled and designated V0, V8, V14, V15, V22, and CK, respectively. At each time point, 24 shoot tips with a length of about four millimeters to five millimeters and containing one or two leaf primordium were collected from 24 individual plants and mixed to form three biological replicates. Samples (0.1 g) were taken for RNA extraction. Then, these samples were instantly frozen in liquid nitrogen and deposited at −80 °C for later use.

2.4. RNA-Seq and Differential Expression Analysis

Total RNA extraction and RNA-seq analysis were accomplished by Biomarker Technologies Co., Ltd. (Beijing, China), and clean reads were mapped to the cabbage genome sequence [https://www.ncbi.nlm.nih.gov/assembly/GCA_900416815.2/ (accessed on 24 December 2019) using HISAT2 [34]. FPKM was used for gene/transcript level quantification. Based on the raw count data, differential expression analysis between samples was carried out by the DESeq2 R package (1.16.1) [35]. Genes with |log2FC| ≥ 1, a false discovery rate of (FDR) < 0.01, and adjusted p-value ≤ 0.01 were defined as DEGs.

2.5. Motif Overrepresentation ESTIMATION

Motif overrepresentation of the promoters of DEGs from CK compared with V14 and V15 was estimated by the ESDEG tools [https://github.com/ubercomrade/esdeg (accessed on 16 November 2023)] [36]. Since the Arabidopsis thaliana motifs are quite good for all cruciferous plants, motifs of known TFs were compiled from the JASPAR database with Arabidopsis thaliana.

2.6. Quantitative Real-Time Polymerase Chain Reaction (qRT-PCR)

To test and verify the RNA-seq results, qRT-PCR was carried out using gene-specific primers (Supplementary Table S1) for ten genes related to broccoli FBD. Specific primers were designed using the Primer 3 software according to the gene sequence. The expression of the tested gene was determined using 18S RNA as an internal reference. The total RNA of each sample was extracted from V0, V8, V14, V15, V22, and CK according to the instructions of the plant RNA extraction kit [Tiangen Biotech (Beijing) Co., Ltd., Beijing, China]. First-strand complementary deoxyribonucleic acid (cDNA) was obtained using the PrimeScript™ RT Reagent Kit (Takara, Dalian, China). Subsequently, qRT-PCR was performed in an Applied Biosystems® 7500 Fast Real-Time PCR System (ABI, Foster, CA, USA) using the TB Green® Premix Ex Taq™ kit (Takara, Dalian, China). qRT-PCR was conducted in a 20 μL reaction mixture containing 10 μL of 2 × TB Green Premix EX Taq, 2.0 μL of diluted cDNA, 0.4 μL of 50 × ROX Reference Dye II, 0.4 μL of forward primers (10 μM), 0.4 μL of reverse primers (10 μM), and sterile double-distilled water (ddH2O). The thermal cycling parameters were set as follows: predenaturation at 94 °C for 30 s, 95 °C for 30 s, 55 °C for 30 s, and 72 °C for 30 s for 40 cycles. Each experiment was conducted in triplicate with three biological replicates, and the relative expression level of genes was calculated using the 2−ΔΔCT method [37].

3. Results

3.1. Morphological Changes at Different Stages of FBD

Broccoli usually grows appropriately in areas with an average temperature below 18 °C, and the FBD and formation of the flower heads in broccoli also require low temperatures. When the temperature is too high, the broccoli heading ability is significantly reduced, and the plants remain in vegetative growth [4]. In this research, the changes in the broccoli shoot tips were observed under a stereomicroscope. The observations revealed that FBD began at 15 d in the treatment group (17 °C/9 °C). In contrast, in the control group (25 °C/17 °C), the broccoli shoot tips remained in the vegetative growth stage, with a small volume and a small surface area surrounded by the triangularly protruding leaf primordium that was spirally differentiated around the central axis. Moreover, the growth cones were also in the vegetative growth stage at 0–13 d after treatment in the treatment group. However, the flower buds entered the transitional stage on the 14th day of treatment at relatively low temperatures. In this stage, the growth cones protruded, increased in volume, and could hardly be covered by the leaf primordium. The flower buds began to differentiate on the 15th day of treatment at relatively low temperatures. The growth cone protrusions became flat and widened, and their volume and surface area increased. More importantly, protrusions appeared on the growth cones. On the 22nd day of treatment at relatively low temperatures, flower primordium differentiation began in the lateral direction, and protrusions around the growth cones were prominent (Figure 1).

3.2. Evaluation of RNA-Seq Results

The effect of 17 °C/9 °C on the broccoli shoot tip transcriptomic changes was revealed by RNA-seq. More than 93.00% of the clean reads, including unique and multimapped reads, from all 18 libraries were mapped to the reference genome. The high proportion of mapped genes indicated that the sequencing libraries and reference genome were suitable for further analysis. The unique mapped reads accounted for over 90.00% of the total mapped reads from all 18 libraries (Table S2). In addition, the correlation coefficients among the biological replicates were more significant than 0.97 in all the samples (Figure S1), suggesting close correlations among the three biological replicates for each treatment, which could be used for further data analysis.

3.3. Screening and Analysis of DEGs

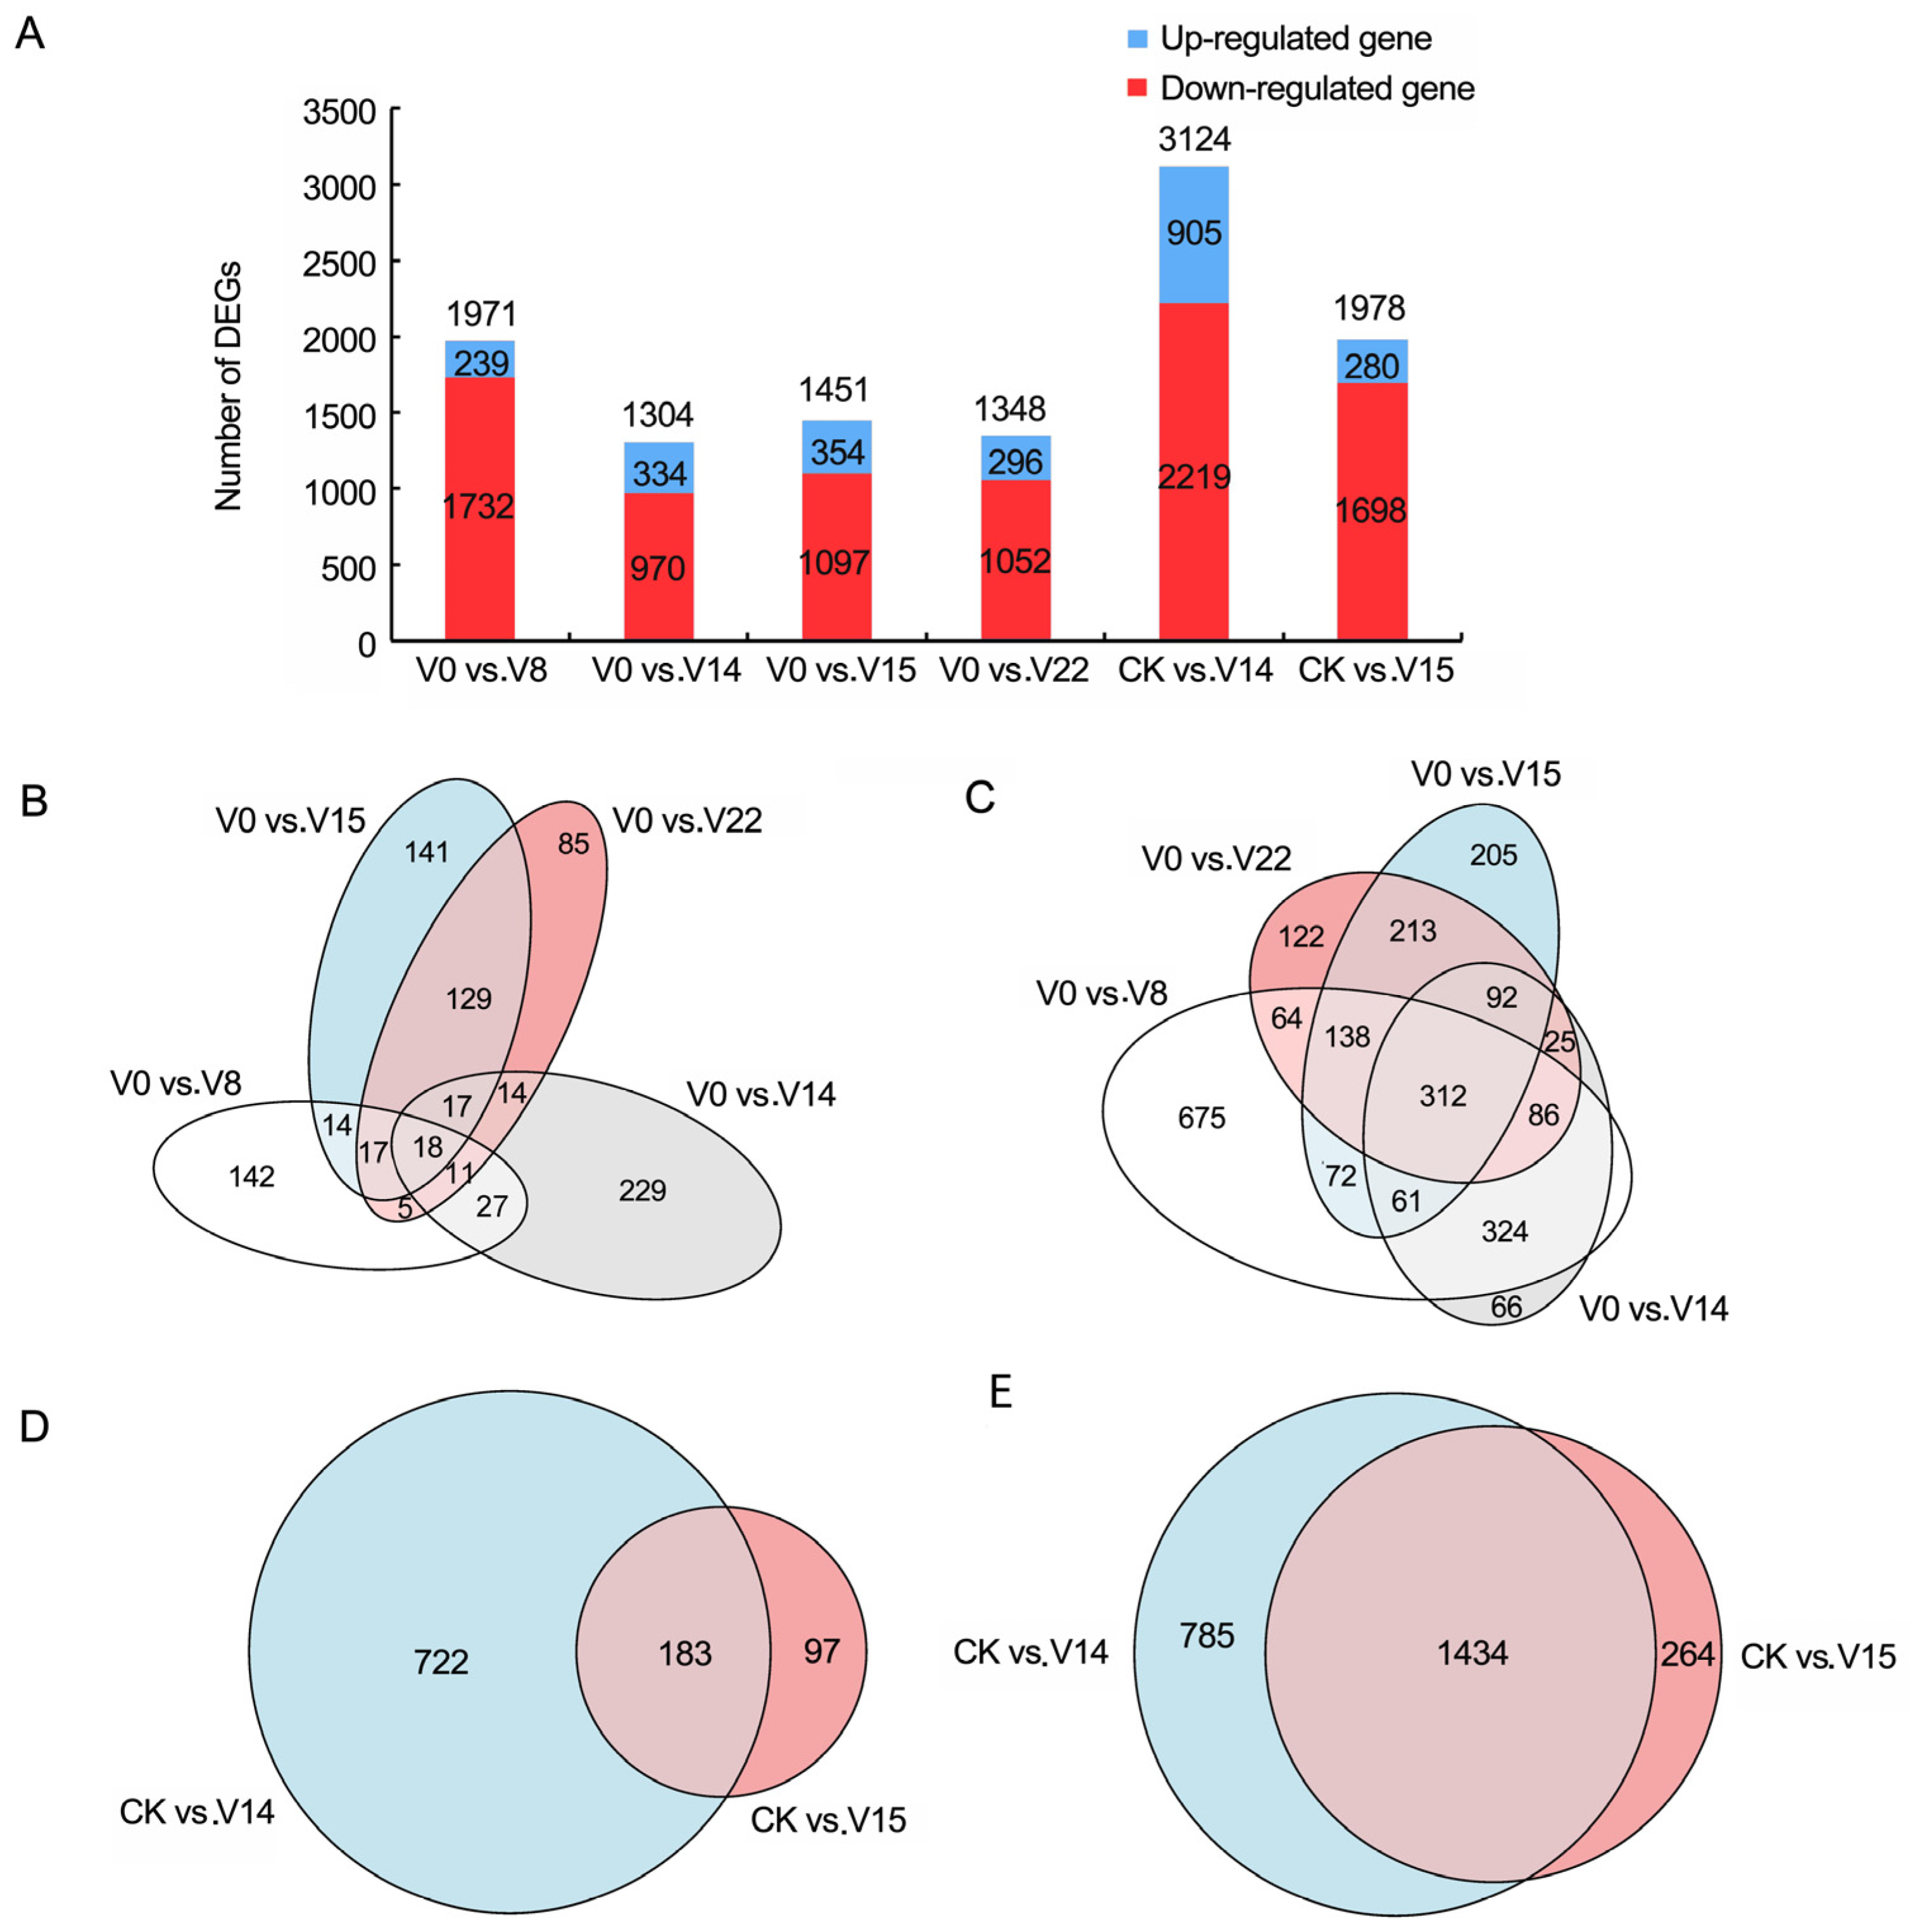
DEGs were compared in six comparisons, namely, V0 compared with V8, V0 with V14, V0 with V15, V0 with V22, CK with V14, and CK with V15, and the results are shown in Figure 2A and Table S3. In total, downregulated genes were more than upregulated genes during FBD at relatively low temperatures. Additionally, 18 upregulated DEGs were shared by V0 compared with V8, V14, V15, and V22, while only 142, 229, 141, and 85 DEGs were upregulated in the four comparisons, respectively (Figure 2B). In addition, 312 downregulated DEGs were shared by V0 compared with V8, V14, V15, and V22, while only 675, 66, 205, and 122 DEGs were downregulated in the four comparisons, respectively (Figure 2C). A total of 183 upregulated DEGs were shared by CK compared with V14 and V15, while 722 and 97 DEGs were only upregulated in one of the two comparisons, respectively (Figure 2D). Moreover, 1434 downregulated DEGs were shared by CK compared with V14 and V15, while 785 and 264 genes were only downregulated in one of the two comparisons, respectively (Figure 2E).
To gain insight into the dynamics of gene expression changes during FBD at relatively low temperatures, k-means clustering was used to analyze the fragments per kilobases per million reads (FPKM) data from V0, CK, V8, V14, V15, and V22. Two different kinetic clusters of coexpressed genes were obtained from V0, V8, V14, V15, and V22, all of which had significant transcriptional bursts during FBD under different treatment durations at relatively low temperatures (Figure 3A). The expression levels of 551 genes in Cluster 1 gradually downregulated as FBD progressed, indicating that they were negatively associated with broccoli FBD (Figure 3A, Table S4). The TF FLC also showed a negative correlation with broccoli FBD. Conversely, 316 genes in Cluster 2 displayed increased expression levels as FBD progressed, indicating that they were positively associated with FBD (Figure 3A, Table S4). The genes mentioned above encode multiple TFs, such as AGAMOUS-LIKE8 (AGL8) and SQUAMOSA PROMOTER BINDING PROTEIN-LIKE8 (SPL8), which showed correlations with broccoli FBD and might play crucial roles in regulating the expression levels of genes related to broccoli FBD.
Meanwhile, two different kinetic clusters of coexpressed genes were also obtained from CK, V14, and V15, all of which had significant transcriptional bursts during FBD under different treatments for different days (Figure 3B). In Cluster 1, the expression levels of 1591 genes gradually downregulated as FBD progressed, so they were negatively associated with FBD. Additionally, the expression levels of COLs, EARLY FLOWERING 4 (ELF4), FRIGIDA-LIKE (FRL), and GA2-oxidase 2 (GA2ox2) were negatively correlated with broccoli FBD. Instead, the expression levels of 468 genes in Cluster 2 upregulated as FBD progressed, indicating that they were positively associated with FBD (Figure 3B, Table S5). These genes encoded multiple TFs, including FT and SOC1, that were positively correlated with broccoli FBD.

3.4. GO Enrichment Analysis and KEGG Pathway Analysis of Coexpressed DEGs

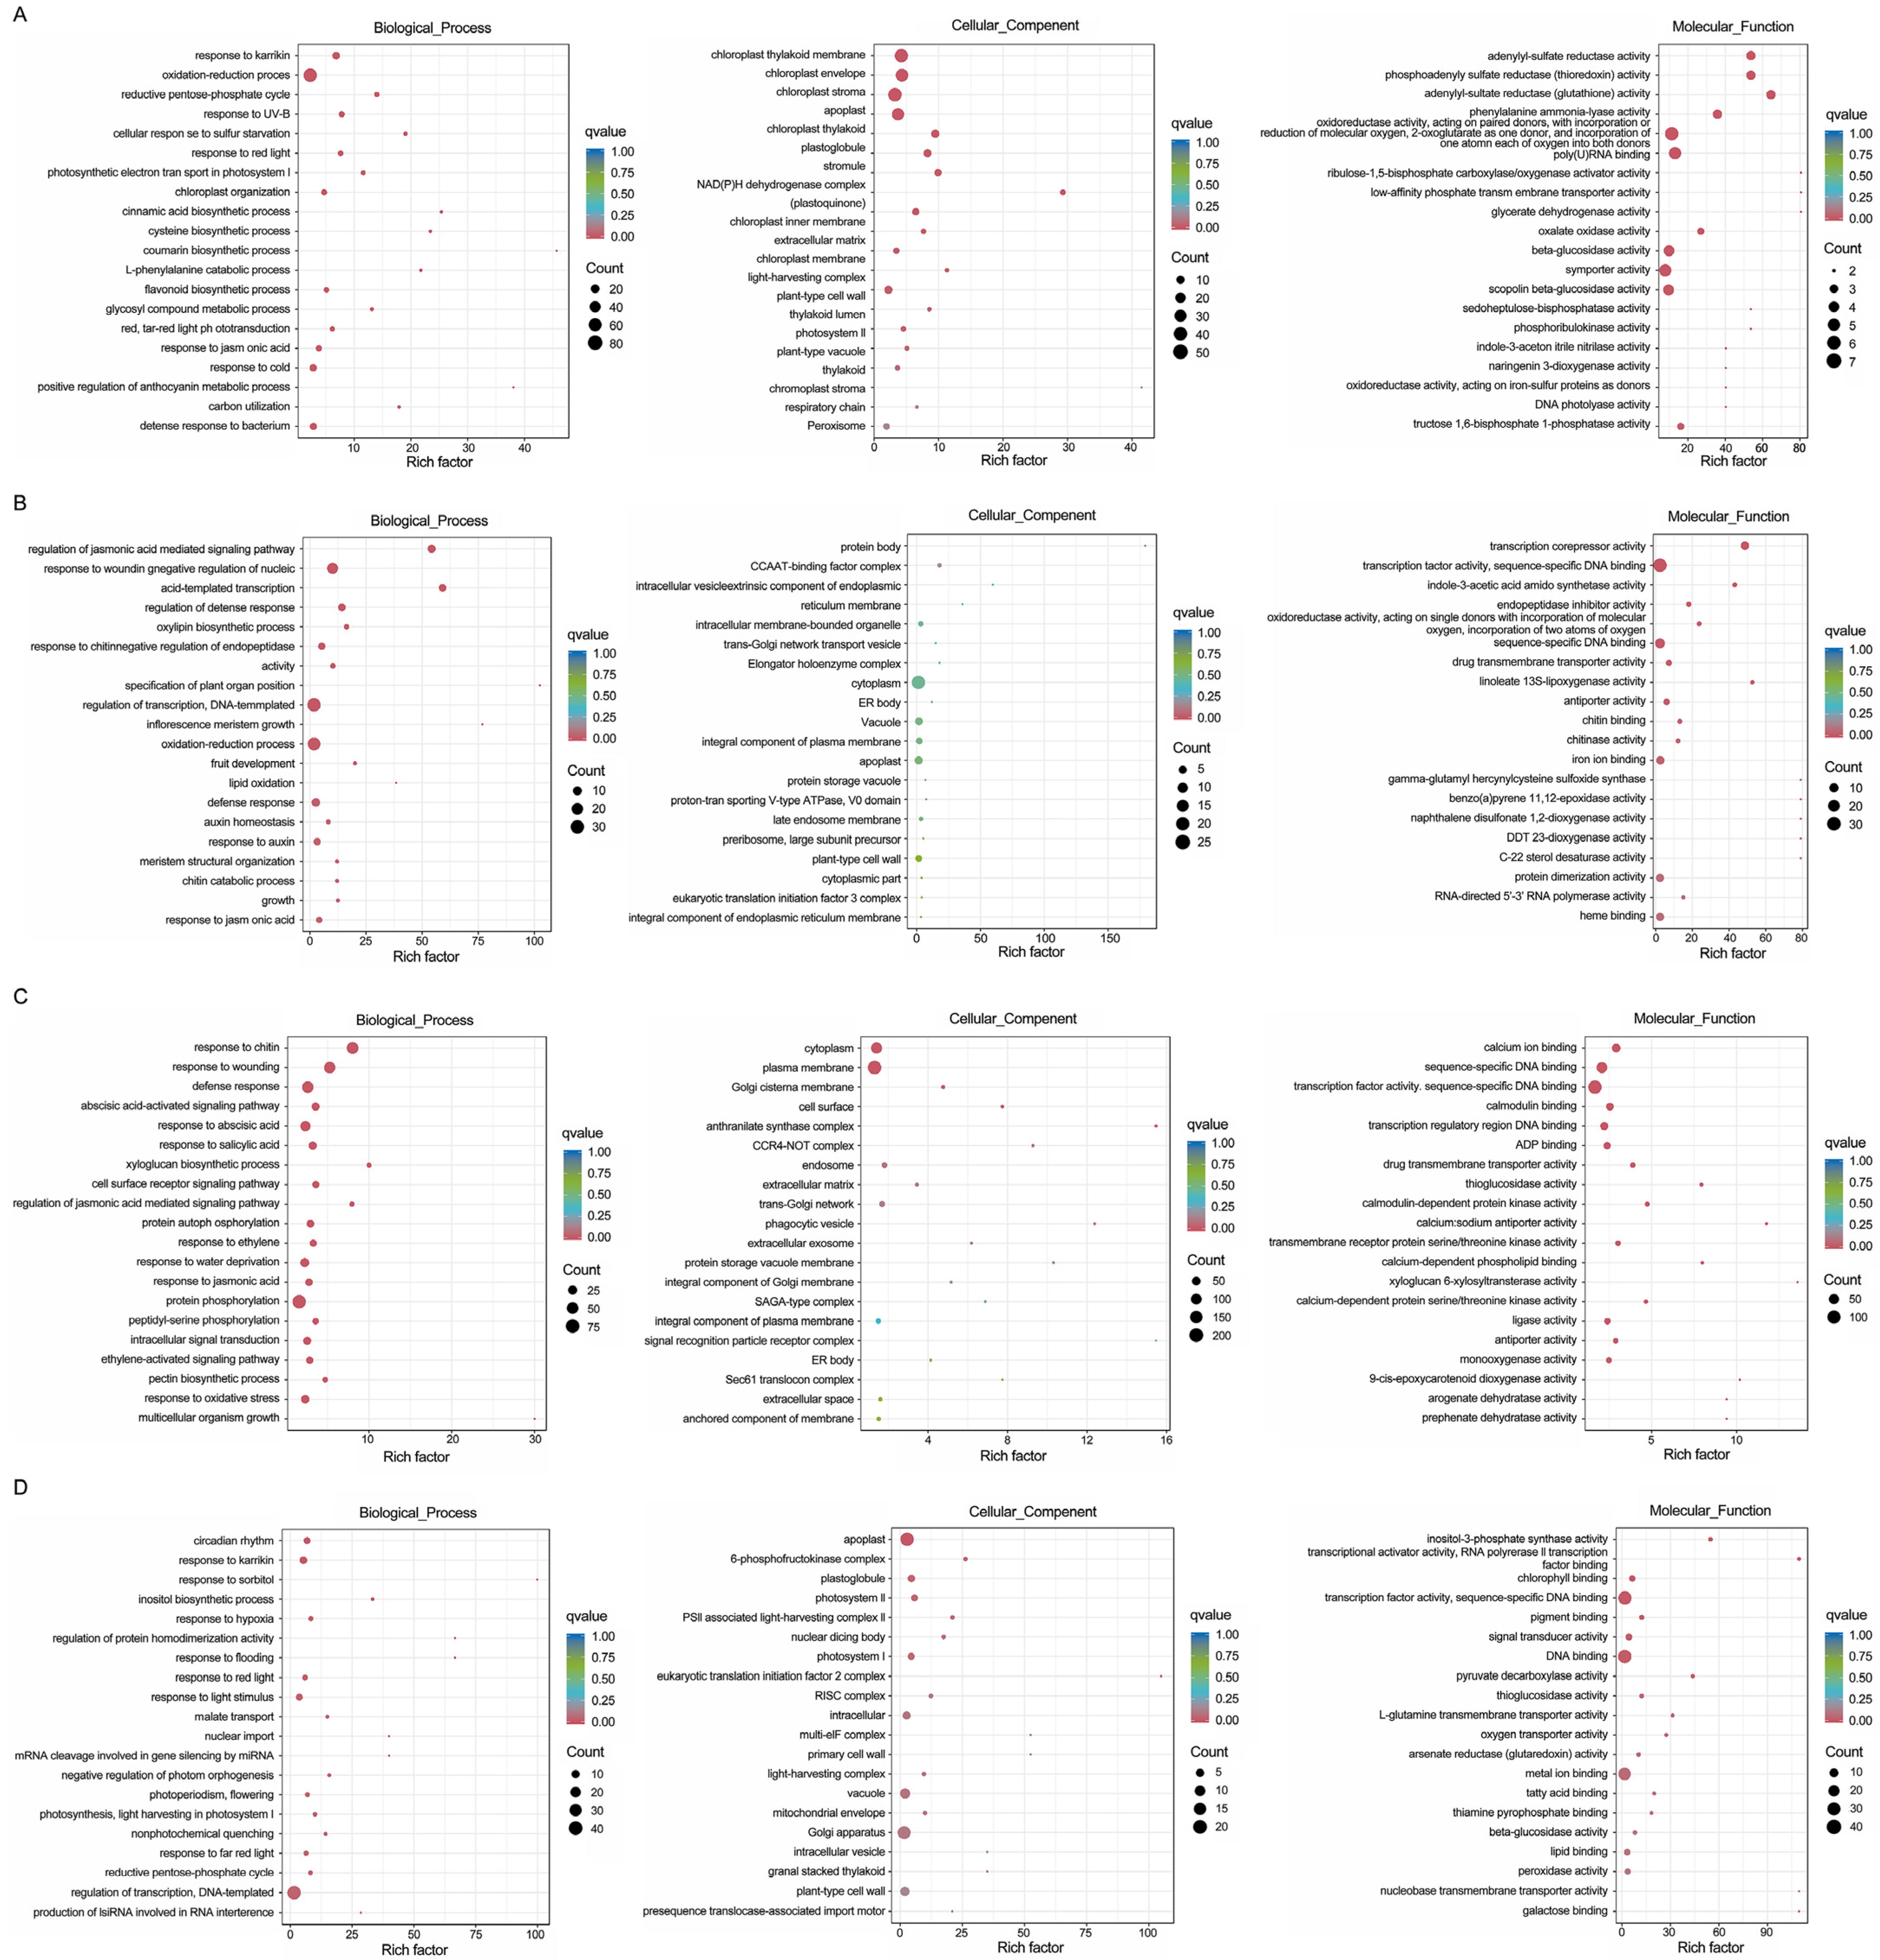
To reveal the biological processes (BPs), cellular components (CCs), and molecular functions (MFs) underlying the broccoli transcriptome, a gene ontology (GO) enrichment analysis was conducted on the kinetic clusters of coexpressed DEGs obtained from the two analysis groups. In Cluster 1 of Analysis Group 1 (V0 compared with V8, V14, V15, and V22), enriched BP GO terms included the oxidation–reduction process, response to cold, and response to karrikin; enriched CC GO terms included the chloroplast thylakoid membrane, chloroplast envelope, and chloroplast stroma; and enriched MF GO terms had symporter activity, beta-glucosidase activity, and scopolin beta-glucosidase activity (Figure 4A). In Cluster 2 of Analysis Group 1 (V0 compared with V8, V14, V15, and V22), enriched BP GO terms included regulation of transcription, DNA-templated, oxidation–reduction process, and response to wounding; enriched CC GO terms included cytoplasm, vacuole, and apoplast; and enriched MF GO terms had transcription factor activity, sequence-specific DNA binding, iron ion binding, and heme binding (Figure 4B). In Cluster 1 of Analysis Group 2 (CK compared with V14 and V15), enriched BP GO terms included protein phosphorylation, defense response, response to chitin, response to wounding, and response to abacisic acid; enriched CC GO terms included plasma membrane and cytoplasm; and enriched MF GO terms had transcription factor activity, sequence-specific DNA binding, calcium ion binding, and calmodulin binding (Figure 4C). In Cluster 2 of Analysis Group 2 (CK compared with V14 and V15), enriched BP GO terms included regulation of transcription, DNA-templated, response to karrikin, and circadian rhythm; enriched CC GO terms included Golgi apparatus, apoplast, and vacuole; and enriched MF GO terms had transcription factor activity, sequence-specific DNA binding, DNA binding, and metal ion binding (Figure 4D).
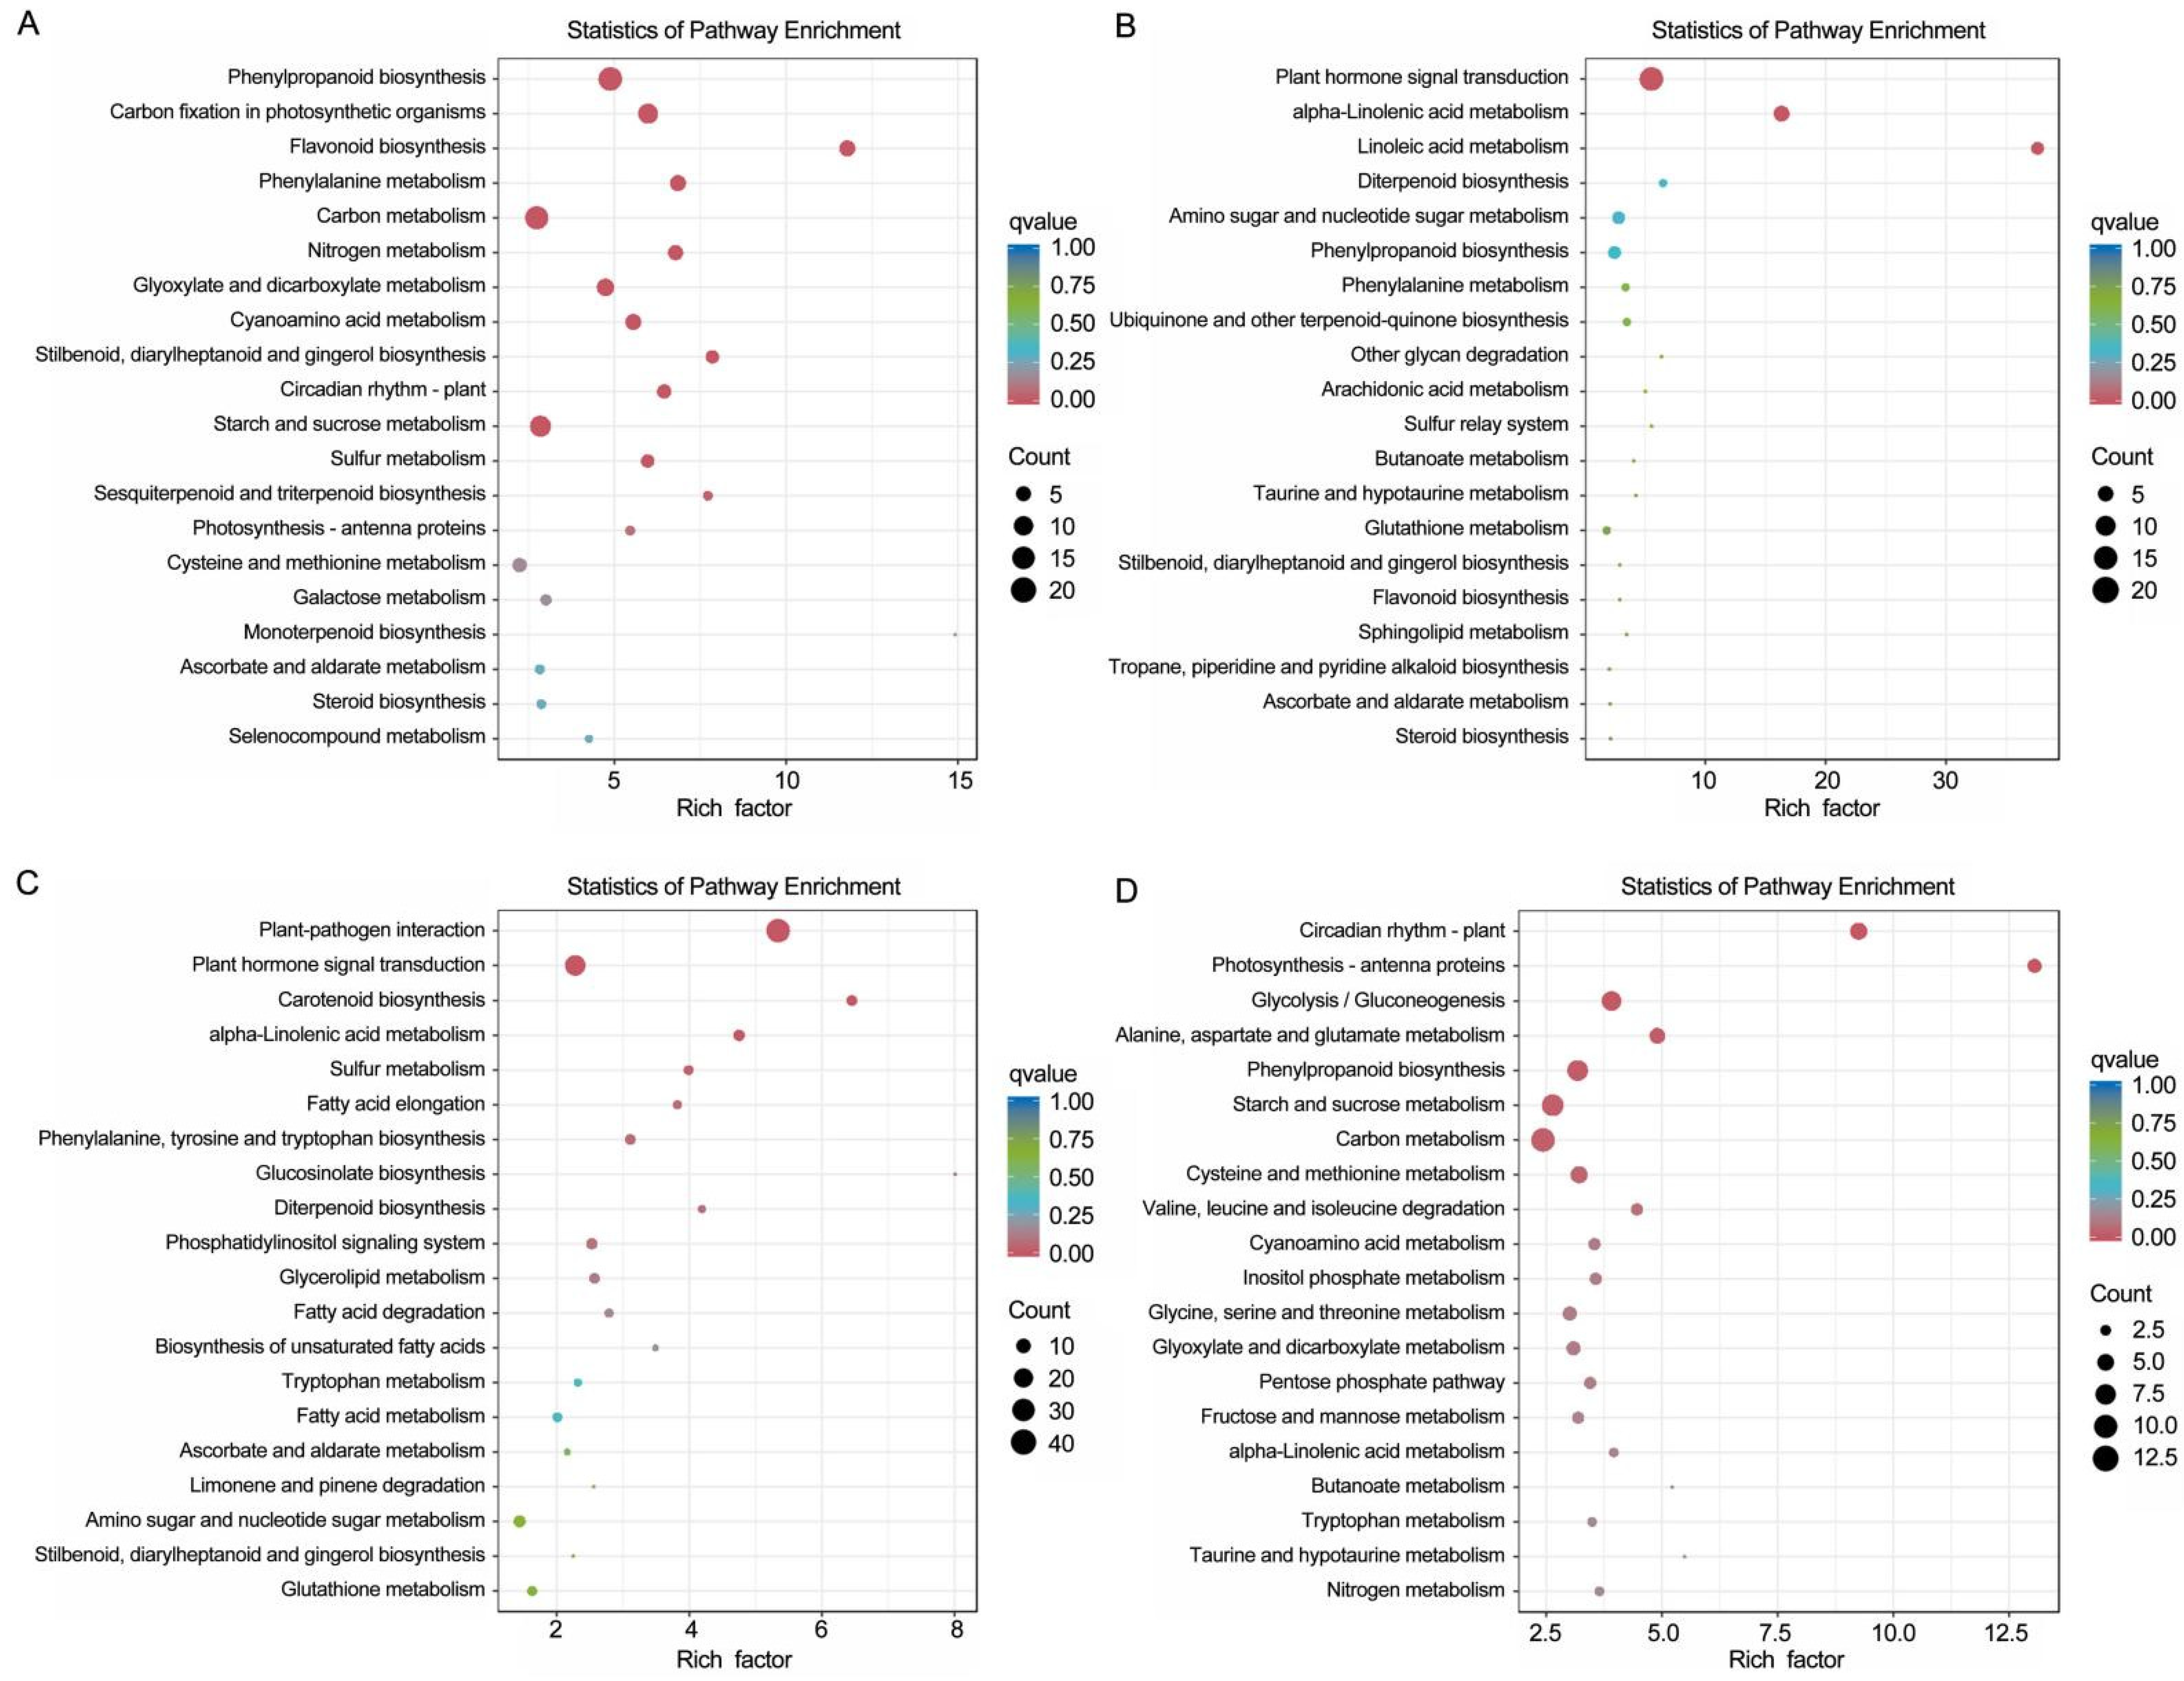
To further determine the functions of the DEGs in the kinetic clusters, Kyoto Encyclopedia of Genes and Genomes (KEGG) enrichment analysis was performed, revealing that in Analysis Group 1 (V0 compared with V8, V14, V15, and V22), the DEGs in Cluster 1 were mainly enriched in the phenylpropanoid biosynthesis, carbon metabolism, starch and sucrose metabolism, and carbon fixation in photosynthetic organisms (Figure 5A). The analysis results also revealed that the DEGs in Cluster 2 were mainly enriched in plant hormone signal transduction, alpha-linolenic acid metabolism, and linolenic acid metabolism (Figure 5B). In addition, the KEGG analysis showed that in Analysis Group 2 (CK compared with V14, and V15), the DEGs in Cluster 1 were mainly enriched in plant pathogen interaction and plant hormone signal transduction (Figure 5C). Moreover, the DEGs in Cluster 2 were mainly enriched in carbon metabolism, starch and sucrose metabolism, phenylpropanoid biosynthesis, and glycolysis/gluconeogenesis (Figure 5D).

3.5. Identification of DEGs Involved in the Plant Hormone Signaling Pathways

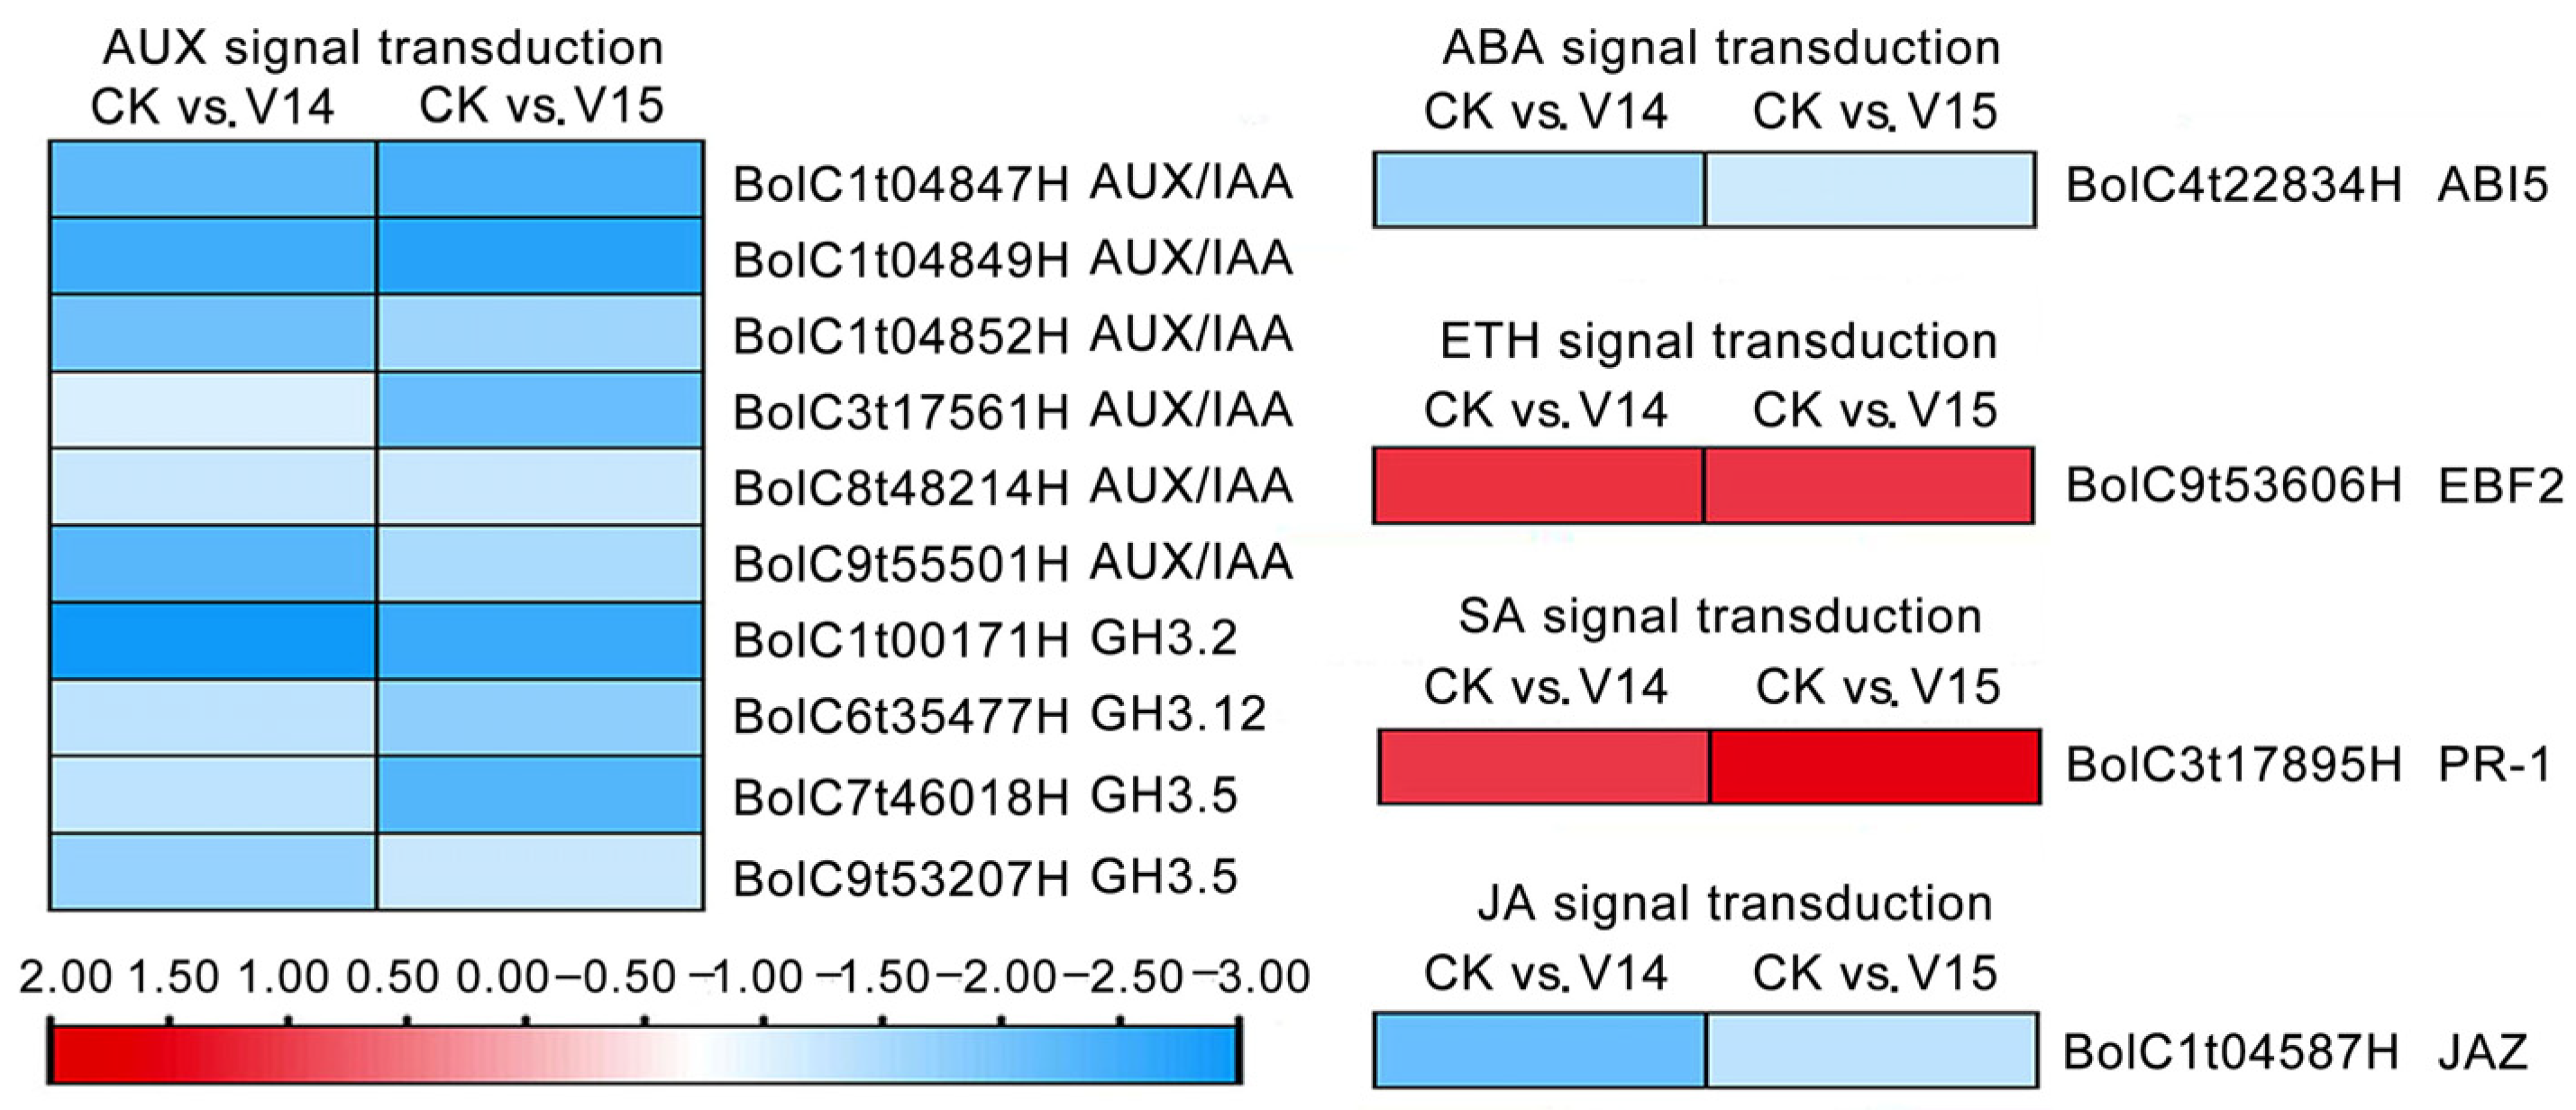
Plant endogenous hormones are involved in the whole plant life process, and the effects of these hormones (gibberellins, abscisic acid, auxin, cytokinins, salicylic acid, jasmonic acid, ethylene, and brassinolide) on plant FBD have been reported [38,39]. Therefore, we screened for DEGs that may be involved in the plant hormone signaling pathways from the two clusters of coexpressed genes at the critical stage of broccoli FBD. In this study, 14 DEGs were identified as being involved in five plant hormone signaling pathways that may be associated with FBD. All DEGs of the auxin (Aux), ABA, and JA signaling pathways were downregulated under treatment at relatively low temperatures (Figure 6 and Table S6). There were more DEGs in the Aux signaling pathway than in the other two pathways, and there was only one DEG in each of the ABA and JA signaling pathways, namely, ABI5 (BolC4t22834H) and JAZ (BolC1t04587H), respectively. In the Aux signaling pathway, six Aux/IAA genes and four GH3 genes were significantly differentially expressed in the broccoli shoot tips under treatment at different temperatures, and the expression levels of BolC1t04847H, BolC1t04849H, BolC1t04852H, and BolC1t00171H showed five- to fifteen-fold changes. In the ETH and SA signaling pathways, DEGs were upregulated under treatment at relatively low temperatures, and the expression of BolC3t17895H increased with increasing treatment time (Figure 6 and Table S6).

3.6. Identification of Differentially Expressed TFs (DETFs)

TFs are one of the critical factors regulating gene expression at the transcriptional level [40]. The reproductive development of plants is dominated by complex and intricate gene regulatory networks of TFs [41]. Herein, there were 43 DETFs in the two clusters of coexpressed genes at the critical stage of broccoli FBD, which were grouped into nine families (Figure 7, Table S7). In the AP2/ERFBP TF family, only one (BolC4t28768H, ERF071) out of fifteen genes was upregulated, while the expression of the other genes was downregulated under treatment at relatively low temperatures. Among these genes, the expression of BolC3t17033H (ERF4L), BolC3t21433H (ERF8), BolC5t31450 (ERF11L), and BolC6t40184H (ERF013L) changed more than five-fold in CK compared with V14 (Figure 7, Table S7).
All DEGs of the MYB, WRKY, HSF, and DOF TF families in the broccoli shoot tips under treatment at different temperatures were downregulated. The expression of BolC3t21098H (WRKY11) changed 8.7-fold in CK compared with V14, and the expression of BolC7t46322H (WRKY15) and BolC7t45084H (MYB44L) changed more than 5-fold in CK compared with V14 (Figure 7, Table S7).
The MADS-box gene family plays a crucial role in flower and fruit development, and its role in the differentiation of the floral meristem into various floral organs has been widely explored [42]. In this study, four genes in the MADS-box TF family were upregulated, and one gene was downregulated under treatment at relatively low temperatures (Figure 7, Table S7). The expression of BolC4t22281 (SOC1) showed more than 10-fold changes under treatment at relatively low temperatures. The expression of BolC7t44992H (AGL8) increased with the relatively low-temperature treatment time, and the expression level of V15 was twice that of V14 (Figure 7, Table S7).
In this study, among four bHLH TFs, BolC1t00906H (bHLH27L), BolC4t26934H (bHLH66), and BolC5t34804 (bHLH150L) displayed downregulated expression levels. At the same time, BolC2t12489H (bHLH93) showed upregulated expression level under treatment at relatively low temperatures, where the expression of the upregulated gene bHLH27L showed more than six-fold changes in both groups compared (Figure 7, Table S7).
Within the TCP and bZIP transcription factor families, one upregulated gene and one downregulated gene were screened. The DEGs of the TCP transcription factor were BolC3t17248H (TCP18) and BolC2t06313H (TCP21L), and the DEGs of the bZIP transcription factor were BolC1t04632H (HY5L) and BolC8t47030H (PosF21) (Figure 7, Table S7).

3.7. Identification of DEGs Involved in the FBD Pathways

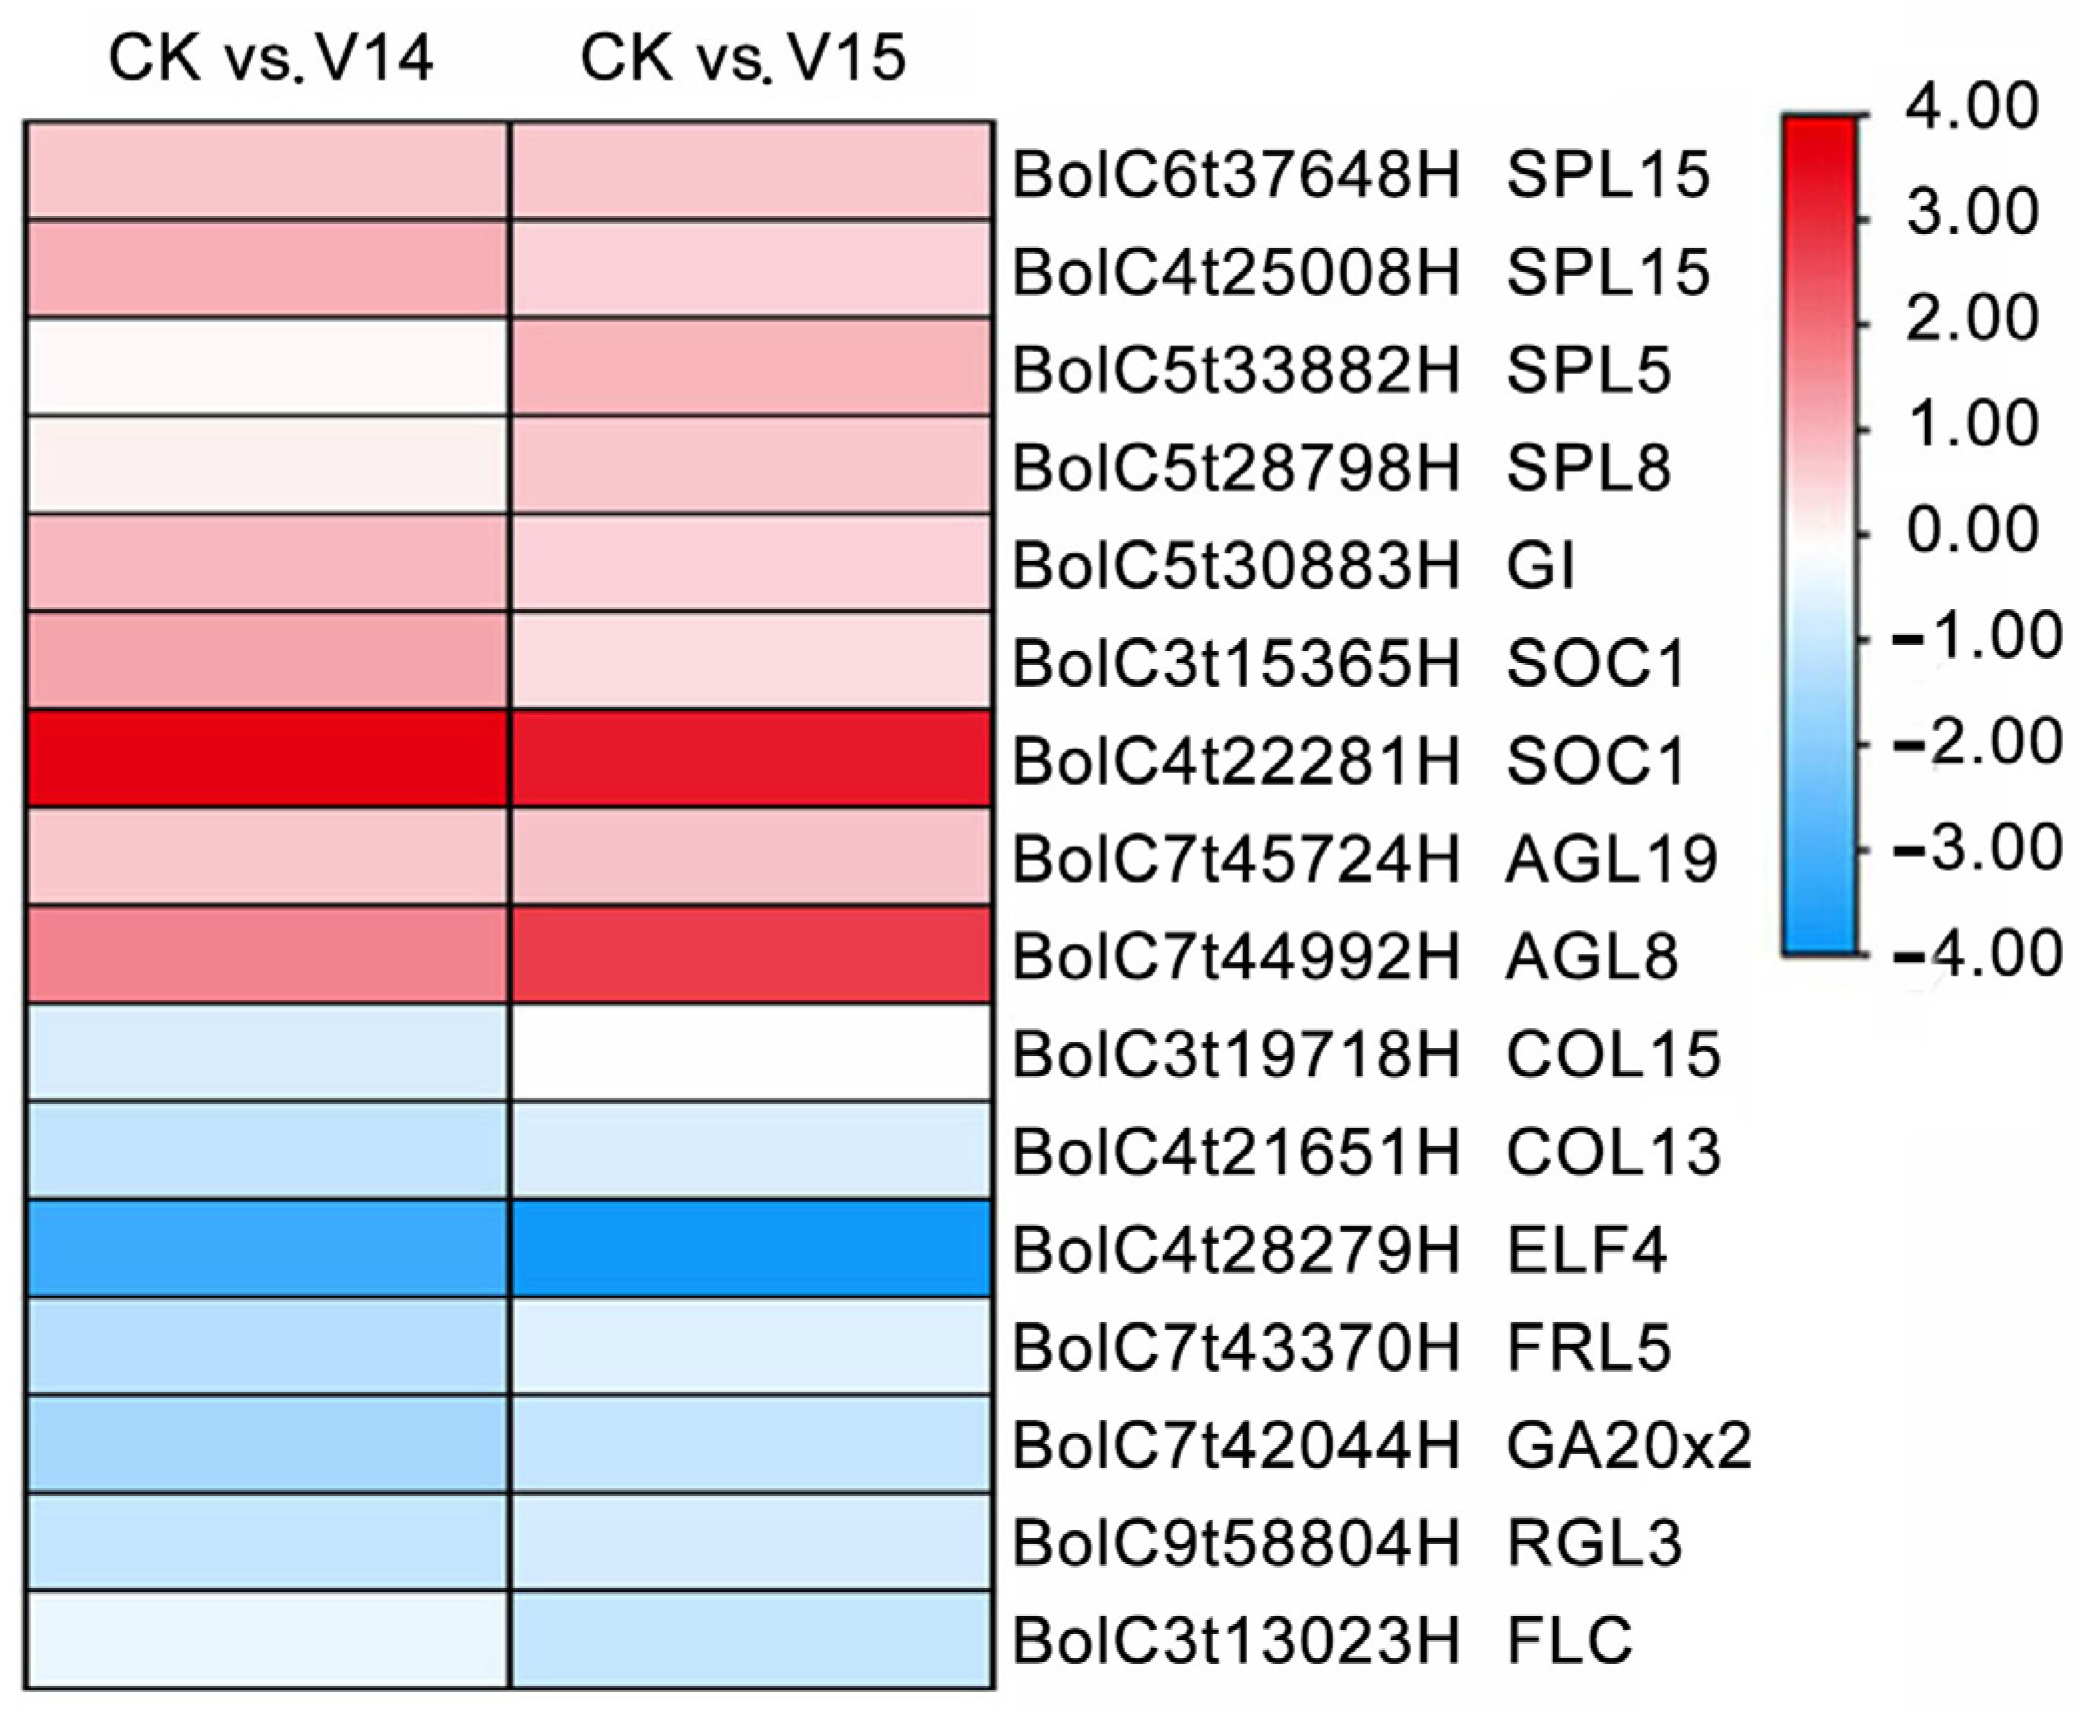
Six flower development signaling pathways have been described, including the photoperiod pathway, vernalization pathway, autonomic pathway, GA pathway, temperature sensitivity pathway, and age pathway [14]. Herein, based on Arabidopsis thaliana research, GO annotation, and KEGG enrichment analysis of the two clusters of coexpressed genes at the critical stage of broccoli FBD, 16 DEGs associated with flower development pathways were filtered. Among them, nine genes were upregulated and seven genes were downregulated (Figure 8, Table S8). Many MADS-box genes play significant roles in plant flower development. In our study, the expression levels of the MADS-box genes BolC3t15365H (SOC1), BolC4t22281H (SOC1), BolC7t45724H (AGL19), and BolC7t44992H (AGL8) were upregulated under treatment at relatively low temperatures.
Previous studies have shown that FLC is an important gene in the vernalization pathway and the autonomous pathway, while FRL is an FLC promoter FRIGIDA complex (FRI-C) [43]. The expression levels of BolC3t13023H (FLC) and BolC7t43370H (FRL) were downregulated under treatment at relatively low temperatures.
GI and ELF4 regulate plant flowering by regulating the circadian rhythm of the biological clock in the photoperiodic pathway [44,45]. CONSTANS-LIKE (COL) genes are important signaling components in the photoperiod pathway and flowering regulation pathway [46]. In this research, the expression of BolC5t30883H (GI) was upregulated, while the expression of BolC4t28279H (ELF4), BolC3t19718H (COL15), and BolC4t21651H (COL13) were downregulated under treatment at relatively low temperatures.
GA2ox2 is a gene in the GA pathway regulating GA biosynthesis, and RGL3 is an important gene in the GA signaling pathway [14]. The expression of BolC7t42044H (GA2ox2) and BolC9t58804H (RGL3) were downregulated under treatment at relatively low temperatures.
Temperature and age pathways promote flower formation by regulating SPL expression in Arabidopsis thaliana. In this research, the expression levels of BolC6t37648H (SPL15), BolC4t25008H (SPL15), BolC5t33882H (SPL5), and BolC5t28798H (SPL8) were upregulated under treatment at relatively low temperatures.

3.8. Analysis of Enrichment with Binding Sites for DETFs Involved in the FBD Pathway

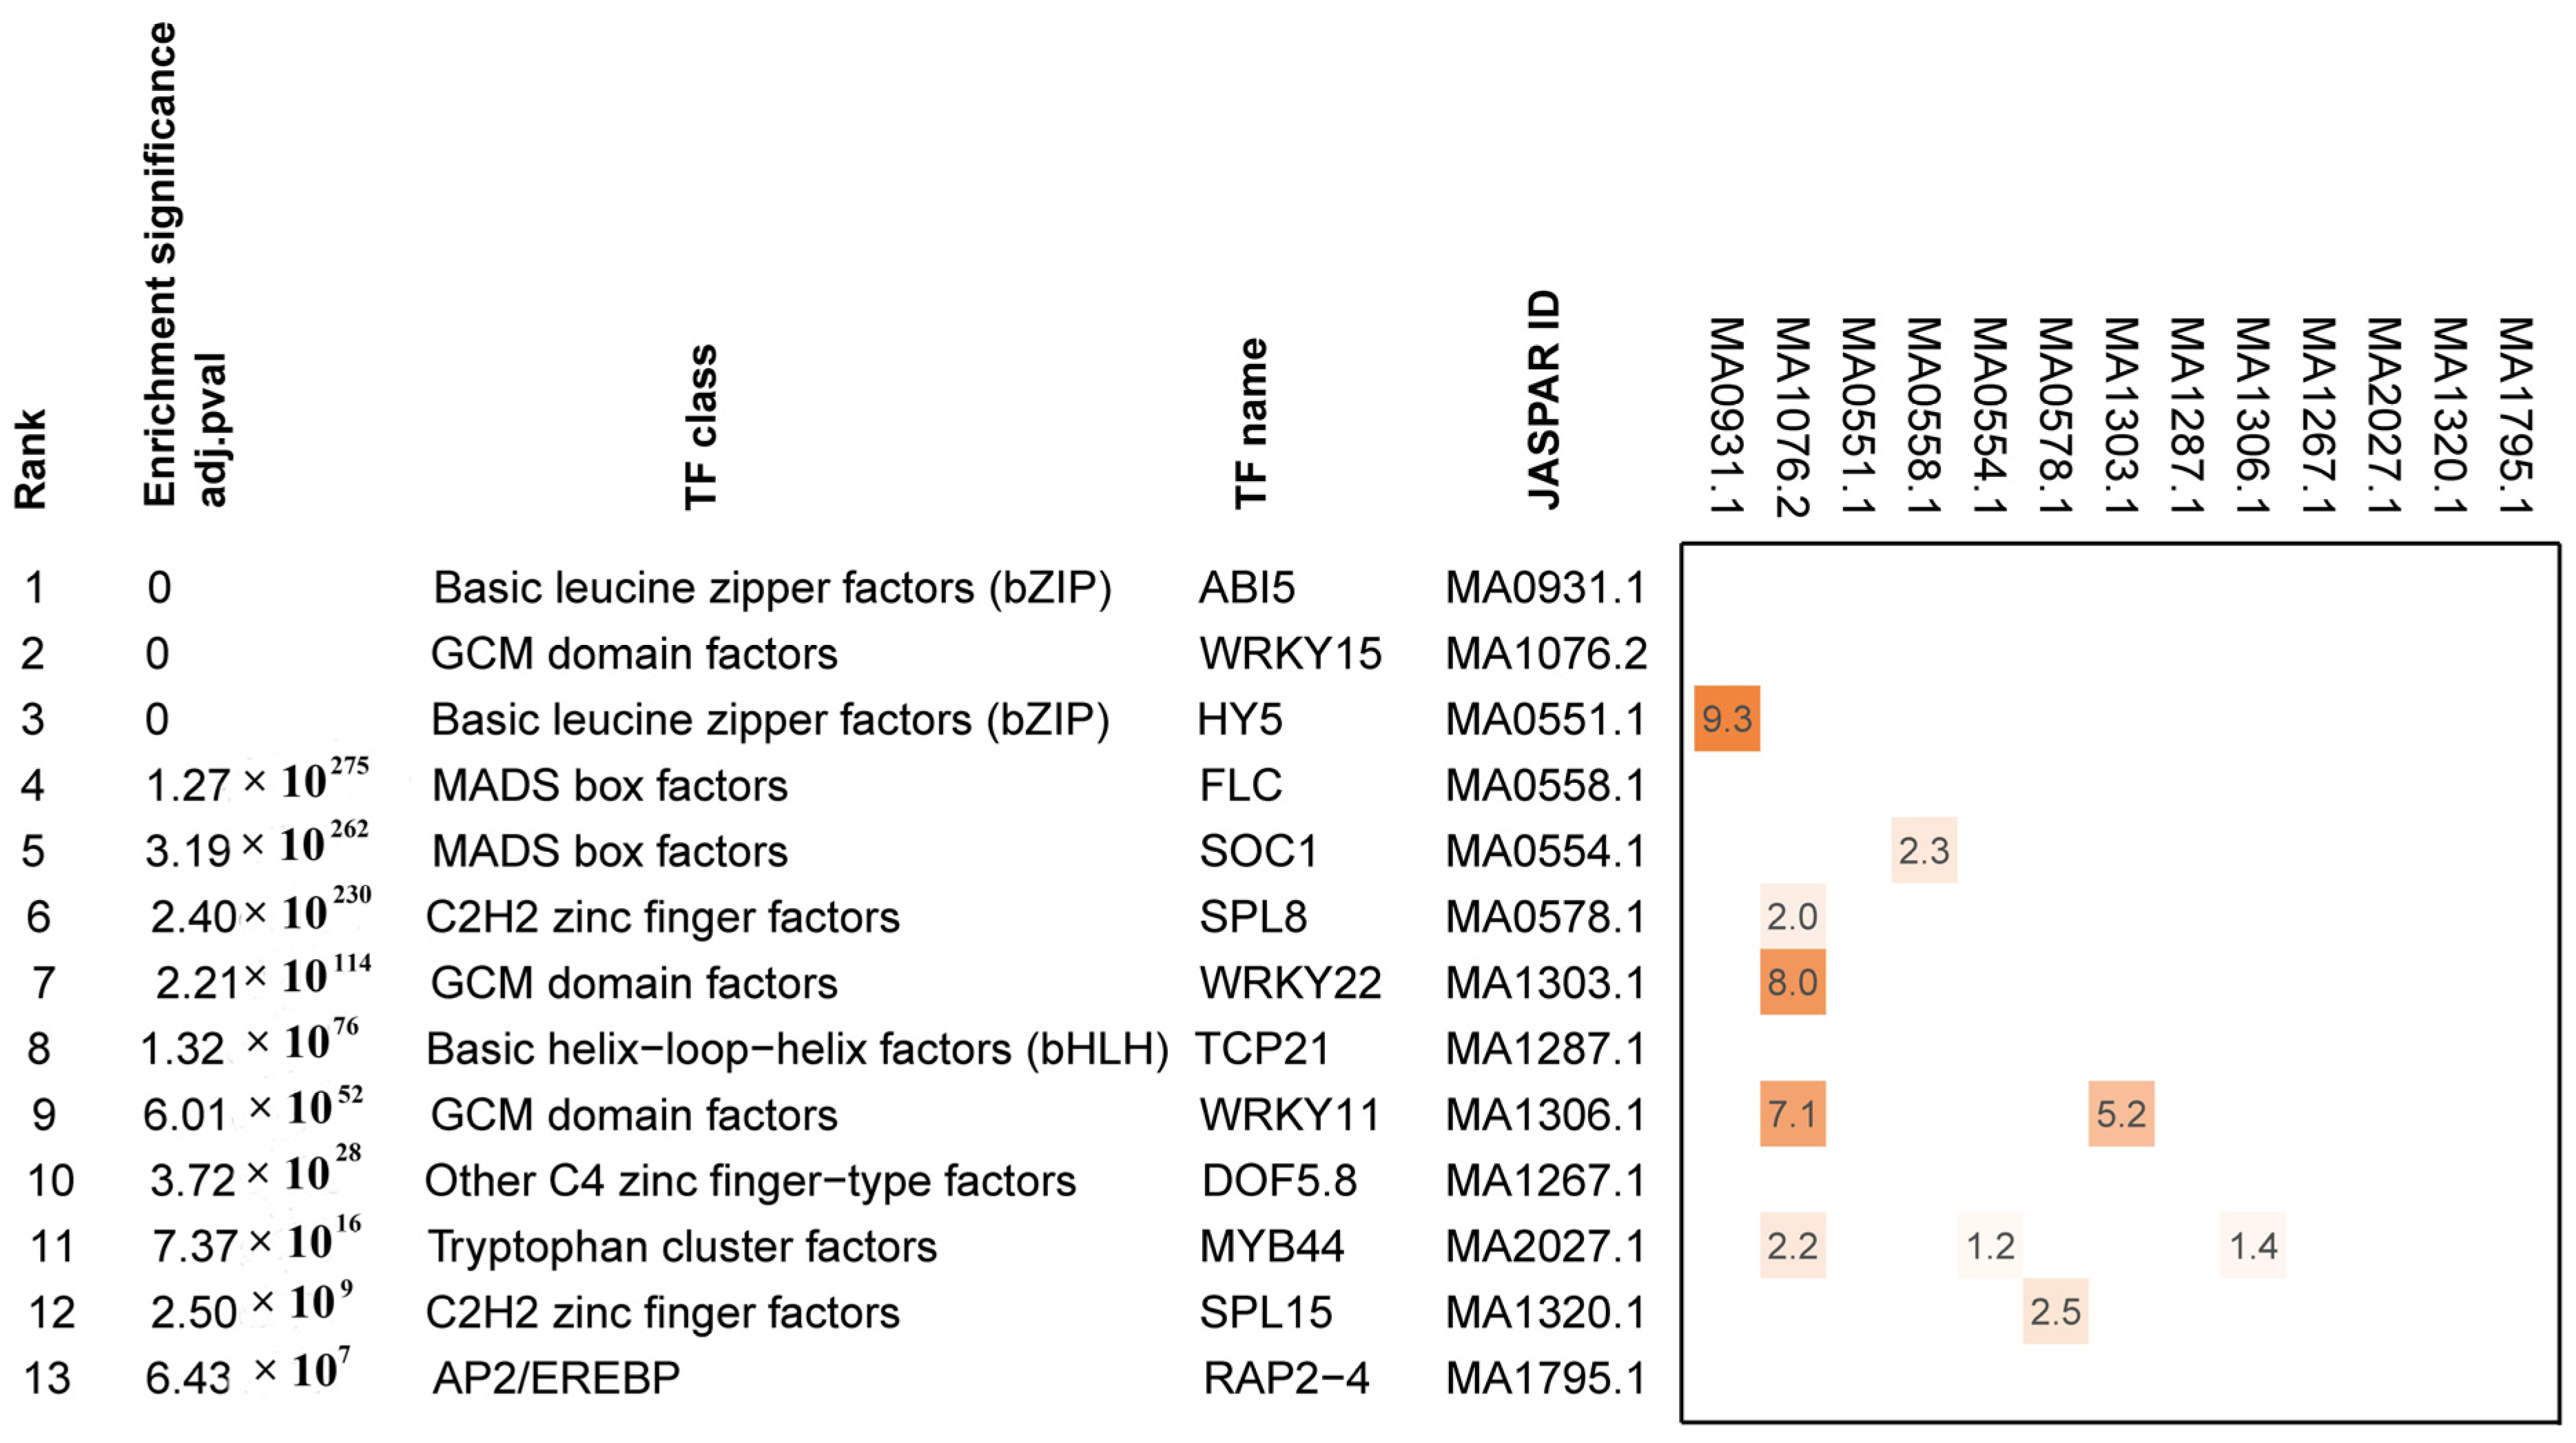
Although 564 Arabidopsis thaliana TFs motifs entered the motif enrichment analysis, the results of overrepresented motifs for DETF genes (Figure 6, Figure 7 and Figure 8) in the promoters of DEGs from CK compared with V14 and V15 are shown in Figure 9. The top four TF classes were basic leucine zipper factors (bZIP), GCM domain factors, MADS-box factors, and C2H2 zinc finger factors, indicating that their closely related TFs may be directly involved in the transcription regulation of broccoli FBD.

3.9. qRT-PCR Analysis Results

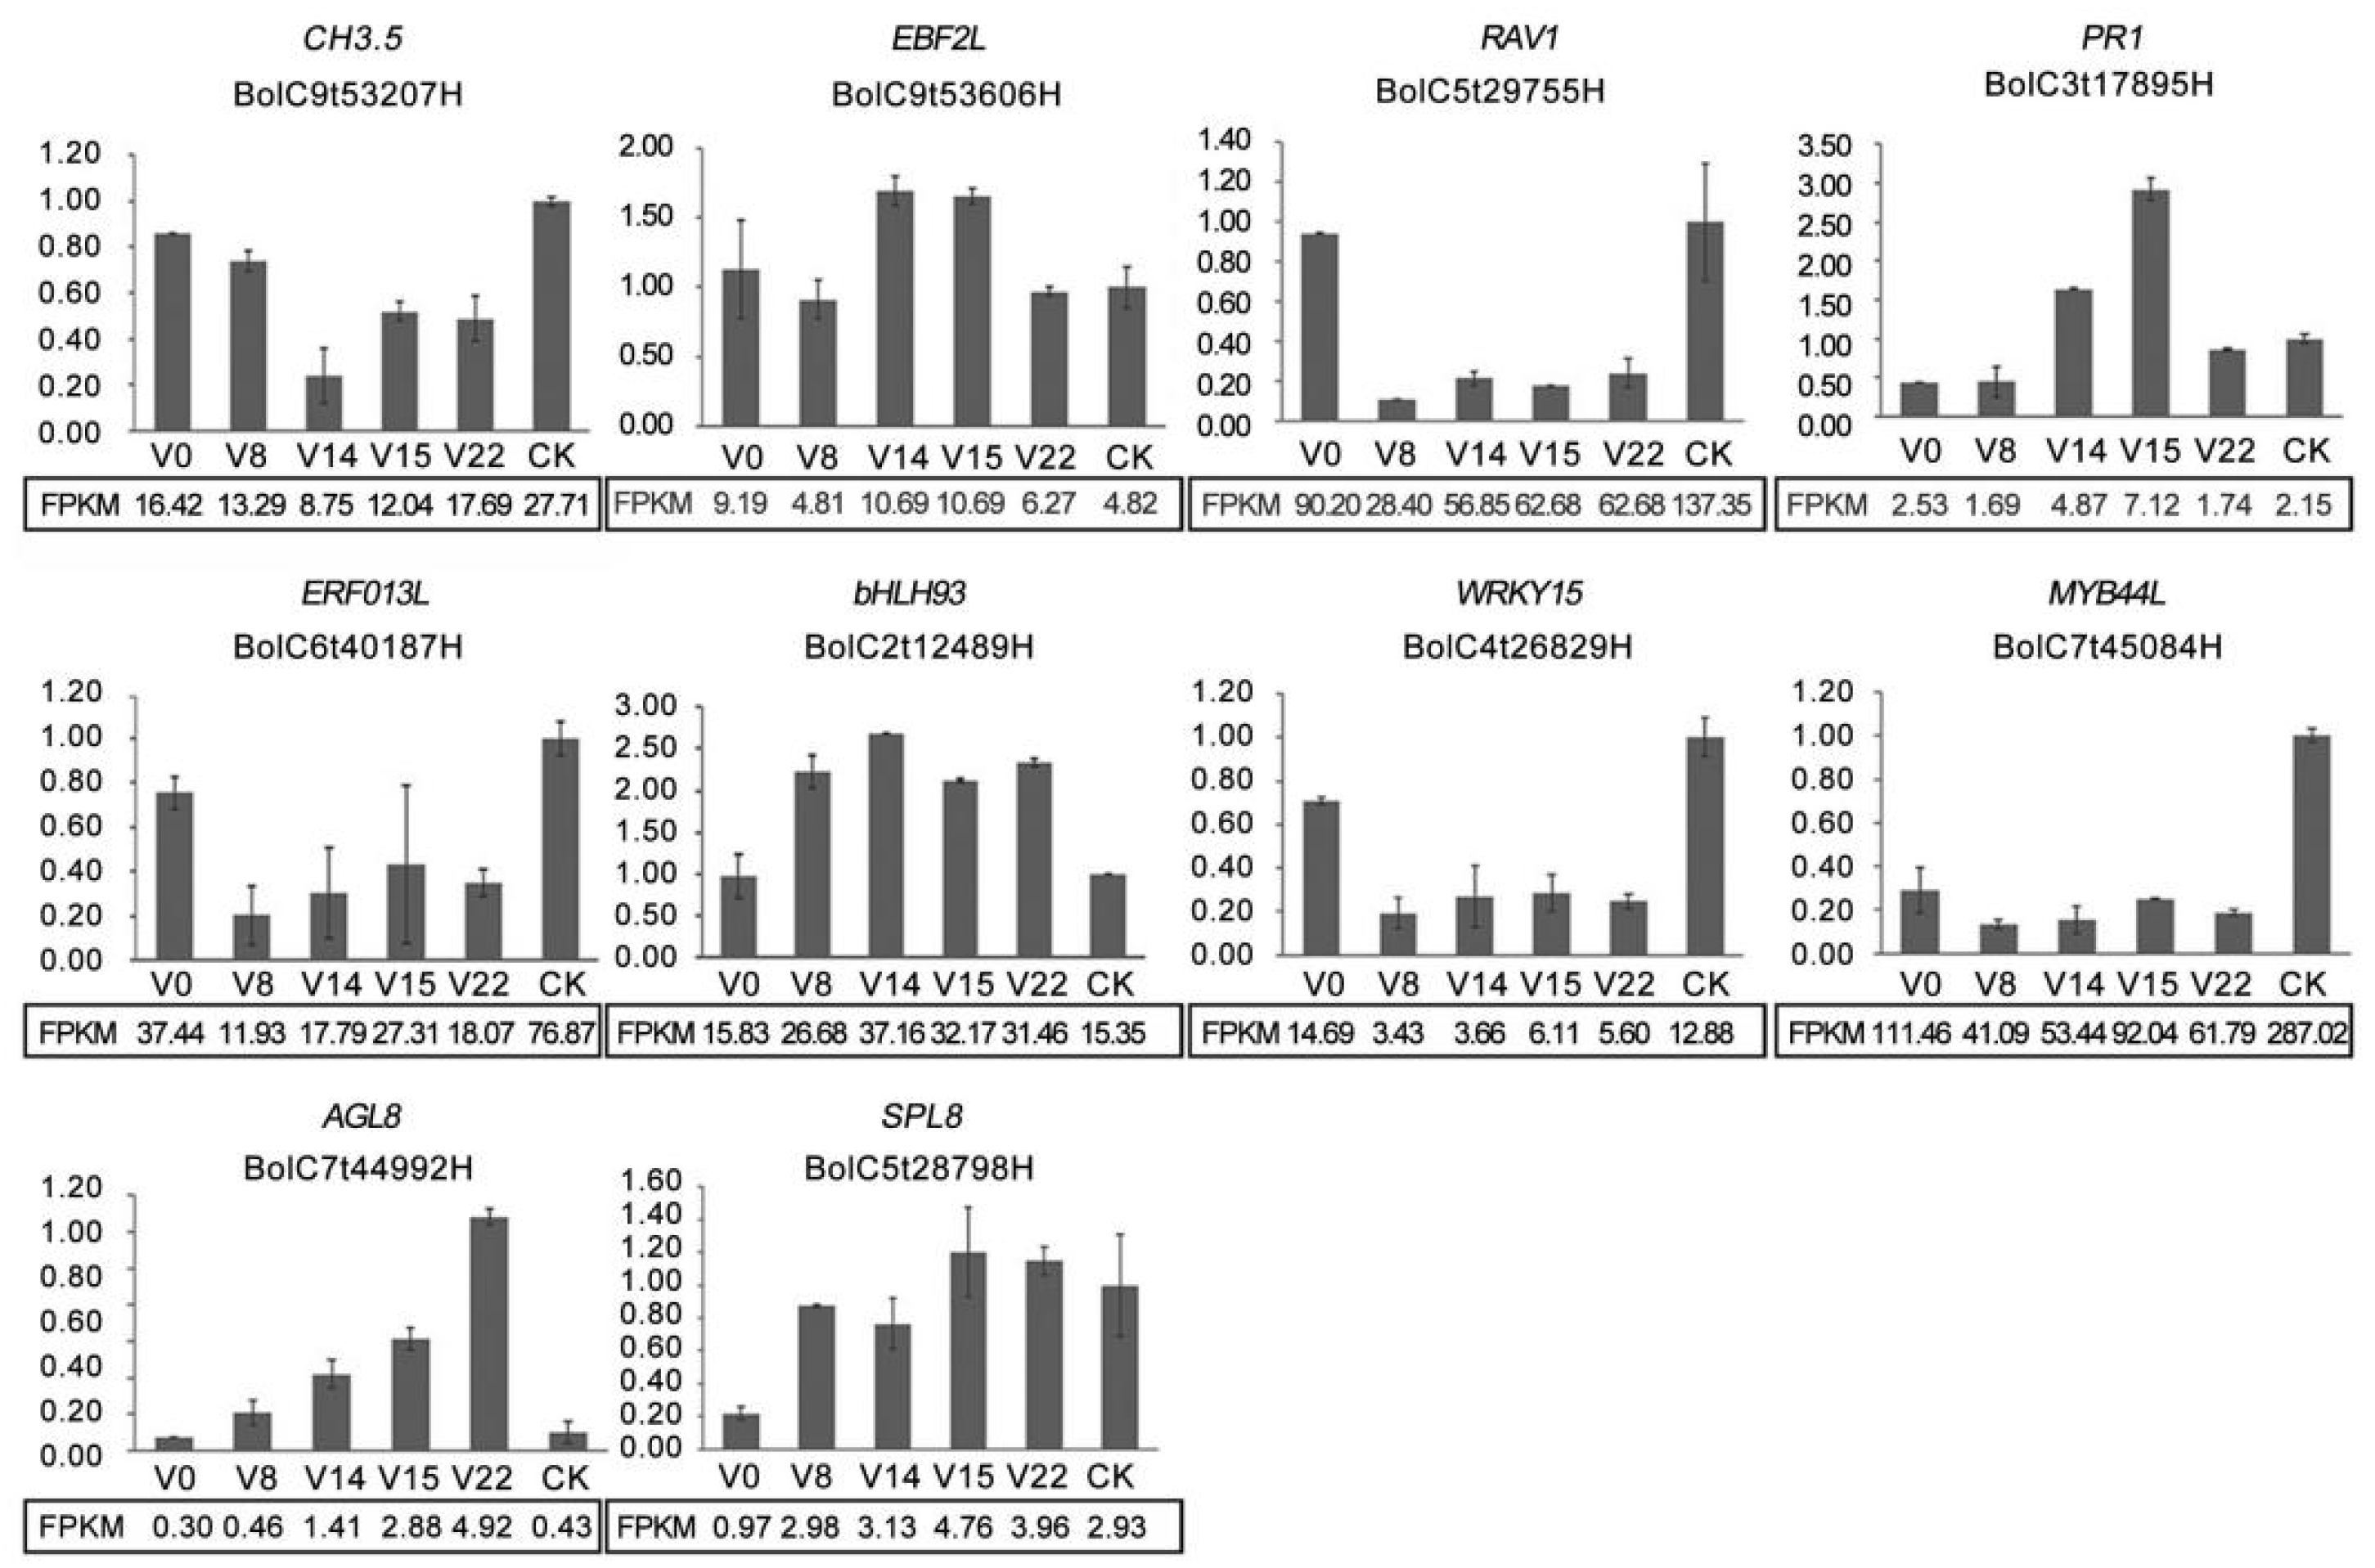
To validate the reliability of the RNA-seq results, ten DEGs (four genes related to plant hormone signaling, four TFs, and two genes related to the FBD pathways) were selected for qRT-PCR validation analysis in six treatments (V0, V8, V14, V15, V22, and CK) (Figure 10). Comparing the results of RNA-seq with qRT-PCR, it was found that the expression trends of ten DEGs at different temperatures and different treatment times at the same temperature were compatible with the sequencing results, suggesting that the RNA-seq results were valid and reliable. Among the ten DEGs, BolC7t44992H (AGL8), related to FBD, was gradually upregulated with prolonged treatment at relatively low temperatures.

4. Discussion

Low temperature is necessary for FBD of Arabidopsis late-flowering ecotypes, Chinese cabbage, and radish [47,48,49]. Similarly, broccoli plants require exposure to low temperatures before FBD and flower formation; so, they usually grow in areas with an average temperature below 18 °C. In this research, the changes in the broccoli shoot tips were observed under a stereomicroscope and by paraffin-sectioning micrographs. FBD began at 15 days in the treatment group (17 °C/9 °C). However, the broccoli shoot tips remained in vegetative growth in the control group (25 °C/17 °C). In addition, transcriptome information was gained by high-throughput sequencing of broccoli shoot tips grown under different temperatures and treatment times. Differences in expression patterns among samples may provide a basis for identifying important genes and pathways during FBD. Coexpression analysis displayed 867 DEGs in the comparison of V0, V8, V14, V15, and V22 and 2059 DEGs in the comparison of CK, V14, and V15. GO and KEGG enrichment analyses were performed for these DEGs. Then, we further analyzed the significant enrichment of DEGs between the critical stages of FBD (V14, V15) and the control treatment (CK), including genes related to plant hormone signaling pathways (Figure 6), transcription factors (Figure 7), and flower development pathways (Figure 8). It has been reported that under specific conditions, regulation of hormone signaling is often achieved by the pooling of different hormone signals and then altering the expression levels of the key flower-forming genes [50]. It has also been shown that TFs interact with genes related to the flower development pathways to regulate plant flowering [51,52]. Meanwhile, analysis of enrichment with binding sites for DETFs involved in the FBD pathway indicated that the top four TF classes were bZIP, GCM domain factors, MADS-box factors, and C2H2 zinc finger factors, whose closely related TFs were directly involved in the transcription regulation of broccoli FBD.
Proteins with the basic leucine zipper motif (bZIP) domains are present in all eukaryotes, and bZIP TFs are located in the nucleolus and participate in plant growth, floral development, and other biological processes [53]. In this study, there were three genes [BolC4t22834H (ABI5), BolC1t04632H (HY5L), and BolC8t47030H (PosF21)] belonging to the bZIP TF class. ABI5 transcription factor regulates floral transition in Arabidopsis thaliana through the central mediator FLC [54]. In our study, ABI5 (BolC4t22834H) was downregulated at relatively low temperatures, suggesting that ABI5 may play a negative regulatory role during broccoli FBD. This is compatible with previous studies on Arabidopsis thaliana [55] and saffron crocus [56]. In addition, the expression level of BolC1t04632H (HY5L) was upregulated. At the same time, that of BolC8t47030H (PosF21) was downregulated under treatment at relatively low temperatures, suggesting that the upregulated expression of BolC1t04632H (HY5L) and downregulated expression of BolC8t47030H (PosF21) may promote broccoli FBD under treatment at relatively low temperatures.
WRKY TFs belonging to GCM domain factors class participate in organelle composition, dwarfism, flowering, fruiting, dormancy, and senescence of plant [51,57,58,59]. Under normal conditions, Arabidopsis thaliana plants overexpressing CsWRKY7 showed a late-flowering phenotype [60]. Under short-day (SD) conditions, WRKY13 interacts with SPL10 to repress the transcriptional function of SPL10, thereby inhibiting flowering [51]. Strawberry FvWRKY71 accelerates flowering by directly regulating the expression of FvFUL, FvSEP1, FvAGL42, FvLFY, and FvFPF1 [52]. In this research, the expression levels of four WRKY TFs [BolC3t21098H (WRKY11), BolC4t26829H (WRKY15), BolC7t46322H (WRKY11), and BolC9t53005H (WRKY22)] were downregulated under treatment at relatively low temperatures, indicating that WRKYs may inhibit broccoli FBD under treatment at relatively low temperatures.
The role of the MADS-box gene family in the floral meristem differentiation into various floral organs has been widely explored [42]. MADS-box genes including SOC1, FLC, and AGLs participated in the regulation of flowering timing in Arabidopsis thaliana [61,62,63,64]. SOC1 and AGLs induced the flowering of Arabidopsis thaliana, while an opposite effect on flowering was exerted by FLC [18,65,66]. In this research, four genes in the MADS-box TF family were upregulated, and one gene was downregulated under treatment at relatively low temperatures, suggesting that the upregulated expression of BolC4t22281 (SOC1), BolC3t15365H (SOC1-like), BolC7t44992H (AGL8), and BolC7t45724H (AGL19) and the downregulated expression of BolC3t13023H (FLC) promote broccoli FBD under treatment at relatively low temperatures.
Temperature and age pathways promote flower formation by regulating SPL expression in Arabidopsis thaliana. The SPL protein family belongs to the C2H2 zinc finger factor class and contains the highly conserved SBP domain [57], which binds to the promoter region of downstream target genes and regulates their expression. SPL promotes the transcription of FT, SOC1, AGL24, and other genes [67,68,69]. The FT/SOC1-mediated photoperiod pathway in Arabidopsis thaliana promotes flowering by directly binding to the promoters of the genes and inducing the SPL3, SPL4, and SPL5 genes [68,70]. SPL8 regulates flowering by positively regulating GA signaling during flower development in Arabidopsis thaliana [67]. Two closely related genes, SPL9 and SPL15, represent an evolutionary branch of the Arabidopsis thaliana SPL family with important functions in flower-forming induction and floral organ development [71,72]. SPL15 directly activates the transcription of the floral regulators FUL and miR172b in SAM during floral induction, promoting flowering [73]. Overexpression of the Lilium LbrSPL15 gene in Arabidopsis thaliana resulted in early flowering in transgenic plants [74]. In the present study, the expression levels of BolC6t37648H (SPL15), BolC4t25008H (SPL15), BolC5t33882H (SPL5), and BolC5t28798H (SPL8) were upregulated under treatment at relatively low temperatures, indicating that they may promote broccoli FBD. This is compatible with previous studies of Arabidopsis thaliana [67,68,73].

5. Conclusions

First, after 15 days of low-temperature treatment, broccoli flower buds began to differentiate. However, the control (normal temperature conditions) was still in the vegetative growth stage, indicating that relatively low temperatures successfully induced flower bud formation. Second, DEGs related to Aux, ABA, ETH, SA, and JA signaling pathways showed different expression patterns under different temperature treatments, which indicated that there may be multiple hormonal interactions in broccoli to regulate FBD induced by relative low temperatures. In addition, the auxin signaling pathway plays a key role in regulating the broccoli FBD induced by relatively low temperatures. Furthermore, bZIP, GCM domain factors, MADS-box factors, and C2H2 zinc finger factors possess enriched motifs, indicating that their closely related DETFs ABI5, HY5L, WRKY11, WRKY15, WRKY22, SOC1, AGL8, FLC, SPL8, and SPL15 may be directly involved in the transcription regulation of broccoli FBD.

Supplementary Materials

The following supporting information can be downloaded at: https://www.mdpi.com/article/10.3390/horticulturae9121353/s1, Figure S1: Correlation analysis between samples; Table S1: Details of primers for qRT-PCR in this study; Table S2: Sequencing statistics and comparison of each library; Table S3: Statistical table of DEGs between V0 and V8, between V0 and V14, between V0 and V15, between V0 and V22, between CK and V14, and between CK and V15; Table S4: Co-expressed genes in broccoli shoot tips under different durations of treatment at relatively low temperatures; Table S5: Co-expressed genes at the critical stage of flower bud differentiation in broccoli; Table S6: DEGs at the critical stage of flower bud differentiation in broccoli involved in the plant hormone signaling pathway; Table S7: DETFs at the critical stage of flower bud differentiation in broccoli; Table S8: DEGs involved in the flower bud differentiation pathway of broccoli.

Author Contributions

Conceptualization, J.X., L.H., M.L. and J.Z.; investigation, W.C., X.H., Z.Z., B.W., Y.J., R.B. and X.Z.; data curation, X.H., Y.J. and J.Z.; writing—original draft preparation, W.C., X.H. and B.W.; writing—review and editing, J.Z.; visualization, X.H. and Z.Z.; project administration, J.Z.; funding acquisition, W.C. and J.Z. All authors have read and agreed to the published version of the manuscript.

Funding

This work was supported by the Natural Science Foundation of Shanxi Province (Grant No. 202203021211280 and 201701D221188) and the Special Plan Project of Shanxi Province for the Transformation of Patent (Grant No. 202201017).

Data Availability Statement

The authors confirm that the data supporting the findings of this study are available within NCBI (PRJNA1022574).

Conflicts of Interest

The authors declare no conflict of interest.

References

  1. Grabowska, A.; Kunicki, E.; Kalisz, A.; Wojciechowska, R.; Leja, M.; Sękara, A. Chilling stress applied to broccoli transplants of different age affects yield of the plants cultivated in summer. Hortic. Sci. 2014, 41, 71–79. [Google Scholar] [CrossRef]
  2. Thiruvengadam, M.; Shih, C.F.; Yang, C.H. Expression of an antisense Brassica oleracea GIGANTEA (BoGI) gene in transgenic broccoli causes delayed flowering, leaf senescence, and post-harvest yellowing retardation. Plant Mol. Biol. Rep. 2015, 33, 1499–1509. [Google Scholar] [CrossRef]
  3. Fahey, J.W.; Zhang, Y.; Talalay, P. Broccoli sprouts: An exceptionally rich source of inducers of enzymes that protect against chemical carcinogens. Proc. Natl. Acad. Sci. USA 1997, 94, 10367–10372. [Google Scholar] [CrossRef] [PubMed]
  4. Lin, C.W.; Fu, S.F.; Liu, Y.J.; Chen, C.C.; Chang, C.H.; Yang, Y.W.; Huang, H.J. Analysis of ambient temperature-responsive transcriptome in shoot apical meristem of heat-tolerant and heat-sensitive broccoli inbred lines during floral head formation. BMC Plant Biol. 2019, 19, 3. [Google Scholar] [CrossRef] [PubMed]
  5. Berndtsson, E.; Andersson, R.; Johansson, E.; Olsson, M.E. Side streams of broccoli leaves: A climate smart and healthy food ingredient. Int. J. Environ. Res. Public Health 2020, 17, 2406. [Google Scholar] [CrossRef]
  6. Cai, G.Q.; Yang, Q.Y.; Chen, H.; Yang, Q.; Zhang, C.Y.; Fan, C.C.; Zhou, Y.M. Genetic dissection of plant architecture and yield-related traits in Brassica napus. Sci. Rep. 2016, 6, 21625. [Google Scholar] [CrossRef]
  7. Li, H.G.; Zhang, L.P.; Hu, J.H.; Zhang, F.G.; Chen, B.Y.; Xu, K.; Gao, G.Z.; Li, H.; Zhang, T.Y.; Li, Z.Y.; et al. Genome-wide association mapping reveals the genetic control underlying branch angle in rapeseed (Brassica napus L.). Front. Plant Sci. 2017, 8, 1054. [Google Scholar] [CrossRef]
  8. Fujime, Y. A difference of response to low temperature between cauliflower and broccoli. Acta Hortic. 1988, 218, 141–152. [Google Scholar] [CrossRef]
  9. Grevsen, K.; Olesen, J.E. Modeling development of broccoli (Brassica oleracea L. var. italica) from transplanting to head initiation. J. Hortic. Sci. Biotechnol. 1999, 74, 698–705. [Google Scholar] [CrossRef]
  10. Kałużewicz, A.; Krzesiński, W.; Knaflewski, M.; Lisiecka, J.; Spiżewski, T.; Frąszczak, B. The effect of temperature on the broccoli yield and length of the period from head initiation to harvest. Acta Sci. Pol. Hortorum Cultus 2010, 9, 167–174. [Google Scholar]
  11. Grabowska, A.; Sękara, A.; Bieniasz, M.; Kunicki, E.; Kalisz, A. Dark-chilling of seedlings affects initiation and morphology of broccoli inflorescence. Not. Bot. Horti Agrobot. Cluj-Napoca 2013, 41, 213–218. [Google Scholar] [CrossRef]
  12. Huang, B.Y.; Qian, P.P.; Gao, N.; Shen, J.; Hou, S.W. Fackel interacts with gibberellic acid signaling and vernalization to mediate flowering in Arabidopsis. Planta 2017, 245, 939–950. [Google Scholar] [CrossRef] [PubMed]
  13. Luo, X.; He, Y.H. Experiencing winter for spring flowering: A molecular epigenetic perspective on vernalization. J. Integr. Plant Biol. 2020, 62, 104–117. [Google Scholar] [CrossRef] [PubMed]
  14. Mouradov, A.; Cremer, F.; Coupland, G. Control of flowering time: Interacting pathways as a basis for diversity. Plant Cell 2002, 14, S111–S130. [Google Scholar] [CrossRef]
  15. Komeda, Y. Genetic regulation of time to flower in Arabidopsis thaliana. Annu. Rev. Plant Biol. 2004, 55, 521–535. [Google Scholar] [CrossRef]
  16. Kim, D.H. Current understanding of flowering pathways in plants: Focusing on the vernalization pathway in Arabidopsis and several vegetable crop plants. Hortic. Environ. Biotechnol. 2020, 61, 209–227. [Google Scholar] [CrossRef]
  17. Li, H.J.; Fan, Y.H.; Yu, J.Y.; Chai, L.; Zhang, J.F.; Jiang, J.; Cui, C.; Zheng, B.C.; Jiang, L.C.; Lu, K. Genome-wide identification of flowering-time genes in Brassica species and reveals a correlation between selective pressure and expression patterns of vernalization-pathway genes in Brassica napus. Int. J. Mol. Sci. 2018, 19, 3632. [Google Scholar] [CrossRef]
  18. Michaels, S.D.; Amasino, R.M. FLOWERING LOCUS C encodes a novel MADS domain protein that acts as a repressor of flowering. Plant Cell 1999, 11, 949–956. [Google Scholar] [CrossRef]
  19. Sheldon, C.C.; Rouse, D.T.; Finnegan, E.J.; Peacock, W.J.; Dennis, E.S. The molecular basis of vernalization: The central role of FLOWERING LOCUS C (FLC). Proc. Natl. Acad. Sci. USA 2000, 97, 3753–3758. [Google Scholar] [CrossRef]
  20. Searle, I.; He, Y.H.; Turck, F.; Vincent, C.; Fornara, F.; Kröber, S.; Amasino, R.A.; Coupland, G. The transcription factor FLC confers a flowering response to vernalization by repressing meristem competence and systemic signaling in Arabidopsis. Genes Dev. 2006, 20, 898–912. [Google Scholar] [CrossRef]
  21. Putterill, J.; Robson, F.; Lee, K.; Simon, R.; Coupland, G. The CONSTANS gene of Arabidopsis promotes flowering and encodes a protein showing similarities to zinc finger transcription factors. Cell 1995, 80, 847–857. [Google Scholar] [CrossRef] [PubMed]
  22. Samach, A.; Onouchi, H.; Gold, S.E.; Ditta, G.S.; Schwarz-Sommer, Z.; Yanofsky, M.F.; Coupland, G. Distinct roles of CONSTANS target genes in reproductive development of Arabidopsis. Science 2000, 288, 1613–1616. [Google Scholar] [CrossRef] [PubMed]
  23. Huang, G.W.; Ma, J.H.; Han, Y.Z.; Chen, X.J.; Fu, Y.F. Cloning and expression analysis of the soybean CO-Like gene GmCOL9. Plant Mol. Biol. Rep. 2011, 29, 352–359. [Google Scholar] [CrossRef]
  24. Cheng, X.F.; Wang, Z.Y. Overexpression of COL9, a CONSTANS-LIKE gene, delays flowering by reducing expression of CO and FT in Arabidopsis thaliana. Plant J. 2005, 43, 758–768. [Google Scholar] [CrossRef] [PubMed]
  25. Steinbach, Y. The Arabidopsis thaliana CONSTANS-LIKE 4 (COL4)–A modulator of flowering time. Front. Plant Sci. 2019, 10, 651. [Google Scholar] [CrossRef] [PubMed]
  26. Carr, S.M.; Irish, V.F. Floral homeotic gene expression defines developmental arrest stages in Brassica oleraeea L. vars botrytis and italica. Planta 1997, 201, 179–188. [Google Scholar] [CrossRef]
  27. Duclos, D.V.; Björkman, T. Meristem identity gene expression during curd proliferation and flower initiation in Brassica oleracea. J. Exp. Bot. 2008, 59, 421–433. [Google Scholar] [CrossRef]
  28. Ridge, S.; Brown, P.H.; Hecht, V.; Driessen, R.G.; Weller, J.L. The role of BoFLC2 in cauli-flower (Brassica oleracea var. botrytis L.) reproductive development. J. Exp. Bot. 2015, 66, 125–135. [Google Scholar] [CrossRef]
  29. Tyagi, S.; Sri, T.; Singh, A.; Mayee, P.; Shivaraj, S.M.; Sharma, P.; Singh, A. SUPPRESSOR OF OVEREXPRESSION OF CONSTANS1 influences flowering time, lateral branching, oil quality, and seed yield in Brassica juncea cv. Varuna. Funct. Integr. Genom. 2019, 19, 43–60. [Google Scholar] [CrossRef]
  30. Fujime, Y.; Okuda, N. The physiology of flowering in Brassicas, especially about cauliflower and broccoli. Acta Hortic. 1996, 407, 247–254. [Google Scholar] [CrossRef]
  31. Grabowska, A.; Kunicki, E.; Libik, A. Effects of age and cold storage of transplants on the growth and quality of broccoli heads. J. Fruit Ornam. Plant Res. 2007, 66, 31–38. [Google Scholar] [CrossRef]
  32. Kalisz, A.; Cebula, S.; Kunicki, E.; Gil, J.; Sekara, A.; Grabowska, A. Effect of chilling stress before transplanting on morphological parameters of broccoli heads. Acta Sci. Pol. Hortorum Cultus 2014, 13, 129–139. [Google Scholar]
  33. Garcês, H.; Sinha, N. Fixing and sectioning tissue from the plant Kalanchoë daigremontiana. Cold Spring Harb. Protoc. 2009, 10, pdb.prot5301. [Google Scholar] [CrossRef] [PubMed]
  34. Kim, D.; Langmead, B.; Salzberg, S.L. HISAT: A fast spliced aligner with low memory requirements. Nat. Methods 2015, 12, 357–360. [Google Scholar] [CrossRef] [PubMed]
  35. Love, M.I.; Huber, W.; Anders, S. Moderated estimation of fold change and dispersion for RNA-seq data with DESeq2. Genome Biol. 2014, 15, 550. [Google Scholar] [CrossRef]
  36. Oshchepkov, D.; Chadaeva, I.; Kozhemyakina, R.; Shikhevich, S.; Sharypova, E.; Savinkova, L.; Klimova, N.V.; Tsukanov, A.; Levitsky, V.G.; Markel, A.L. Transcription factors as important regulators of changes in behavior through domestication of gray rats: Quantitative data from RNA sequencing. Int. J. Mol. Sci. 2022, 23, 12269. [Google Scholar] [CrossRef]
  37. Livak, K.J.; Schmittgen, T.D. Analysis of relative gene expression data using real-time quantitative PCR and the 2−ΔΔCT method. Methods 2001, 25, 402–408. [Google Scholar] [CrossRef]
  38. Kazan, K.; Lyons, R. The link between flowering time and stress tolerance. J. Exp. Bot. 2016, 67, 47–60. [Google Scholar] [CrossRef]
  39. Bao, S.J.; Hua, C.M.; Shen, L.S.; Yu, H. New insights into gibberellin signaling in regulating flowering in Arabidopsis thaliana. J. Integr. Plant Biol. 2020, 62, 118–131. [Google Scholar] [CrossRef]
  40. Liu, F.; Wang, Y.; Ding, Z.T.; Zhao, L.; Xiao, J.; Wang, L.J.; Ding, S.B. Transcriptomic analysis of flower development in tea (Camellia sinensis (L.)). Gene 2017, 631, 39–51. [Google Scholar] [CrossRef]
  41. Wils, C.R.; Kaufmann, K. Gene-regulatory networks controlling inflorescence and flower development in Arabidopsis thaliana. BBA Gene Regul. Mech. 2017, 1860, 95–105. [Google Scholar] [CrossRef] [PubMed]
  42. Boss, P.K.; Sensi, E.; Hua, C.; Davies, C.; Thomas, M.R. Cloning and characterisation of grapevine (Vitis vinifera L.) MADS-box genes expressed during inflorescence and berry development. Plant Sci. 2002, 162, 887–895. [Google Scholar] [CrossRef]
  43. Ding, L.; Kim, S.Y.; Michaels, S.D. FLOWERING LOCUS C EXPRESSOR family proteins regulate FLOWERING LOCUS C expression in both winter-annual and rapid-cycling Arabidopsis. Plant Physiol. 2013, 163, 243–252. [Google Scholar] [CrossRef] [PubMed]
  44. Baudry, A.; Ito, S.; Song, Y.H.; Strait, A.A.; Kiba, T.; Lu, S.; Henriques, R.; Pruneda-Paz, J.L.; Chua, N.H.; Tobin, E.M.; et al. F-Box proteins FKF1 and LKP2 act in concert with ZEITLUPE to control Arabidopsis clock progression. Plant Cell 2010, 22, 606–622. [Google Scholar] [CrossRef] [PubMed]
  45. Sawa, M.; Kay, S.A. GIGANTEA directly activates Flowering Locus T in Arabidopsis thaliana. Proc. Natl. Acad. Sci. USA 2011, 108, 11698–11703. [Google Scholar] [CrossRef] [PubMed]
  46. Chen, Y.X.; Zhou, R.J.; Hu, Q.; Wei, W.L.; Liu, J. Conservation and divergence of the CONSTANS-Like (COL) genes related to flowering and circadian rhythm in Brassica napus. Front. Plant Sci. 2021, 12, 760379. [Google Scholar] [CrossRef] [PubMed]
  47. Wilkosz, R.; Schlappi, M. A gene expression screen identifies EARLI1 as a novel vernalization-responsive gene in Arabidopsis thaliana. Plant Mol. Biol. 2000, 44, 777–787. [Google Scholar] [CrossRef]
  48. Dai, Y.; Zhang, S.J.; Sun, X.; Li, G.L.; Yuan, L.Y.; Li, F.; Zhang, H.; Zhang, S.F.; Chen, G.H.; Wang, C.G.; et al. Comparative transcriptome analysis of gene expression and regulatory characteristics associated with different vernalization periods in Brassica rapa. Genes 2020, 11, 392. [Google Scholar] [CrossRef]
  49. Sun, I.H.; Kim, J.E.; Na, H. Flower bud differentiation in response to low temperature treatment and day-length extension treatment in radish (Raphanus sativus L.). Korean J. Breed. Sci. 2016, 48, 48–53. [Google Scholar] [CrossRef]
  50. Conti, L. Hormonal control of the floral transition: Can one catch them all? Dev. Biol. 2017, 430, 288–301. [Google Scholar] [CrossRef]
  51. Ma, Z.B.; Li, W.; Wang, H.P.; Yu, D.Q. WRKY transcription factors WRKY12 and WRKY13 interact with SPL10 to modulate age-mediated flowering. J. Integr. Plant Biol. 2020, 62, 1659–1673. [Google Scholar] [CrossRef] [PubMed]
  52. Lei, Y.Y.; Sun, Y.P.; Wang, B.T.; Yu, S.; Dai, H.Y.; Li, H.; Zhang, Z.H.; Zhang, J.X. Woodland strawberry WRKY71 acts as a promoter of flowering via a transcriptional regulatory cascade. Hortic. Res. 2020, 7, 137. [Google Scholar] [CrossRef] [PubMed]
  53. Jakoby, M.; Weisshaar, B.; Dröge-Laser, W.; Vicente-Carbajosa, J.; Tiedemann, J.; Kroj, T.; Parcy, F. bZIP transcription factors in Arabidopsis. Trends Plant Sci. 2002, 7, 106–111. [Google Scholar] [CrossRef] [PubMed]
  54. Wang, Y.P.; Li, L.; Ye, T.T.; Lu, Y.M.; Chen, X.; Wu, Y. The inhibitory effect of ABA on floral transition is mediated by ABI5 in Arabidopsis. J. Exp. Bot. 2013, 64, 675–684. [Google Scholar] [CrossRef] [PubMed]
  55. Paul, P.; Dhandapani, V.; Rameneni, J.J.; Li, X.N.; Sivanandhan, G.; Choi, S.R.; Pang, W.X.; Im, S.; Lim, Y.P. Genome-wide analysis and characterization of Aux/IAA family genes in Brassica rapa. PLoS ONE 2016, 11, e0151522. [Google Scholar] [CrossRef] [PubMed]
  56. Renau-Morata, B.; Nebauer, S.G.; García-Carpintero, V.; Cañizares, J.; Minguet, E.G.; de los Mozos, M.; Molina, R.V. Flower induction and development in saffron: Timing and hormone signalling pathways. Ind. Crop. Prod. 2021, 164, 113370. [Google Scholar] [CrossRef]
  57. Blanc-Mathieu, R.; Dumas, R.; Turchi, L.; Lucas, J.; Parcy, F. Plant-TFClass: A structural classification for plant transcription factors. Trends Plant Sci. 2023, 21, S1360–S1385. [Google Scholar] [CrossRef] [PubMed]
  58. Chen, L.G.; Zhang, L.P.; Li, D.B.; Wang, F.; Yu, D.Q. WRKY8 transcription factor functions in the TMV-cg defense response by mediating both abscisic acid and ethylene signaling in Arabidopsis. Proc. Natl. Acad. Sci. USA 2013, 110, 1963–1971. [Google Scholar] [CrossRef]
  59. Jiang, Y.J.; Liang, G.; Yang, S.Z.; Yu, D.Q. Arabidopsis WRKY57 functions as a node of convergence for Jasmonic acid- and Auxin-mediated signals in Jasmonic acid-induced leaf senescence. Plant Cell 2014, 26, 230–245. [Google Scholar] [CrossRef]
  60. Chen, W.; Hao, W.J.; Xu, Y.X.; Zheng, C.; Ni, D.J.; Yao, M.Z.; Chen, L. Isolation and characterization of CsWRKY7, a subgroup IId WRKY transcription factor from Camellia sinensis, linked to development in Arabidopsis. Int. J. Mol. Sci. 2019, 20, 2815. [Google Scholar] [CrossRef]
  61. Sheldon, C.C.; Hills, M.J.; Lister, C.; Dean, C.; Dennis, E.S.; Peacock, W.J. Resetting of FLOWERING LOCUS C expression after epigenetic repression by vernalization. Proc. Natl. Acad. Sci. USA 2008, 105, 2214–2219. [Google Scholar] [CrossRef] [PubMed]
  62. Lee, H.; Suh, S.S.; Park, E.; Cho, E.; Ahn, J.H.; Kim, S.G.; Lee, J.S.; Kwon, Y.M.; Lee, I. The AGAMOUS-LIKE 20 MADS domain protein integrates floral inductive pathways in Arabidopsis. Genes Dev. 2000, 14, 2366–2376. [Google Scholar] [CrossRef] [PubMed]
  63. Scortecci, K.C.; Michaels, S.D.; Amasino, R.M. Identification of a MADS-box gene, FLOWERING LOCUS M, that represses flowering. Plant J. 2001, 26, 229–236. [Google Scholar] [CrossRef] [PubMed]
  64. Theißen, G. Development of floral organ identity: Stories from the MADS house. Curr. Opin. Plant Biol. 2001, 4, 75–85. [Google Scholar] [CrossRef] [PubMed]
  65. Lee, J.; Lee, I. Regulation and function of SOC1, a flowering pathway integrator. J. Exp. Bot. 2010, 61, 2247–2254. [Google Scholar] [CrossRef]
  66. Michaels, S.D.; Ditta, G.; Gustafson-Brown, C.; Pelaz, S.; Yanofsky, M.; Amasino, R.M. AGL24 acts as a promoter of flowering in Arabidopsis and is positively regulated by vernalization. Plant J. 2003, 33, 867–874. [Google Scholar] [CrossRef]
  67. Zhang, Y.; Schwarz, S.; Saedler, H.; Huijser, P. SPL8, a local regulator in a subset of gibberellin-mediated developmental processes in Arabidopsis. Plant Mol. Biol. 2007, 63, 429–439. [Google Scholar] [CrossRef]
  68. Jung, J.H.; Ju, Y.; Seo, P.J.; Lee, J.H.; Park, C.M. The SOC1-SPL module integrates photoperiod and gibberellic acid signals to control flowering time in Arabidopsis. Plant J. 2012, 69, 577–588. [Google Scholar] [CrossRef]
  69. Yu, S.; Galvão, V.C.; Zhang, Y.C.; Horrer, D.; Zhang, T.Q.; Hao, Y.H.; Feng, Y.Q.; Wang, S.; Schmid, M.; Wang, J.W. Gibberellin regulates the Arabidopsis floral transition through miR156-targeted SQUAMOSA PROMOTER BINDING-LIKE transcription factors. Plant Cell 2012, 24, 3320–3332. [Google Scholar] [CrossRef]
  70. Schmid, M.; Uhlenhaut, N.H.; Godard, F.; Demar, M.; Bressan, R.; Weigel, D.; Lohmann, J.U. Dissection of floral induction pathways using global expression analysis. Development 2003, 130, 6001–6012. [Google Scholar] [CrossRef]
  71. Wang, Y.; Hu, Z.L.; Yang, Y.X.; Chen, X.Q.; Chen, G.P. Function annotation of an SBP-box gene in Arabidopsis based on analysis of co-expression networks and promoters. Int. J. Mol. Sci. 2009, 10, 116–132. [Google Scholar] [CrossRef] [PubMed]
  72. Wu, G.; Park, M.Y.; Conway, S.R.; Wang, J.W.; Weigel, D.; Poethig, R.S. The sequential action of miR156 and miR172 regulates developmental timing in Arabidopsis. Cell 2009, 138, 750–759. [Google Scholar] [CrossRef] [PubMed]
  73. Hyun, Y.B.; Richter, R.; Vincent, C.; Martinez-Gallegos, R.; Porri, A.; Coupland, G. Multi-layered regulation of SPL15 and cooperation with SOC1 integrate endogenous flowering pathways at the Arabidopsis shoot meristem. Dev. Cell 2016, 37, 254–266. [Google Scholar] [CrossRef] [PubMed]
  74. Zhao, M.N.; Liu, R.X.; Chen, Y.; Cui, J.T.; Ge, W.; Zhang, K.Z. Molecular identification and functional verification of SPL9 and SPL15 of lilium. Mol. Genet. Genom. 2022, 297, 63–74. [Google Scholar] [CrossRef]
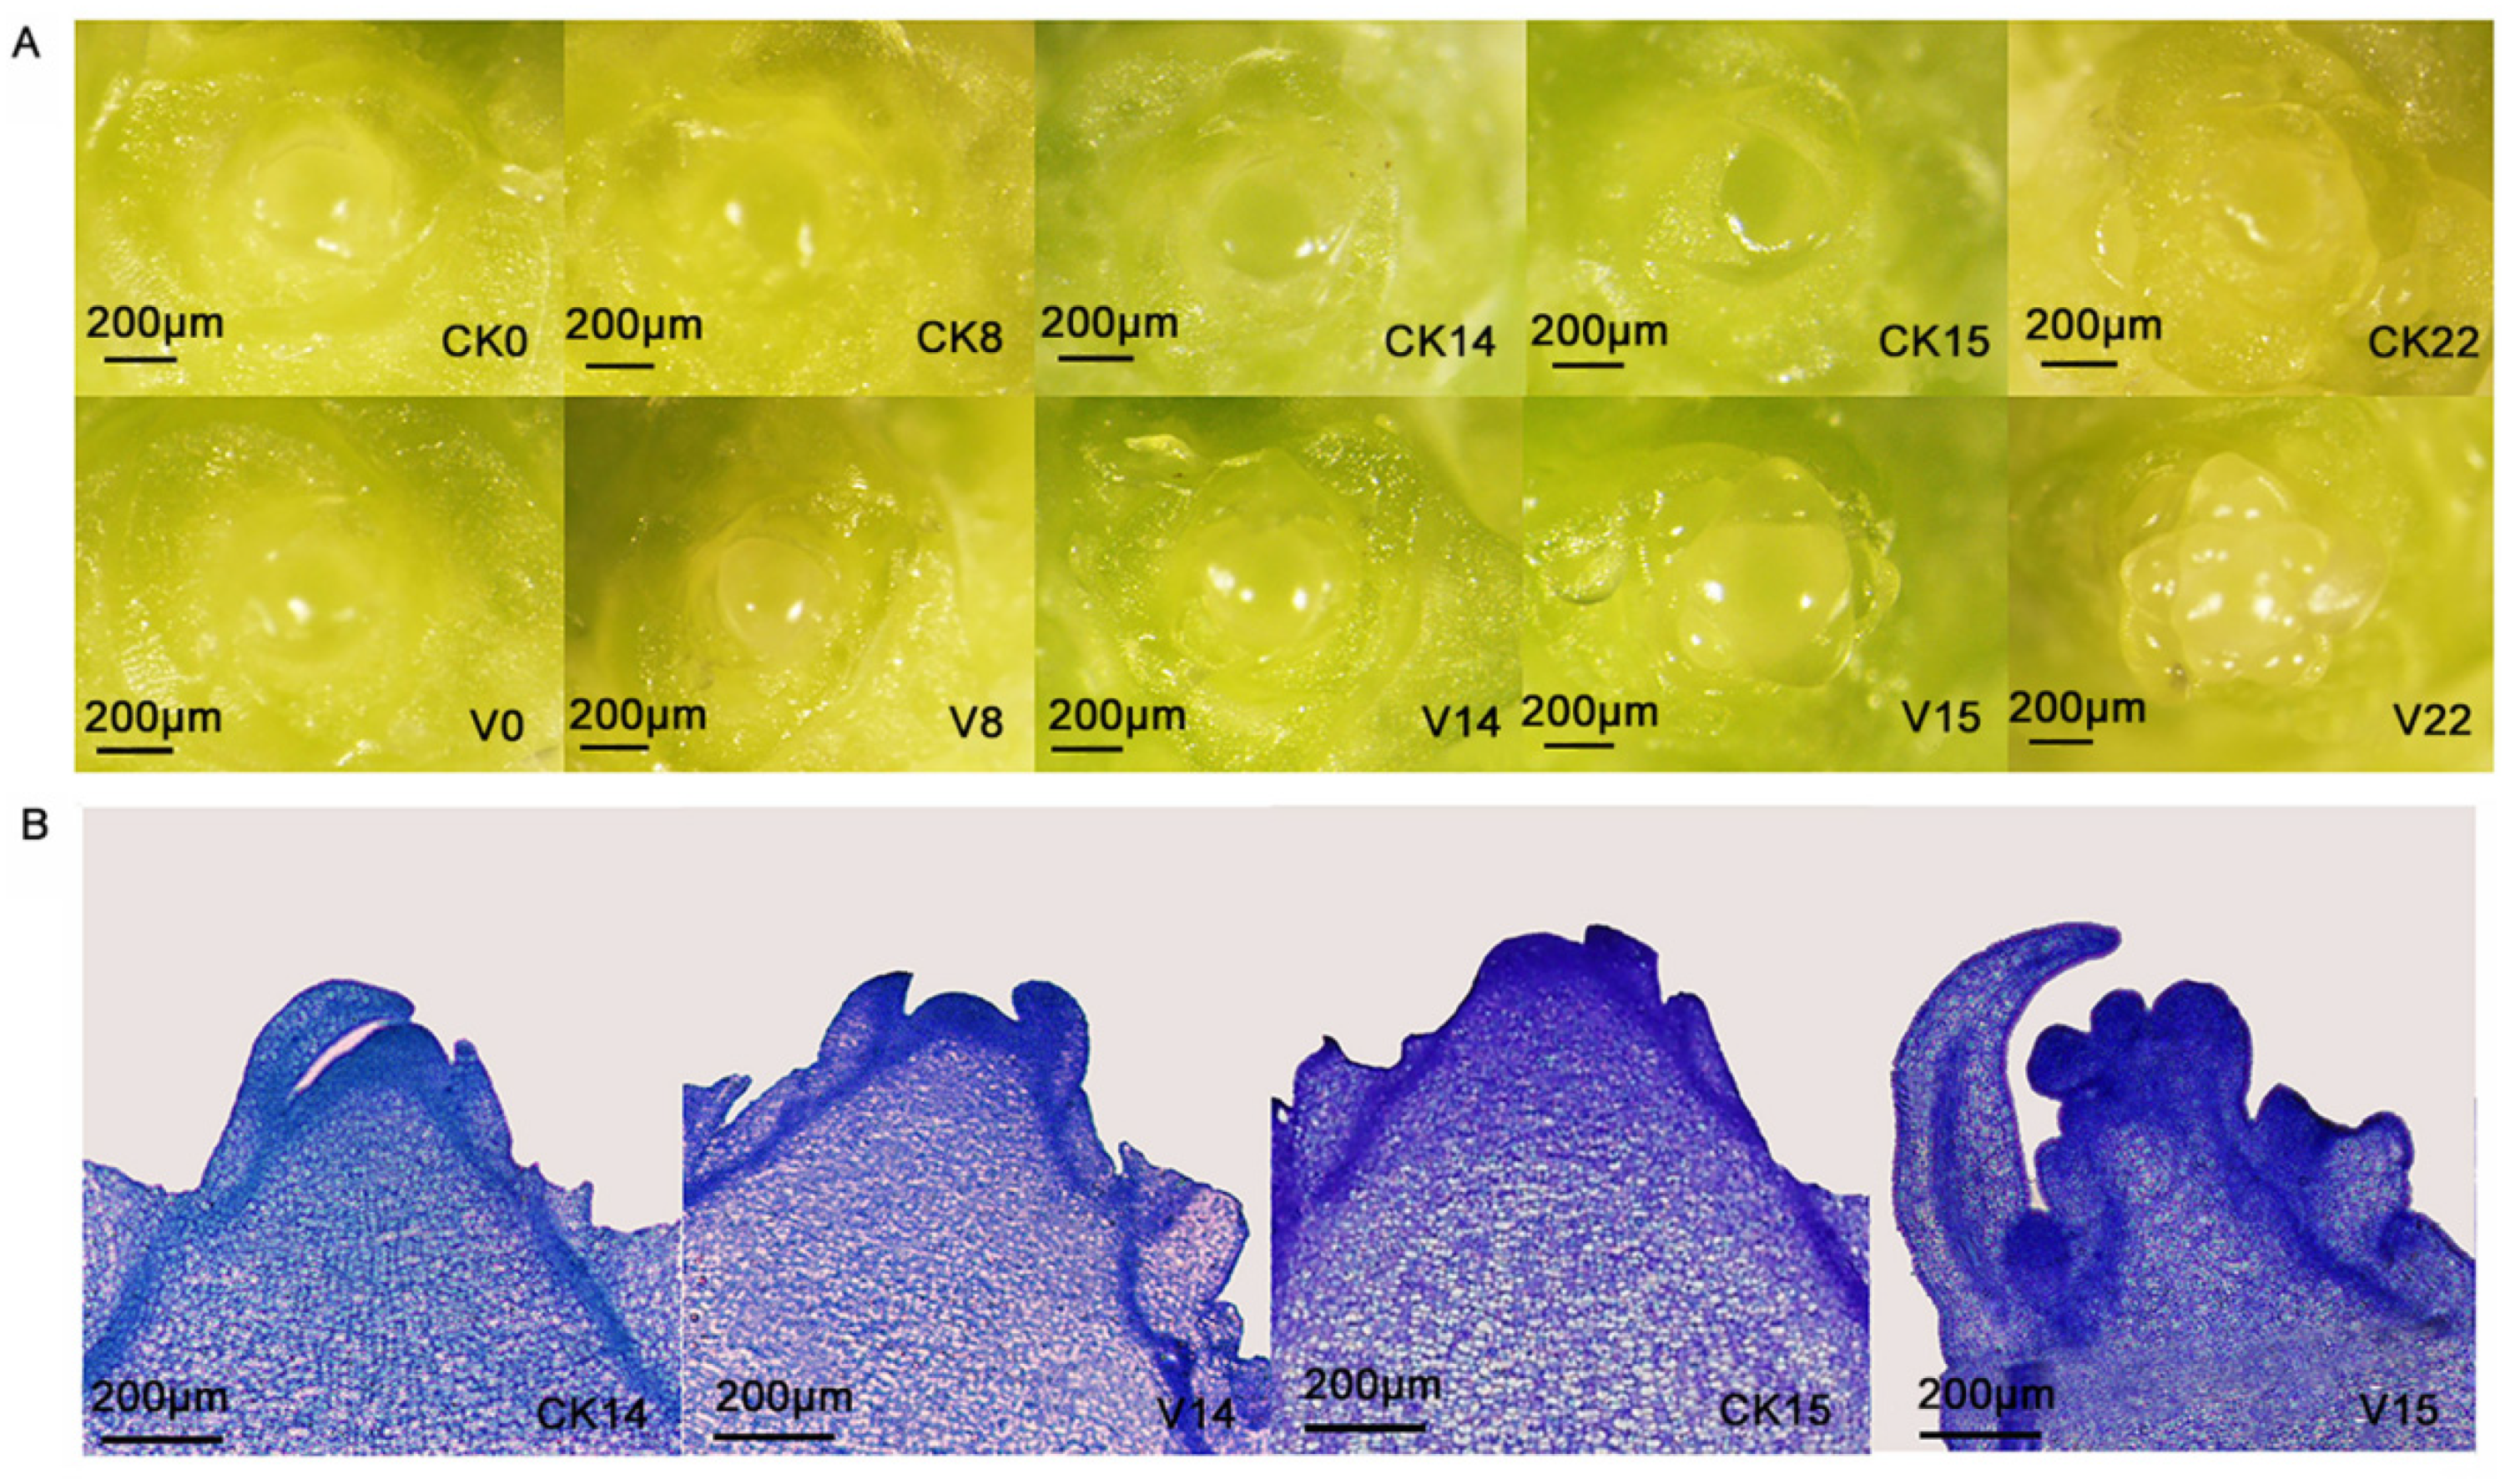
Figure 1. Broccoli shoot tip phenotype after different treatment durations under relatively low temperatures. (A) Stereomicrograph. (B) Paraffin sectioning micrographs at the critical stage of broccoli FBD. CK0, CK8, CK14, CK15, and CK22 are the broccoli shoot tips treated under a photoperiod of 16 h/8 h and temperature of 25 °C/17 °C for 0 days, 8 days, 14 days, 15 days, and 22 days. V0, V8, V14, V15, and V22 are the broccoli shoot tips treated under a photoperiod of 16 h/8 h and temperature of 17 °C/9 °C for 0 days, 8 days, 14 days, 15 days, and 22 days.
Horticulturae 09 01353 g001
Figure 2. Comparative analysis of DEGs in broccoli shoot tips at relatively low temperatures. (A) The number of DEGs in V0 compared with V8, V14, V15, and V22, as well as CK with V14 and V15. (B) Venn diagram of the number of upregulated DEGs in V0 compared with V8, V14, V15, and V22. (C) Venn diagram of the number of downregulated DEGs in V0 compared with V8, V14, V15, and V22. (D) Venn diagram of the number of upregulated DEGs in CK compared with V14 and V15. (E) Venn diagram of the number of downregulated DEGs in CK compared with V14 and V15. V0, V8, V14, V15, and V22 represent the samples from the plants under 17 °C treatment for 0 days, 8 days, 14 days, 15 days, and 22 days, respectively; CK represents the samples from the plants under 25 °C treatment for 15 days.
Horticulturae 09 01353 g002
Figure 3. Coexpressed genes and their kinetic patterns in broccoli shoot tips at relatively low temperatures. (A) Two clusters of coexpressed genes and their dynamic patterns in broccoli shoot tips under different treatment durations at relatively low temperatures. (B) Two clusters of coexpressed genes and their dynamic patterns at the critical stage of broccoli FBD.
Horticulturae 09 01353 g003
Figure 4. GO enrichment analysis of DEGs with transcriptional changes in the two analysis groups. (A) GO significant enrichment analysis of DEGs in Cluster 1 in Analysis Group 1 (V0 compared with V8, V14, V15, and V22). (B) GO significant enrichment analysis of DEGs in Cluster 2 in Analysis Group 1 (V0 compared with V8, V14, V15, and V22). (C) GO significant enrichment analysis of DEGs in Cluster 1 in Analysis Group 2 (CK compared with V14 and V15). (D) GO significant enrichment analysis of DEGs in Cluster 2 in Analysis Group 2 (CK compared with V14 and V15).
Horticulturae 09 01353 g004
Figure 5. The KEGG enriched analysis of the DEGs in the comparison groups. (A) KEGG pathway enrichment analysis of DEGs in Cluster 1 in Analysis Group 1 (V0 compared with V8, V14, V15, and V22). (B) KEGG pathway enrichment analysis of DEGs in Cluster 2 in Analysis Group 1 (V0 compared with V8, V14, V15, and V22). (C) KEGG pathway enrichment analysis of DEGs in Cluster 1 in Analysis Group 2 (CK compared with V14 and V15). (D) KEGG pathway enrichment analysis of DEGs in Cluster 2 in Analysis Group 2 (CK compared with V14 and V15).
Horticulturae 09 01353 g005
Figure 6. Heatmaps of phytohormone signaling genes in CK compared with V14 and V15. Red rectangles represent the upregulated genes, and blue rectangles represent the downregulated genes. All information for each gene list can be found in Table S6. CK represents the samples from the plants under 25 °C treatment for 15 d. V14 and V15 represent the samples from the plants under 17 °C treatment for 14 d and 15 d, respectively. The numbers on the color key strip represent Log2ration.
Horticulturae 09 01353 g006
Figure 7. Heatmaps of DETFs in CK compared with V14 and V15. Red rectangles represent the upregulated genes, and blue rectangles represent the downregulated genes. All information for each gene list can be found in Table S7. CK represents the samples from the plants under 25 °C treatment for 15 d. V14 and V15 represent the samples from the plants under 17 °C treatment for 14 d and 15 d, respectively. The numbers on the color key strip represent Log2ration.
Horticulturae 09 01353 g007
Figure 8. Heatmaps of genes related to flower formation in CK compared with V14 and V15. Red rectangles represent the upregulated genes, and blue rectangles represent the downregulated genes. All information for each gene list can be found in Table S8. CK represents the samples from the plants under 25 °C treatment for 15 d. V14 and V15 represent the samples from the plants under 17 °C treatment for 14 d and 15 d, respectively. The numbers on the color key strip represent Log2ration.
Horticulturae 09 01353 g008
Figure 9. Ranking and classification of the overrepresented motifs for DETF genes (Figure 6, Figure 7 and Figure 8) in the promoters of DEGs from CK compared with V14 and V15. Row names indicated the ranks of motifs, the significance of their enrichment computed by ESDEG [(log10(Padj))], the respective TF class from JASPAR, the names of TFs, and the JASPAR ID. The matrix heatmap indicates pairwise similarities of motifs as estimated by the permutation test using the ESDEG tools [https://github.com/ubercomrade/esdeg (accessed on 16 November 2023)]. Empty cells imply significantly distinct motifs (p-value > 0.05), the shades from light orange to dark orange denote significantly similar motifs (p-value < 0.05), and the numbers indicate the logarithm of pairwise significance: log10(p-value).
Horticulturae 09 01353 g009
Figure 10. qRT-PCR verification of RNA-seq results based on gene expression level. FPKM: fragments per kilobase of transcript per million fragments mapped. Each bar represents the average plus the standard deviation of three biological replicates.
Horticulturae 09 01353 g010
Disclaimer/Publisher’s Note: The statements, opinions and data contained in all publications are solely those of the individual author(s) and contributor(s) and not of MDPI and/or the editor(s). MDPI and/or the editor(s) disclaim responsibility for any injury to people or property resulting from any ideas, methods, instructions or products referred to in the content.