Article

How Does the Agro-Ecological Conditions Grown Kiwifruit (Actinidia deliciosa) Affect the Fruit Quality Traits and Bioactive Compounds during Shelf Life?

1
Bulancak District Directorate of Agriculture and Forestry, Giresun 28300, Türkiye
2
Department of Horticulture, Faculty of Agriculture, Ordu University, Ordu 52200, Türkiye
3
Department of Plant and Animal Production, Çilimli Vocational School, Düzce University, Düzce 81750, Türkiye
*
Authors to whom correspondence should be addressed.
Horticulturae 2023, 9(11), 1182; https://doi.org/10.3390/horticulturae9111182
Submission received: 18 October 2023 / Accepted: 24 October 2023 / Published: 29 October 2023
(This article belongs to the Section Postharvest Biology, Quality, Safety, and Technology)

Abstract

:
The kiwifruit (Actinidia deliciosa cv. ‘Hayward’), which shows climacteric characteristics, continues to ripen after harvest. In this process, quality losses occur in fruits, and this causes economic losses. The post-harvest storage conditions are essential in preventing these losses. The main purpose of this study was to assess the effect of agro-ecological conditions on quality traits and bioactive compounds of the kiwifruit throughout the shelf life. In this study, kiwifruit grown in 5 different locations (Ordu, Giresun, Rize, Samsun, and Yalova) constituted the plant material of the study. The fruits treated with modified atmosphere packaging (MAP) were stored at 0 ± 0.5 °C and 90 ± 5% relative humidity (RH) for 150 days in cold storage. For shelf life measurements, fruits were kept at 20 ± 1 °C and 65 ± 5% RH for 5 d. Quality analysis was performed at monthly intervals (at harvest, 30th, 60th, 90th, 120th, and 150th d). In this study, the lowest respiration rate at the end of the shelf life was measured in kiwifruit grown in Yalova. Flesh firmness was higher in kiwifruit grown in Rize, Ordu, and Giresun than Samsun. In all periods, Yalova’s L* value in flesh was higher than that of Ordu. The opposite situation was observed for the hue angle. The soluble solids content (SSC) values measured in Samsun and Yalova were higher than in Ordu and Rize. In the last four measurements, higher vitamin C was detected in Yalova than in Ordu, Rize and Giresun. In all periods, the highest total phenolics and antioxidant activity (in DPPH assay) were obtained in kiwifruit grown in Yalova. On the contrary, the highest flavonoids were measured in kiwifruit grown in Ordu. As a result, it was revealed that agro-ecological conditions may affect the quality traits and bioactive compounds of kiwifruit.

1. Introduction

There are about 50 species of kiwifruit that are botanically included in the Actinidia genus of the Actinidiaceae family [1]. Species such as Actinidia deliciosa, Actinidia chinensis, and Actinidia arguta in the genus Actinidia have economic importance [2]. Among the kiwifruit varieties, ‘Hayward’ is a commercial variety that is widely produced in Türkiye as well as all over the world, with both eating quality and good storage life [3]. Kiwifruit, which started to be cultivated in Türkiye in 1990, is mainly grown in the country’s Black Sea and Marmara regions [4].
Kiwifruit, a type of fruit generally consumed fresh, is becoming increasingly available in various consumption forms, such as industrially dried, frozen, nectar, marmalade, canned, and fruit juice, with the rise in production amounts [5]. Its properties, such as protein, lipids, carbohydrates, vitamins (vitamins A, C, E, and folic acid), minerals, polyphenols, antioxidants, and dietary fiber, increase its nutritional value [6].
The increase in kiwifruit production causes excessive product accumulation in the market, resulting in significant product losses after harvest. To prevent these losses and to extend the marketing period, the fruit must be preserved under suitable conditions. The factors affecting the storage life of kiwifruit are affected by the applications made during the pre-harvest period, harvest, and post-harvest period. The maturity status of the fruit, careful harvesting without damaging the fruits in accordance with the technique, the storage of the fruits in cold storage after pre-cooling, the ethylene production of fruits, together with the temperature and relative humidity of storage conditions also affect the storage life and quality preservation of kiwifruit [7]. As a climacteric fruit, the ripening of kiwifruit is influenced by ethylene production [8]. Fruit softening is described as one of the most critical parameters limiting the post-harvest life of kiwifruit, and it is stated that softening is closely related to the presence of ethylene [9]. Kiwifruit are harvested when they are physiologically mature, but they are still in an immature state because there is not enough endogenous ethylene to cause ripening [8,10]. Kiwifruit harvested at commercial maturity are stored at low temperatures for longer shelf life and marketing [10].
The Actinidia species manifest diverse phenological and physiological traits, including flowering time and fruit maturity timing. Such disparities manifest in disparate seasons, altitudes, or geographical locations [11]. The main problems that have arisen in Europe so far have been related to damage caused by adverse weather or soil conditions [12]. Kiwifruit performs poorly in heavy soils with high clay content or compacted soils where drainage is hindered [13]. These soil structures can create a suitable environment for fungal disease agents such as Botrytis and Phytophthora if orchard management is not carried out correctly. Indeed, Botrytis develops when the fruits are stored, but this disease agent infects in the field [12]. Also, very light or sandy soils that dry out quickly are not suitable for kiwifruit cultivation [13]. The climate, soil, and topography have a significant impact on kiwifruit growth, and the best quality and highest yield are typically attained when the planting area has the right ecological conditions [14]. It has been reported that climatic conditions such as light and temperature may be effective on physiological characteristics such as growth, development, flowering, fertilization, fruit development, and resistance to storage conditions [15]. Zenginbal and Ozcan [16] reported that kiwifruit can be grown economically between 20–600 m altitude, but increasing altitude negatively affects fruit quality, and vines can be affected by cold damage.
Therefore, the basic study question is: Is there an effect of agro-ecological conditions on the change of quality characteristics and bioactive compounds of kiwifruit in the shelf life period? This study hypothesized that different agro-ecologic conditions would affect the fruit quality characteristics and changes in bioactive compounds of the ‘Hayward’ kiwifruit cultivar kept in the shelf life period. The study’s basic aim was to evaluate the effect of agro-ecologic conditions on quality traits and bioactive compounds during shelf life.

2. Materials and Methods

2.1. Plant Materials

The plant material of this research consisted of the fruit of the kiwifruit (Actinidia deliciosa cv. ‘Hayward’) grown in the Ordu, Rize, Giresun, Samsun, and Yalova provinces of Türkiye (Figure 1). The research was planned with three replications according to the completely randomized block design, with each orchard selected in each province representing one replication. Care was taken to ensure that the orchards within each cultivation region had similar characteristics among themselves. Furthermore, orchards were selected in the 0–100 m altitude range, and attention was given to ensure that the sampled trees were of similar age and had a uniform product load. For each rep, 6–7 kg fruit samples with 6.5% SSC were harvested on 6–12 November. It was ensured that the fruits harvested by hand were of uniform size (90–120 g) and free of visual defects. The harvested fruits were placed in single rows in plastic boxes after separating those with physical damage or those infected with a disease. Then, kiwifruits were immediately transferred to Ordu University Faculty of Agriculture, Horticulture Department laboratory.

2.2. Experimental Design

To start with, harvest period analyses were carried out promptly. The fruits from each cultivation area were divided and placed in plastic boxes for analysis for monthly analysis (30th, 60th, 90th, 120th, and 150th days). Fruits were treated with modified atmosphere packages (MAP) (Xtend, Stepac, Israel) before being placed in the plastic boxes. Then, the fruits were pre-cooled for 24 h in a cold room with 4 ± 0.5 °C and 90 ± 5% RH, and then the MAPs were closed with plastic clips. After pre-cooling, all fruits were transferred to the cold room to be stored at 0 ± 0.5 °C and 90 ± 5% RH. Shelf life measurements were carried out after the fruits were taken out of cold storage and kept at 20 ± 1 °C and 65 ± 5% RH for five days during each analysis period. In each period, measurements were made in 3 replicates, each consisting of 15 fruits.

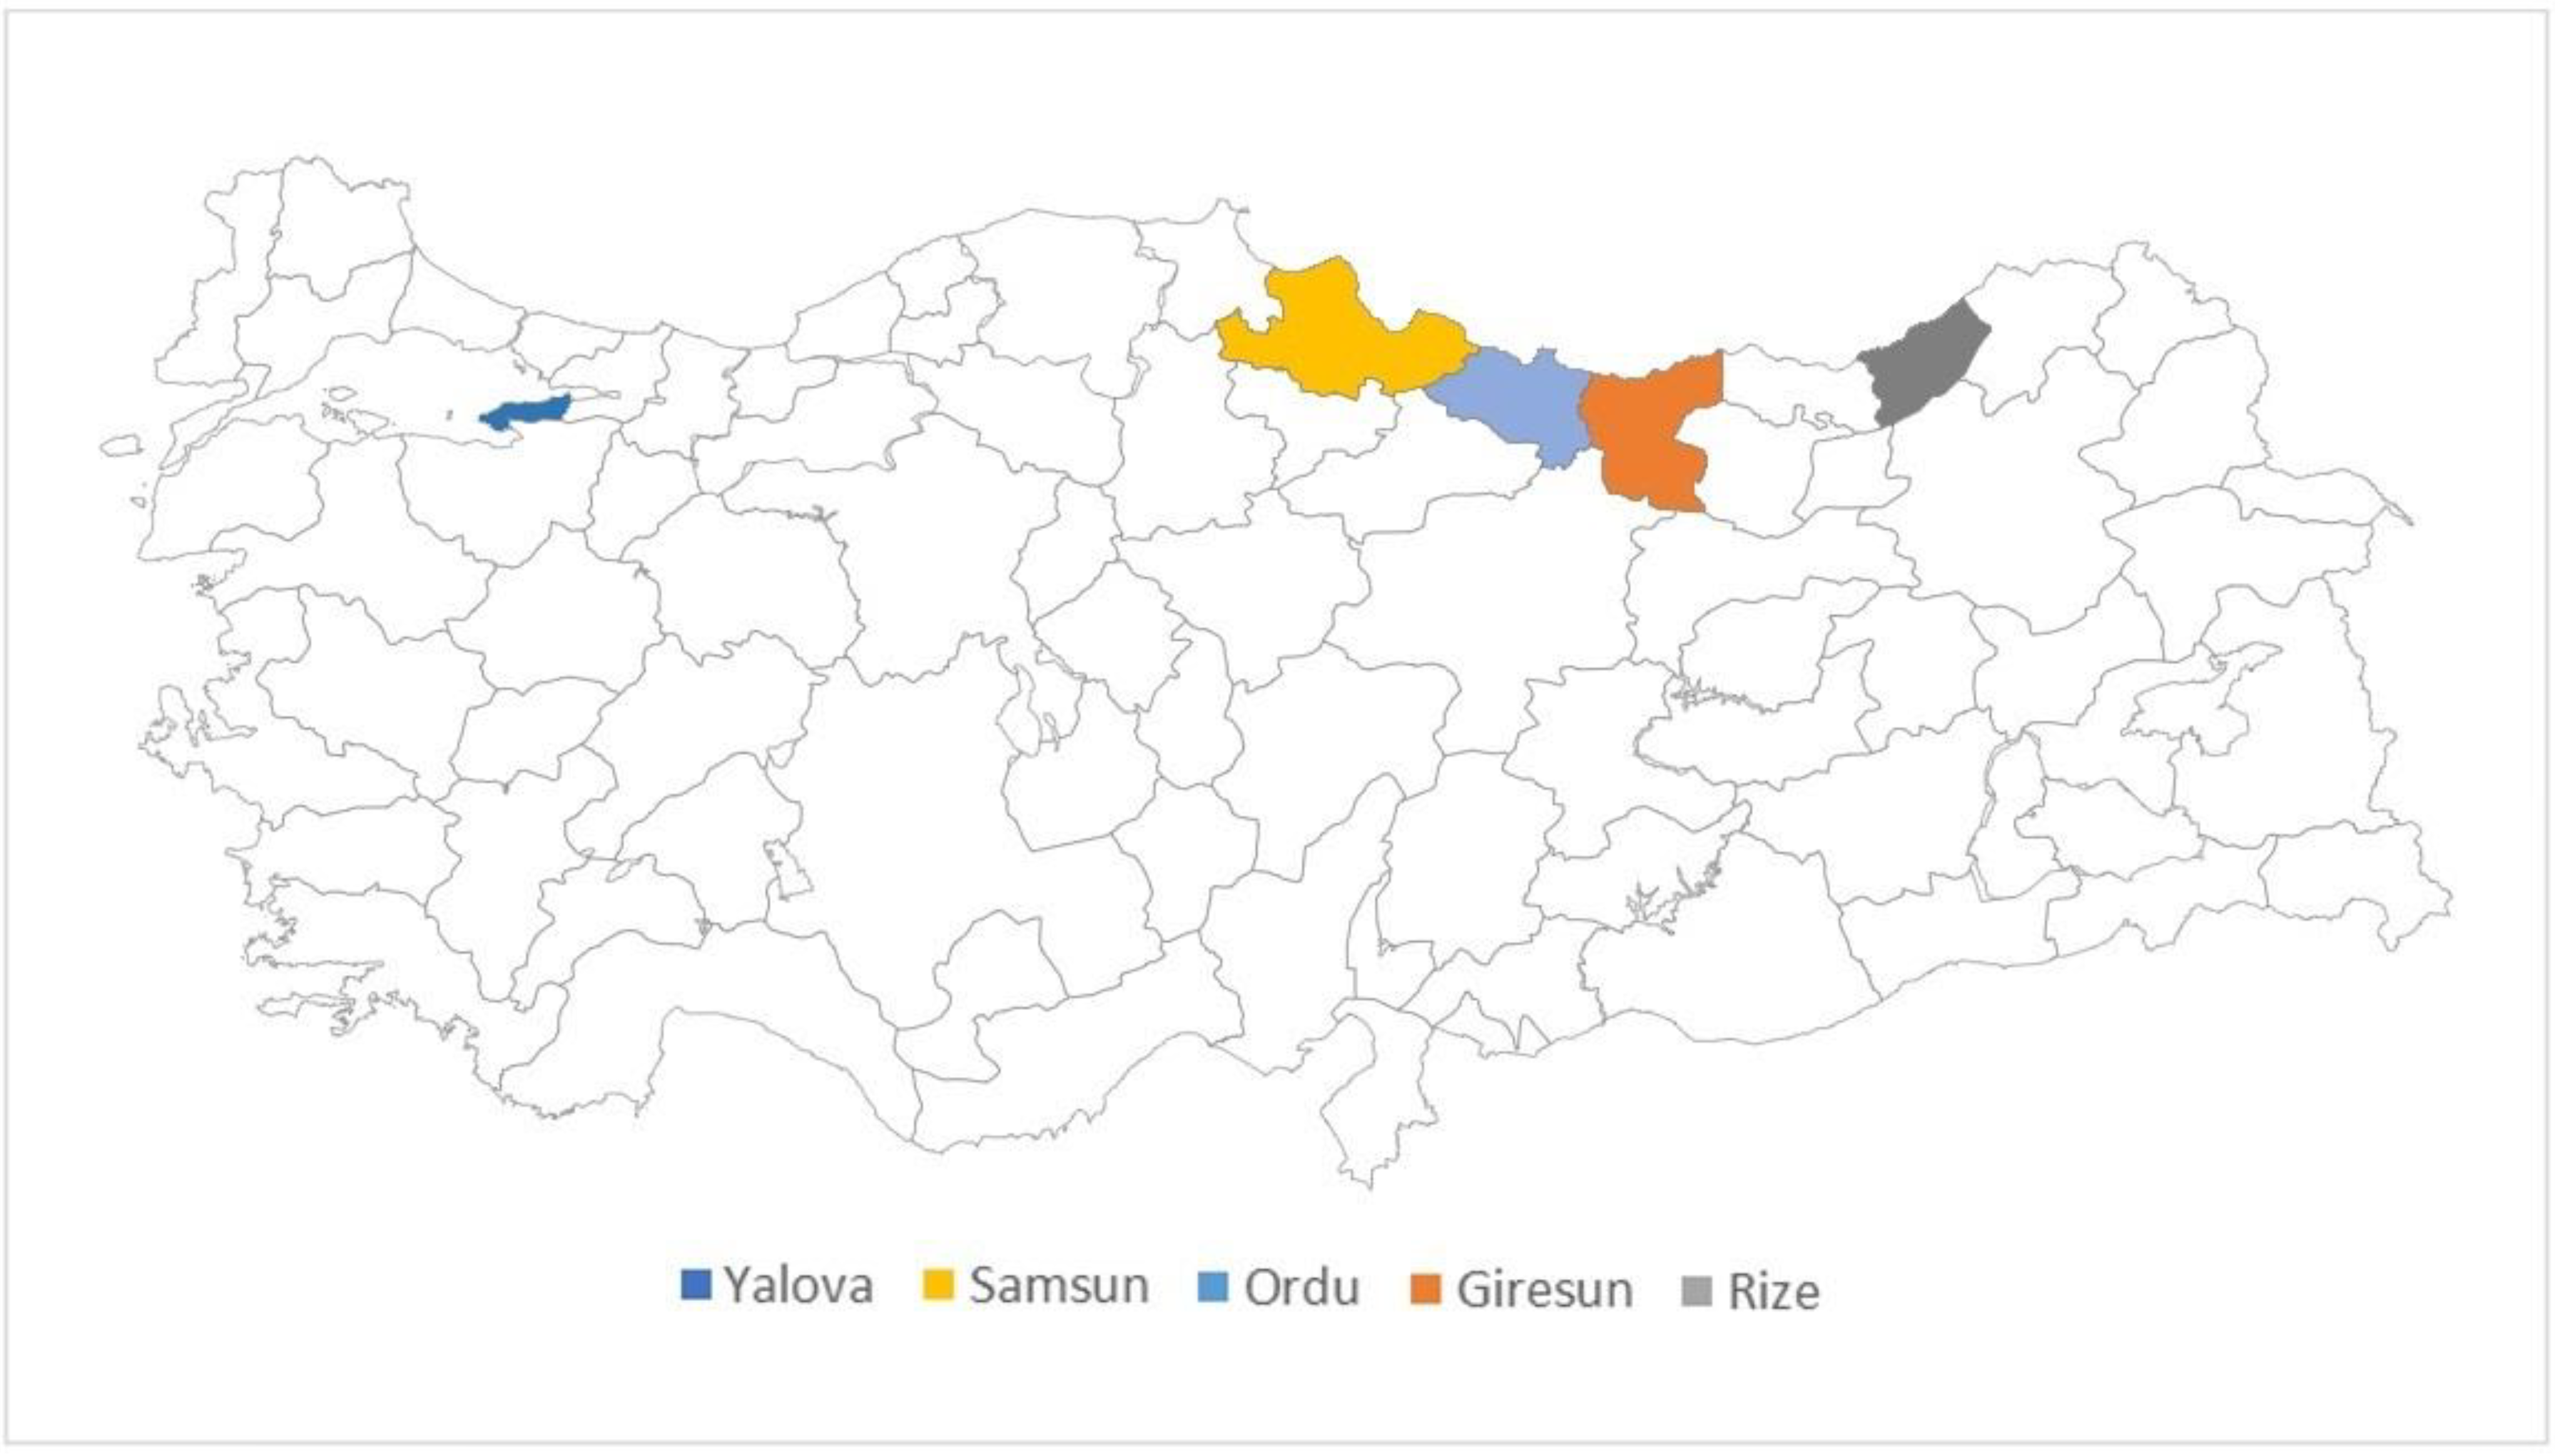
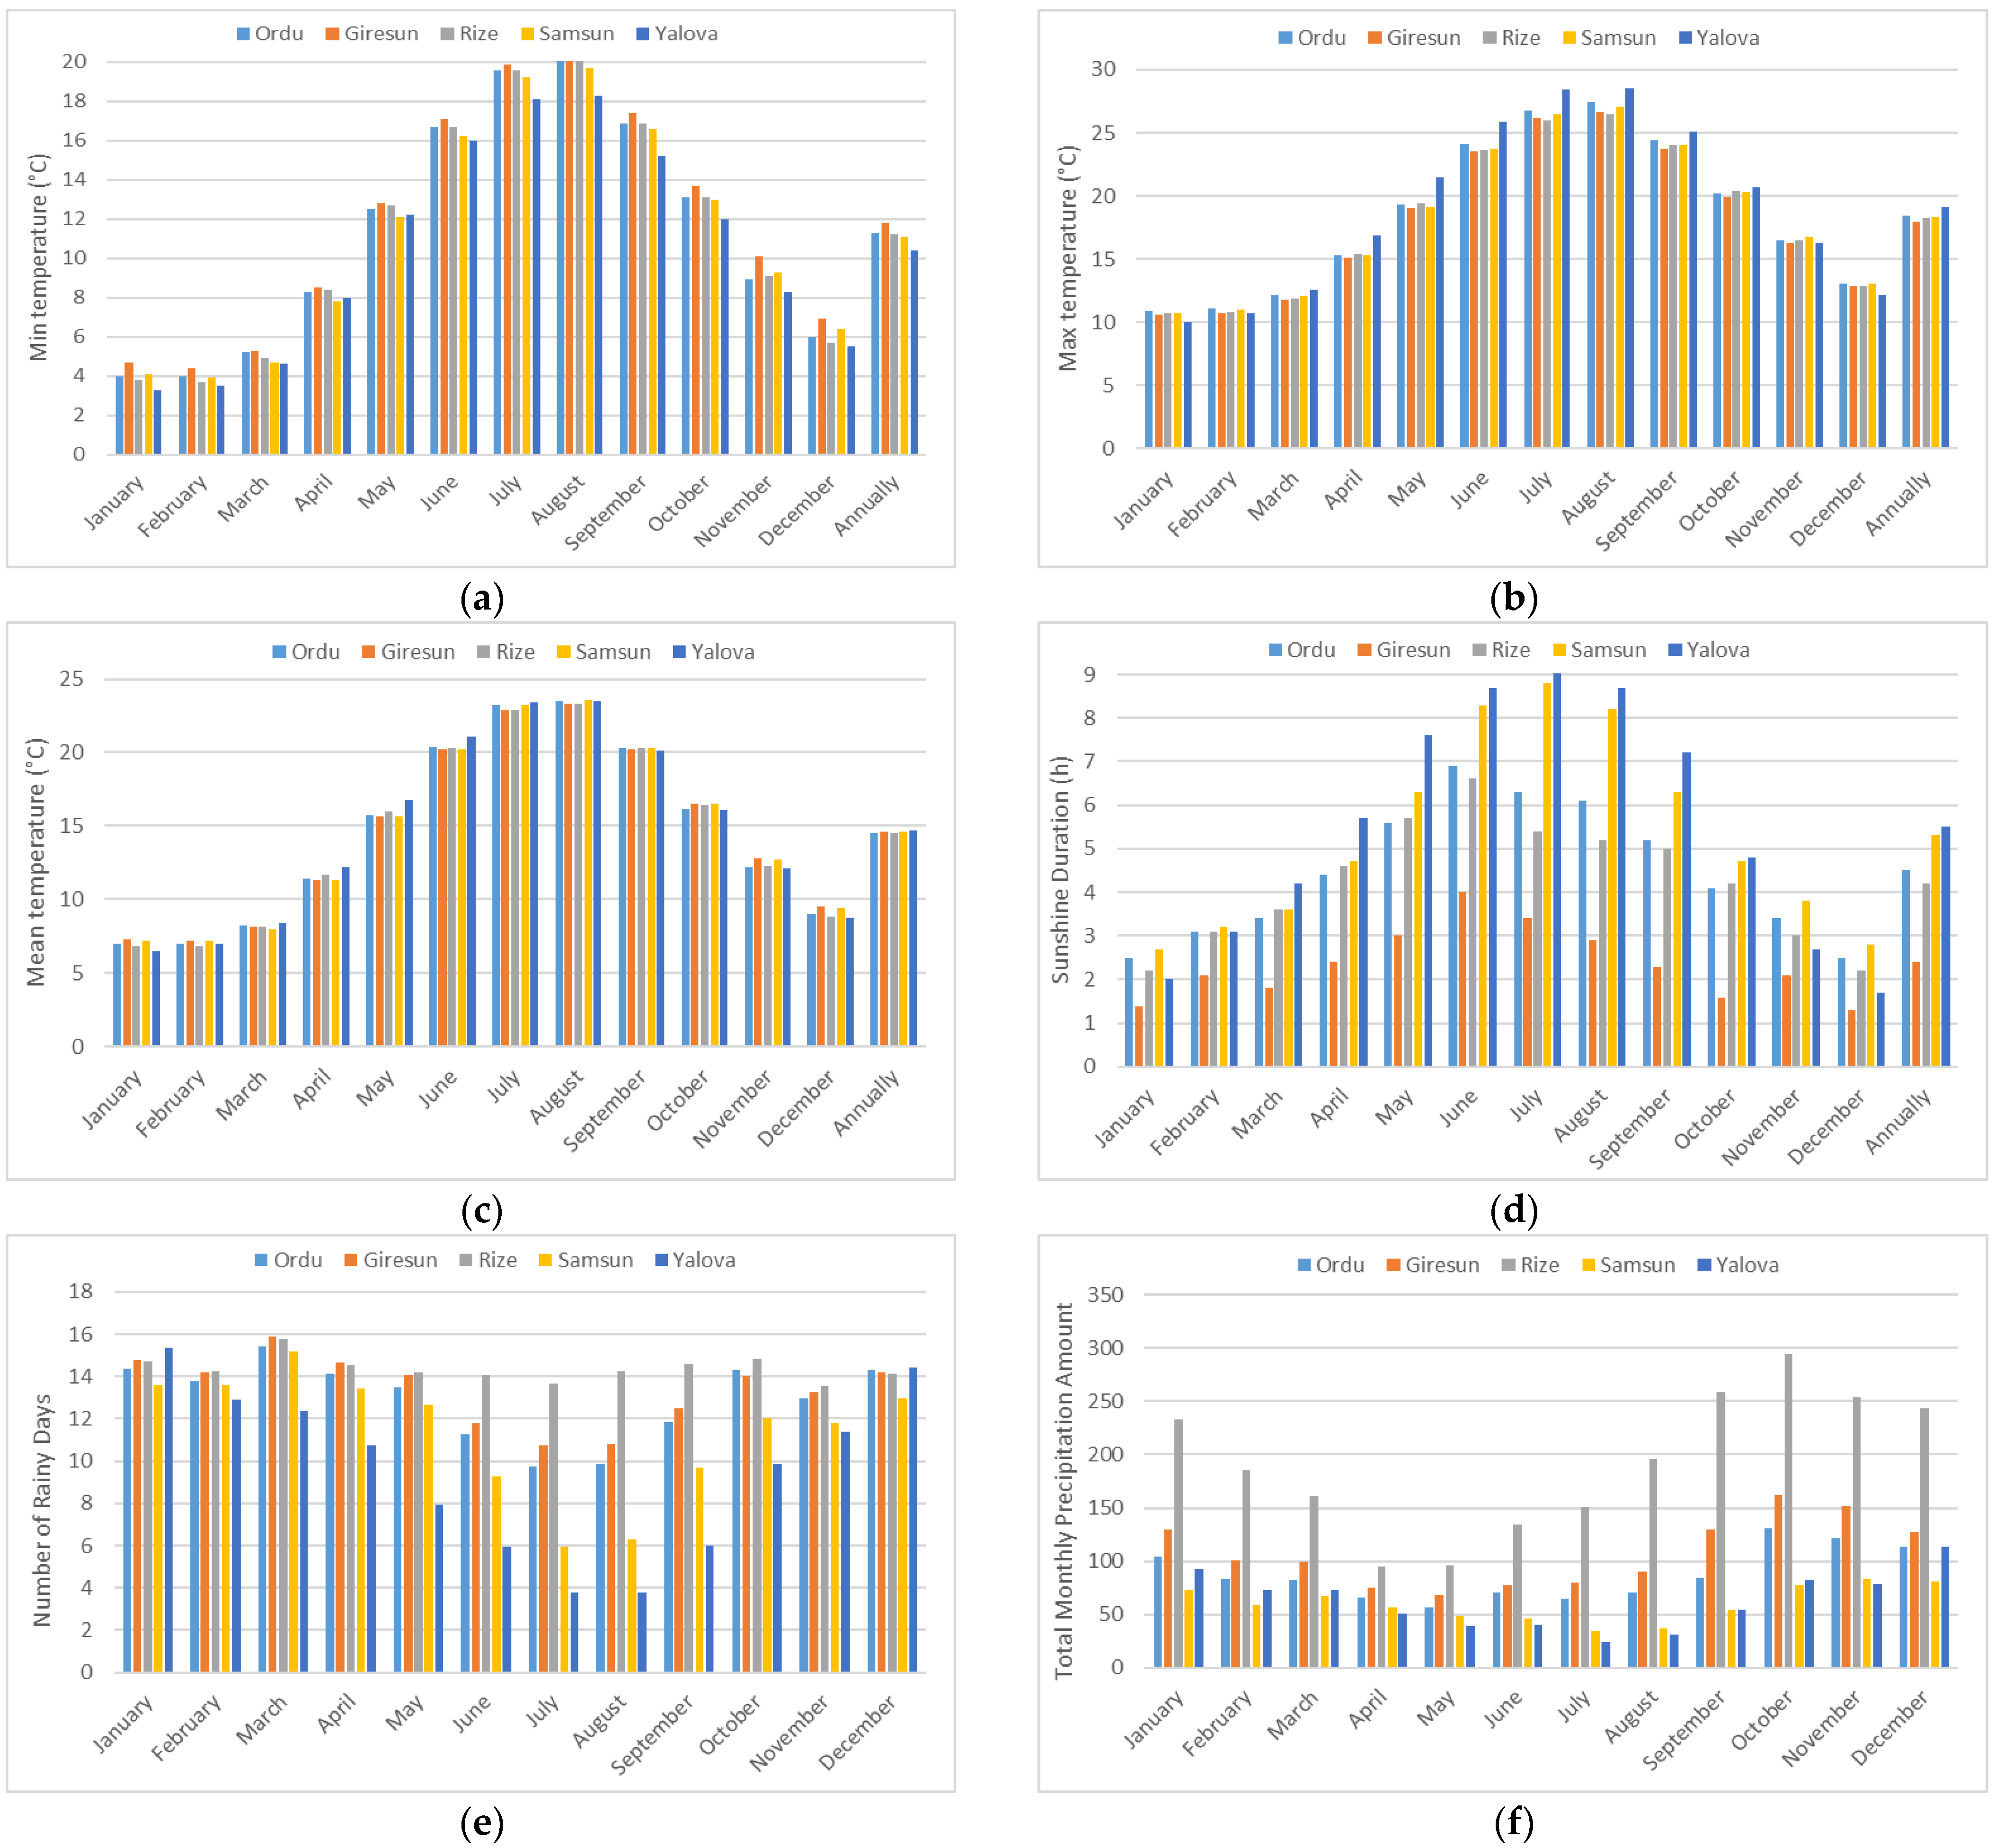
2.3. Climate and Soil Characteristics of the Study Areas

2.3.1. Climate Characteristics

The long-term minimum temperature, maximum temperature, mean temperature, sunshine duration, number of rainy days, and total monthly precipitation for the provinces of Ordu, Giresun, Rize, Samsun, and Yalova are presented in Figure 2. Among the provinces, the mean temperature was lowest in Ordu and Rize (14.5 °C) and highest in Yalova (14.70 °C); the min temperature was lowest in Yalova (10.40 °C) and highest in Giresun (11.80 °C); and the max temperature was lowest in Giresun (18.00 °C) and highest in Yalova (19.10 °C). In the research sites, the highest total monthly precipitation was recorded in Rize (2302.0 mm) province, followed by the Giresun (1290.5 mm), Ordu (1049.1 mm), Yalova (754.6 mm), and Samsun (719.5 mm) provinces [17].

2.3.2. Soil Characteristics

The soil texture, pH, salinity, organic matter, and chalk and potassium contents determined according to the soil analysis results of the orchards where the research was carried out are presented in Table 1. According to the texture analysis, the orchards in the Giresun province have a loamy soil type, whereas the orchards in other provinces have loamy and clay loamy soil types. The pH value of the soils varies between 5.01 and 7.83. The soils of the Rize province are slightly-medium acid, the Ordu province soils are slightly-medium acid and neutral, the Giresun province soils are neutral and slightly alkaline, and Samsun and Yalova soils are slightly alkaline. The salinity of the soils is generally low and the potassium content is sufficient (Table 1).

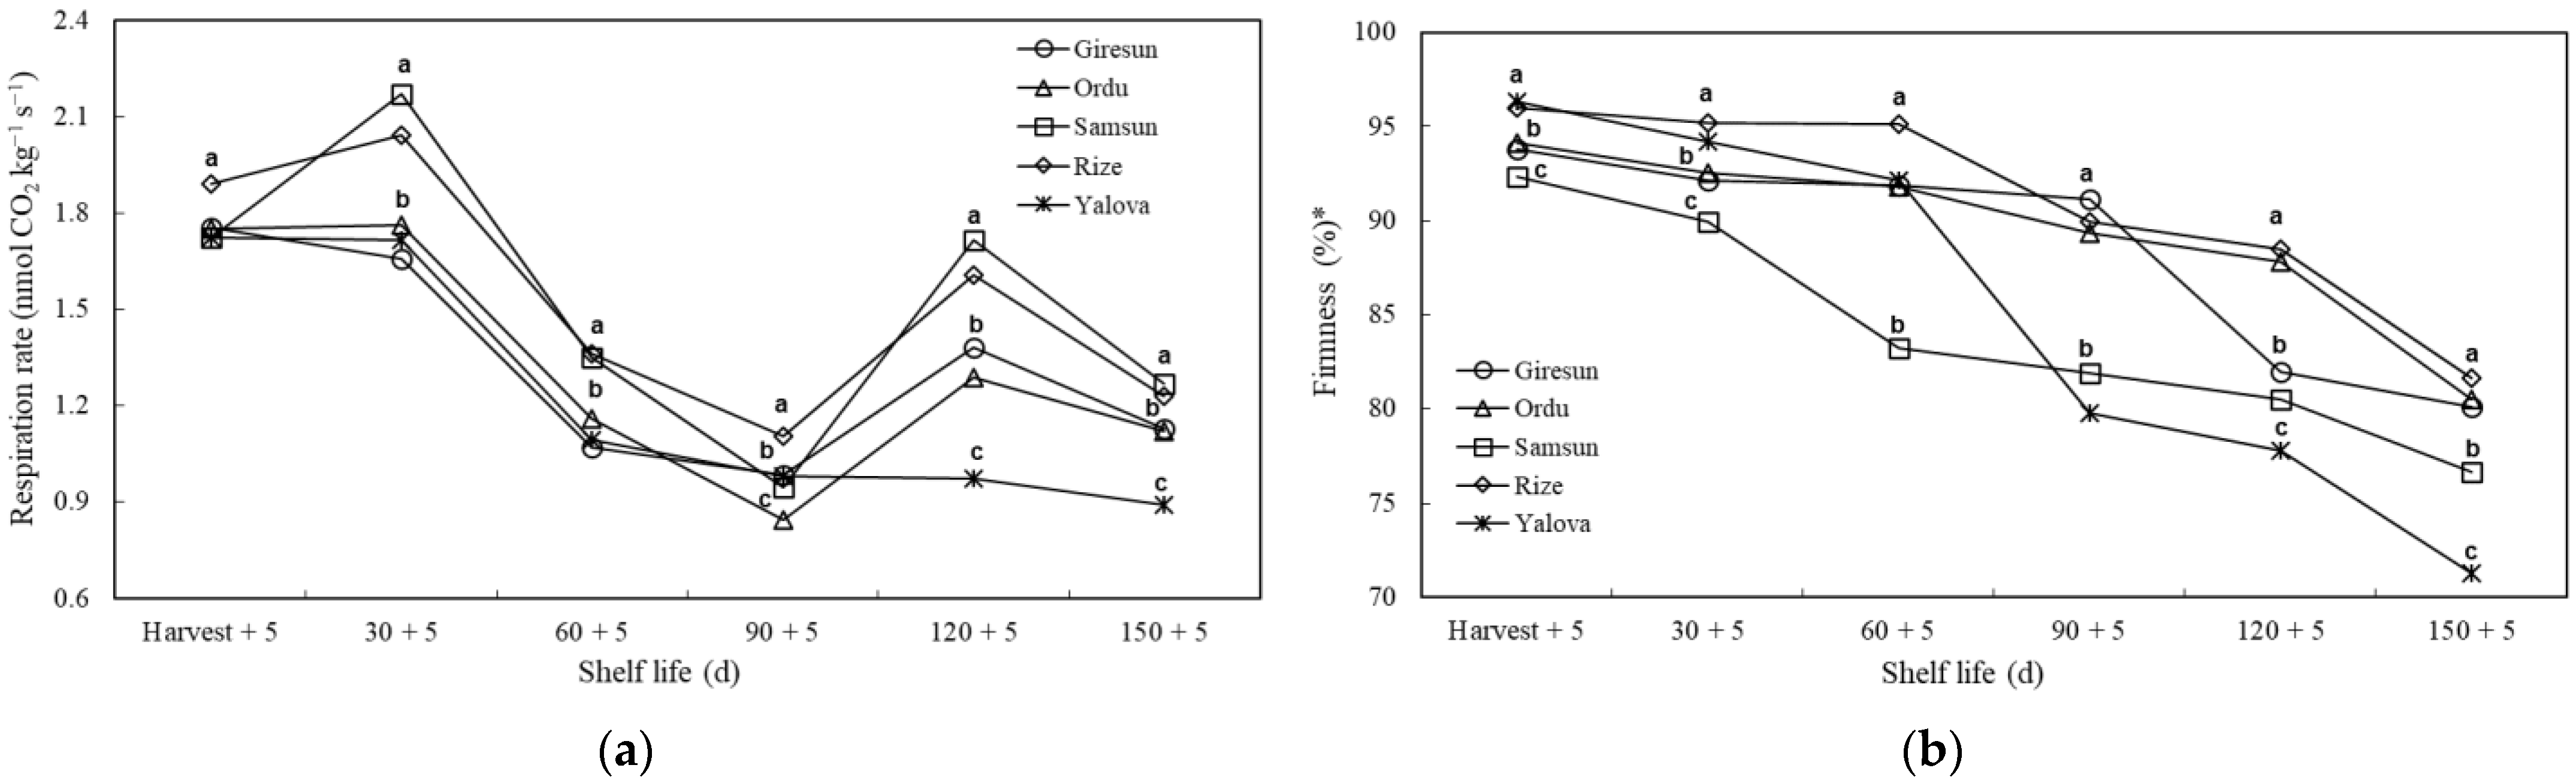
2.4. Respiration Rate and Firmness

The respiration rate was determined according to the method used by Öztürk and Yücedağ [18]. Five fruits in each rep were kept in a 2 L gas-tight glass container at 22 ± 1.0 °C and 90% RH for 1 h, and the amount of CO2 released to the outside during this process was measured with a digital carbon dioxide sensor (Vernier Software, Beaverton, OR, USA). The obtained values were calculated in nmol CO2 kg−1 h−1 based on the weight and volume of the fruit placed in the glass container.
Firmness measurements were performed with a digital firmness meter (Agrosta 100 field, Agrotechnologie, Paris, France) on ten fruits for each rep. Measurements were conducted in opposite equatorial fruit regions and recorded as a percentage. Values read on the digital firmness meter nearing 0 indicate softer fruit flesh, whereas values close to 100 indicate its firmness.

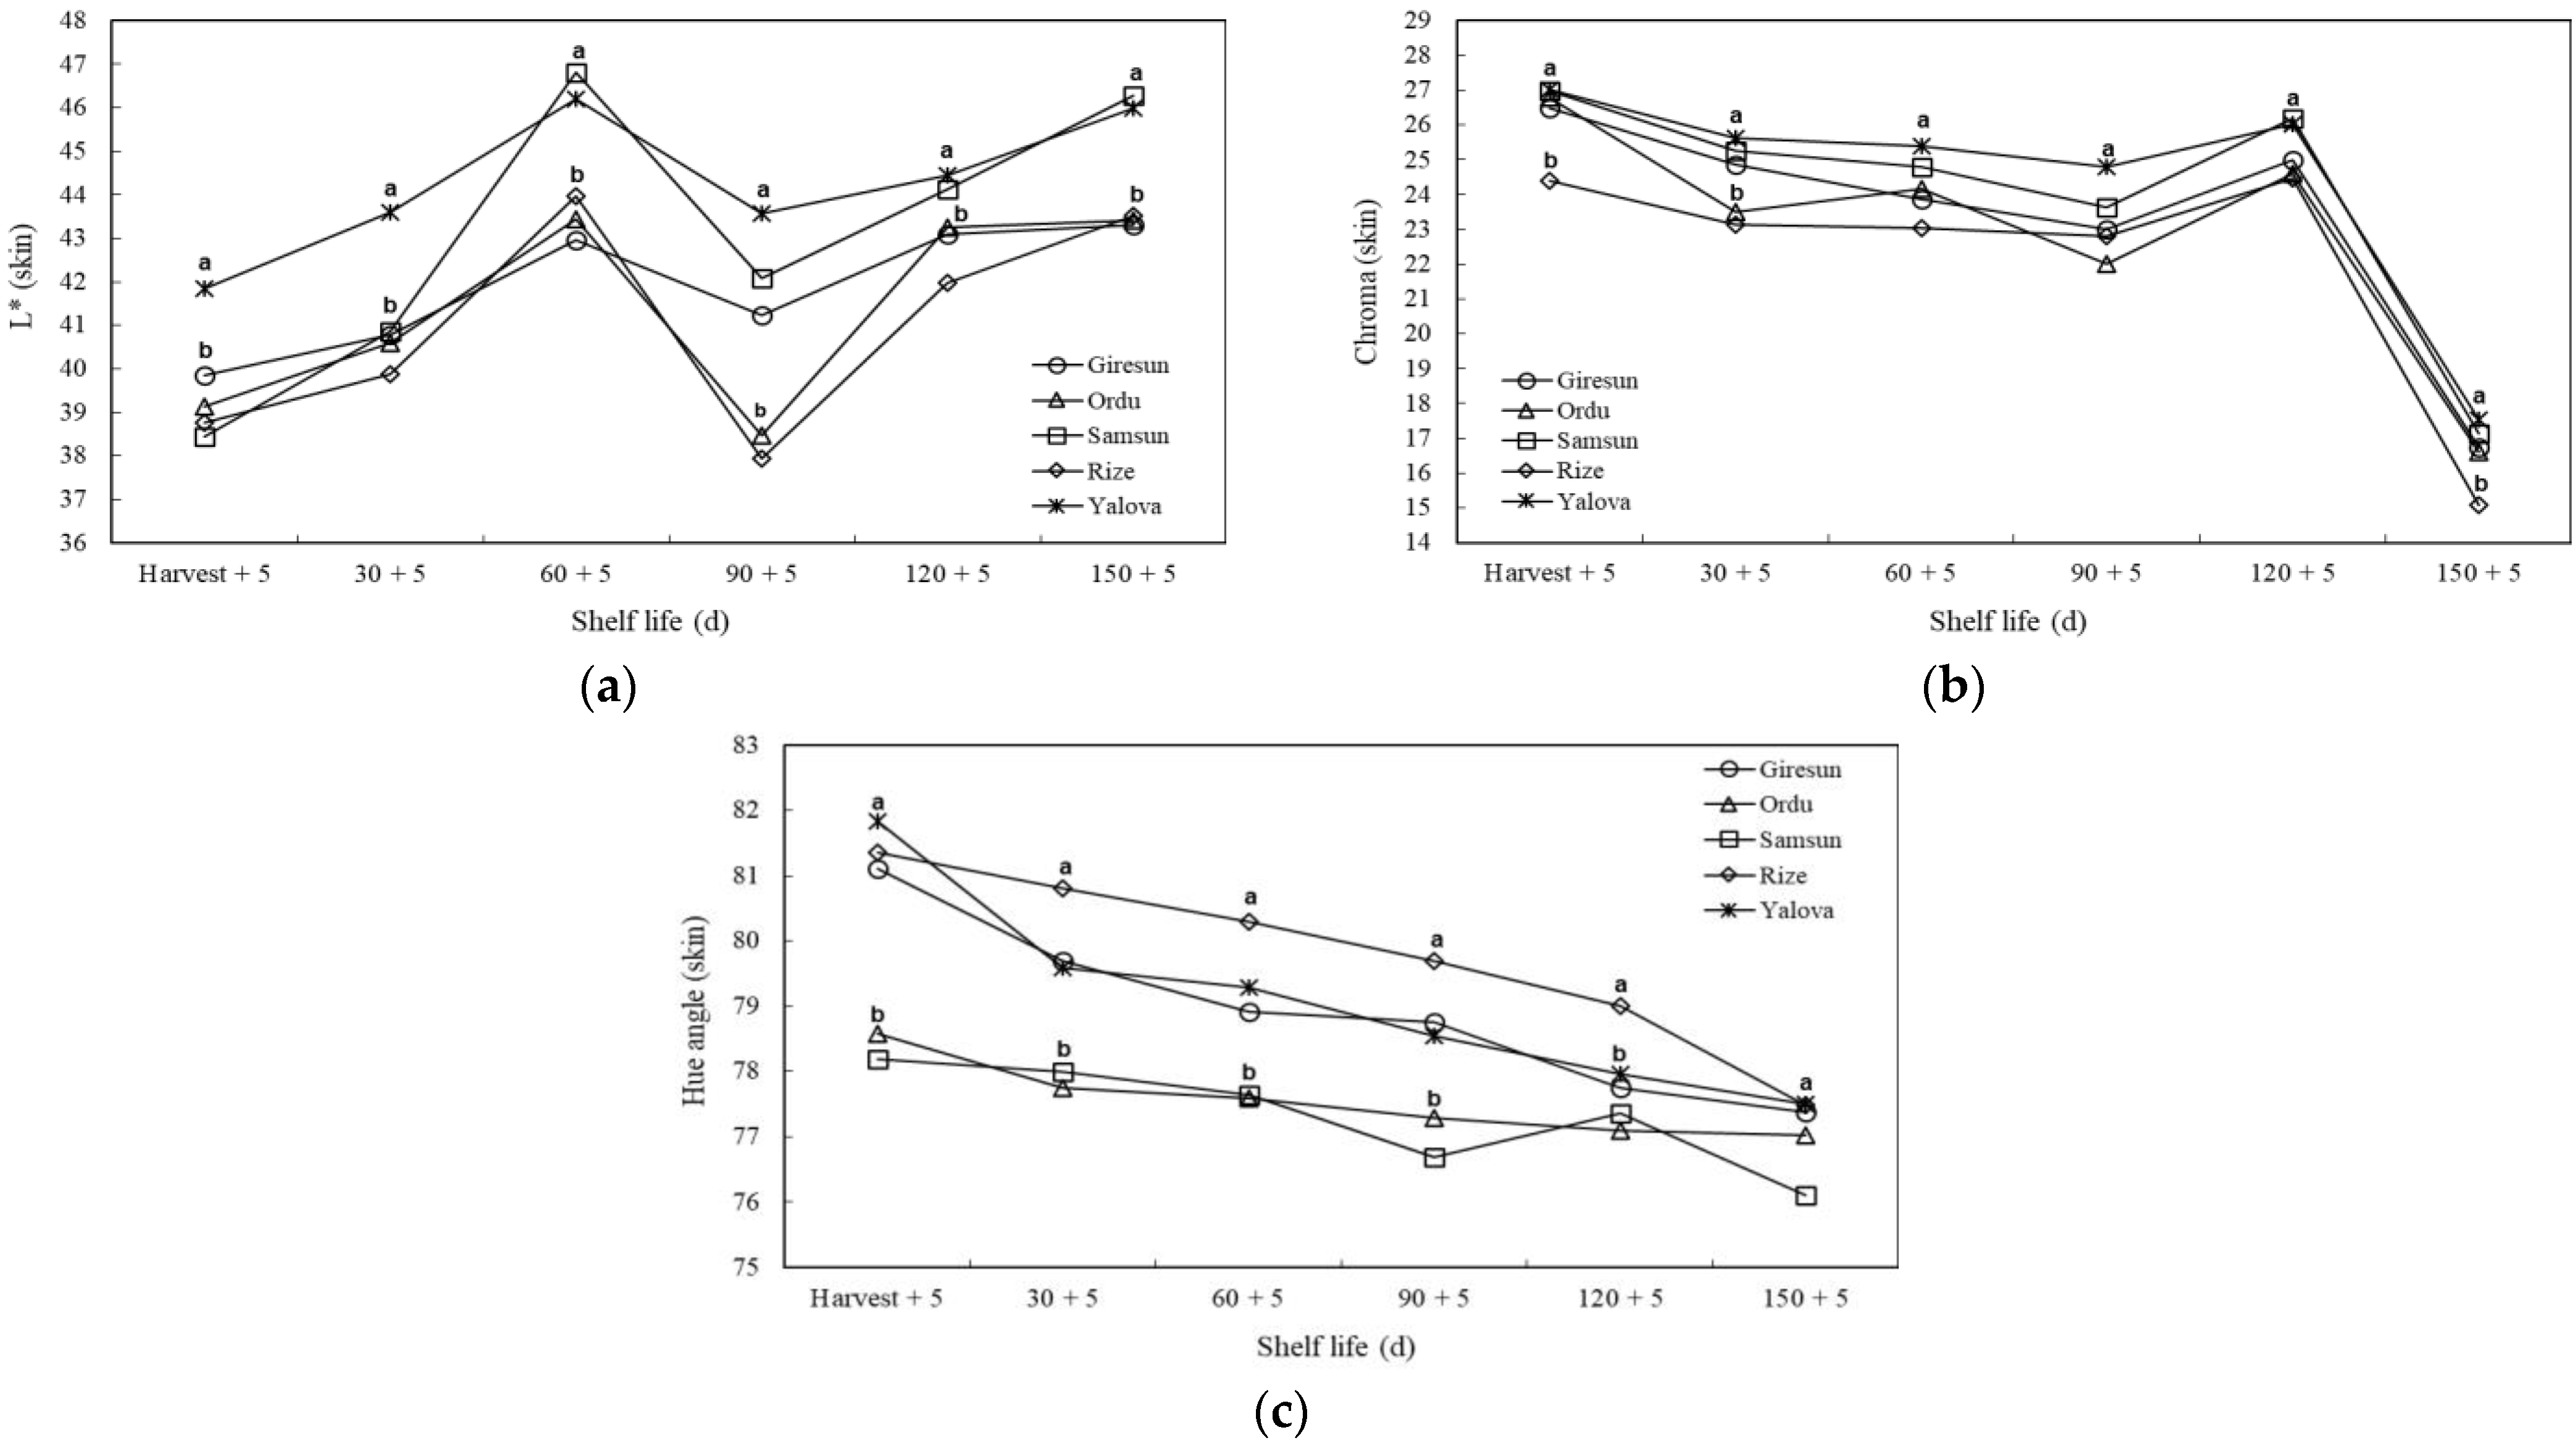
2.5. Skin and Flesh Color

At each analysis period, color measurements (on ten fruits) were determined in terms of CIE L*, a*, and b* using a colorimeter (model CR-400, Minolta, Tokyo, Japan). Chroma value = (a*2 + b*2)1/2, and the hue angle value was determined by the formula hº = tan−1 × b*/a* [19].

2.6. Vitamin C, SSC, and Acidity (TA)

SSC was determined in juice using a digital refractometer (PAL-1, McCormick Fruit Tech., Yakima, WA, USA) and expressed as %. Titratable acidity (TA) was expressed in citric acid (g citric acid kg−1) based on the amount of sodium hydroxide (NaOH) consumed in the titration and titrated with 0.1 mol L−1 (N) NaOH until the pH reached 8.1 after 10 mL of juice was diluted with 10 mL of distilled water. When determining vitamin C, 5 mL of fruit juice sample was determined after dilution with 50 mL of oxalic acid using the reflectometer (Merck RQflex plus 10, Darmstadt, Germany). Values read on the device were expressed as g kg−1 [20].

2.7. Total Phenolics (TP), Total Flavonoids (TF), and Antioxidant Activity

Total phenolics were determined using Folin–Ciocalteu’s reagent according to the method used by Beyhan et al. [21]. Accordingly, the prepared solution was measured at a wavelength of 760 nm in a spectrophotometer, and the results were calculated in gallic acid and expressed as g GAE kg−1 fresh weight (fw). Total flavonoids were determined according to the method of Zhishen et al. [22]. Accordingly, the prepared solution was measured at a wavelength of 510 nm in a spectrophotometer, and the results were calculated according to the quercetin equivalent (QE) and expressed as g QE kg−1 fw. In this study, Ferric Ions (Fe+3) Reducing Antioxidant Power Assay (FRAP) and 1.1-diphenyl-2-picryl-hydrazil (DPPH) assays were used to determine antioxidant activity. The FRAP method was carried out according to the method used by Benzie and Strain [23]. Accordingly, the prepared solution was measured at a wavelength of 593 nm in a spectrophotometer, and the values obtained were presented as mmol Trolox equivalent (TE) kg−1. The DPPH test was performed by modifying Blois [24]’s method. The prepared solution was measured at 517 nm in a spectrophotometer (Shimadzu UV 1280, Tokyo, Japan), and the results were calculated as nmol TE kg−1 fw.

2.8. Statistical Analysis

Kolmogorov–Smirnov test was used to determine whether the data were normally distributed. The group variances’ homogeneity control was verified using the Levene test. Tukey’s multiple-comparison test was used to determine whether there were significant differences (p ≤ 0.05) between the locations following the variance analysis of the data. The SAS software (SAS 9.1 version, Cary, NC, USA) was used for the statistical analyses.

3. Results

3.1. Respiration Rate and Firmness

Significant differences (p ≤ 0.05) in respiration rate and firmness were found between kiwifruit from different cultivation regions during the shelf life. There were increases and decreases in respiration rate during the measurements. At harvest, the respiration rate of kiwifruit from the Rize province was higher than in other areas. On the 30th, 60th, 120th, and 150th days, the respiration rate of kiwifruit from the Samsun and Rize provinces was at a similar level but significantly higher than in other provinces. On the 120th and 150th d, the lowest respiration rate was measured in Yalova (Figure 3).
Measurements during the shelf life showed that the firmness decreased, and the kiwifruit became softer as the process progressed. At harvest, the firmness of the kiwifruit grown in Rize and Yalova was higher than in the other provinces. It was observed that kiwifruit of the Yalova province softened rapidly from the 60th d and had the lowest fruit firmness on the 120th and 150th d compared to other areas. In general, it was observed that the kiwifruit from the Rize, Ordu, and Giresun provinces softened more slowly (Figure 3).

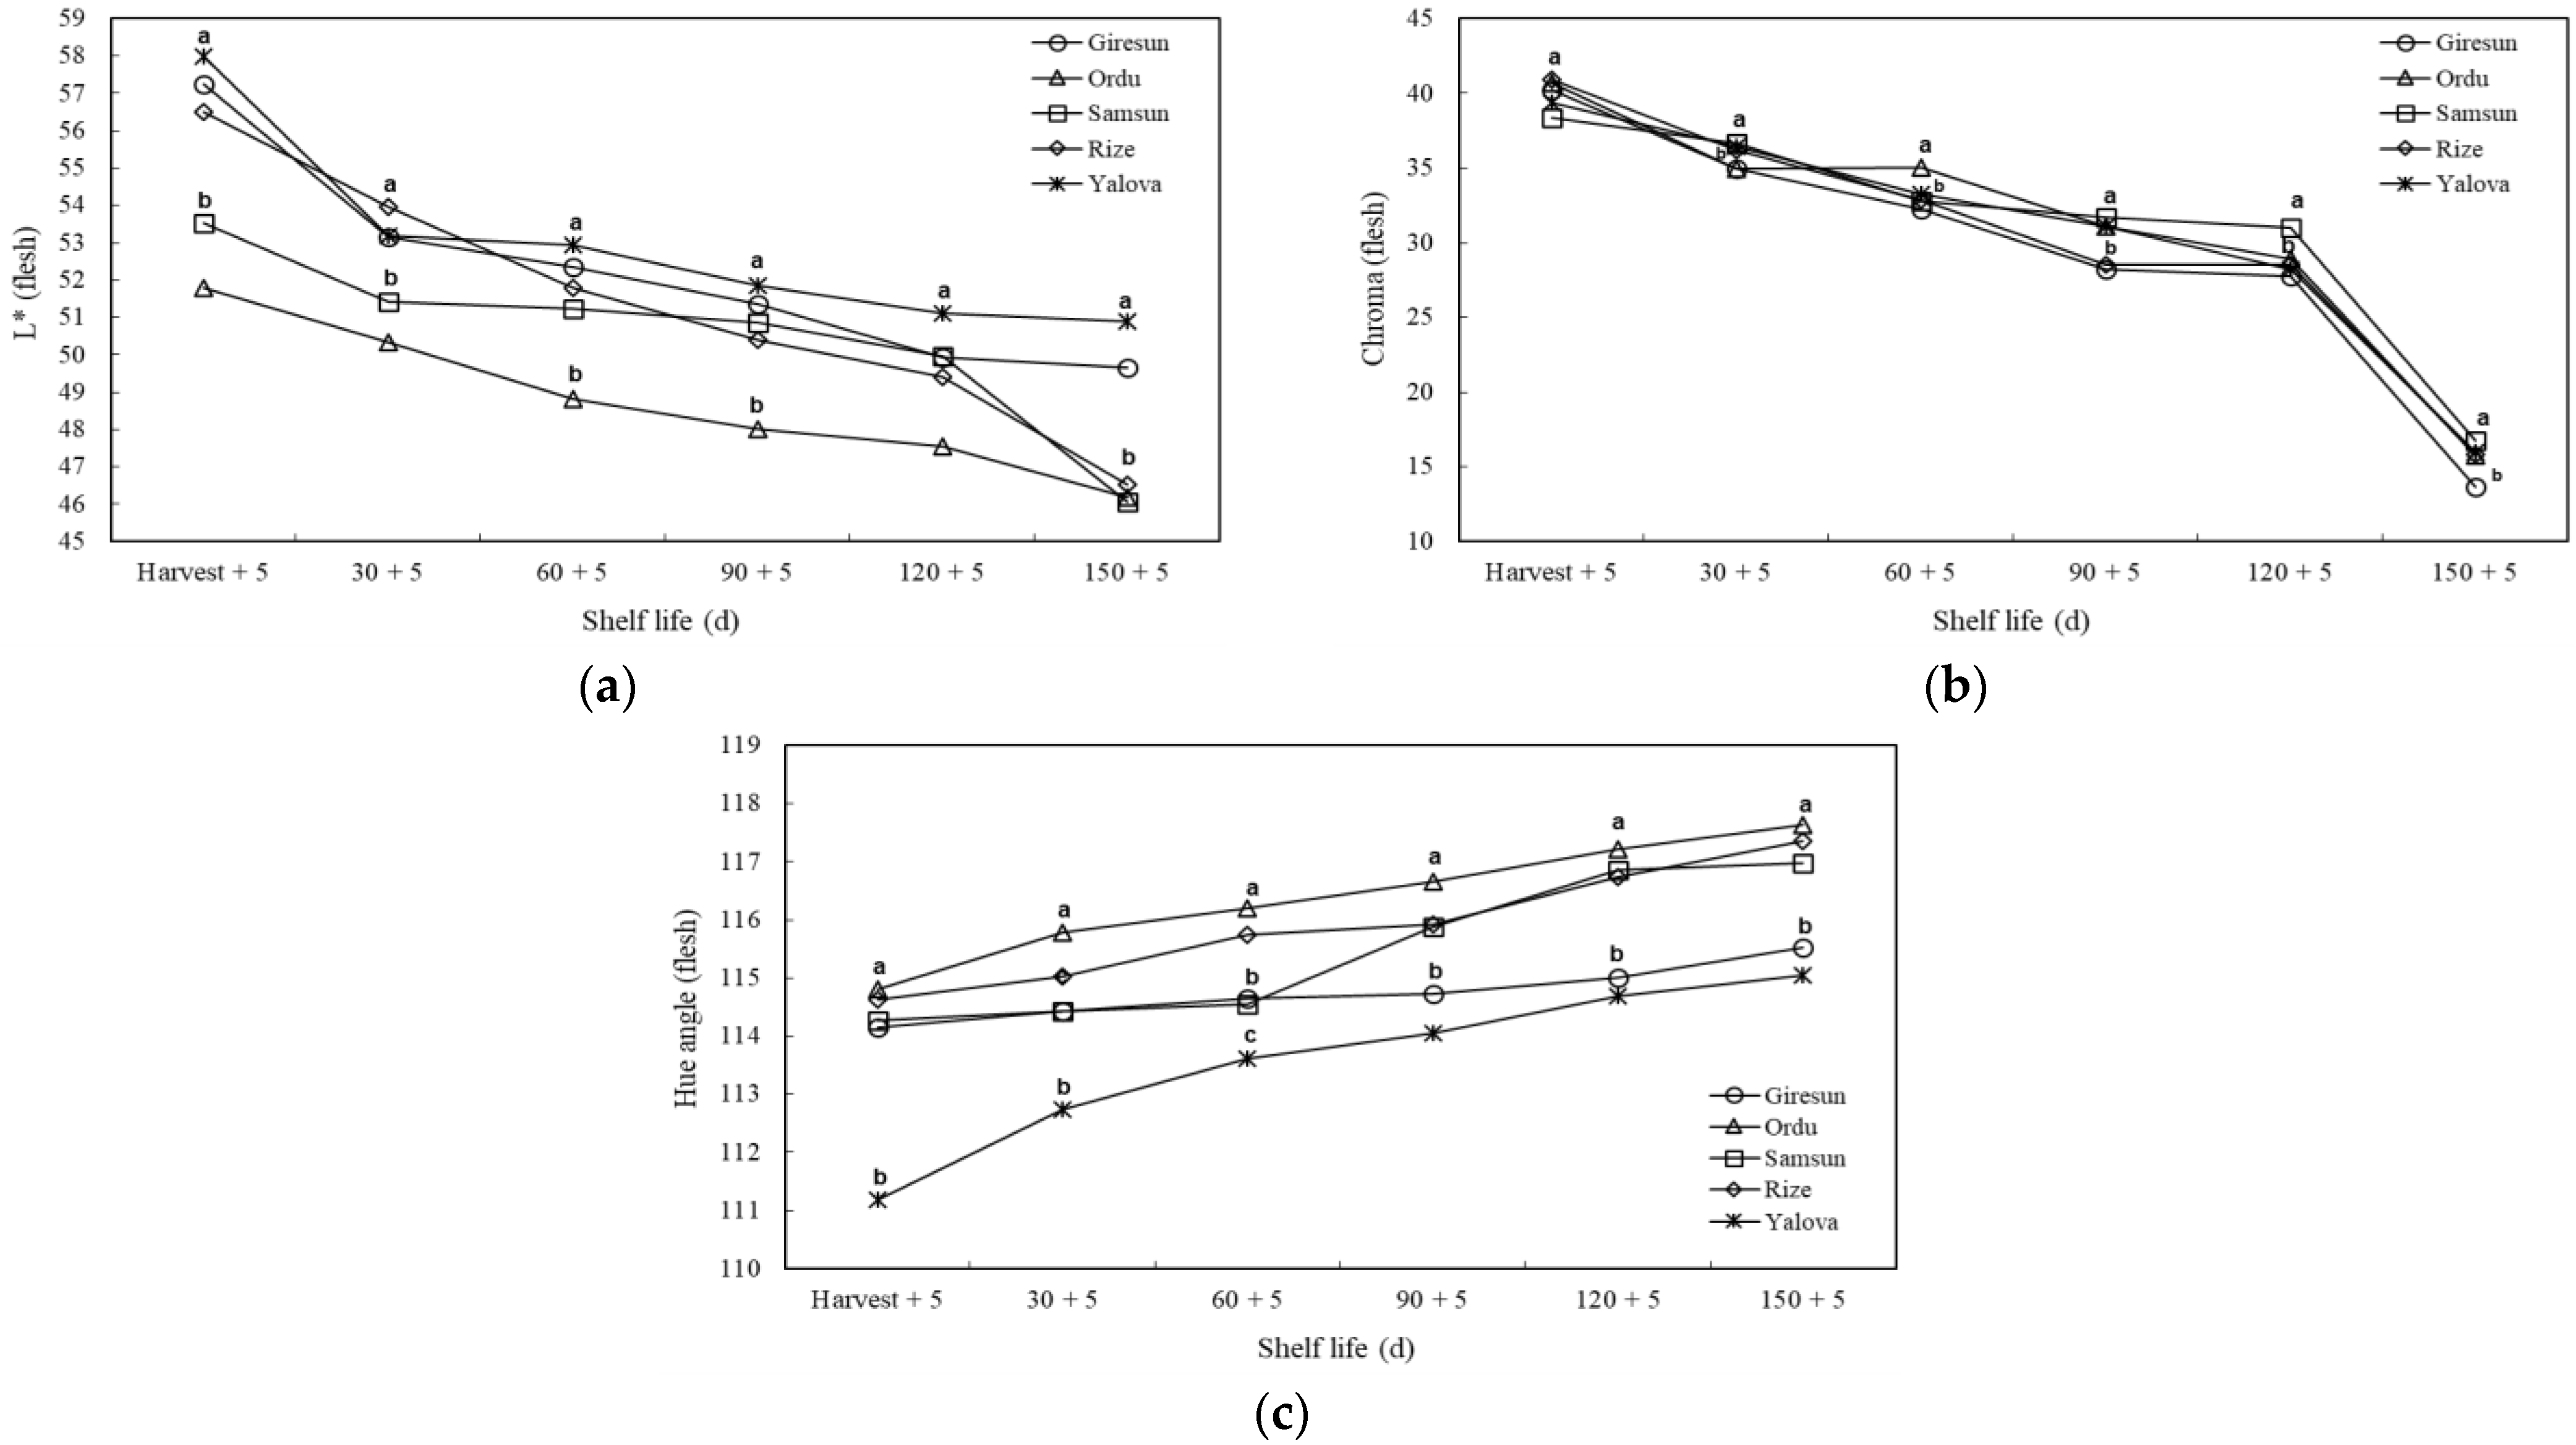
3.2. Skin and Flesh Color

During the shelf life, fruit skin color characteristics showed significant differences between cultivation regions (p ≤ 0.05). It was observed that the L* value (skin) of kiwifruit grown in Yalova was higher at harvest and on the 30th d than in the other areas. On the 120th and 150th d, the L* value of kiwifruit from the Yalova and Samsun provinces was higher than in the other cultivation areas. Chroma (C*) value (skin) decreased during the storage period. However, after the 120th d, this value decreased much faster in all cultivation areas. On the 150th d, the chroma value of the kiwifruit grown in Rize was the lowest. In all periods (except the 150th d), the hue angle values of kiwifruit grown in Rize were higher than those in Ordu and Samsun (Figure 4).
During the shelf life, flesh color characteristics showed significant differences according to the cultivation region (p ≤ 0.05) (Figure 5). The L* (flesh) and chroma values decreased during the shelf life. It was observed that kiwifruit from Yalova, Giresun and Rize provinces had higher L* values at harvest and on the 30th d than the other regions. On the 60th, 90th and 120th d, it was detected that kiwifruit grown in Ordu had lower values than the other areas. On the 150th d, the L* (flesh) values of the kiwifruit from Yalova and Giresun were higher than those of the other regions. On the 150th d, the flesh chroma value of kiwifruit from Giresun was lower than all other provinces. At harvest and 30th d of shelf life, the hue angle (flesh) value was lower in Yalova compared to other cultivation areas. On days the 90th, 120th and 150th d, the hue angle (flesh) values of the kiwifruit grown in Ordu, Rize and Samsun provinces were higher than those of fruit from Giresun and Yalova (Figure 5).

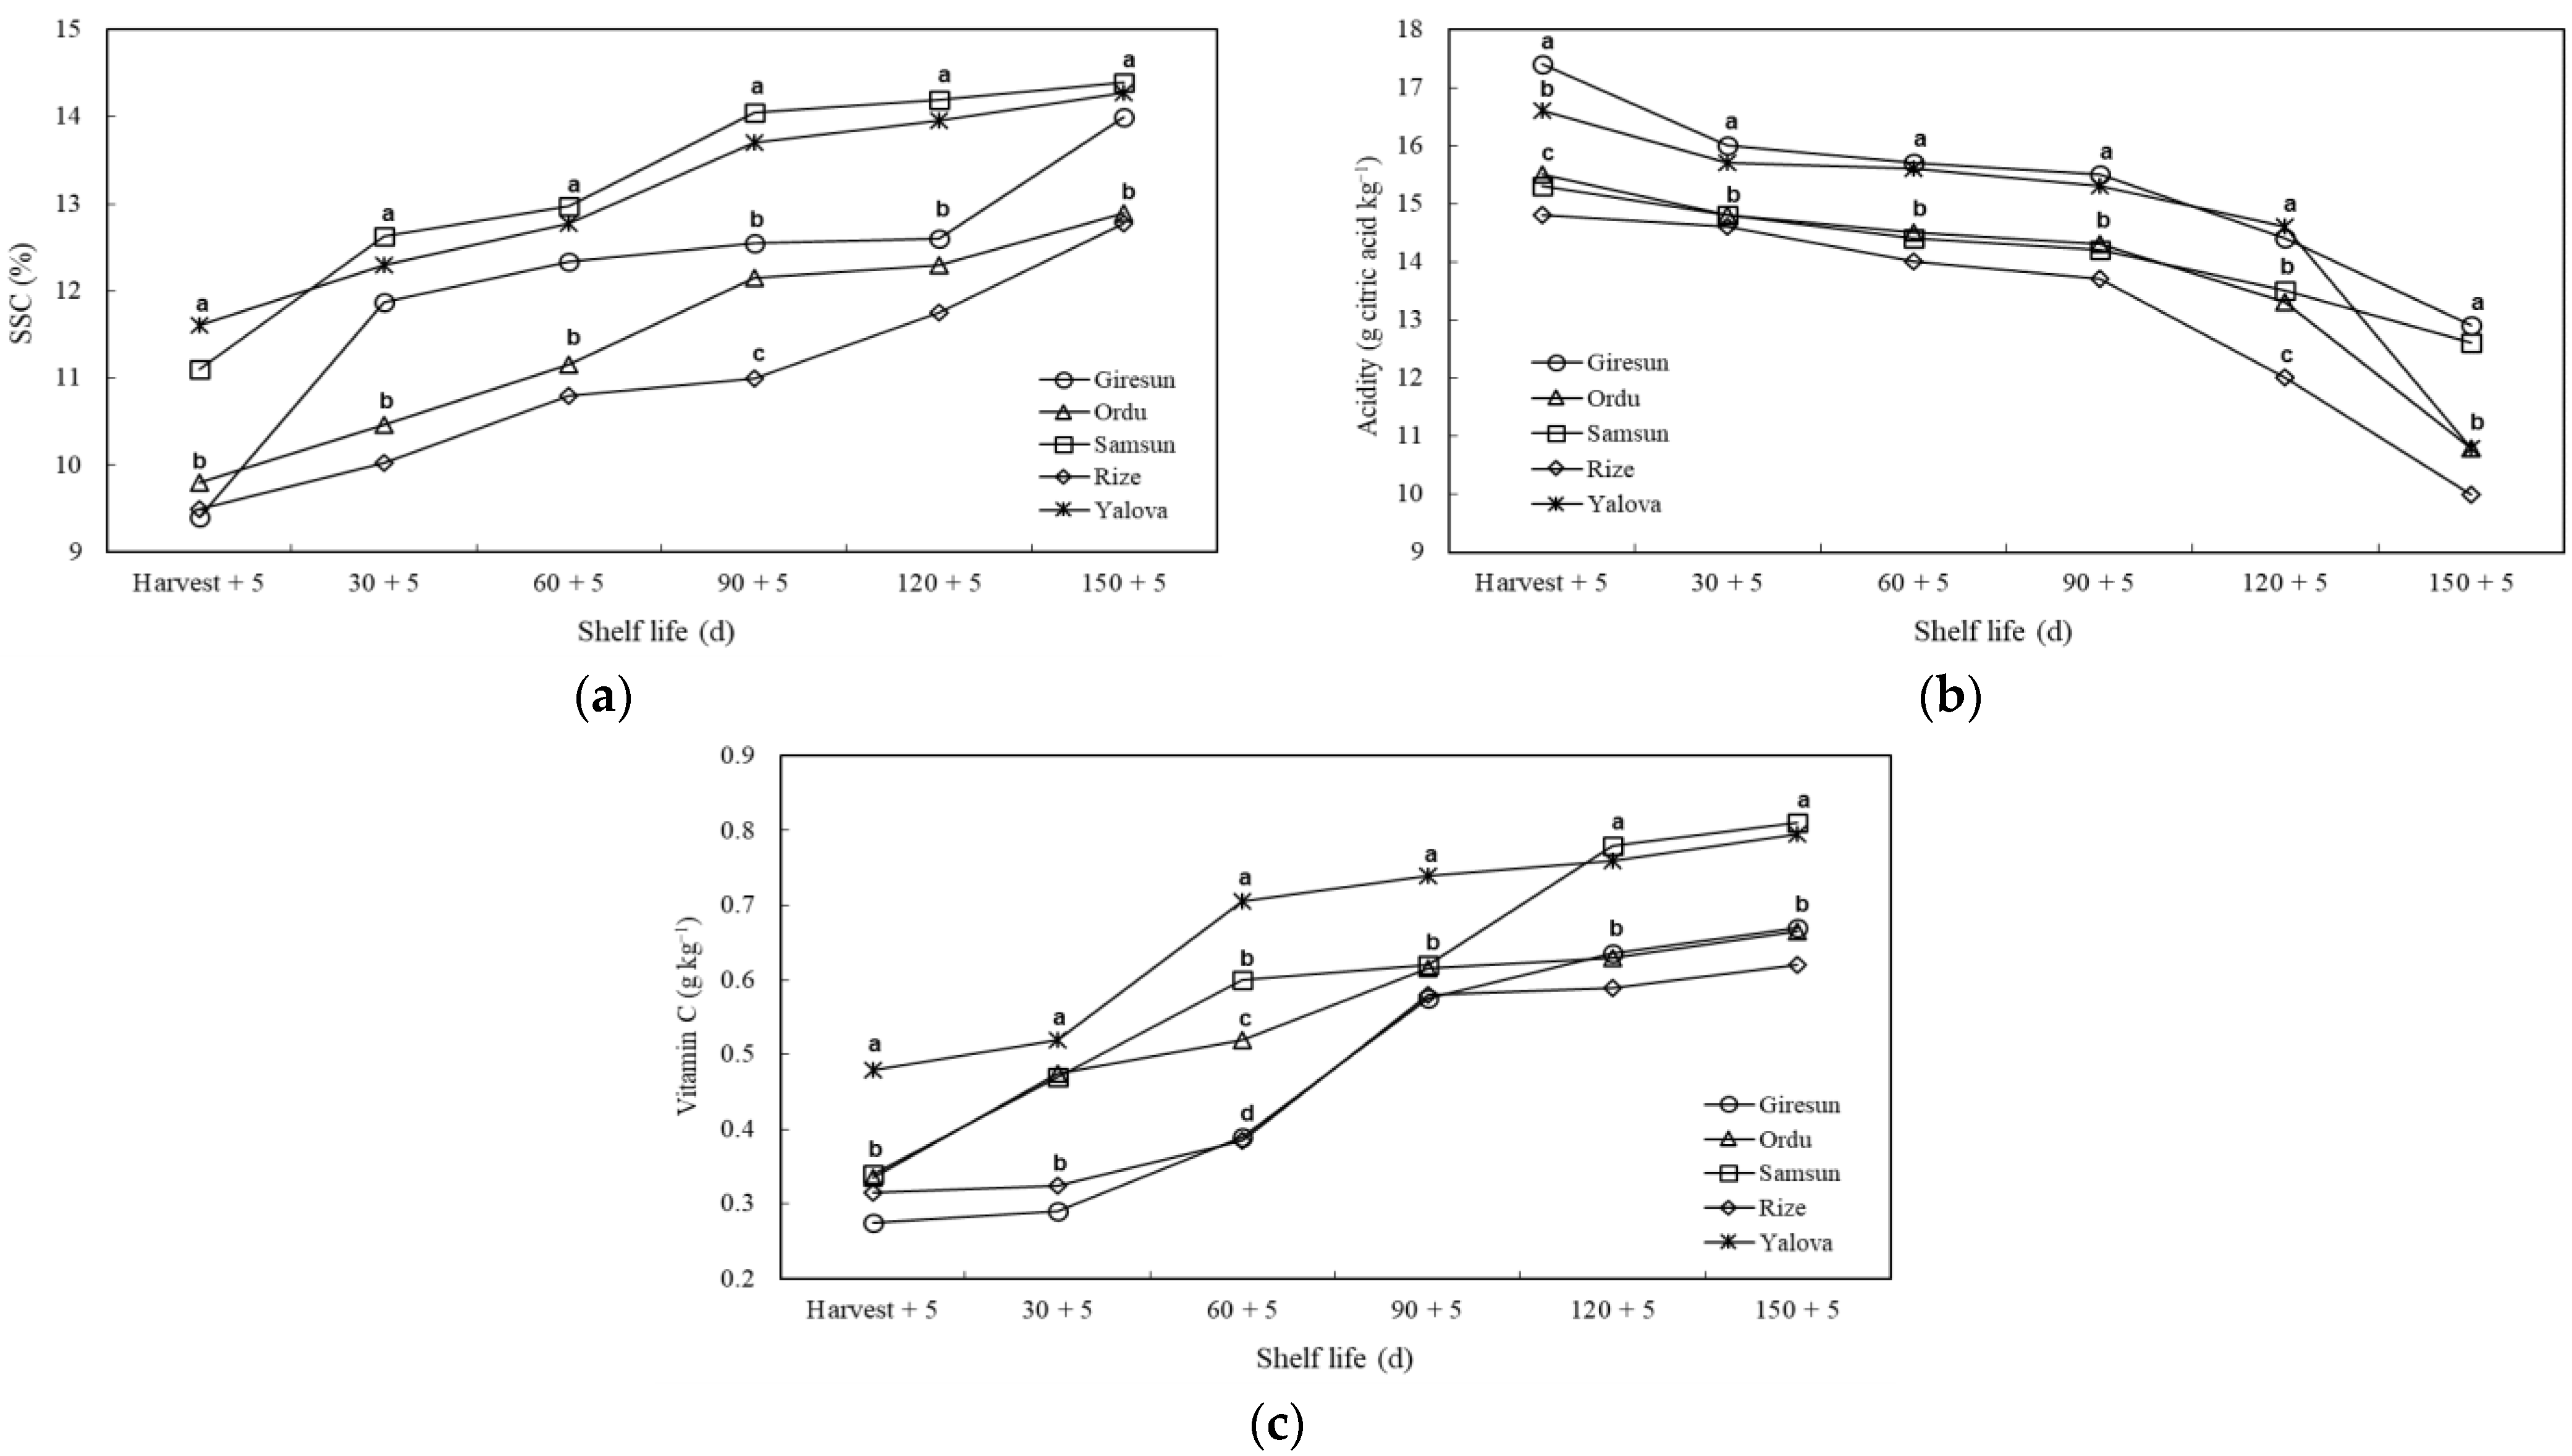
3.3. Vitamin C, SSC and Acidity

During the shelf life, the SSC content of kiwifruit from all cultivation regions increased, whereas the acidity decreased. At harvest, on the 90th, and on the 120th day of shelf life, the SSC content of kiwifruit from the Samsun and Yalova provinces was significantly (p ≤ 0.05) higher than in the other provinces. On the 150th day, kiwifruit from the Samsun, Yalova, and Giresun provinces were found to have higher SSC than kiwifruit grown in the Ordu and Rize provinces. The titratable acidity of kiwifruit from the Ordu, Rize, and Samsun provinces was lower than the acidity of kiwifruit from the Giresun and Yalova provinces in the other periods, except for the 150th d of shelf life. On the 150th d, the acidity of kiwifruit from the Giresun and Samsun provinces was similar to one another but significantly higher than in the other provinces. An increase in the vitamin C content of kiwifruit from all cultivation regions was observed during the shelf life. The vitamin C content of kiwifruit grown in the Yalova province was higher than in other areas at harvest and after 60 and 90 days of shelf life. It was observed that the vitamin C of kiwifruit grown in the Samsun and Yalova provinces was significantly higher on the 120th and 150th d than in other areas (Figure 6).

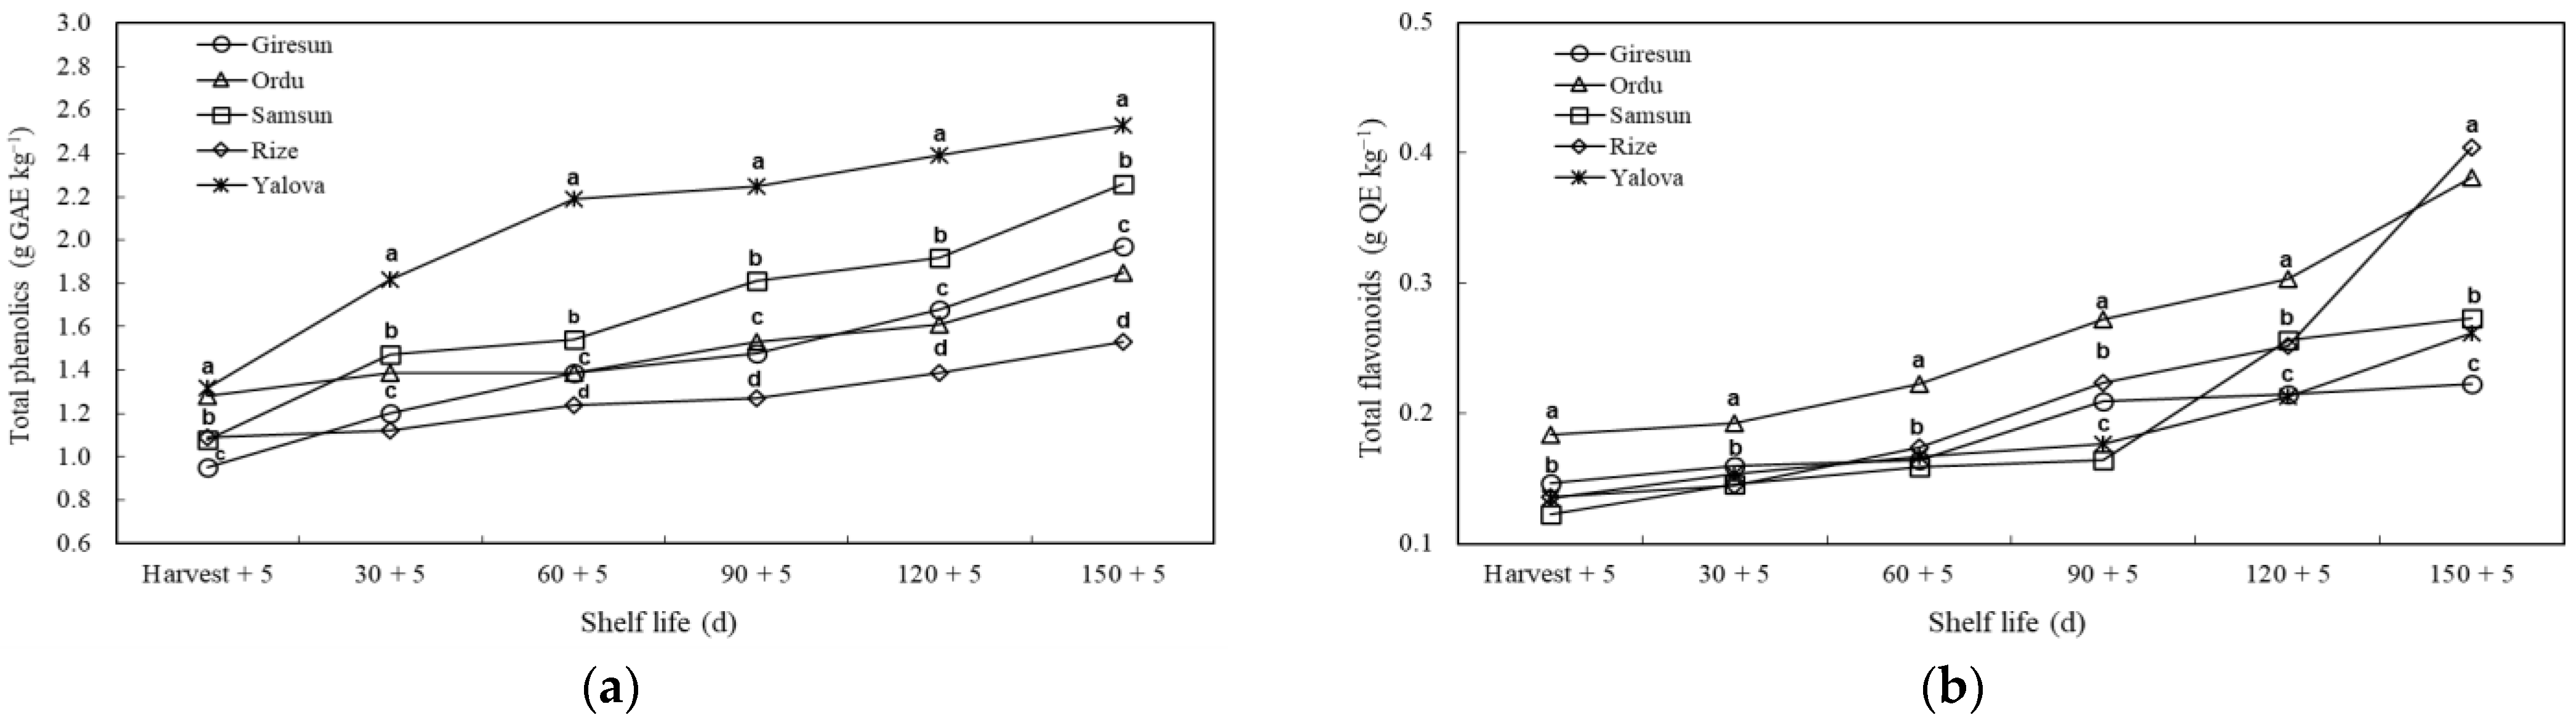
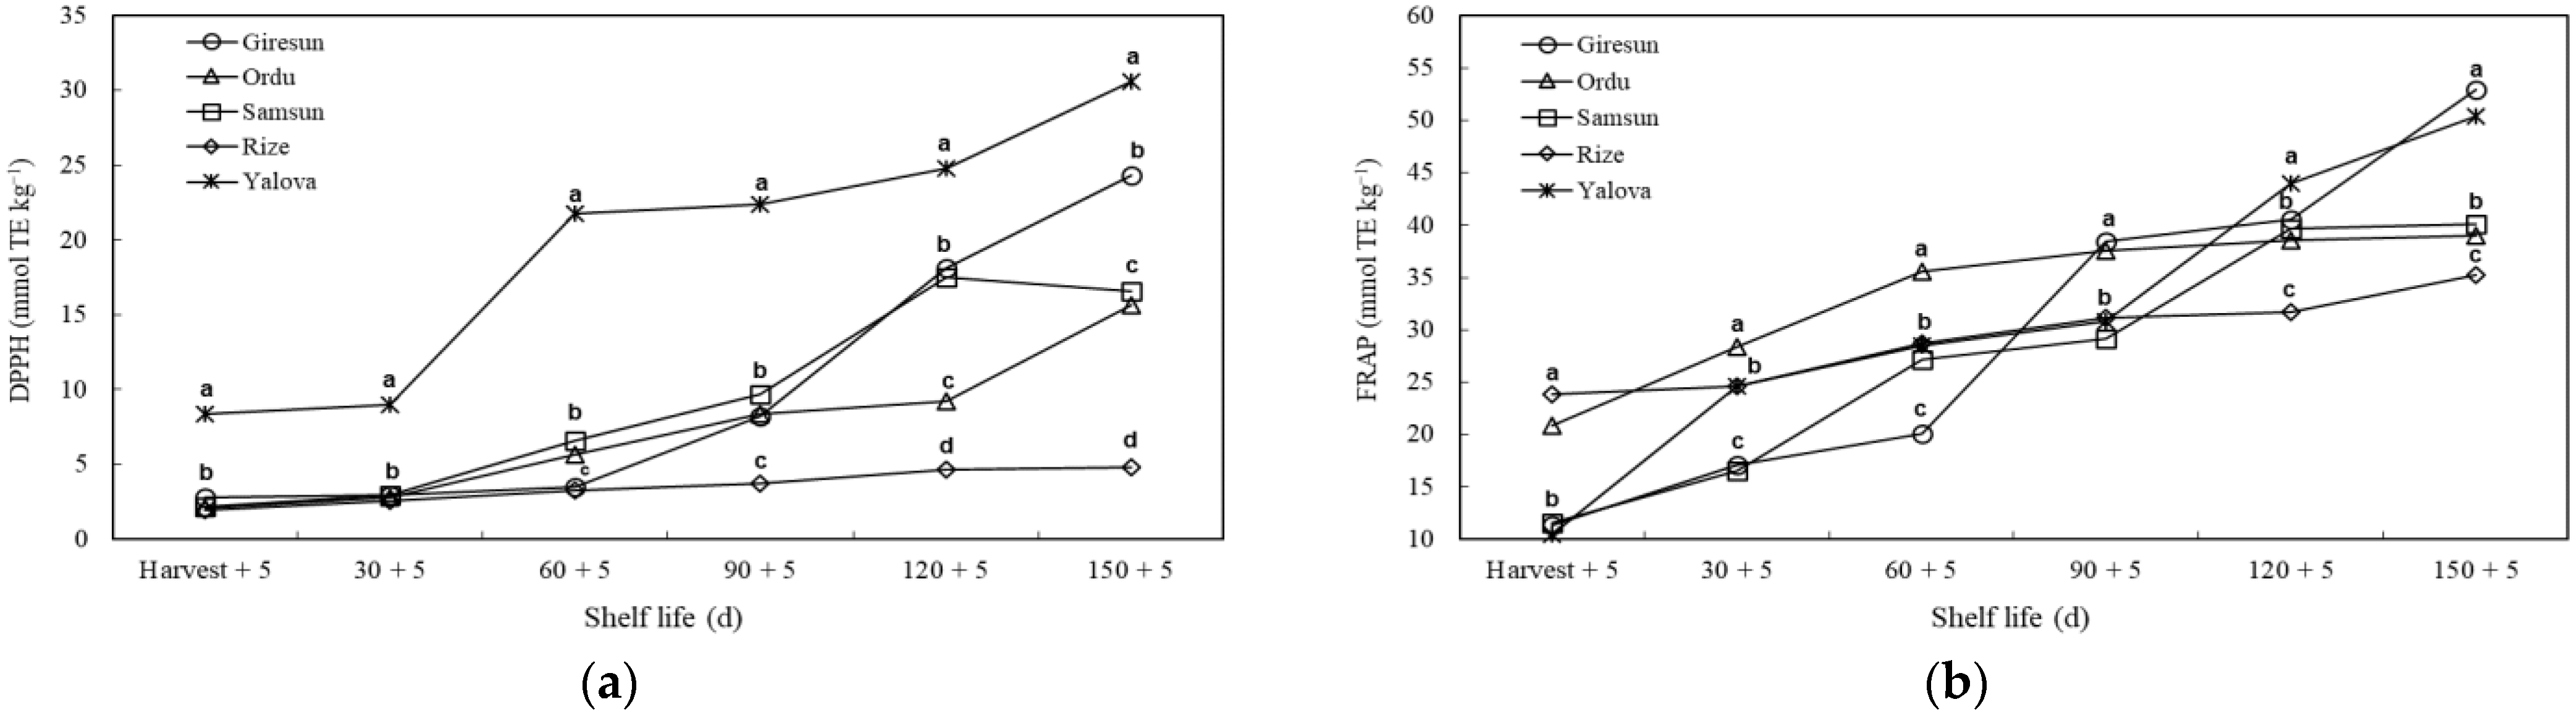
3.4. Total Phenolics (TP), Total Flavonoids (TF), and Antioxidant Activity

An increase in TP and TF values was observed in all measurement periods. At harvest, the TP of kiwifruit grown in the Yalova and Ordu provinces was significantly (p ≤ 0.05) higher than in the other provinces, whereas in kiwifruit from Giresun, it was significantly lower. On the 150th d, the highest TP was obtained from the kiwifruit of the Yalova province, while the lowest value was obtained from the kiwifruit of Rize. It was found that the TF content in the kiwifruit from the Ordu province was higher for the measurements performed at the time of harvest, on the 30th, and on the 60th d. Although the kiwifruit grown in the Rize and Ordu provinces had higher TF content on the 150th day, this value was lowest in the kiwifruit from the Giresun province (Figure 7).
Based on the DPPH assay, it was detected that the antioxidant activity of kiwifruit from the Yalova province was higher than that of the other provinces in all measurement periods. On the 90th, 120th and 150th d, a significantly lower value was found in the kiwifruit of the Rize province than that of the other provinces. Based on the FRAP assay, it was observed that the kiwifruit grown in Rize and Ordu had higher antioxidant activity at harvest than the other. On the 30th and 60th d, the highest antioxidant activity was observed in kiwifruit from Ordu. On the 150th d, although the highest antioxidant activity was measured in kiwifruit from the Giresun and Yalova provinces, the lowest activity was found in kiwifruit from the Rize province (Figure 8).

4. Discussion

Respiration rate, which is an indicator in determining the harvest time of kiwifruit and determining the appropriate storage conditions [25], is affected by the ambient temperature [26] and gas composition [27]. In this study, the first increase in respiration rate occurred on the 30th day and then decreased to the 90th d. The respiration rate of kiwifruit from the Giresun, Ordu, and Yalova provinces was lower in this period than Rize. The kiwifruit harvested initially respires at a relatively higher rate because it continues to ripen and is metabolically active. The respiration rate may peak during this time and then gradually decline as maturity levels rise to advanced stages [28]. This is also associated with the climacteric characteristic of kiwifruit [25]. In some previous studies, it was observed that the highest respiration rate during the shelf life of kiwifruit reached the 60th day [18,20]. Compared to other studies, the respiration rate seems to peak earlier in this study. This can be explained by the slowing effect of aminoethoxyvinylglycine (AVG) [29,30] and methyl jasmonate (MeJA) [29,31] in fruit maturity, which researchers apply in addition to MAP. Also, on the 120th day, the respiration rate of kiwifruit from the Samsun, Rize, Giresun, and Ordu provinces increased again. In contrast, the respiration rate of kiwifruit from the Yalova province continued to decrease on the 120th and 150th d. Therefore, at the end of the shelf life, it was determined that the respiration rate of the Yalova province’s kiwifruit was lower than those of other cultivation areas.
Kiwifruit are usually harvested when they have reached a certain level of maturity, which is reflected in the SSC and experiments start at the same point 6.5° Brix, but are still firm enough to withstand handling and transportation [32]. At this stage, the flesh firmness of kiwifruit is higher. In our study, the highest fruit firmness was determined to be at the time of harvest for all cultivation areas. It was determined that the hardest kiwifruit belonged to Yalova and Rize, and the softest belonged to Samsun. During the shelf life, it was observed that softening occurred in the fruit flesh as the process progressed. From the measurements, it was determined that the kiwifruit of Yalova lost its flesh firmness rapidly, especially from the 60th d, and had softer kiwifruit on the 90th, 120th, and 150th d than the other cultivation areas. It is known that the softening in the fruit flesh of kiwifruit is related to ethylene biosynthesis [9]. Cell wall deterioration, water loss, and hydrolysis of starch were reported to cause fruit flesh softening [33]. In the last period of shelf life, it was determined that fruit firmness was maintained in the fruits from Rize, Ordu, and Giresun.
The L*, C*, and hue angle values are parameters used to describe color characteristics in various products, including kiwifruit. These values represent different aspects of color perception: L* represents lightness, C* represents color intensity, and the hue angle represents the color tone [34]. In this study, color changes occurred in both the skin and fruit flesh of the kiwifruit examined during their shelf life, and the effect of different cultivation areas on these color changes was found to be significant. It was reported that the destruction of chlorophyll pigments in kiwifruit affected the color change during the maturity process [35]. In addition, it was reported that light [35], temperature [36], and storage conditions [37] affected the color changes in kiwifruit.
During the shelf life, the SSC increased, whereas the acidity content decreased in this study. This change, which occurred with the ripening of kiwifruit after harvest, was related to enzymes converting starch into sugar [38]. After being harvested, kiwifruit’s SSC, and acidity contents change depending on several variables, including ripening, storage conditions [37,39], and variety [40]. As it is known, kiwifruit are harvested when they reach a certain maturity (SSC, 6.5%) to maintain fruit quality post-harvest, and they are not suitable for consumption during this period. It is expected that the SSC will be relatively low and the acidity content will be higher in this period. In this study, it was determined that the lowest SSC content was observed in fruits from Giresun, Rize and Ordu at the harvest, whereas the highest acidity content was found in the kiwifruit belonging to these provinces. In addition, SSC was higher in the kiwifruit of Samsun and Yalova; acidity content was higher in the kiwifruit of Giresun and Samsun. Cheng et al. [41] reported that the sugar–acid balance directly affects the taste of the fruit. This showed that different cultivation areas may influence the fruit’s taste.
Numerous elements, including genotypic variations, pre-harvest climatic conditions and cultural practices, maturity, harvesting methods, and post-harvest handling procedures, can affect the vitamin C content of fruits and vegetables [42]. In this study, vitamin C content was maintained at the highest level in the kiwifruit of Samsun and Yalova. However, the vitamin C content of kiwifruit in all cultivation areas increased during shelf life. On the contrary, it has been reported that vitamin C content gradually decreases during storage in different studies [10,43]. It is thought that this may be related to the increase in the antioxidant activity of kiwifruit [44]. As a matter of fact, in our study, it was determined that the total phenolics, flavonoids, and antioxidant activities increased during the shelf life. Free radicals, known to harm cells in the human body, can be neutralized by antioxidants [45]. During the shelf life, antioxidant activity was significantly preserved in kiwifruit from Yalova and Giresun, total phenolics content from Yalova and Samsun, and total flavonoids content from Rize and Ordu. It is reported that the presence of components such as antioxidant activity, phenolic compounds, flavonoids, and vitamin C are closely related to each other [46,47].
As a result, it was determined that the quality characteristics of kiwifruit belonging to the Yalova province were maintained during the study compared to other cultivation areas. Also, the results obtained from the study showed that different cultivation areas influenced the fruit quality traits and bioactive compounds of ‘Hayward’ kiwifruit during the shelf life.

Author Contributions

Conceptualization, B.O.; methodology, B.O. and M.K.; software, B.O.; validation, B.O., M.K. and S.U.; formal analysis, B.O., M.K. and S.U.; investigation, B.O. and M.K.; resources, B.O.; data curation, B.O. and S.U.; writing—original draft preparation, B.O. and S.U.; writing—review and editing, B.O. and S.U.; visualization, B.O. and S.U.; supervision, B.O.; project administration, B.O. and M.K. All authors have read and agreed to the published version of the manuscript.

Funding

This research received no external funding.

Data Availability Statement

All data are provided within the manuscript.

Acknowledgments

The authors thank the Ordu Province Directorate of Agriculture and Forestry for the support.

Conflicts of Interest

The authors declare no conflict of interest.

References

  1. Ferguson, A.R. Botanical Description. In The Kiwifruit Genome; Testolin, R., Huang, H.-W., Ferguson, A.R., Eds.; Springer International Publishing: Cham, Switzerland, 2016; pp. 1–13. ISBN 978-3-319-32274-2. [Google Scholar]
  2. Huang, S.; Ding, J.; Deng, D.; Tang, W.; Sun, H.; Liu, D.; Zhang, L.; Niu, X.; Zhang, X.; Meng, M.; et al. Draft Genome of the Kiwifruit Actinidia Chinensis. Nat. Commun. 2013, 4, 2640. [Google Scholar] [CrossRef]
  3. Wu, J.H. Cultivar, Environment and Integration of Cultural Practices Will Determine the Future of the Kiwifruit Industry. Scr. Hortic. 2020, 20, 171–178. [Google Scholar]
  4. Koday, S. Türkiye’de Kivi Üretimi. Doğu Coğrafya Derg. 2000, 6, 103–122. [Google Scholar]
  5. Bochare, S.; Kshirsagar, R.; Sawate, A.; Agarkar, B.; Patil, B. Studies on Effect of Guar Gum as Stabilizer on Kiwi Fruit Ready to Serve Beverage Incorporated with Lemongrass. Pharma Innov. J. 2020, 9, 109–111. [Google Scholar]
  6. Satpal, D.; Kaur, J.; Bhadariya, V.; Sharma, K. Actinidia Deliciosa (Kiwi Fruit): A Comprehensive Review on the Nutritional Composition, Health Benefits, Traditional Utilization, and Commercialization. J. Food Process Preserv. 2021, 45, e15588. [Google Scholar] [CrossRef]
  7. Boukouvalas, S.; Chouliaras, V. Factors Affecting Storage Life in Kiwifruit. Agro Thesis 2005, 3, 26–32. [Google Scholar]
  8. Ruiz-Aracil, M.C.; Guillén, F.; Ilea, M.I.M.; Martínez-Romero, D.; Lorente-Mento, J.M.; Valverde, J.M. Comparative Effect of Melatonin and 1-Methylcyclopropene Postharvest Applications for Extending ‘Hayward’ Kiwifruit Storage Life. Agriculture 2023, 13, 806. [Google Scholar] [CrossRef]
  9. Retamales, J.; Pérez-Villarreal, A.; Callejas, R. Ethylene Biosynthesis Inhibitor Improves Firmness of Kiwifruit. Acta Hortic. 1995, 394, 159–164. [Google Scholar] [CrossRef]
  10. Choi, H.R.; Baek, M.W.; Tilahun, S.; Jeong, C.S. Long-Term Cold Storage Affects Metabolites, Antioxidant Activities, and Ripening and Stress-Related Genes of Kiwifruit Cultivars. Postharvest Biol. Technol. 2022, 189, 111912. [Google Scholar] [CrossRef]
  11. Ferguson, A.R.; Seal, A.G. Kiwifruit. In Temperate Fruit Crop Breeding; Springer: Dordrecht, The Netherlands, 2008; pp. 235–264. [Google Scholar]
  12. Costa, G.; Kukuriannis, B.; Monet, R. Kiwifruit Production in Europe. Acta Hortic. 1992, 297, 141–150. [Google Scholar] [CrossRef]
  13. Ferguson, A.R. Kiwifruit (Actinidia). Acta Hortic. 1991, 290, 603–656. [Google Scholar] [CrossRef]
  14. Gao, B.; Yuan, S.W.; Guo, Y.; Zhao, Z. Potential Geographical Distribution of Actinidia Spp. and Its Predominant Indices under Climate Change. Ecol. Inform. 2022, 72, 101865. [Google Scholar] [CrossRef]
  15. Bostan, S.; Günay, K. ‘Hayward’ (Actinidia Deliciosa Planch) Kivi Çeşidinin Meyve Kalitesi Üzerine Rakım ve yöneyin Etkisi. Akad. Ziraat Derg. 2014, 3, 13–22. [Google Scholar]
  16. Zenginbal, H.; Ozcan, M. Effect of Altitude on Growth-Development and Fruit Quality Attributes of Kiwifruit (Actinidia Deliciosa Planch) Cultivation. Pak. J. Agric. Sci. 2018, 55, 843–851. [Google Scholar]
  17. TSMS. Climate Data. Turkish State Meteorological Service. Available online: https://mgm.gov.tr/ (accessed on 16 October 2023).
  18. Öztürk, B.; Yücedağ, F. Effects of Methyl Jasmonate on Quality Properties and Phytochemical Compounds of Kiwifruit (Actinidiadeliciosa Cv. ‘Hayward’) during Cold Storage and Shelf Life. Turk. J. Agric. For. 2021, 45, 154–164. [Google Scholar] [CrossRef]
  19. McGuire, R.G. Reporting of Objective Color Measurements. HortScience 1992, 27, 1254–1255. [Google Scholar] [CrossRef]
  20. Ozturk, B.; Uzun, S.; Karakaya, O. Combined Effects of Aminoethoxyvinylglycine and MAP on the Fruit Quality of Kiwifruit during Cold Storage and Shelf Life. Sci. Hortic. 2019, 251, 209–214. [Google Scholar] [CrossRef]
  21. Beyhan, Ö.; Elmastas, M.; Gedikli, F. Total Phenolic Compounds and Antioxidant Capacity of Leaf, Dry Fruit and Fresh Fruit of Feijoa (Acca Sellowiana, Myrtaceae). J. Med. Plants Res. 2010, 4, 1065–1072. [Google Scholar]
  22. Zhishen, J.; Mengcheng, T.; Jianming, W. The Determination of Flavonoid Contents in Mulberry and Their Scavenging Effects on Superoxide Radicals. Food Chem. 1999, 64, 555–559. [Google Scholar] [CrossRef]
  23. Benzie, I.F.F.; Strain, J.J. The Ferric Reducing Ability of Plasma (FRAP) as a Measure of “Antioxidant Power”: The FRAP Assay. Anal. Biochem. 1996, 239, 70–76. [Google Scholar] [CrossRef]
  24. Blois, M.S. Antioxidant Determinations by the Use of a Stable Free Radical. Nature 1958, 181, 1199–1200. [Google Scholar] [CrossRef]
  25. Manolopoulou, H.; Papadopoulou, P. A Study of Respiratory and Physico-Chemical Changes of Four Kiwi Fruit Cultivars during Cool-Storage. Food Chem. 1998, 63, 529–534. [Google Scholar] [CrossRef]
  26. Watada, A.E.; Ko, N.P.; Minott, D.A. Factors Affecting Quality of Fresh-Cut Horticultural Products. Postharvest Biol. Technol. 1996, 9, 115–125. [Google Scholar] [CrossRef]
  27. Burg, S.P.; Burg, E.A. Ethylene Action and the Ripening of Fruits Ethylene Influences the Growth and Development of Plants and Is the Hormone Which Initiates Fruit Ripening. Science 1965, 148, 1190–1196. [Google Scholar] [CrossRef] [PubMed]
  28. Meena, N.K.; Baghel, M.; Jain, S.K.; Asrey, R. Postharvest Biology and Technology of Kiwifruit. In Postharvest Biology and Technology of Temperate Fruits; Springer International Publishing: Cham, Switzerland, 2018; pp. 299–329. [Google Scholar]
  29. Cai, W.; Al Shoffe, Y.; Park, D.; Watkins, C.B. Harvest Maturity and Preharvest Aminoethoxyvinylglycine Treatment Effects on Cold-Induced Ethylene Production of ‘Gala’ Apples. HortScience 2023, 58, 532–538. [Google Scholar] [CrossRef]
  30. Wright, A.H.; Prange, R.K. The Effect of Aminoethoxyvinylglycine and Dynamic Controlled Atmosphere on the Storage of ‘Bartlett’ Pear. Erwerbs-Obstbau 2023, 65, 1303–1313. [Google Scholar] [CrossRef]
  31. Uzun, S. Postharvest Quality Traits of Chestnut (Castanea Sativa Mill.) Fruit as Affected by Methyl Jasmonate During Cold Storage. Erwerbs-Obstbau 2023, 65, 1453–1462. [Google Scholar] [CrossRef]
  32. Burdon, J.; Lallu, N. Kiwifruit (Actinidia spp.). In Postharvest Biology and Technology of Tropical and Subtropical Fruits; Woodhead Publishing Limited: Cambridge, UK, 2011; pp. 326–360. [Google Scholar] [CrossRef]
  33. Öztürk, B.; Ağlar, E. The Influence of Modified Atmosphere Packaging on Quality Properties of Kiwifruits During Cold Storage and Shelf Life. Iğdır Üniv. Fen Bilim. Enstitüsü Derg. 2019, 9, 614–625. [Google Scholar] [CrossRef]
  34. Uzun, S.; Ozturk, B. Effects of Aminoethoxyvinylglycine and Modified Atmosphere Packaging Treatments on the Color Characteristics and Antioxidant Activity of Kiwifruit during Cold Storage and Shelf Life. J. Postharvest Technol. 2020, 8, 9–17. [Google Scholar]
  35. Fattahi, J.; Fifaii, R.; Babri, M. Postharvest Quality of Kiwifruit (Actinidia deliciosa cv. Hayward) Affected by Pre-Storage Application of Salicylic Acid. South West. J. 2010, 1, 175–186. [Google Scholar]
  36. Guldas, M. Peeling and the Physical and Chemical Properties of Kiwi Fruit. J. Food Process Preserv. 2003, 27, 271–284. [Google Scholar] [CrossRef]
  37. Fisk, C.L.; Silver, A.M.; Strik, B.C.; Zhao, Y. Postharvest Quality of Hardy Kiwifruit (Actinidia Arguta ‘Ananasnaya’) Associated with Packaging and Storage Conditions. Postharvest Biol. Technol. 2008, 47, 338–345. [Google Scholar] [CrossRef]
  38. Macrae, E.A.; Lallu, N.; Searle, A.N.; Bowen, J.H. Changes in the Softening and Composition of Kiwifruitb (Actinidia Deliciosa) Affected by Maturity at Harvest and Postharvest Treatments. J. Sci. Food Agric. 1989, 49, 413–430. [Google Scholar] [CrossRef]
  39. Marsh, K.; Attanayake, S.; Walker, S.; Gunson, A.; Boldingh, H.; MacRae, E. Acidity and Taste in Kiwifruit. Postharvest Biol. Technol. 2004, 32, 159–168. [Google Scholar] [CrossRef]
  40. Liang, J.; Ren, Y.; Wang, Y.; Han, M.; Yue, T.; Wang, Z.; Gao, Z. Physicochemical, Nutritional, and Bioactive Properties of Pulp and Peel from 15 Kiwifruit Cultivars. Food Biosci. 2021, 42, 101157. [Google Scholar] [CrossRef]
  41. Cheng, C.H.; Seal, A.G.; Boldingh, H.L.; Marsh, K.B.; MacRae, E.A.; Murphy, S.J.; Ferguson, A.R. Inheritance of Taste Characters and Fruit Size and Number in a Diploid Actinidia Chinensis (Kiwifruit) Population. Euphytica 2004, 138, 185–195. [Google Scholar] [CrossRef]
  42. Lee, S.K.; Kader, A.A. Preharvest and Postharvest Factors Influencing Vitamin C Content of Horticultural Crops. Postharvest Biol. Technol. 2000, 20, 207–220. [Google Scholar] [CrossRef]
  43. Wei, L.; Chen, C.; Wan, C.; Chen, M.; Chen, J. Citral Delays Postharvest Senescence of Kiwifruit by Enhancing Antioxidant Capacity under Cold Storage. J. Food Qual. 2021, 2021, 6684172. [Google Scholar] [CrossRef]
  44. Jeong, H.R.; Cho, H.S.; Cho, Y.S.; Kim, D.O. Changes in Phenolics, Soluble Solids, Vitamin C, and Antioxidant Capacity of Various Cultivars of Hardy Kiwifruits during Cold Storage. Food Sci. Biotechnol. 2020, 29, 1763–1770. [Google Scholar] [CrossRef]
  45. Ates, U. Harvest Time Influences Quality Attributes and Phenolic Composition of Fig Fruit: Insights from Physicochemical Analysis and Antioxidant Activity Assessment. Erwerbs-Obstbau 2023, 65, 1627–1632. [Google Scholar] [CrossRef]
  46. Veltman, R.H.; Sanders, M.G.; Persijn, S.T.; Peppelenbos, H.W.; Oosterhaven, J. Decreased Ascorbic Acid Levels and Brown Core Development in Pears (Pyrus communis L. Cv. Conference). Physiol. Plant. 1999, 107, 39–45. [Google Scholar] [CrossRef]
  47. Baltazari, A.; Mtui, H.D.; Mwatawala, M.W.; Chove, L.M.; Msogoya, T.; Samwel, J.; Subramanian, J. Effects of Storage Conditions, Storage Duration and Post-Harvest Treatments on Nutritional and Sensory Quality of Orange (Citrus sinensis (L) Osbeck) Fruits. Int. J. Fruit Sci. 2020, 20, 737–749. [Google Scholar] [CrossRef]
Figure 1. Location of cultivation areas in the study.
Horticulturae 09 01182 g001
Figure 2. (a) Minimum temperature, (b) maximum temperature, (c) mean temperature, (d) sunshine duration, (e) number of rainy days, and (f) total monthly precipitation amount data of study sites.
Horticulturae 09 01182 g002
Figure 3. The effects of agro-ecological conditions on respiration rate (a) and firmness (b) of kiwifruit during shelf life. Means shown with vertically the different lowercase letters were statistically different (Tukey’s test, p ≤ 0.05). * 0 and 100 indicated that the fruit was too soft and too firm, respectively.
Horticulturae 09 01182 g003
Figure 4. The effects of agro-ecological conditions on L* (a), chroma (b), and hue angle (c) of skin of kiwifruit during shelf life. Means shown with vertically the different lowercase letters were statistically different (Tukey’s test, p ≤ 0.05).
Horticulturae 09 01182 g004
Figure 5. The effects of agro-ecological conditions on L* (a), chroma (b), and hue angle (c) of flesh of kiwifruit during shelf life. Means shown with vertically the different lowercase letters were statistically different (Tukey’s test, p ≤ 0.05).
Horticulturae 09 01182 g005
Figure 6. The effects of agro-ecological conditions on soluble solids content (SSC) (a), titratable acidity (b), and vitamin C (c) of kiwifruit during shelf life. Means shown with vertically the different lowercase letters were statistically different (Tukey’s test, p ≤ 0.05).
Horticulturae 09 01182 g006
Figure 7. The effects of agro-ecological conditions on total phenolics (a) and total flavonoids (b) of kiwifruit during shelf life. Means shown with vertically the different lowercase letters were statistically different (Tukey’s test, p ≤ 0.05).
Horticulturae 09 01182 g007
Figure 8. The effects of agro-ecological conditions on antioxidant activity (DPPH (a) and FRAP (b) assays) of kiwifruit during shelf life. Means shown with vertically the different lowercase letters were statistically different (Tukey’s test, p ≤ 0.05). DPPH: The 2,2-diphenyl-1-picrylhydrazyl. FRAP: Ferric reducing antioxidant power.
Horticulturae 09 01182 g008
Table 1. Soil analysis results of the research orchards.
Soil TexturepHSalinity (%)
ResultStatusResultStatusResultStatus
Ordu-152Clay loam5.78Slightly acid0.0128Unsalted
Ordu-242Loamy7.36Neutral0.0066Unsalted
Ordu-360Clay loam5.07Medium acid0.0160Unsalted
Giresun-138Loamy7.35Neutral0.0076Unsalted
Giresun-242Loamy7.83Slightly alkaline0.0930Unsalted
Giresun-346Loamy6.70Neutral0.0162Unsalted
Rize-146Loamy5.83Slightly acid0.0166Unsalted
Rize-250Loamy5.01Medium acid0.0049Unsalted
Rize-352Clay loam5.61Slightly acid0.0059Unsalted
Samsun-152Clay loam7.60Slightly alkaline0.0260Unsalted
Samsun-252Clay loam7.82Slightly alkaline0.0242Unsalted
Samsun-356Clay loam7.80Slightly alkaline0.0301Unsalted
Yalova-152Clay loam7.71Slightly alkaline0.0247Unsalted
Yalova-240Loamy7.74Slightly alkaline0.0148Unsalted
Yalova-352Clay loam7.74Slightly alkaline0.0252Unsalted
Organic MatterChalk (%)Potassium
ResultStatusResultStatusResultStatus
Ordu-13.26Good0.361Slightly chalky406.35Sufficient
Ordu-21.77Low2.340Chalky127.00Sufficient
Ordu-33.18Good0.361Slightly chalky323.20Sufficient
Giresun-11.46Low1.980Chalky366.95Sufficient
Giresun-21.81Low2.810Chalky331.64Sufficient
Giresun-33.67Good2.390Chalky248.00Sufficient
Rize-13.40Good0.361Slightly chalky465.77Sufficient
Rize-23.57Good0.361Slightly chalky271.87Sufficient
Rize-34.66High0.361Slightly chalky274.76Sufficient
Samsun-13.02Good2.660Chalky266.80Sufficient
Samsun-22.54Medium2.200Chalky268.00Sufficient
Samsun-32.38Medium2.850Chalky386.00Sufficient
Yalova-11.73Low2.160Chalky279.20Sufficient
Yalova-22.85Medium2.010Chalky258.61Sufficient
Yalova-32.73Medium2.880Chalky346.94Sufficient
Disclaimer/Publisher’s Note: The statements, opinions and data contained in all publications are solely those of the individual author(s) and contributor(s) and not of MDPI and/or the editor(s). MDPI and/or the editor(s) disclaim responsibility for any injury to people or property resulting from any ideas, methods, instructions or products referred to in the content.

