Article

Physiological, Transcriptomic and Metabolomic Response of Basil (O. basilicum Linn. var. pilosum (Willd.) Benth.) to Red and Blue Light

1
China Shaanxi Key Laboratory of Chinese Jujube, Yan’an University, Yan’an 716000, China
2
Medical Innovation Center for Nationalities, Inner Mongolia Medical University, Huhhot 010110, China
3
State Key Laboratory of Plant Genomics, National Centre for Plant Gene Research (Beijing), Institute of Genetics and Developmental Biology, Chinese Academy of Sciences, Beijing 100101, China
*
Authors to whom correspondence should be addressed.
These authors contributed equally to this work.
Horticulturae 2023, 9(11), 1172; https://doi.org/10.3390/horticulturae9111172
Submission received: 5 September 2023 / Revised: 25 October 2023 / Accepted: 25 October 2023 / Published: 26 October 2023
(This article belongs to the Special Issue Morphology, Palynology and Phytochemicals of Medicinal Plants)

Abstract

:
Basil (Ocimum basilicum Linn. var. pilosum (Willd.) Benth.) is an aromatic plant with high nutritional and economic value, and the synthesis and regulation of its active ingredients have been studied in prior research. However, the mechanisms by which red and blue light—the most effective absorption spectra for photosynthesis—regulate the growth and metabolism of basil remain elusive. This study investigated the changes in phenotype, transcriptome, and metabolome in basil under red and blue light. The photosynthetic efficiency and biomass of basil under blue light (B) treatment were higher than those under white light (W), while red light (R) decreased photosynthesis and biomass. Metabolomic analysis showed that 491 significantly differentially accumulated metabolites were identified between the W and B groups, while 630 differentially accumulated metabolites were identified between the W and R groups. The DAMs were mainly enriched in pathways such as biosynthesis of secondary metabolites, monoterpenoid biosynthesis, limonene and pinene degradation, etc. In addition, transcriptomic analysis revealed that 34,760 and 29,802 differentially expressed genes were detected in the W vs. B pair and the W vs. R pair, respectively, while differentially expressed genes were divided into different unique subclasses, suggesting that they respond to light quality in specific ways. Overall, this work will not only enrich knowledge of the molecular mechanisms of light spectra’s regulation of plant metabolism, but also provide a theoretical basis and guidance for the molecular improvement and quality cultivation of basil.

1. Introduction

Light is one of the indispensable environmental factors affecting plants’ growth and development. It not only provides energy for photosynthesis, but also regulates multiple responses, including germination, seedling photomorphogenesis, circadian rhythms, phototropism, and flowering time [1,2]. In general, the light environment is divided into three main components: light photoperiod, light spectra, and light intensity. Specifically, light spectra play vital roles in many aspects, such as photosynthesis, chloroplast development, and plant morphogenesis, whose regulated processes are much more complicated than those caused by light photoperiod or intensity [3,4]. In higher plants, a series of photoreceptors can accurately perceive ambient light signals and regulate various developmental processes. Generally, photoreceptors in plants can be divided into five main categories: phytochromes (PHYA-E), which sense red/far-red lights (600–750 nm); phototropins (PHOT1 and PHOT2); F-box-containing flavin-binding proteins (e.g., ZEITLUPE, FKF1/LKP2); cryptochromes (CRY1-3), which sense blue/UV-A lights (320–500 nm); and UVR8, which senses UV-B light (280–320 nm) [5,6,7,8,9]. These photoreceptors play unique and/or redundant roles in regulating a wide variety of developmental processes and metabolic pathways.
As some of the most abundant photosynthetic pigments, chlorophyll a absorbs light in the wavelength between 400 nm and 662 nm, and chlorophyll b absorbs light in the wavelength between about 453 nm and 642 nm. Therefore, the red (600–700 nm) and blue (400–500 nm) light spectra are often considered to be the most effectively utilized wavelengths for driving photosynthesis [10]. It is interesting to note that plants grown solely under red light exhibit a lower photosynthetic rate than plants grown under white light, resulting from the fact that red light reduces stomatal density, stomatal conductance, and rubisco protein content [11]. In particular, red light induces substantial impairments in plant growth, such as causing reductions in chlorophyll content and leaf area, and provoking excessive stem elongation, which may eventually lead to the reduction in plant biomass [12,13,14]. Blue light is responsible for regulating chloroplast development, stomatal opening, and chlorophyll formation. Blue-light-grown plants contain higher amounts of Chl a/b, cytochrome (Cyt) F, and rubisco than plants grown under white light [15]. Moreover, blue light greatly affects the architecture of shoots, resulting in dense, compact plants, as well as increasing vegetative growth [16]. In addition to physiological and morphological effects, red and blue light have great effects on plants’ metabolism, including primary metabolism and secondary metabolism. For example, it has been reported that red light inhibits the translocation of photosynthate from leaves, causing leaves to accumulate far greater starch and soluble sugar contents [17,18,19]. Greater anthocyanin content was accumulated in strawberries under red light [20]. In soybeans, red light can also promote the biosynthesis of lignin to improve cell wall firmness [21]. Blue light promoted glucosinolate accumulation in pak choi by increasing the precursor amino acid profiles [22], as well as promoting chlorogenic acid synthesis in strawberries [23]. Pepper plants produced greater amounts of epidermal flavonoids when exposed to enhanced blue light [24]. Thus, the effects of different light spectra on plants are distinctly different.
Ocimum basilicum (Basil) belongs to the Lamiaceae family, possessing important medicinal and culinary values, and has been widely grown in many warm and temperate countries [25]. Previous studies have suggested that basil has many potential pharmacological effects, such as antioxidant, antipyretic, antidiabetic, anticancer, and anti-stress effects, among others [26]. Biologically active ingredients such as essential oils, polysaccharides, flavonoids, and phenols are abundant in basil, contributing to its beneficial health properties [27]. Many basil species, especially sweet basil, are also good resources for the food industry. For example, basil’s leaves can be used as a flavoring agent for food, and its extracts can be used in the manufacture of other foods [25]. Over the past few years, there has been intense research on different aspects of the herb, including its medicinal properties, chemical constituents, and organic cultivation. In contrast, the physiological response of basil to environmental changes has been poorly studied. Several studies have revealed that light spectra have significant effects on the growth and metabolic changes of basil. For example, postharvest irradiation with UV-B can promote the accumulation of flavonoids and phenolic acids in sweet basil’s leaves, while also improving its pharmaceutical quality [28]. Though UV-C is filtered by the atmosphere and does not reach the Earth’s surface/plants, UV-C has been shown to be effective in increasing the production of phenolic compounds and cellular antioxidant potential in callus cultures of purple basil [29]. Nadeem et al. (2019) also found that different light-emitting diodes (LEDs), especially those on the red and blue monochromatic spectra, stimulated the accumulation of biologically active ingredients in callus cultures of basil [30]. In addition, an RB ratio (red/blue LED lights) of three was optimal for indoor sweet basil cultivation, bringing about better performances in growth, resource use efficiency, and yield and quality formation [31]. A recent study showed that blue light did not induce the accumulation of antioxidants in green and purple basil cultivars at harvest [32]. However, the detailed molecular mechanisms by which red and blue light regulate the growth and quality of basil remain largely unknown.
Basil has many varieties with different leaf shapes and aromas, presenting distinct chemical profiles. China has abundant resources of basil, and O. basilicum Linn. var. pilosum (Willd.) Benth. is a variety that is widely distributed throughout China, used as a leafy vegetable and for prescriptions in folk medicine [33]. The effects of red and blue light on its growth and metabolism are still poorly understood. In this study, we explored the changes in phenotype, metabolome, and transcriptome in basil (O. basilicum Linn. var. pilosum (Willd.) Benth.) under continuous monochromatic red and blue light. These results should contribute to a better understanding of how light spectra affect the metabolic products of basil, as well as providing a theoretical basis for future cultivation management.

2. Materials and Methods

2.1. Plant Materials and Light Treatment

Basil (O. basilicum Linn. var. pilosum (Willd.) Benth.) seeds were obtained from the Zhejiang Academy of Agricultural Science (Hangzhou, China). The seeds were sown in plastic flower pots with nutrient soil and cultivated under a 12 h/12 h light photoperiod at 30 °C (day)/24 °C (night) in a greenhouse. After germination, the seedlings were watered with half-strength Hoagland nutrient solution every five days. For light treatment, the plants were divided into three groups after being sown in the soil and placed under monochromatic red (R, 661 nm), blue (B, 449 nm), and white (W, peaks at 445 and 560 nm) LED light. The photon flux density of light in each group was set to 300 μmol photons m−2 s−1. After being cultivated for five weeks, leaves from each treatment sample were collected and stored for further analysis. In total, 40 seedlings in each group and three replicates were set.

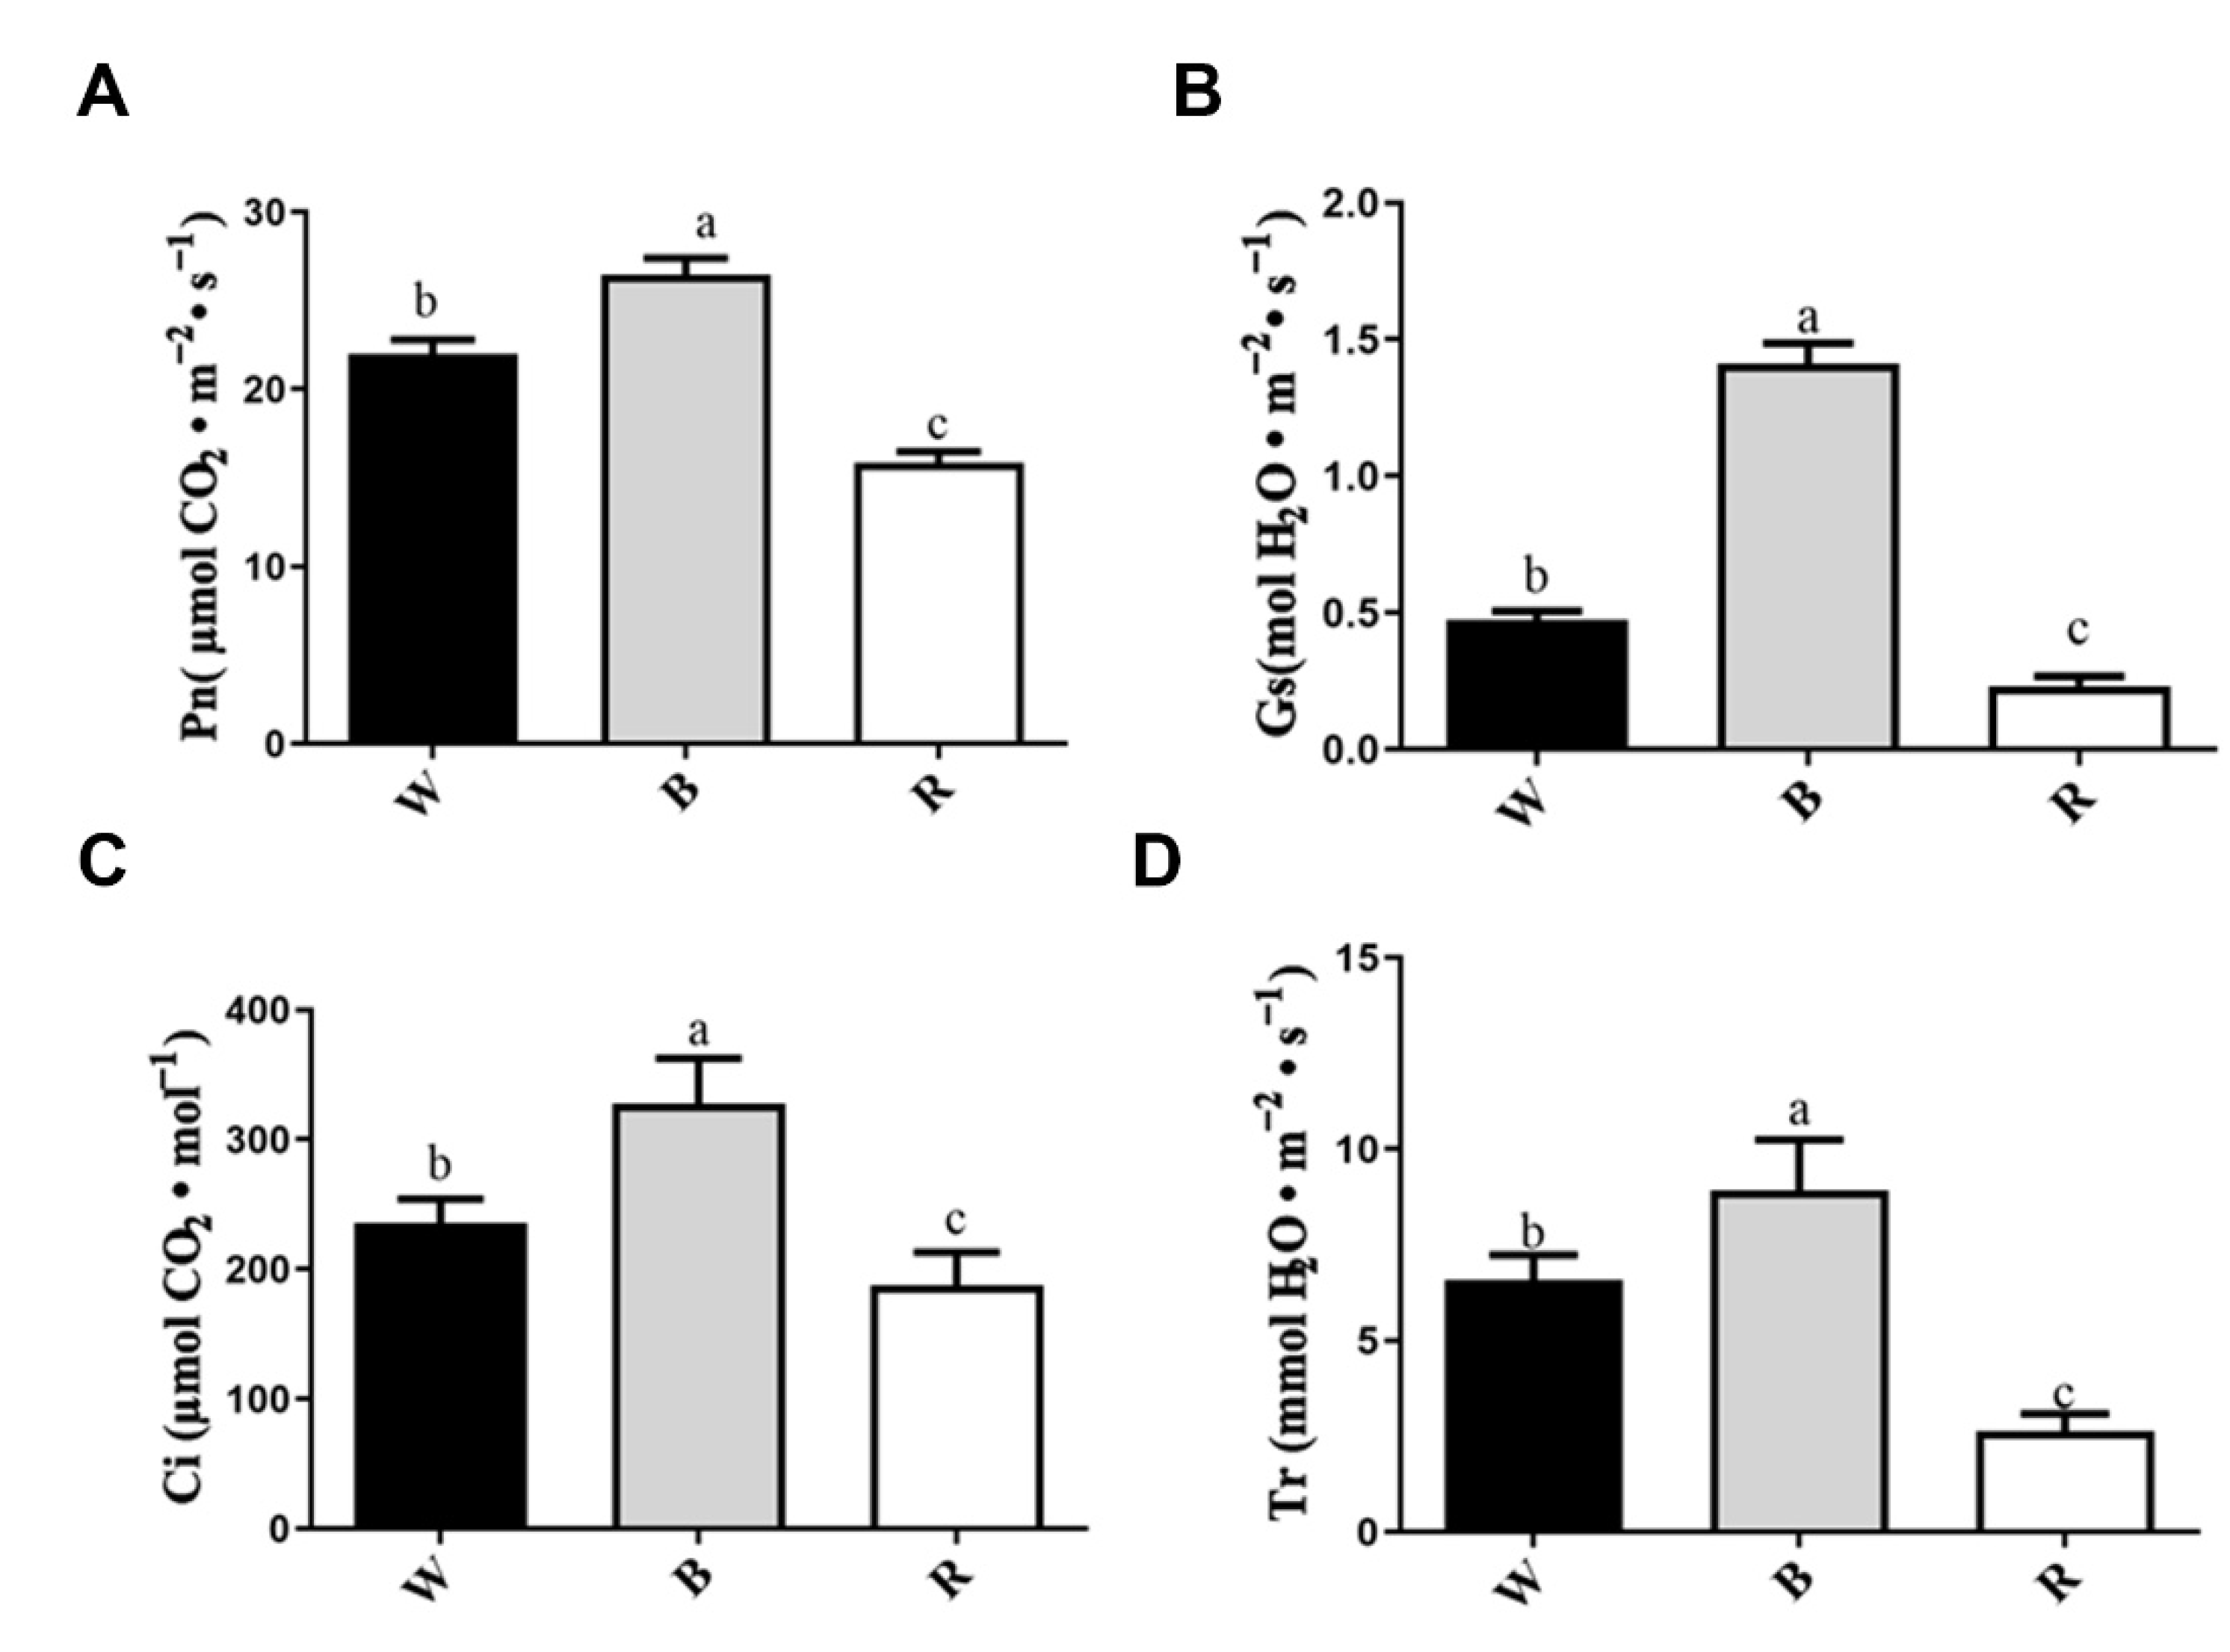
2.2. Analysis of Photosynthetic Parameters and Chlorophyll Fluorescence

Photosynthetic parameters and chlorophyll fluorescence were measured according to the manufacturer’s instructions. Briefly, photosynthetic parameters, including net photosynthetic rate (Pn), intercellular CO2 concentration (Ci), stomatal conductance (Gs), and transpiration (Tr), were measured using a portable photosynthesis system (LI-6400, LI-COR Lincoln, NE, USA). The white light intensity was set to 1000 μmol photons m−2 s−1 inside the leaf chamber for all measurements. Chlorophyll fluorescence was measured using a portable fluorometer (PAM 2500; Walz, Effeltrich, Germany). Before determining Fv/Fm, the plants were exposed to darkness for 30 min.

2.3. Determination of Photosynthetic Pigment and Antioxidant Activity of Leaf Extracts

The photosynthetic pigment contents of leaves were determined using commercial kits (Shanghai Zhen Ke Biological Technology Co., Ltd., Shanghai, China). To measure antioxidant activity, 1 g of leaves was taken under different light quality conditions, and 20 mL of ethanol was added for ultrasonic extraction. Then, the antioxidant activities of the leaf extracts, including DPPH, ABTS, and hydroxyl-scavenging activities, were determined using the corresponding kits (Shanghai Enzyme-linked Biotechnology, Shanghai, China) according to the manufacturer’s instructions. The measurement was repeated three times and averaged.

2.4. RNA Extraction and Illumina Sequencing

Total RNA from frozen samples was extracted using the RNAprep Pure Plant Plus Kit (Tiangen, China), following the manufacturer’s instructions. Then, contaminated genomic DNA in the extracted RNA was removed using DNase I (Takara, Dalian, China). RNA purity and quality were analyzed using a NanoPhotometer spectrophotometer (IMPLEN, Westlake Village, CA, USA) and an Agilent 2100 bioanalyzer (Agilent Technologies, Santa Clara, CA, USA). Samples with RIN (RNA integrity number) values ≥ 8.0 were used for sequencing library construction. The sequencing libraries were prepared with an NEB Next Ultra RNA Library Prep Kit (NEB, MA, USA). In total, 9 libraries were prepared with different light spectra treatments, and 150 bp paired-end reads were sequenced using an Illumina HiSeq 4000 platform (Illumina, San Diego, CA, USA).

2.5. Transcriptomic Analysis

To retrieve clean reads from the raw data, the FastQC tool (http://www.bioinformatics.babraham.ac.uk/projects/fastqc/) (accessed on 13 November 2021) was used to remove reads containing adapters, poly-N, and low-quality reads. Transcriptome assembly was carried out using Trinity (v2.11.0) by employing the paired-end method, and Corset (https://code.google.com/p/corset-project/) (accessed on 22 November 2021) was used to realign the relevant transcripts into unigenes. Then, the assembled unigenes were functionally annotated with various databases, such as Nr (NCBI non- redundant protein sequences), Swiss-Prot (A manually annotated and reviewed protein sequence database), Trembl (a variety of new documentation files and the creation of TrEMBL), KEGG (Kyoto Encyclopedia of Genes and Genomes), GO (Gene Ontology), KOG/COG (COG: Clusters of Orthologous Groups of proteins; KOG: Karyotic Ortholog Groups), and Pfam (Protein Family). Using RSEM (RNA-Seq via Expectation Maximization) to estimate the gene expression levels, and calculating the FPKM (fragments per kilobase of transcript per million mapped reads) of each gene based on the gene length. DEG (differentially expressed gene) analysis was performed using the DESeq R package (DESeq2 v1.22.1), with an adjusted p-value of <0.05. The DEGs were then subjected to enrichment analysis of GO functions and KEGG pathways, as described in our previous study [34].

2.6. Extraction and Detection of Metabolites

The sample leaves were ground into powder in liquid nitrogen. We transferred 1 g of powder to a 20 mL headspace vial (Agilent, Santa Clara, CA, USA) with saturated NaCl solution, and we used crimp-top caps with TFE-silicone headspace septa (Agilent) to seal the vial. For SPME (solid-phase micro-extraction) analysis, we heated the vial at 60 °C for 5 min, and then we exposed a 120 µm DVB/CWR/PDMS fiber (Agilent) to the headspace of the sample at 100 °C for 15 min. Then, the GC apparatus (Model 8890; Agilent) was used to desorb VOCs from the fiber coating at 250 °C for 5 min in splitless mode. The identification and quantification of VOCs was performed by using an Agilent Model 8890 GC and a 7000 D mass spectrometer (Agilent) equipped with a 30 m × 0.25 mm × 0.25 μm DB-5MS (5% phenyl-polymethylsiloxane) capillary column. The operational parameters were set as described in a previous study [35].

2.7. Metabolomic Analysis

Metabolomic analysis was conducted according to a previously described method [36]. In brief, to study metabolite-variety-specific accumulation, the statistics function prcomp within R (www.r-project.org) (accessed on 25 November 2021) was used to perform unsupervised principal component analysis (PCA). The OPLS-DA model was produced using the R package MetaboAnalystR, which was used to analyze all of the comparison groups and to screen differential metabolites. Differentially accumulated metabolites (DAMs) between the compared samples were filtered with the criteria of absolute log2FC (fold change) ≥1 and VIP ≥ 1. Pathway annotation and enrichment analysis of DAMs were carried out based on the Kyoto Encyclopedia of Gene and Genomes (KEGG) database (http://www.genome.jp/kegg) (accessed on 29 November 2021).

2.8. Integrative Analysis of Metabolomic and Transcriptomic Datasets

Association analysis between the metabolomic and transcriptomic datasets was performed as previously described in [37]. The R package was used to normalize the data before establishing the relationships between the DEGs and DAMs. Correlation, two-way orthogonal partial least squares (O2PLS), PCA, KEGG pathway enrichment, and other analyses were conducted.

3. Results

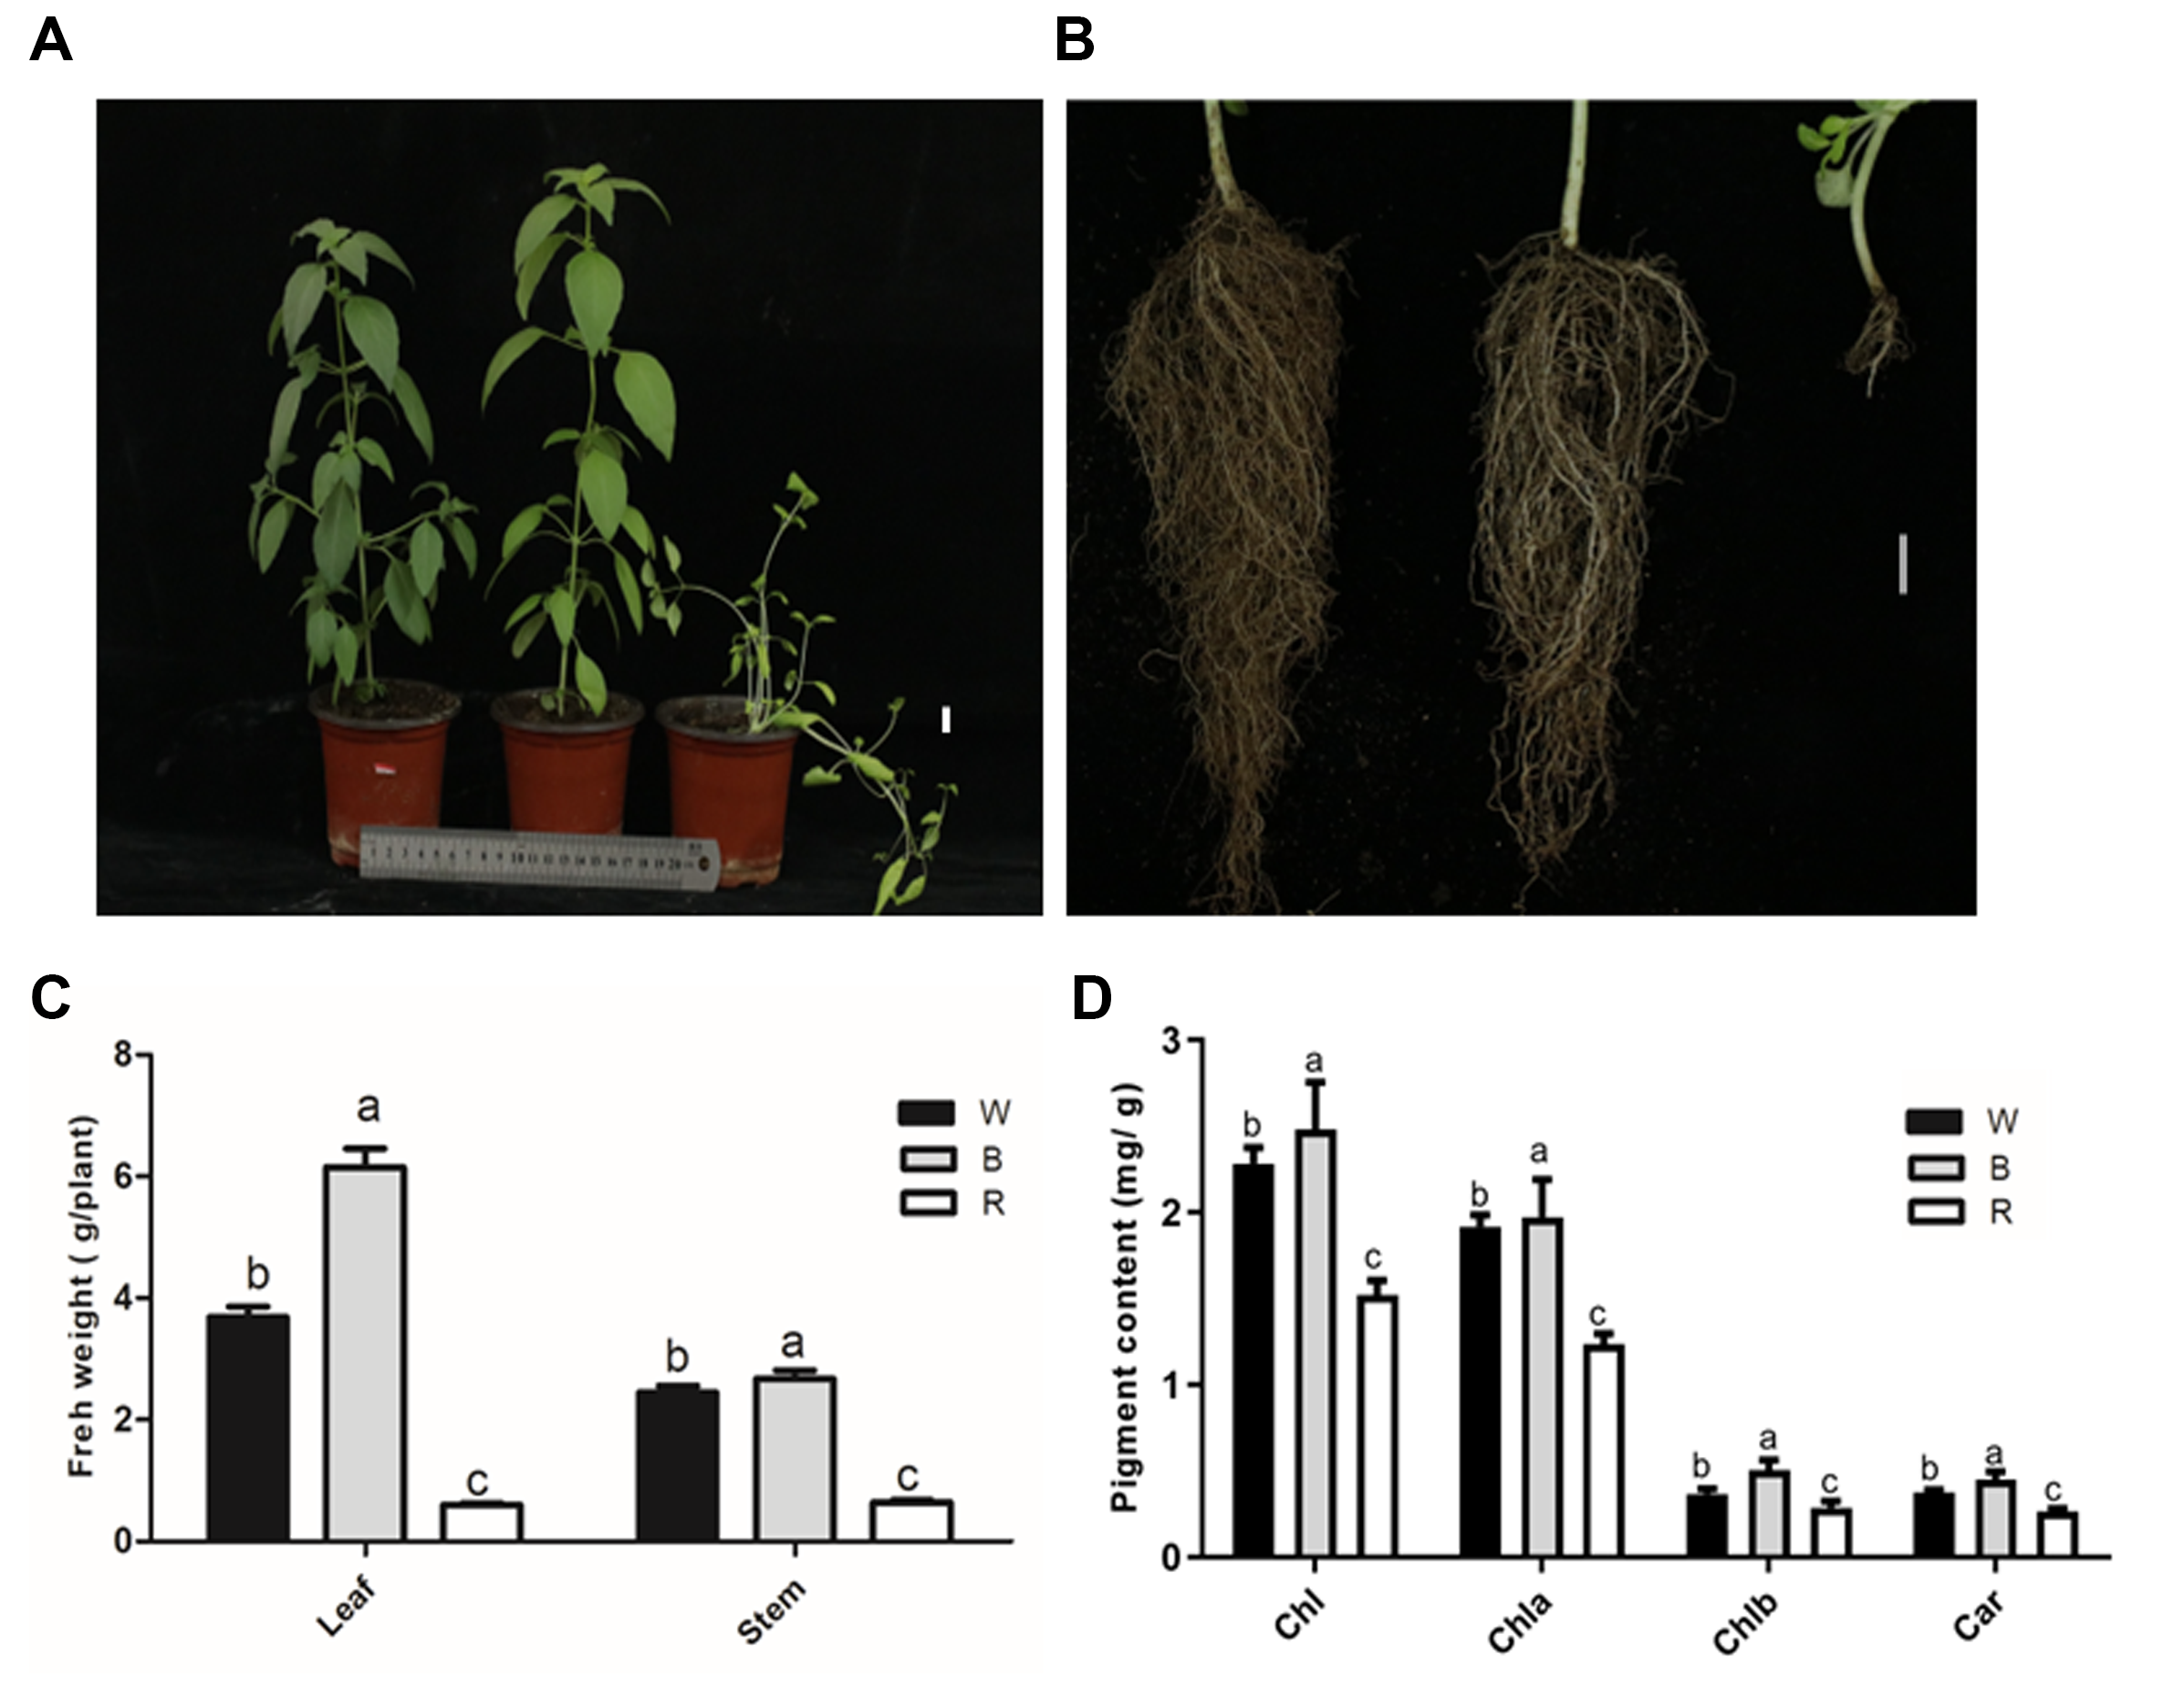
3.1. Plant Morphology and Growth Characteristics

To determine the effects of different light quality on basil growth, phenotypes of basil planted under red light (R), blue light (B), and white light (W) for five weeks were analyzed. Compared with the W group, the B group showed increased biomass, with greater plant height (about 1.12 times that of the W group) and leaf area, while the R group showed the smallest plant height and leaves. In terms of branching between stems, compared to W, the levels of branching under R were increased, while they decreased under B (Figure 1A). Interestingly, there was no significant difference in root length between the W and B groups, while the root length of the R group decreased significantly (Figure 1B). Consistent with the phenotype, the leaf and stem fresh weight were the highest in the B group (Figure 1C). The chlorophyll contents and carotenoid contents were both significantly higher in the B group but lower in the R group (Figure 1D).
As shown in Figure 2, compared to the W group, the photosynthetic parameters—including the net photosynthetic rate (Pn), stomatal conductance (Gs), intercellular CO2 concentration (Ci), and transpiration rate (Tr)—were much higher in the B group. In contrast, the red group showed lower photosynthetic capacity, except for a higher Ci value than that of the W group. Chlorophyll fluorescence analysis revealed that the maximum photochemical efficiency of photosystem II (Fv/Fm) was reduced to 0.64 in the R group, while the values for the B and W groups remained around 0.8. Meanwhile, compared to the W group, the actual photochemical efficiencies (ΦPSII and ΦPSI) were significantly increased and reduced in the B and R groups, respectively (Figure S1).

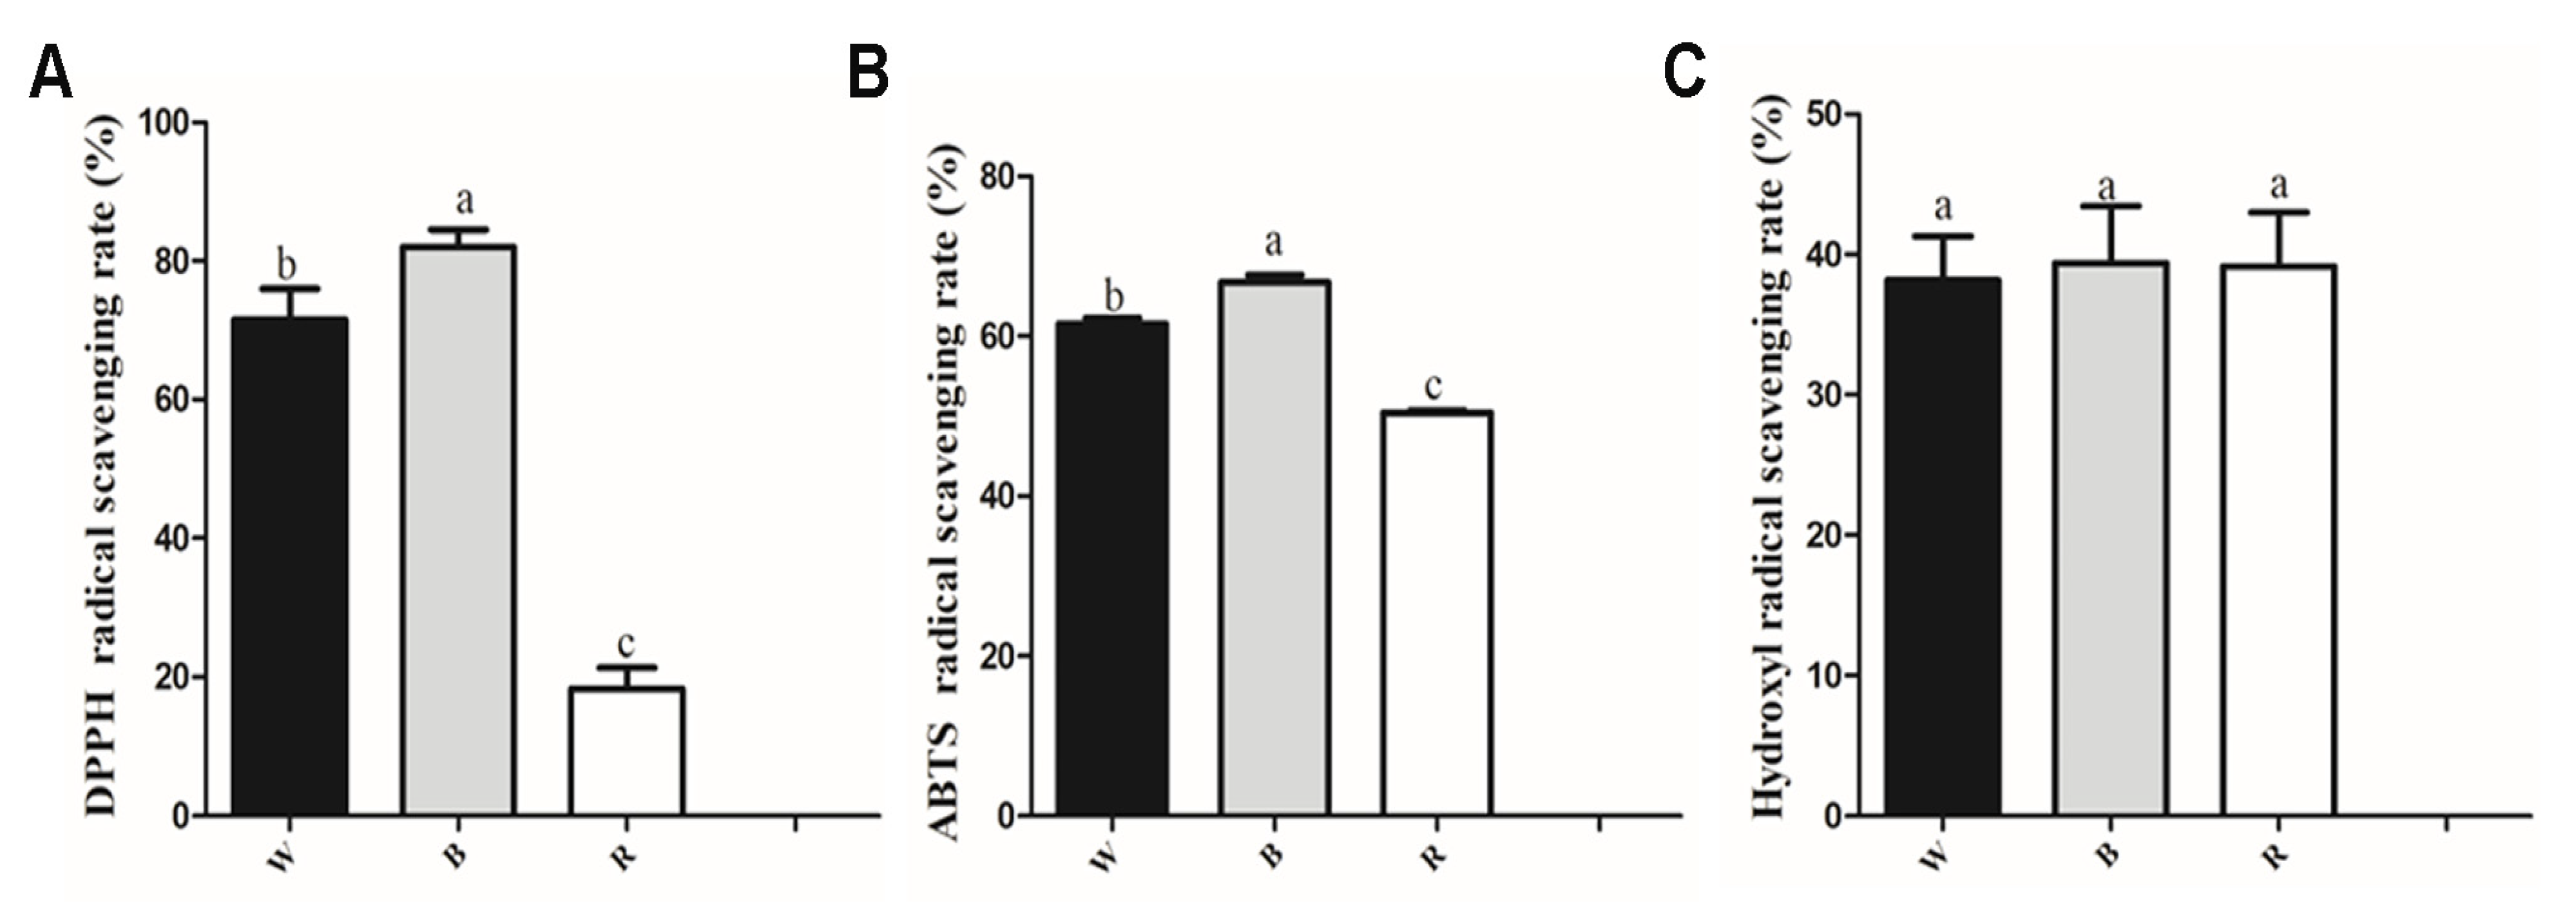
3.2. Antioxidant Activity Analysis of Leaf Extracts

The antioxidant activity of the basil leaf extracts is shown in Figure 3. The DPPH radical scavenging activity under the blue light treatment was 1.25 times that under white light, while that under the red light treatment was only 0.3 times that under white light. Similarly, the ABTS radical scavenging activity under blue light treatment was 1.15 times that under white light, while that under the red light treatment was 0.75 times that under white light. There were no differences in hydroxyl radical scavenging activity under the three light treatments. Therefore, compared with white light, blue and red light were found to affect antioxidant activity, mainly by changing the activity of DPPH and ABTS.

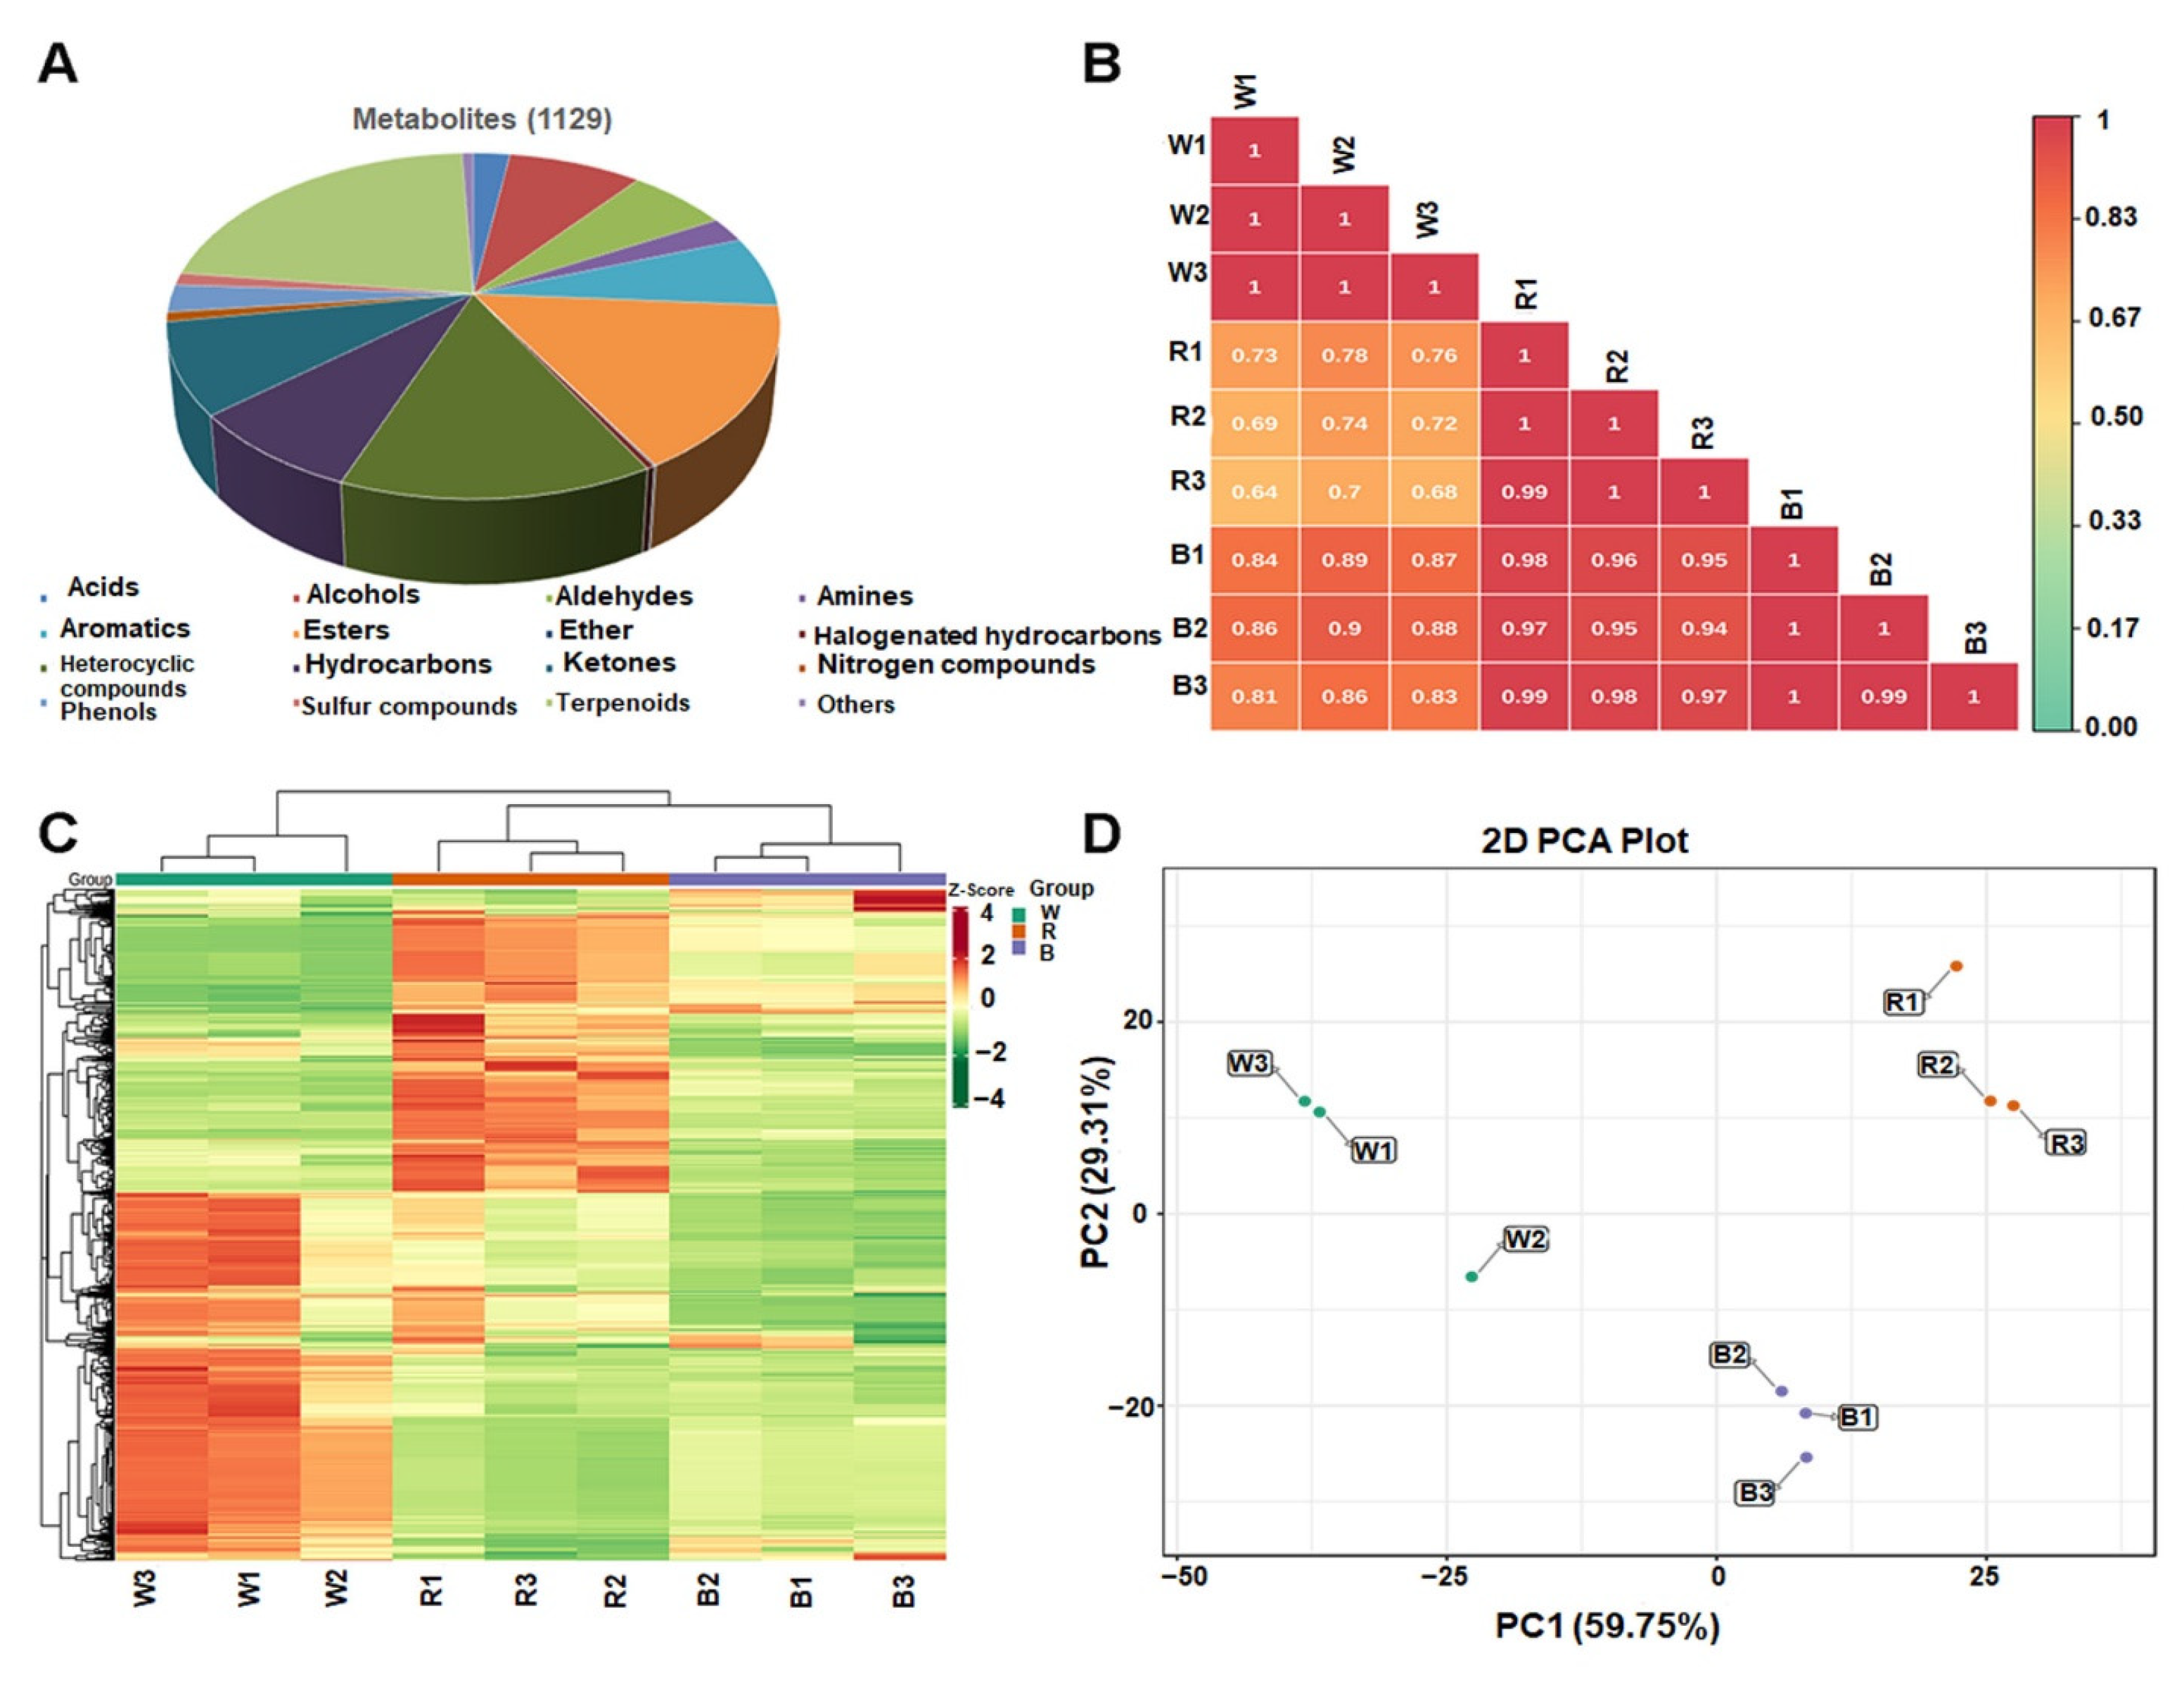
3.3. Metabolite Profiling of the Leaves via GC-MS

Basil is an aromatic plant containing many volatile organic compounds (VOCs) with important nutritional and medicinal values. To better understand the metabolic changes under different light qualities, VOCs of leaves from different samples were detected using GC-MS technology. A total of 1129 metabolites were identified in all samples, including 28 acids, 95 alcohols, 71 aldehydes, 27 amines, 75 aromatics, 174 esters, 1 ether, 4 halogenated hydrocarbons, 157 heterocyclic compounds, 90 hydrocarbons, 96 ketones, 10 nitrogen compounds, 29 phenols, 13 sulfur compounds, 251 terpenoids, and 8 others (Figure 4A, Table S1). The correlation analysis revealed that Pearson’s correlation coefficients of all biological replicates were greater than or equal to 0.99 (Figure 4B), and biological replicates were clustered together in the heatmap (Figure 4C), suggesting that there was good homogeneity between the biological replicates, and that the data were reliable. The metabolites were divided into different clusters with specific expression trends in each group (Figure 4C), and principal component analysis (PCA) showed that the three groups were obviously distinguished from one another (Figure 4D). Hence, the above results indicate that different light qualities caused distinct metabolite profiles in basil.

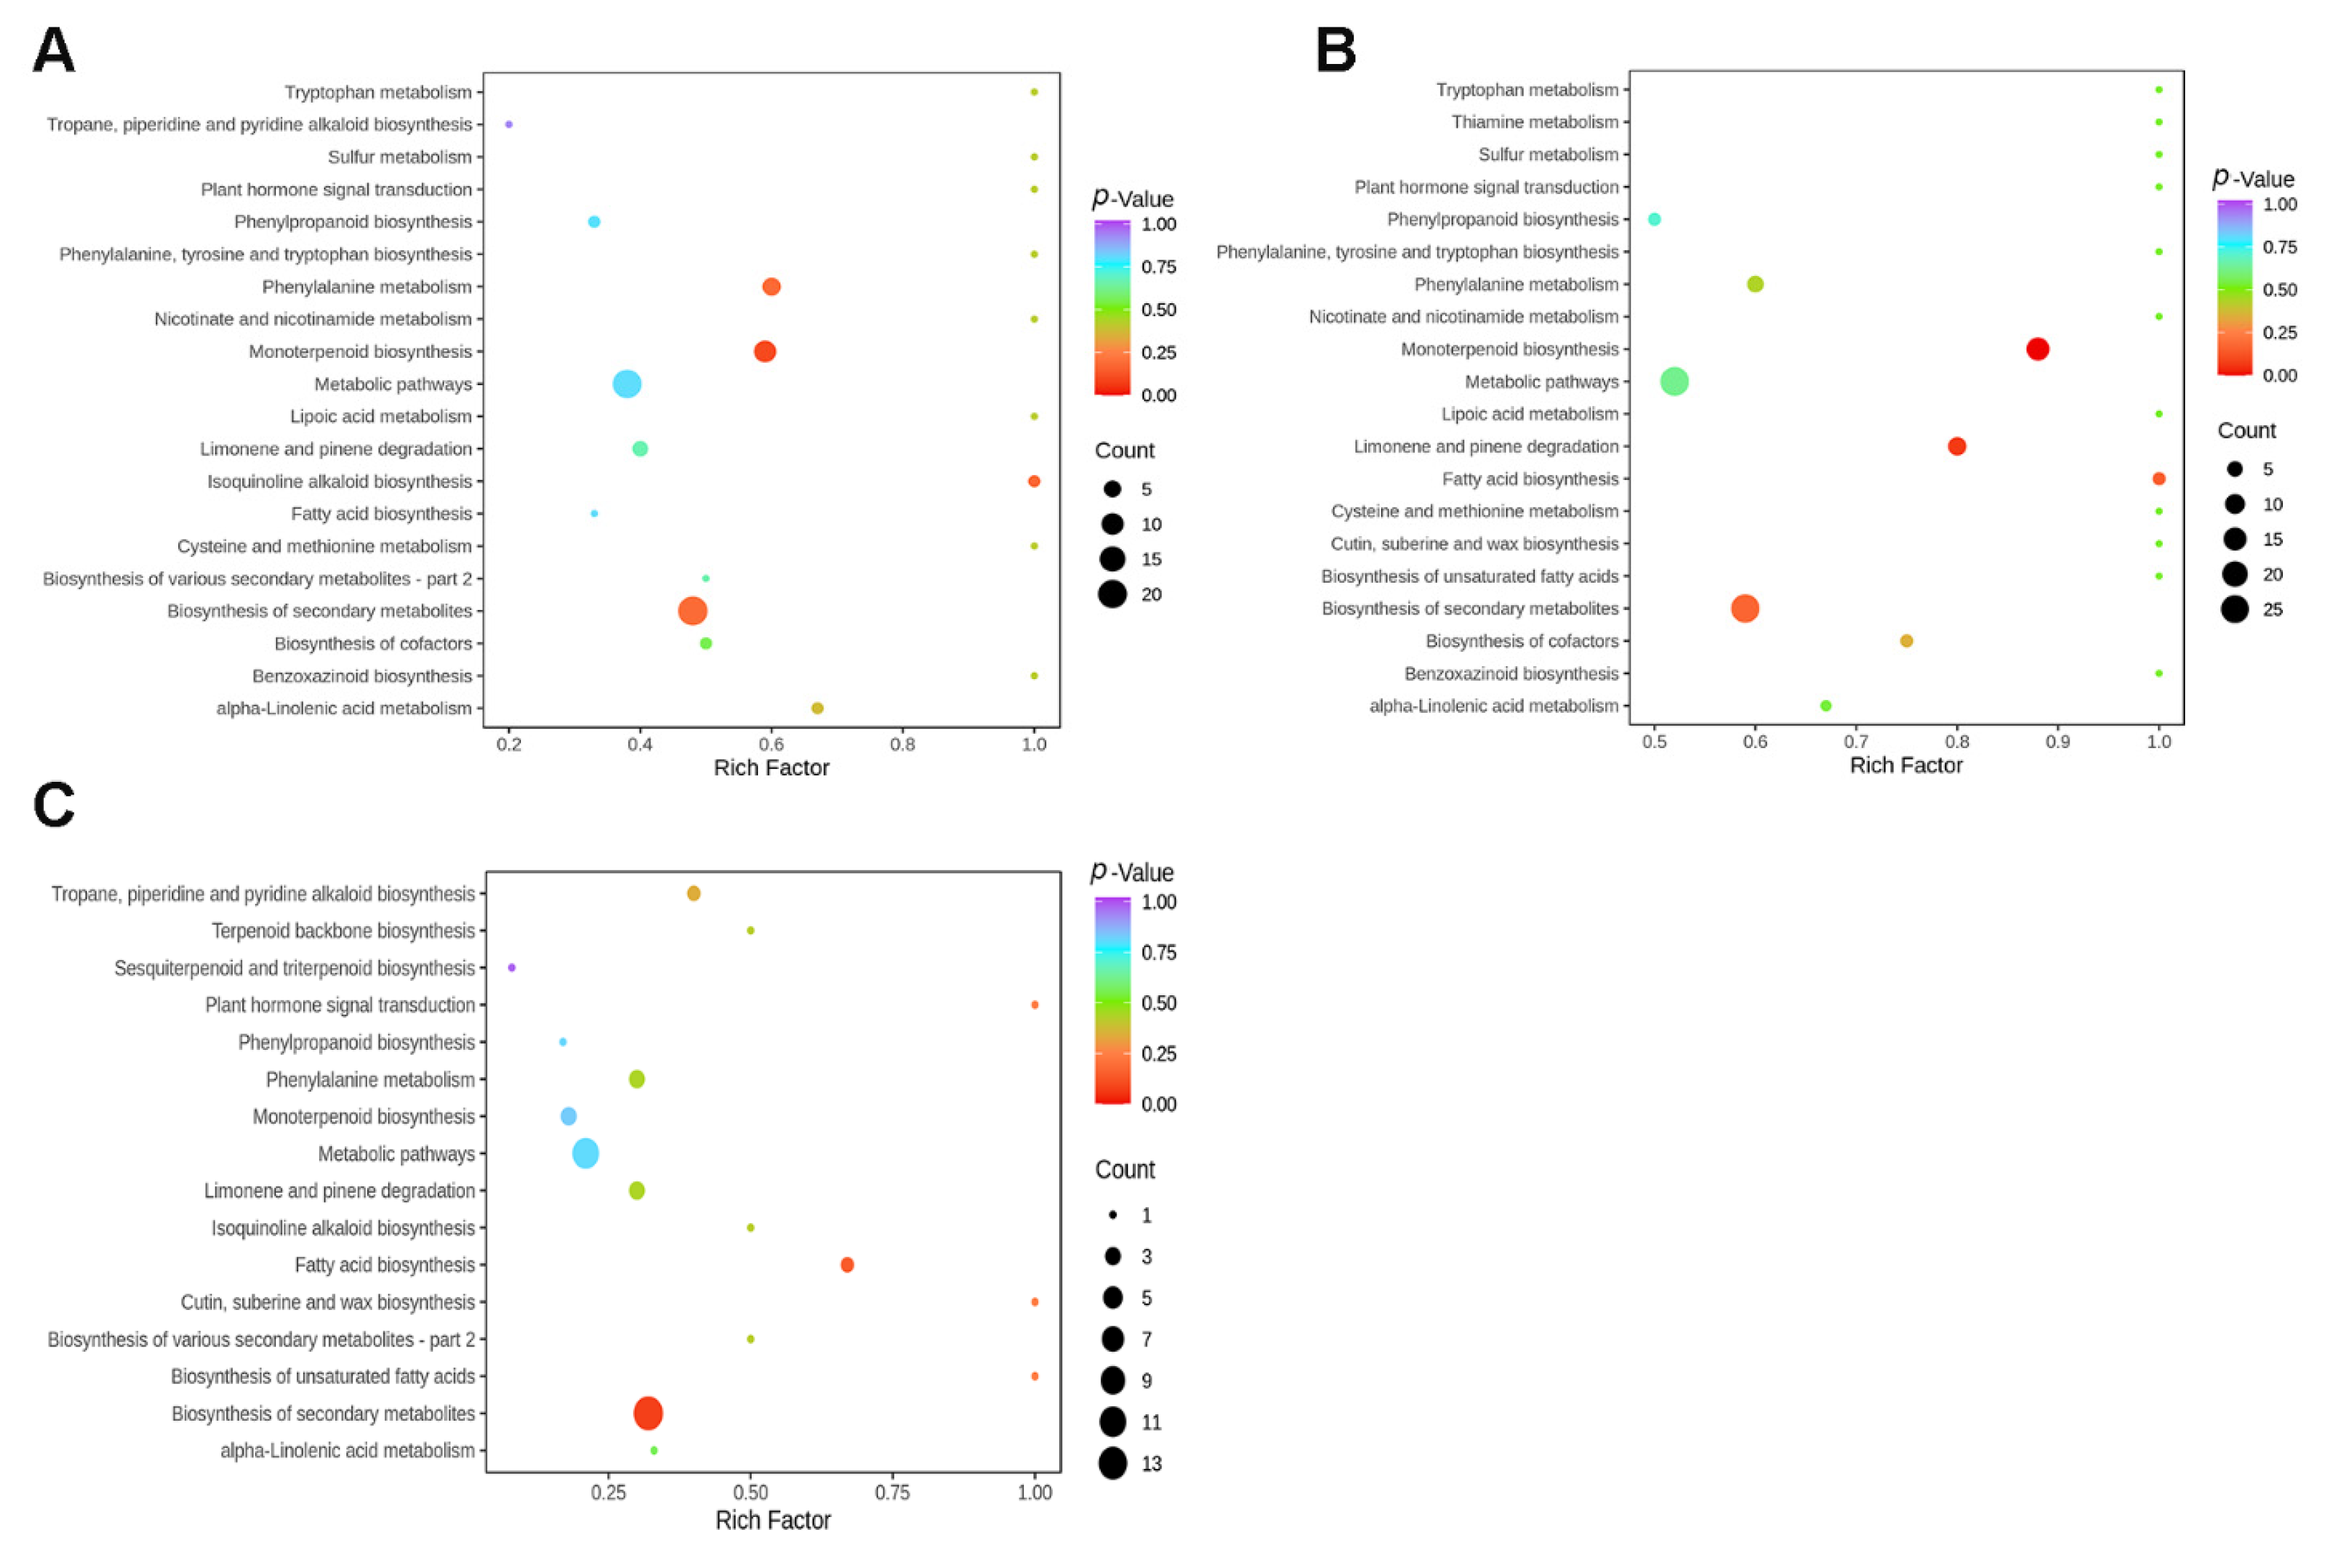
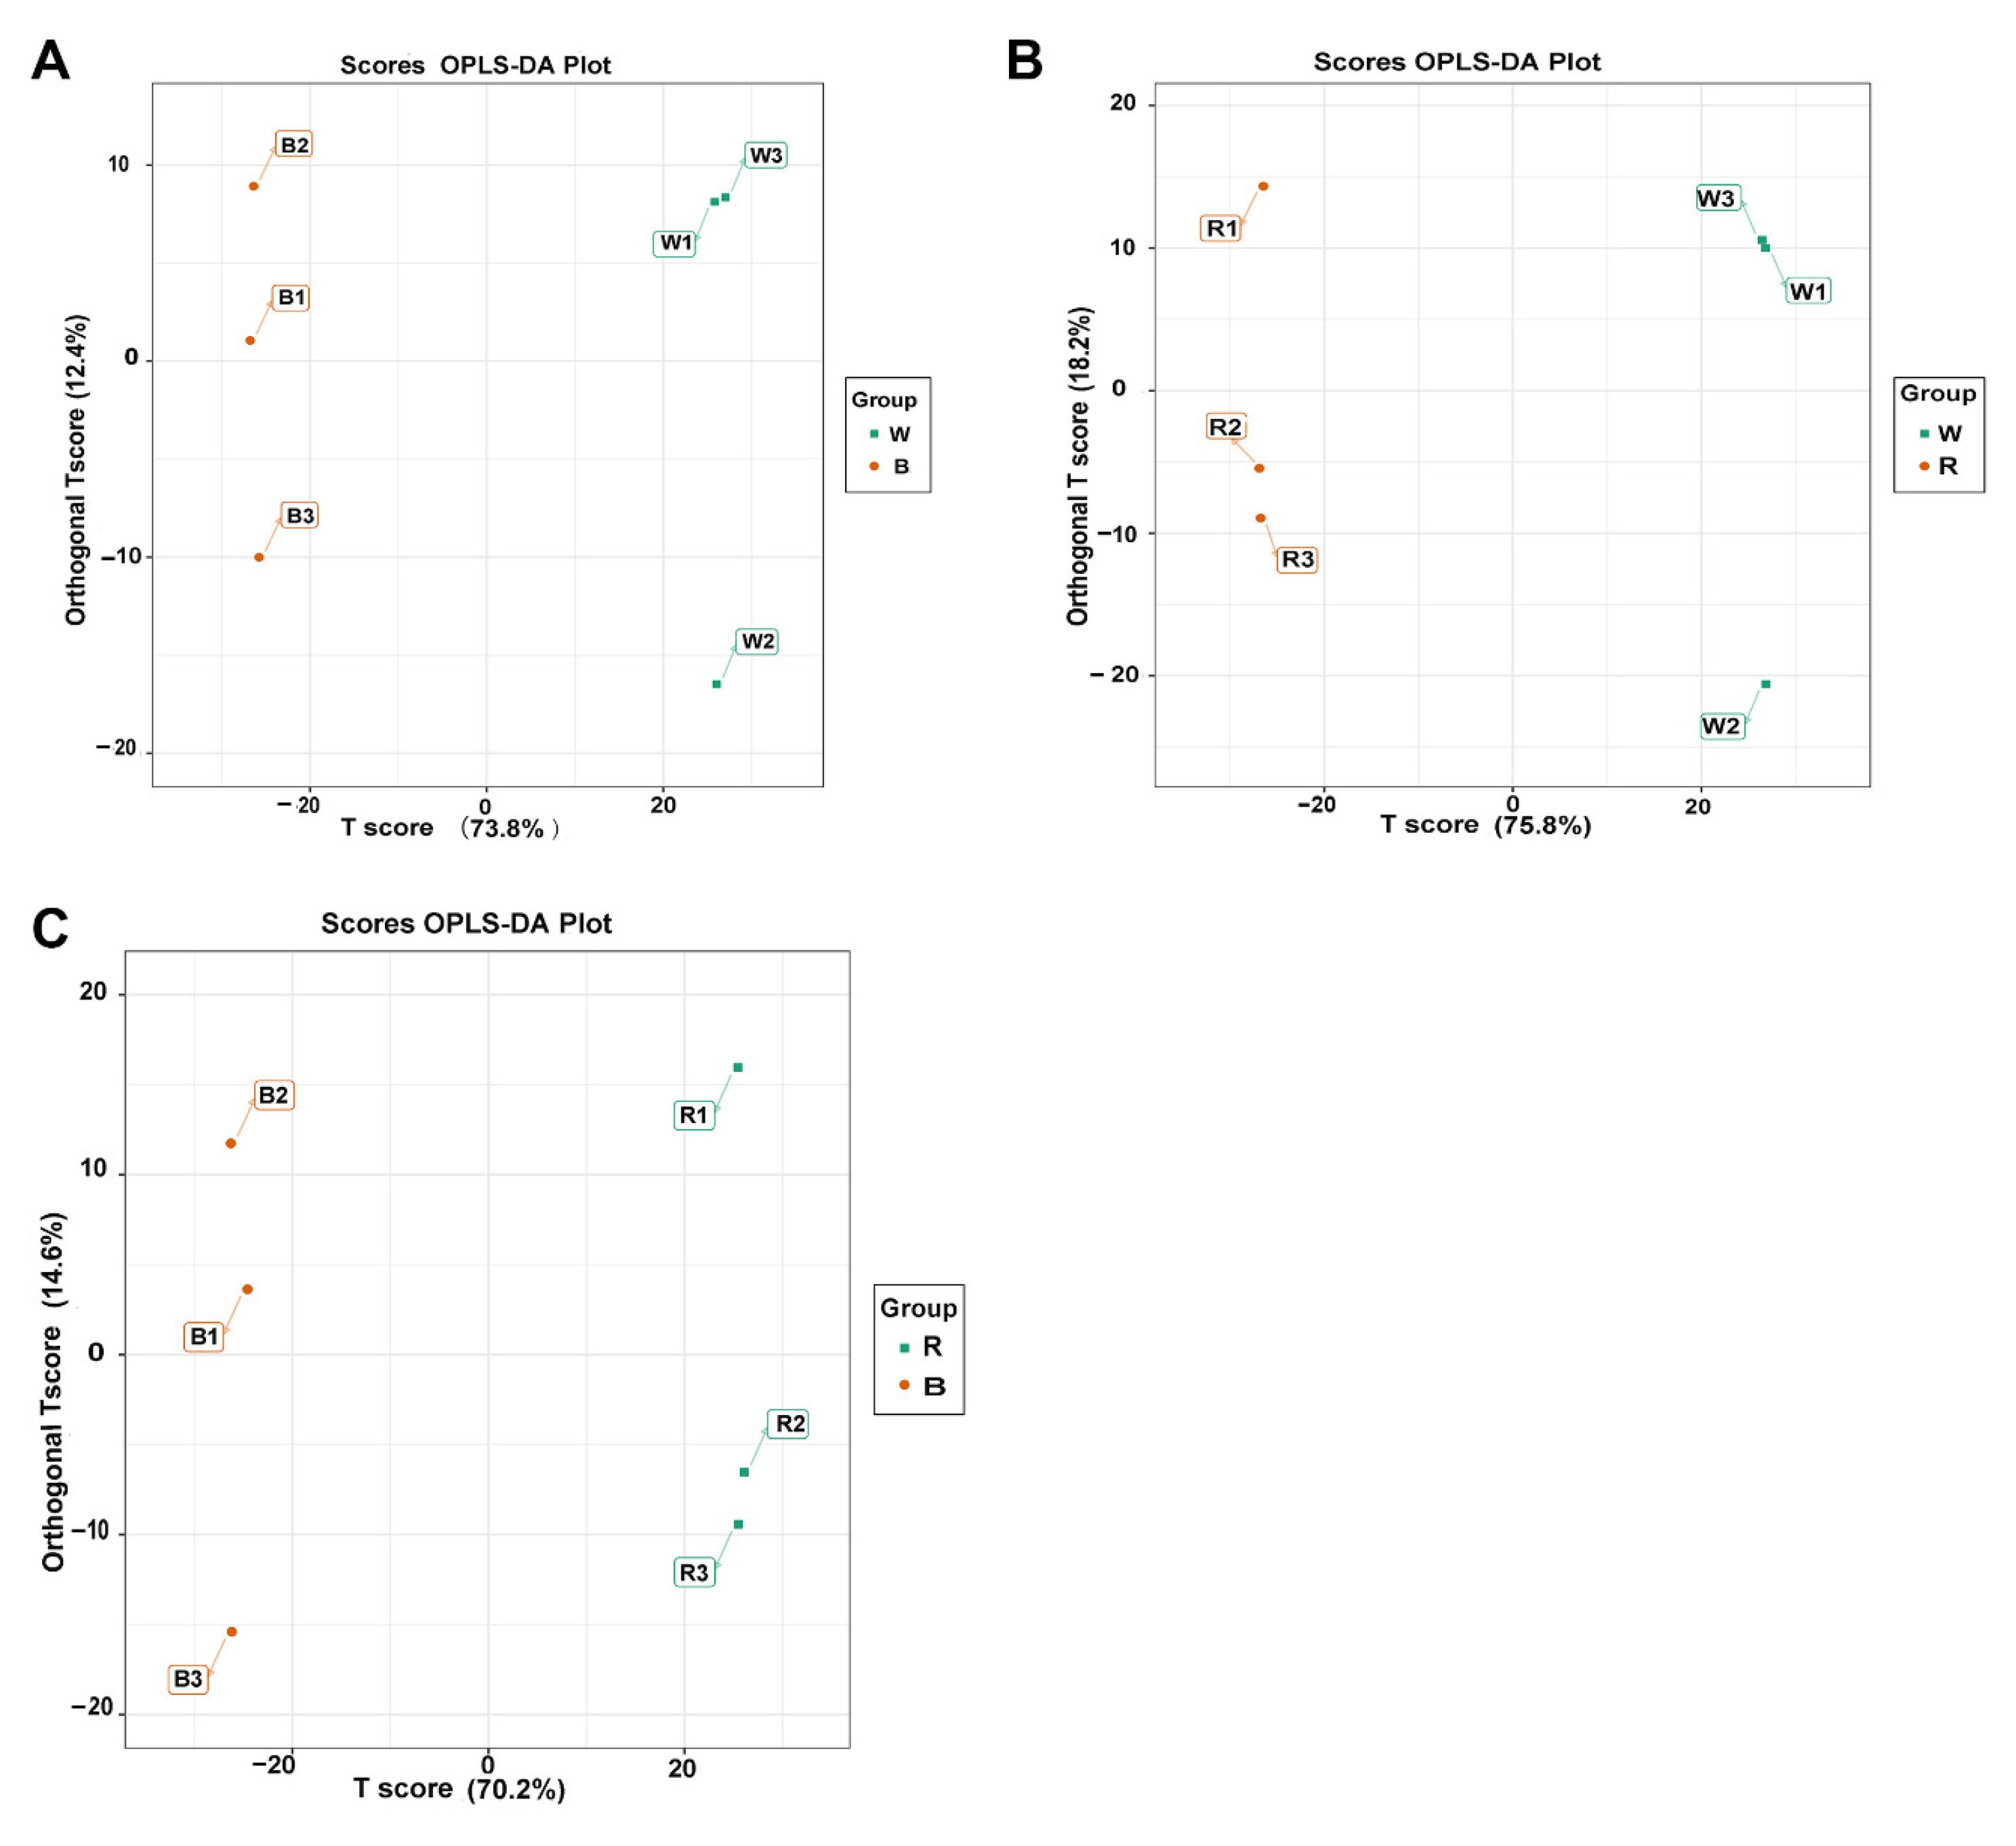
3.4. Pathway Enrichment Analysis of Differentially Accumulated Metabolites (DAMs)

As a multivariate statistical analysis method, orthogonal partial least squares discriminant analysis (OPLS-DA) can maximize group differentiation, which is helpful for finding differentially expressed metabolites. As shown in Figure 5, pairwise comparisons were obtained based on the OPLS-DA model, and distinct metabolic differentiations were observed between three groups. Q2 is an important parameter for evaluating the model in OPLS-DA. The differences between W and R (R2X = 0.758, R2Y = 0.982, Q2 = 0.964), W and B (R2X = 0.738, R2Y = 0.975, Q2 = 0.957), and B and R (R2X = 0.702, R2Y = 0.993, Q2 = 0.979) are shown in Figure S2. All Q2 values in the three comparison groups were greater than 0.9, demonstrating that these models were meaningful. Then, the variable importance in projection (VIP) values of the OPLS-DA model and the fold change (FC) were combined to further screen the DAMs. An identification criterion of FC ≥ 2 or ≤0.5 together with VIP ≥ 1.0 was used to screen DAMs between the comparison groups. The screening results are shown in Supplementary Table S2. There were 491 DAMs between the W and B groups (322 downregulated, 169 upregulated), 630 DAMs between the W and R groups (288 downregulated, 342 upregulated), and 285 DAMs between the R and B groups (227 downregulated, 58 upregulated). The DAMs were divided into seven subgroups with different numbers using k-means cluster analysis (Figure S3). Thus, it can be concluded that the DAMs responded to specific light quality in unique ways.
Furthermore, the DAMs from each comparison group were annotated using the Kyoto Encyclopedia of Genes and Genomes (KEGG) database. Most noteworthy, the DAMs were predominantly enriched in some overlapped KEGG pathways in the W vs. B, W vs. B, and B vs. R comparison groups, including the biosynthesis of secondary metabolites, monoterpenoid biosynthesis, phenylalanine metabolism, plant hormone signal transduction, limonene and pinene degradation, etc. (Figure 6).

3.5. Annotation of Transcripts and Differentially Expressed Genes (DEGs)

To investigate the global transcriptomic profile related to light quality responses in basil leaves, RNA-Seq analysis was carried out. A total of nine cDNA libraries were constructed from the W, B, and R groups. The cDNA sequencing generated 4.39–6.52 million raw reads and 4.24–6.32 million clean reads for each library. Approximately 97.97% of Q20, 94.18% of Q30, and 49.69% of GC contents were obtained for each library after filtering, which indicated that the RNA-Seq data were of high quality. Subsequently, 202,967 unigenes were produced by de novo transcriptome assembly, with a mean length of 1104 bp, an N50 length of 1623 bp, and an N90 length of 500 bp. Functional annotation analysis revealed that unigenes could be successfully annotated in at least one of the seven databases, including the COG, GO, KEGG, Swiss-Prot, NR, NT, and Pfam databases. Moreover, species distribution analysis showed that 42.19% of the unigenes were homologous with the sequence of Sesamum indicum, and 22.03%, 13.22%, and 2.91% of the unigenes were homologous with the sequences of Handroanthus impetiginosus, Erythranthe guttata, and Olea europaea var. sylvestris, respectively. FPKM values were used to estimate the gene expression levels. Pearson’s correlation coefficients and PCA analysis showed high reproducibility among the biological replicates (Figure S4), suggesting that these sequencing data were reliable for differential gene expression.

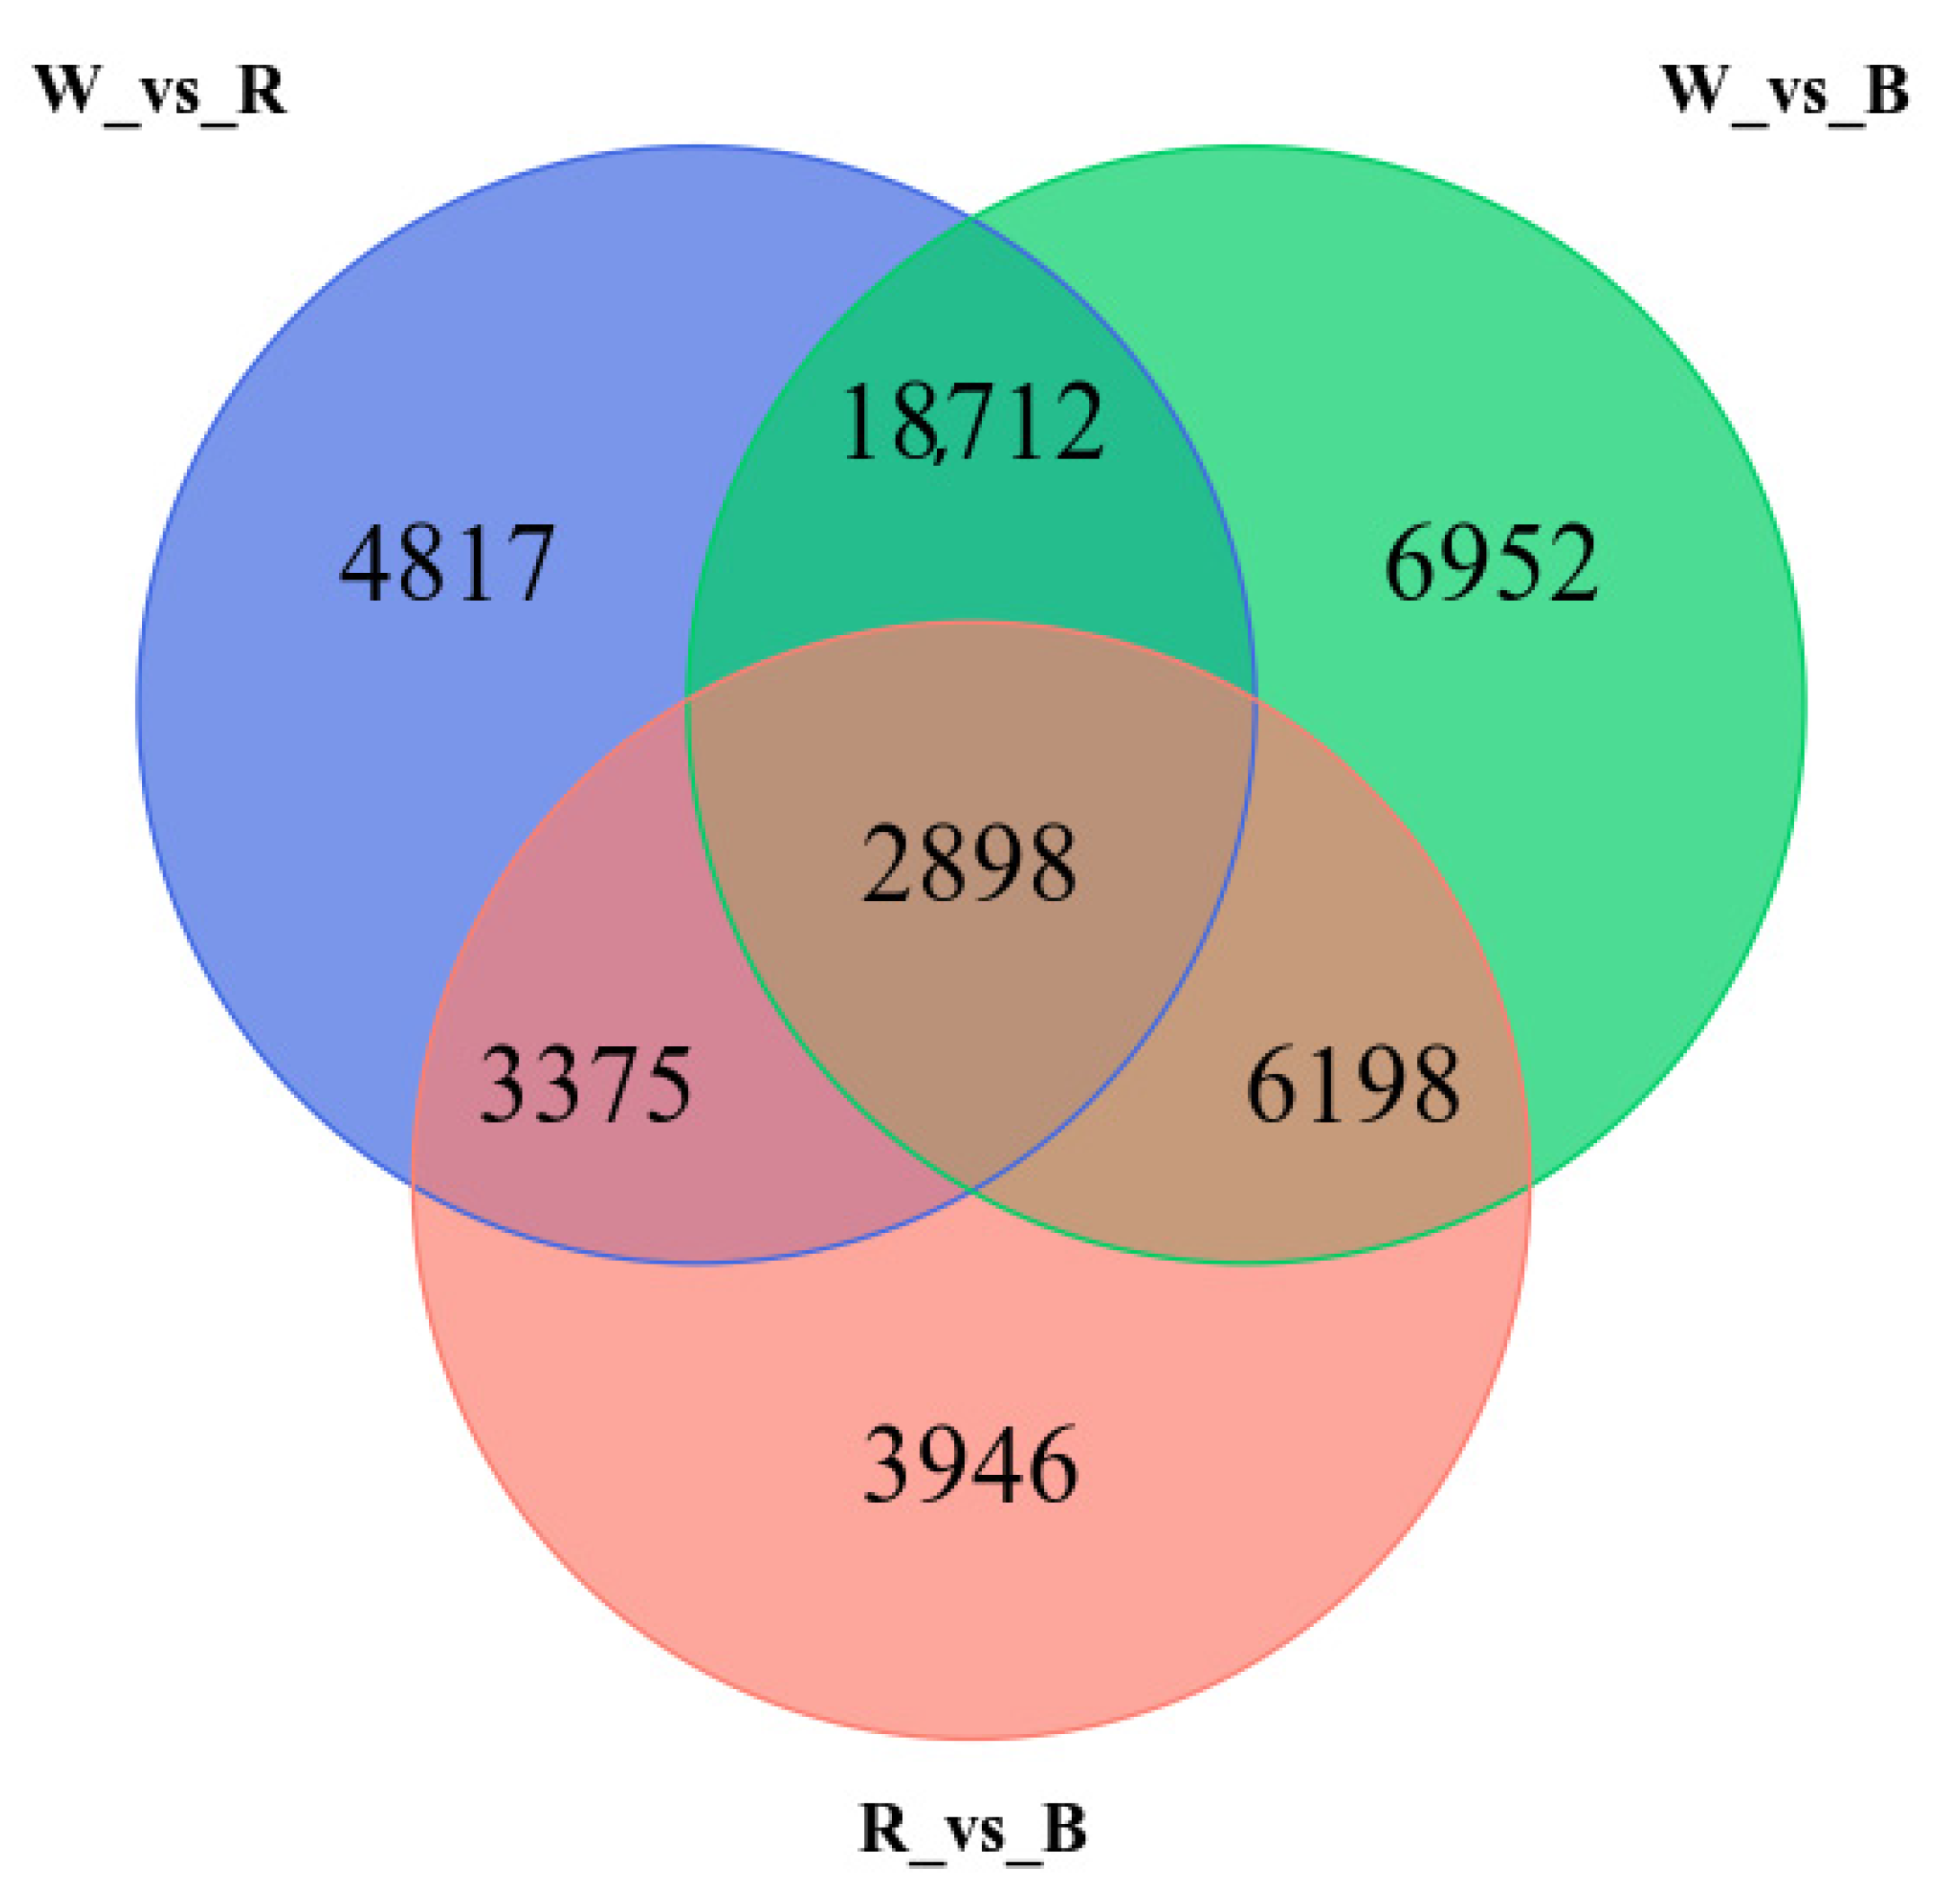
3.6. Dynamic Transcriptome Analysis in Response to Light Spectra

With the stand of |log2(fold change)| >  1 and FDR (false discovery rate) <  0.05, differentially expressed genes (DEGs) between the three comparison groups (W vs. R, W vs. B, and R vs. B) were screened. The results showed that 29,802 DEGs were detected in the W vs. R group, including 9690 downregulated DEGs and 20,112 upregulated DEGs. The W vs. B group showed the highest level of DEGs, at 34,760, of which 23,725 were upregulated and 11,035 were downregulated. For the R vs. B group, there were 16,417 DEGs, comprising 9189 upregulated and 7228 downregulated genes. Interestingly, 2898 common DEGs were detected in all three comparison groups, while the most specific DEGs (6952) were found in the W vs. B group (Figure 7).
In order to study the expression patterns of genes under different light spectra, the FPKMs of all different genes were normalized using the R language, and then k-means cluster analysis was performed. The expression patterns of genes in the W vs. B, W vs. R, and B vs. R groups could be divided into five subclasses (Figure S5, Table S3). In subclass 1 and subclass 4, the gene expression was highest under blue light and lowest under white light. In contrast, the gene expression was lowest under blue light and highest under white light in subclass 3. In subclass 2, a total of 3716 genes were expressed most highly under white light, followed by blue and red light. The 7530 genes in subclass 5 showed the highest expression under red light and the lowest under white light. In summary, the expression of DEGs was induced by different light spectra in specific ways.

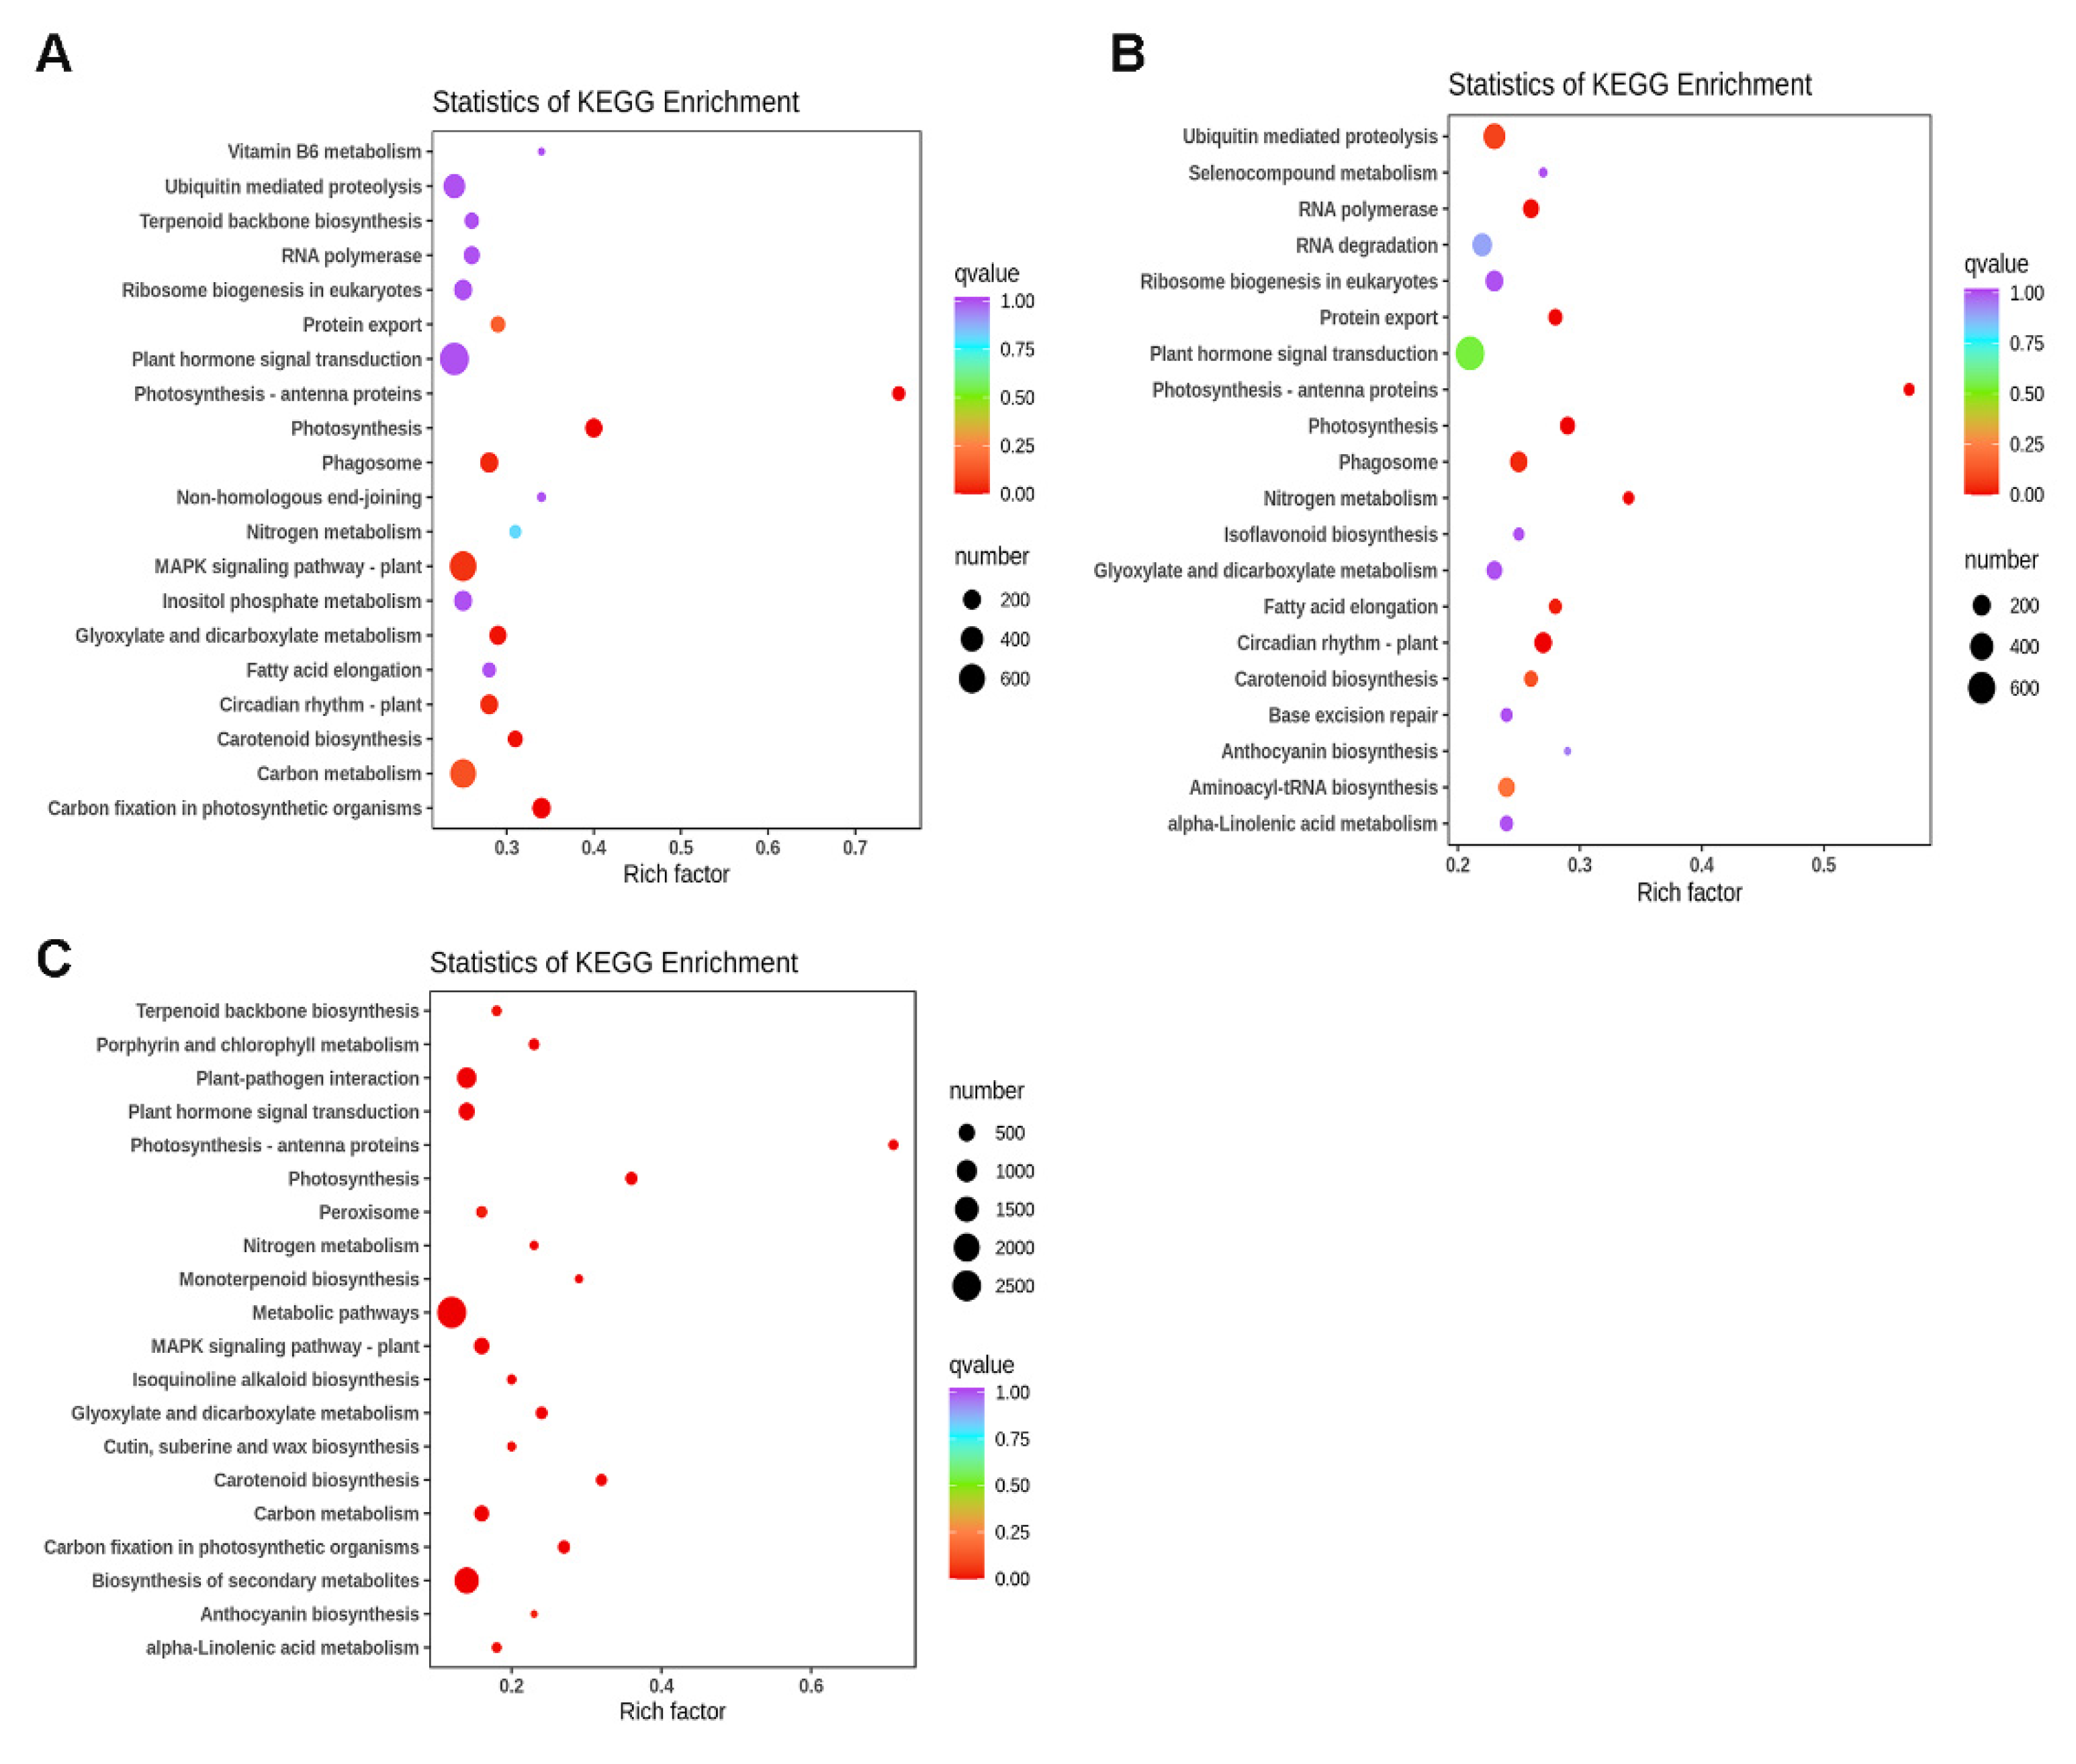
3.7. GO and KEGG Pathway Enrichment Analysis of DEGs

The DEGs were enriched in three GO categories: biological process, cellular component, and molecular function. In the W vs. B group, the top 50 most significantly enriched GO terms were as displayed in Figure S6A, among which the DEGs annotated in the biological process category mainly include the aminoglycan biosynthetic process, carbon fixation, cellular response to alkaline pH, cellular response to light intensity, and another 30 GO terms; the DEGs in the cellular component category contained photosystem, photosystem I, photosystem II, and plastoglobule; and the DEGs in the molecular function category involved adenosyl homocysteinase activity, chlorophyll binding, gibberellin binding, histone acetyltransferase activity, etc. The top 50 most significantly enriched GO terms in the W vs. R group are shown in Figure S6B; 28 biological process terms were most enriched, including mucilage extrusion from seed coats, negative regulation of anion channel activity, negative regulation of anion-channel activity by blue light, and negative regulation of anion transport; the DEGs in the cellular component category included amyloplast, DNA packaging complex, nucleosome, and another four terms; the DEGs in the molecular function category consisted of 15 terms, including 3−oxo−arachidoyl−CoA synthase activity, 3−oxo−cerotoyl−CoA synthase activity, adenosyl homocysteinase activity, trialkyl sulfonium hydrolase activity, etc. In the B vs. R group, 31 biological process terms, 11 cellular component terms, and 8 molecular function terms were enriched in the top 50 GO terms (Figure S6).
KEGG pathway enrichment analysis was performed to uncover the specific metabolic pathways that the DEGs participated in. In the W vs. B pair, the top 20 enriched pathways were mainly involved in carbon fixation in photosynthetic organisms, carbon metabolism, plant hormone signal transduction, MAPK signaling pathway–plant, terpenoid backbone biosynthesis, fatty acid elongation, etc. (Figure 8A). Pathways such as circadian rhythm–plant, aminoacyl-tRNA biosynthesis, selenocompound metabolism, isoflavonoid biosynthesis, and ubiquitin-mediated proteolysis were significantly enriched in the W vs. R group (Figure 8B). The top 20 enriched pathways in the B vs. R group are displayed in Figure 8C, including biosynthesis of secondary metabolites, metabolic pathways, plant–pathogen interaction, alpha-linolenic acid metabolism, and 16 other pathways.

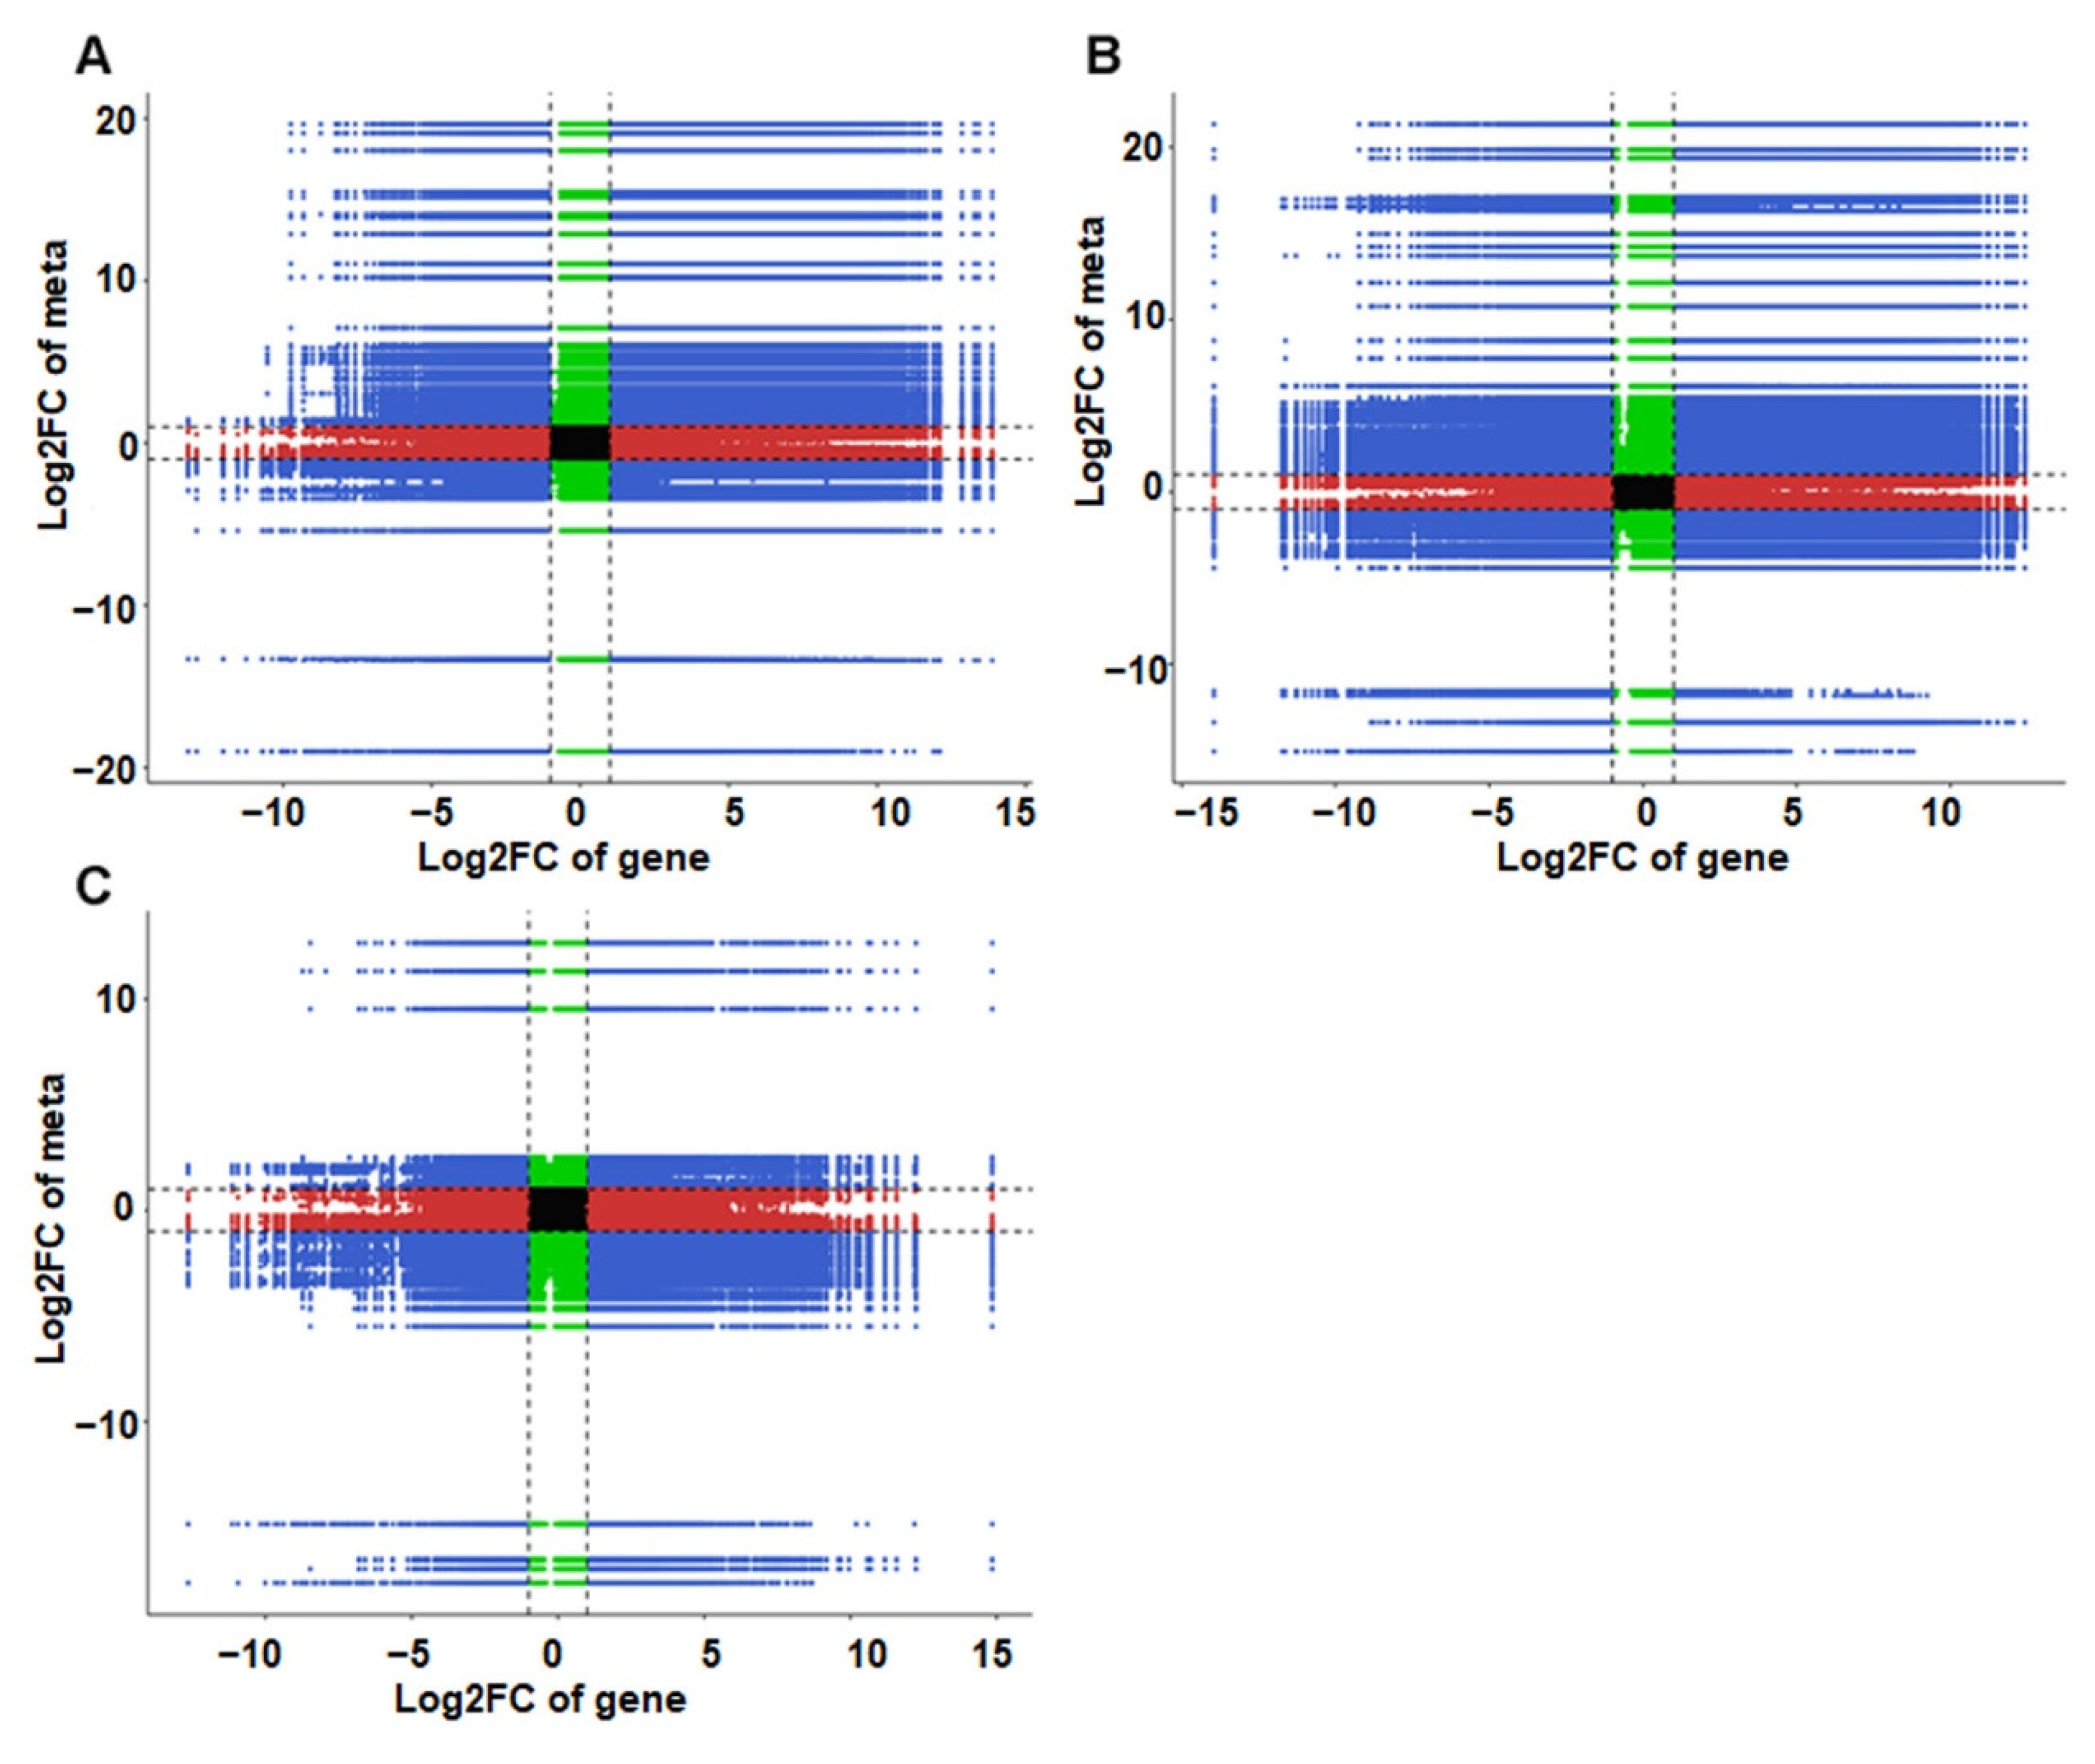
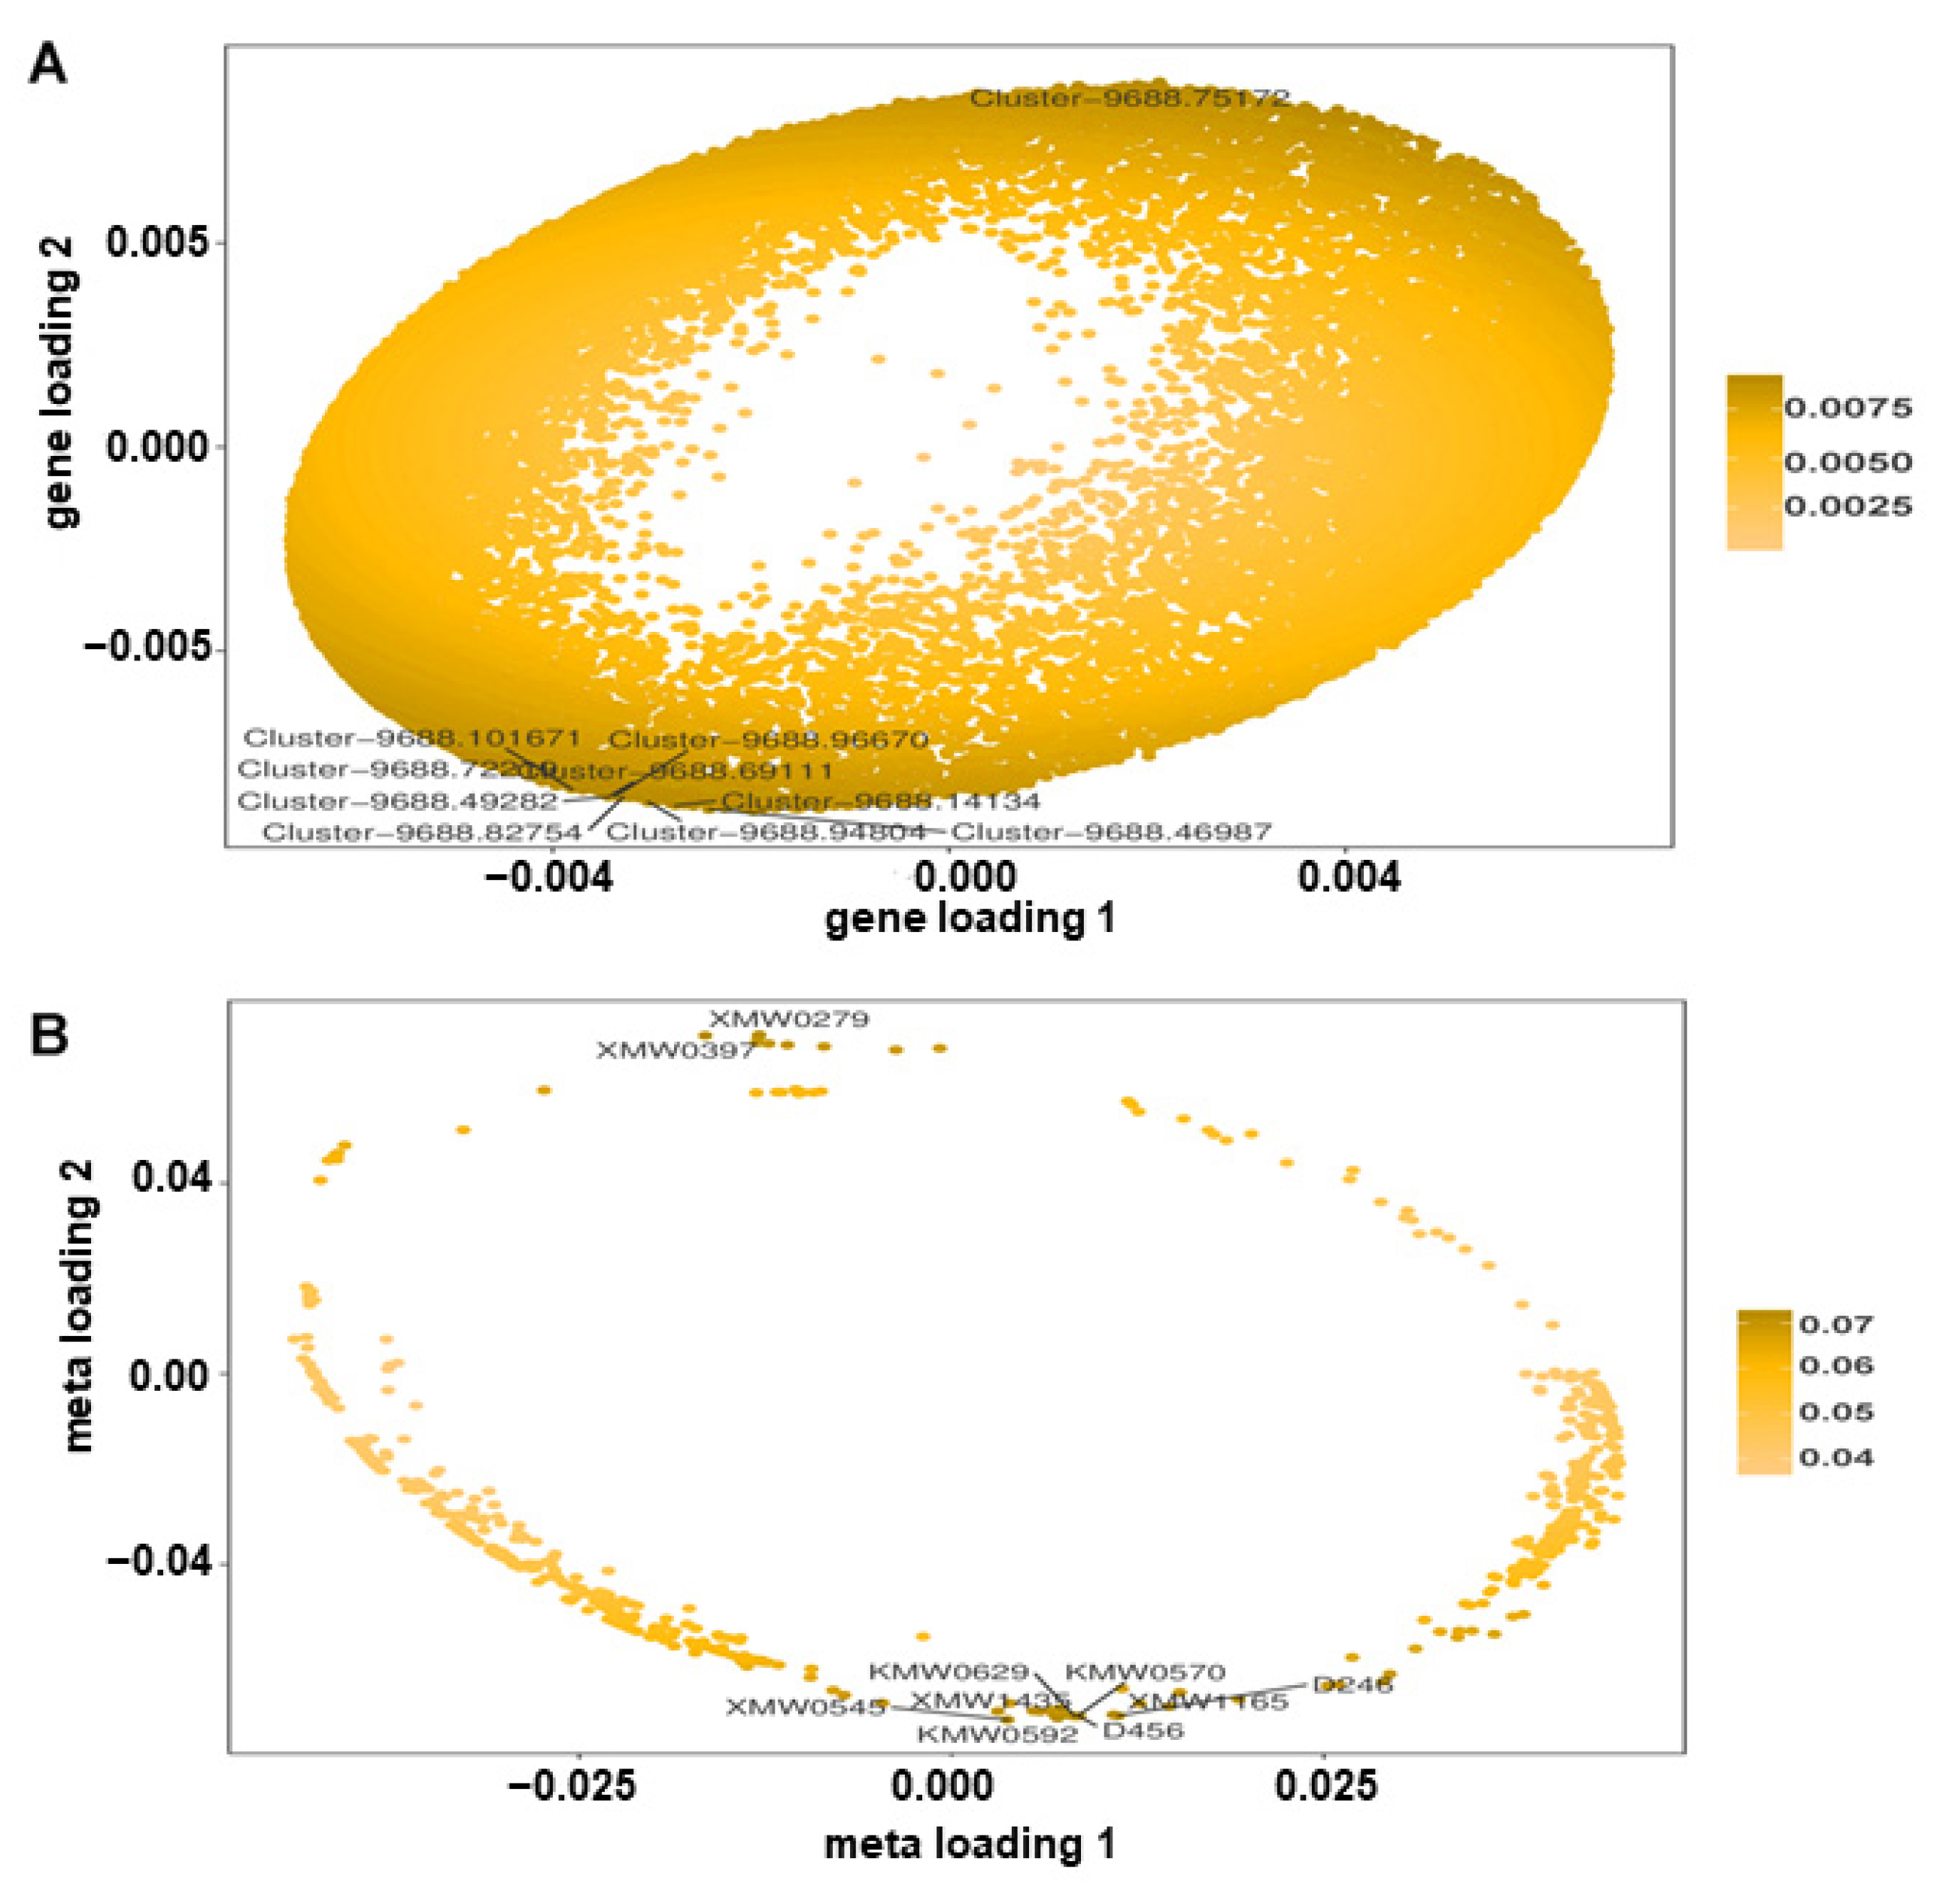
3.8. Association Analysis of DAMs and DEGs

Based on Pearson’s correlation coefficients (PCCs) between the DEGs and DAMs, nine quadrant diagrams were constructed to reveal the variations in metabolites and their corresponding genes. The DEGs and DAMs in quadrants 3 and 7 had positive correlations, while the DEGs and DAMs in quadrants 1 and 9 had negative correlations (Figure 9). Additionally, the DEGs and DAMs were annotated to the KEGG pathway database to determine their common biological pathways. These significantly changed pathways in all of the comparison groups mainly included metabolic pathways, biosynthesis of secondary metabolites, phenylalanine metabolism, limonene and pinene degradation, and monoterpenoid biosynthesis (Figure S7). Interestingly, compared with the W vs. B group, more common pathways were enriched in the W vs. R group (Figure S7), suggesting that red light affects more pathways at the transcriptional and metabolic levels.
In addition, an O2PLS model was generated to determine the relationships between the DEGs and DAMs, which could be used to screen important variables from one set of data that influence the other. In the gene loading, 7 genes localized to chloroplasts were among the top 10 DEGs (Figure 10A), including carbonic anhydrase (Cluster-9688.94804), hydroxy-3-methylbut-2-enyl diphosphate reductase (Cluster-9688.72219), phosphoglycolate phosphatase 1A (Cluster-9688.101671), sugar partition-affecting protein (Cluster-9688.46987), WAT1-related protein (Cluster-9688.69111), PsbQ (Cluster-9688.96670) and plastid transcriptionally active 16 (Cluster-9688.82754), suggesting their importance in regulating metabolites. The top 10 DAMs displayed in Figure 10B, such as (2-bromoethyl)-oxirane (XMW0397), undecanoic acid (KMW0592), 1-dodecanol (KMW0629) and E-1-methoxy-4-hexene (XMW0279), were most closely associated with the DEGs.

4. Discussion

4.1. Changes in the Physiology and Antioxidant Capacity of Leaf Extracts

As an important environmental factor, light quality plays irreplaceable roles in the growth and development of plants. Uncovering the mechanisms of plants in response to light quality is beneficial for developing crop improvement strategies. Red and blue light are generally considered to be the most efficient wavelengths to drive photosynthesis [10]. We found that the photosynthetic rate of basil increased significantly under blue light and decreased under red light compared to white light (Figure 2). At the same time, the stomatal conductance (Gs) under blue light was the largest, followed by white light and red light, indicating that the change in photosynthesis may be caused by stomatal opening, which is consistent with the findings of previous studies [38,39,40]. In addition, as one of the most important pigments in plants, chlorophyll is essential for capturing light for photosynthesis, which plays key roles in the interaction with light during the whole growth cycle of the plant. Many studies have revealed that light quality affects photosynthesis by changing the content and composition of chlorophyll. In some plants, including Cattleya loddigesii and Triticum aestivum, the chlorophyll content was highest under red light compared to other light [41].However, blue light was more effective than red light in promoting chlorophyll accumulation in lettuce, Anoectochilus roxburghii, and Toona sinensis [41,42]. Herein, we also found that blue light stimulated chlorophyll accumulation in basil more significantly than the other two types of light, which may further facilitate the light harvesting capacity to improve photosynthesis.
Light spectra affect plants’ morphogenesis. For example, blue light significantly inhibited apples’ plant growth and leaf extension, while red light treatment promoted apples’ plant growth and root development [43]. In tomatoes, compared to white light, early photomorphogenesis was strongly promoted by red light and inhibited by blue light [44]. Conversely, it was found that blue light could promote plant growth and leaf extension better than red light in some species, such as Petunia, Chrysanthemum, and Cucumber [45,46,47], and similar phenotypes were found in our study, suggesting that red and blue light have unique effects on different plants. Plant hormones mediate various aspects of plants’ growth and development, and some hormonal pathways are often influenced by light to regulate the developmental changes [48,49,50]. We found that 688, 783, and 465 genes involved in plant hormone signal transduction were differentially expressed in the W vs. R, W vs. B, and B vs. R groups, respectively (Figure 10). The altered expression patterns of plants’ hormone signals may give rise to morphological changes in basil under different light quality conditions.
In addition to physiological and morphological changes, light spectra can also affect the synthesis of metabolites in herbs, thus modifying their biological activities. Blue LED irradiation increased the DPPH scavenging capacity of baby leaf lettuce and improved its antioxidant properties [51], and callus cultures of Rhodiola imbricata grown under blue light also displayed the highest antioxidant activity compared to other light conditions [52]. Consistently, in this study, antioxidant capacities—especially DPPH and ABTS scavenging activities—were significantly promoted by blue light and inhibited by red light. As the most abundant pigments in nature, chlorophylls and carotenoids are very potent natural antioxidants, which may be used for a range of health benefits in humans [53,54]. Sgherri et al. (2011) found that chlorophylls contributed about 40% to the bulk of the fast lipophilic antioxidants in basil extracts, whereas carotenoids could be ascribable to the slow antioxidant activity [55]. Since more chlorophylls and carotenoids were accumulated under blue light, and fewer under red light (Figure 1D), it can be inferred that the antioxidant activity of basil may be associated with these pigments’ contents.

4.2. Involvement of Key Metabolites in Response to Light Spectra

Due to its unique and pleasant aroma, volatile organic compounds (VOCs) of basils grown under different light spectra qualities were identified using GC-MS/MS analysis. A total of 1129 metabolites belonging to 16 classes were identified in all samples (Table S1), among which the terpenoids contained a maximum of 251 species and accounted for about 22%. To the best of our knowledge, previous studies have not identified so many VOCs in basil (O. basilicum Linn. var. pilosum (Willd.) Benth.) [33,56], and this study will therefore facilitate our understanding of the chemical components of basil. Furthermore, DAMs were screened to uncover the effects of light spectra on metabolites. All of the DAMs in the three comparison groups were mainly enriched in many of the same KEGG pathways, such as biosynthesis of secondary metabolites, monoterpenoid biosynthesis, phenylalanine metabolism, plant hormone signal transduction, limonene and pinene degradation, etc. (Figure 5), suggesting that both red and blue light have significant effects on these pathways. The k-means cluster analysis showed that all of the DAMs could be classified into seven subclasses with different numbers (Figure S3, Table S4). In subclasses 1, 2, and 7, the contents of 373 metabolites were highest under white light. In subclasses 4, 5, and 6, the contents of 378 metabolites were highest under red light. Interestingly, the highest accumulation of 35 metabolites in subclass 3 was observed under blue light. Taken together, it can be seen that metabolites respond to different light qualities in specific ways.
The top 10 most significant DAMs in each comparison group are listed in Figure 10. Among them, a total of seven significantly upregulated common metabolites were found in both the W vs. R and W vs. B groups, including debrisoquine, butanoic acid, 4-hexenyl ester, propanoic acid, 2-methyl-,phenylmethyl ester, (Z)-, (1aR,7R,7aR,7bS)-(+)-1a,2,3,5,6,7,7a,7b-Octahydro-1,1,7,7a-tetramethyl-1H-cyclopropa [a] naphthalen -3-one, ethyl tridecanoate, and 1H-pyrrolo [2,3-b]pyridine, 2-(1-methylethyl)-, 7-(2-hydroxypropan-2-yl)-1,4a-dimethyldecahydronaphthalen-1-ol, which indicated that both red and blue light significantly promoted the accumulation of these metabolites. Similarly, 2-octanone, 3-octanone, and 5-hexenal,4-methylene- were three common metabolites among the top ten most significantly downregulated in both the W vs. R and W vs. B groups, suggesting that the accumulation of these metabolites was seriously inhibited under both red and blue light. In terms of the R vs. B group, the top 10 most upregulated metabolites included cyclohexanecarboxylic acid, methyl ester, oleic acid, 2,6-piperidinedione, 3-ethyl-,2-hexenal, (E)-, and another 6 metabolites; it is worth noting that cyclohexanecarboxylic acid, methyl ester, oleic acid, and 3-octanol were among the top 10 most downregulated metabolites in the W vs. R group, indicating that these three key metabolites accumulated significantly under white and blue light but not under red light. The top 10 most downregulated metabolites in the R vs. B group consisted of iso-3-thujyl acetate, ketone, methyl 2,4,5-trimethylpyrrol-3-yl, fenchyl acetate, furfuryl pentanoate, pyrazine, 2,3-dimethyl-5-(1-methylpropyl)-, and another 5 metabolites; among them, 10-undecenal, (2E,4Z)-2,4-decadienal, and 3-cyclohexene-1-ethanol, beta.,4-dimethyl- were also included in the top 10 most upregulated metabolites in the W vs. R group, revealing that the accumulation of these three key metabolites was significantly strengthened by red light. Overall, these key metabolites could be used as the characteristic metabolites to distinguish the response of basil to blue, red, and white light.

4.3. Key Genes Associated with the Light Response in Basil

The phenotypic alterations induced by light are always accompanied by changes in gene expression; transcriptional regulation has emerged as an important regulation mode in organisms. In our transcriptomic data, DEGs with different quantities between the three comparison groups were identified, which were further enriched in many KEGG pathways (Figure 9). Transcription factors are central regulators of transcriptional reprogramming, and many transcription factors, such as HY5 and PIFs, have been proven to participate in light responses [57,58,59]. We found that a total of 2133 TFs were differentially expressed in the W vs. B group (Table S5), which included 586 downregulated genes and 1547 upregulated genes. In the W vs. R group, 1771 TFs were differentially expressed, including AP2/ERF (98), WRKY (76), bHLH (83), C3H (83), SNF2 (65), GRAS (65), C2H2 (62), and others. It was worth noting that the DEGs with the greatest influence on DAMs were screened using an O2PLS model. Interestingly, the top 10 DEGs closely associated with DAMs were screened (Figure 10), including 7 chloroplast localization genes, such as carbonic anhydrase (Cluster-9688.94804) and plastid transcriptionally active 16 (Cluster-9688.82754). Collectively, all of these DEGs could be associated with light signal pathways, and their specific regulatory mechanisms await further investigation through genetic modification combined with molecular biology experiments in future studies.

5. Conclusions

In this study, the response mechanisms of basil (O. basilicum Linn. var. pilosum (Willd.) Benth.) to blue and red light were revealed through physiological changes and multi-omics analysis. The physiological results demonstrated that blue and red light have different effects on photomorphogenesis by changing plants’ height, leaf size, and branch number. Metabolomic and transcriptomic analyses showed that the DAMs and DEGs were annotated to common biological pathways such as metabolic pathways, biosynthesis of secondary metabolites, phenylalanine metabolism, limonene and pinene degradation, and monoterpenoid biosynthesis. These results contribute to understanding the mechanisms of plants’ response to light spectra, which may also be useful in the cultivation of crops.

Supplementary Materials

The following supporting information can be downloaded at: https://www.mdpi.com/article/10.3390/horticulturae9111172/s1, Figure S1: Measurement of chlorophyll fluorescence parameters: (A) Maximum photochemical efficiency of PSII, Fv/Fm. (B) The actual photochemical efficiency of PSII, ΦPSII. (C) The actual photochemical efficiency of PSI, ΦPSI. The data are shown as the mean ± SD (n = 3), and different letters indicate significant differences between the data at p < 0.05. Figure S2: Evaluation parameters of the OLPS-DA model: (A) Comparison groups of W vs. B. (B) Comparison groups of W vs. R. (C) Comparison groups of B vs. R. Figure S3: K-means cluster analysis of DEGs. Figure S4: Statistical analysis of transcriptome data: (A) Pearson’s correlation analysis between samples. (B) Principal component analysis (PCA) score plot. Figure S5: K-means cluster analysis of DEGs. Figure S6: GO enrichment analysis of all DEGs: (A) Comparison groups of W vs. B. (B) Comparison groups of W vs. R. (C) Comparison groups of B vs. R. Figure S7: Kyoto Encyclopedia of Genes and Genomes (KEGG) pathway classification of DAMs and DEGs in the comparison groups: (A) Comparison groups of W vs. B. (B) Comparison groups of W vs. R. (C) Comparison groups of B vs. R. Table S1: All metabolites identified in the samples. Table S2: DAMs in each comparison group. Table S3: DEGs in all k-means clusters. Table S4: DAMs in all k-means clusters. Table S5: Differentially expressed transcription factors.

Author Contributions

Q.W., F.D. and T.H. conceived the ideas and designed the methodology; R.Y. and J.D. collected the data; R.Y., D.L. and Y.J. analyzed the data; Q.W., F.D. and T.H. led the writing of the manuscript. All authors have read and agreed to the published version of the manuscript.

Funding

This research was funded by the Doctoral Research Project Foundation of Yan’an University (YAU202303794).

Data Availability Statement

Any data and codes used in this study are available upon request from the corresponding author.

Acknowledgments

Special thanks to Yan’an University for the financial support, and to the China Shaanxi Key Laboratory of Chinese Jujube for their help in the implementation of the experiment.

Conflicts of Interest

The authors declare that they have no conflict of interest.

References

  1. Deng, X.W.; Quail, P.H. Signalling in light-controlled development. Semin. Cell Dev. Biol. 1999, 10, 121–129. [Google Scholar] [CrossRef] [PubMed]
  2. Yadav, A.; Singh, D.; Lingwan, M.; Yadukrishnan, P.; Masakapalli, S.K.; Datta, S. Light signaling and UV-B-mediated plant growth regulation. J. Integr. Plant Biol. 2020, 62, 1270–1292. [Google Scholar] [CrossRef] [PubMed]
  3. Wang, J.; Lu, W.; Tong, Y.; Yang, Q. Leaf morphology, photosynthetic performance, chlorophyll fluorescence, stomatal development of lettuce (Lactuca Sativa L.) exposed to different ratios of red light to blue light. Front. Plant Sci. 2016, 7, 250. [Google Scholar] [CrossRef] [PubMed]
  4. Wei, L.; You, W.; Gong, Y.; El Hajjami, M.; Liang, W.; Xu, J.; Poetsch, A. Transcriptomic and proteomic choreography in response to light quality variation reveals key adaption mechanisms in marine Nannochloropsis oceanica. Sci. Total Environ. 2020, 720, 137667. [Google Scholar] [CrossRef]
  5. Suetsugu, N.; Wada, M. Evolution of three LOV blue light receptor families in green plants and photosynthetic stramenopiles: Phototropin, ZTL/FKF1/LKP2 and aureochrome. Plant Cell Physiol. 2013, 54, 8–23. [Google Scholar] [CrossRef]
  6. Jenkins, G.I. The UV-B photoreceptor UVR8: From structure to physiology. Plant Cell 2014, 26, 21–37. [Google Scholar] [CrossRef]
  7. Paik, I.; Huq, E. Plant photoreceptors: Multi-functional sensory proteins and their signaling networks. Semin. Cell Dev. Biol. 2019, 92, 114–121. [Google Scholar] [CrossRef]
  8. Chaves, I.; Pokorny, R.; Byrdin, M.; Hoang, N.; Ritz, T.; Brettel, K.; Essen, L.-O.; van der Horst, G.T.J.; Batschauer, A.; Ahmad, M. The cryptochromes: Blue light photoreceptors in plants and animals. Annu. Rev. Plant Biol. 2011, 62, 335–364. [Google Scholar] [CrossRef]
  9. Chen, M.; Chory, J. Phytochrome signaling mechanisms and the control of plant development. Trends Cell Biol. 2011, 21, 664–671. [Google Scholar] [CrossRef]
  10. Liu, J.; van Iersel, M.W. Photosynthetic physiology of blue, green, and red light: Light intensity effects and underlying mechanisms. Front. Plant Sci. 2021, 12, 619987. [Google Scholar] [CrossRef]
  11. Muneer, S.; Kim, E.J.; Park, J.S.; Lee, J.H. Influence of green, red and blue light emitting diodes on multiprotein complex proteins and photosynthetic activity under different light intensities in lettuce leaves (Lactuca Sativa L.). Int. J. Mol. Sci. 2014, 15, 4657–4670. [Google Scholar] [CrossRef] [PubMed]
  12. Shen, Z.; Xia, K.; Wu, Q.; Su, N.; Cui, J. Effects of light quality on the chloroplastic ultrastructure and photosynthetic characteristics of cucumber seedlings. Plant Growth Regul. 2014, 73, 227–235. [Google Scholar]
  13. Hoenecke, M.E.; Bula, R.J.; Tibbitts, T.W. Importance of “blue” photon levels for Lettuce seedlings grown under red-light-emitting diodes. HortScience 1992, 27, 427–430. [Google Scholar] [CrossRef]
  14. Goins, G.D.; Yorio, N.C.; Sanwo, M.M.; Brown, C.S. Photomorphogenesis, photosynthesis, and seed yield of wheat plants grown under red light-emitting diodes (LEDs) with and without supplemental blue lighting. J. Exp. Bot. 1997, 48, 1407–1413. [Google Scholar] [CrossRef] [PubMed]
  15. He, J.; Qin, L.; Chong, E.L.C.; Choong, T.-W.; Lee, S.K. Plant growth and photosynthetic characteristics of Mesembryanthemum crystallinum grown aeroponically under different blue- and red-LEDs. Front. Plant Sci. 2017, 8, 361. [Google Scholar] [CrossRef]
  16. Sergejeva, D.; Alsina, I.; Duma, M.; Dubova, L.; Berzina, K. Evaluation of different lighting sources on the growth and chemical composition of lettuce. Agron. Res. 2018, 16. [Google Scholar] [CrossRef]
  17. Shimizu, H.; Saito, Y.; Nakashima, H.; Miyasaka, J.; Ohdoi, K. Light environment optimization for lettuce growth in plant factory. IFAC Proc. Vol. 2011, 44, 605–609. [Google Scholar] [CrossRef]
  18. Kobayashi, K.; Amore, T.; Lazaro, M. Light-emitting diodes (LEDs) for miniature hydroponic lettuce. Opt. Photon. J. 2013, 3, 74–77. [Google Scholar] [CrossRef]
  19. Sæbø, A.; Krekling, T.; Appelgren, M. Appelgren light quality affects photosynthesis and leaf anatomy of birch plantlets in vitro. Plant Cell Tissue Organ Cult. 1995, 41, 177–185. [Google Scholar] [CrossRef]
  20. Miao, L.; Zhang, Y.; Yang, X.; Xiao, J.; Zhang, H.; Zhang, Z.; Wang, Y.; Jiang, G. Colored light-quality selective plastic films affect anthocyanin content, enzyme activities, and the expression of flavonoid genes in strawberry (Fragaria × Ananassa) Fruit. Food Chem. 2016, 207, 93–100. [Google Scholar] [CrossRef]
  21. Wang, C.; Qiu, H.; Chen, Y.; Xu, Y.; Shan, F.; Li, H.; Yan, C.; Ma, C. Red light regulates metabolic pathways of soybean hypocotyl elongation and thickening. Environ. Exp. Bot. 2022, 199, 104890. [Google Scholar] [CrossRef]
  22. Mao, P.; Li, Q.; Li, Y.; Xu, Y.; Yang, Q.; Bian, Z.; Wang, S.; He, L.; Xu, Z.; Zheng, Y.; et al. The beneficial functions of blue light supplementary on the biosynthesis of glucosinolates in pakchoi (Brassica Rapa L. ssp. Chinensis) under greenhouse conditions. Environ. Exp. Bot. 2022, 197, 104834. [Google Scholar] [CrossRef]
  23. Chen, X.; Cai, W.; Xia, J.; Yu, H.; Wang, Q.; Pang, F.; Zhao, M. Metabolomic and transcriptomic analyses reveal that blue light promotes chlorogenic scid synthesis in strawberry. J. Agric. Food Chem. 2020, 68, 12485–12492. [Google Scholar] [CrossRef] [PubMed]
  24. Hoffmann, A.M.; Noga, G.; Hunsche, M. High blue light improves acclimation and photosynthetic recovery of pepper plants exposed to UV stress. Environ. Exp. Bot. 2015, 109, 254–263. [Google Scholar] [CrossRef]
  25. Calderón Bravo, H.; Vera Céspedes, N.; Zura-Bravo, L.; Muñoz, L.A. Basil seeds as a novel food, source of nutrients and functional ingredients with beneficial properties: A review. Foods 2021, 10, 1467. [Google Scholar] [CrossRef]
  26. Srivastava, S.; Lal, R.K.; Maurya, R.; Mishra, A.; Yadav, A.K.; Pandey, G.; Rout, P.K.; Chanotiya, C.S. Chemical diversity of essential oil among basil genotypes (Ocimum Viride Willd.) across the years. Ind. Crops Prod. 2021, 173, 114153. [Google Scholar] [CrossRef]
  27. Prakash, P.; Gupta, N. Therapeutic uses of Ocimum sanctum Linn (Tulsi) with a note on eugenol and its pharmacological actions: A short review. Indian J. Physiol. Pharmacol. 2005, 49, 125–131. [Google Scholar]
  28. Ghasemzadeh, A.; Ashkani, S.; Baghdadi, A.; Pazoki, A.; Jaafar, H.Z.E.; Rahmat, A. Improvement in flavonoids and phenolic acids production and pharmaceutical quality of sweet basil (Ocimum Basilicum L.) by ultraviolet-B irradiation. Molecules 2016, 21, 1203. [Google Scholar] [CrossRef]
  29. Nazir, M.; Asad Ullah, M.; Mumtaz, S.; Siddiquah, A.; Shah, M.; Drouet, S.; Hano, C.; Abbasi, B.H. Interactive effect of melatonin and UV-C on phenylpropanoid metabolite production and antioxidant potential in callus cultures of purple basil (Ocimum Basilicum L. var.s Purpurascens). Molecules 2020, 25, 1072. [Google Scholar] [CrossRef]
  30. Nadeem, M.; Abbasi, B.H.; Younas, M.; Ahmad, W.; Zahir, A.; Hano, C. LED-enhanced biosynthesis of biologically active ingredients in callus cultures of Ocimum basilicum. J. Photochem. Photobiol. B. 2019, 190, 172–178. [Google Scholar] [CrossRef]
  31. Pennisi, G.; Blasioli, S.; Cellini, A.; Maia, L.; Crepaldi, A.; Braschi, I.; Spinelli, F.; Nicola, S.; Fernandez, J.A.; Stanghellini, C.; et al. Unraveling the role of red:blue LED lights on resource use efficiency and nutritional properties of indoor grown sweet basil. Front. Plant Sci. 2019, 10, 305. [Google Scholar] [CrossRef]
  32. Larsen, D.H.; Li, H.; Shrestha, S.; Verdonk, J.C.; Nicole, C.C.S.; Marcelis, L.F.M.; Woltering, E.J. Lack of blue light regulation of antioxidants and chilling tolerance in basil. Front. Plant Sci. 2022, 13, 852654. [Google Scholar] [CrossRef] [PubMed]
  33. Zhang, J.-W.; Li, S.-K.; Wu, W.-J. The main chemical composition and in vitro antifungal activity of the essential oils of Ocimum basilicum Linn. var. pilosum (Willd.) Benth. Molecules 2009, 14, 273–278. [Google Scholar] [CrossRef] [PubMed]
  34. Wu, Q.; Han, T.; Yang, L.; Wang, Q.; Zhao, Y.; Jiang, D.; Ruan, X. The essential roles of OsFtsH2 in developing the chloroplast of rice. BMC Plant Biol. 2021, 21, 445. [Google Scholar] [CrossRef] [PubMed]
  35. Wang, Y.; Zheng, P.-C.; Liu, P.-P.; Song, X.-W.; Guo, F.; Li, Y.-Y.; Ni, D.-J.; Jiang, C.-J. Novel insight into the role of withering process in characteristic flavor formation of teas using transcriptome analysis and metabolite profiling. Food Chem. 2019, 272, 313–322. [Google Scholar] [CrossRef] [PubMed]
  36. Wang, H.; Hua, J.; Yu, Q.; Li, J.; Wang, J.; Deng, Y.; Yuan, H.; Jiang, Y. Widely targeted metabolomic analysis reveals dynamic changes in non-volatile and volatile metabolites during green tea processing. Food Chem. 2021, 363, 130131. [Google Scholar] [CrossRef]
  37. Li, L.; Kong, Z.; Huan, X.; Liu, Y.; Liu, Y.; Wang, Q.; Liu, J.; Zhang, P.; Guo, Y.; Qin, P. Transcriptomics integrated with widely targeted metabolomics reveals the mechanism underlying grain color formation in wheat at the grain-filling stage. Front. Plant Sci. 2021, 12, 757750. [Google Scholar] [CrossRef] [PubMed]
  38. Eduardo, Z.; Jianxin, Z. Role of zeaxanthin in blue light photoreception and the modulation of light-CO2 interactions in guard cells. J. Exp. Bot. 1998, 49, 433–442. [Google Scholar]
  39. Sharkey, T.D.; Raschke, K. Effect of light quality on stomatal opening in leaves of Xanthium strumarium L. Plant Physiol. 1981, 68, 1170–1174. [Google Scholar] [CrossRef]
  40. Kinoshita, T.; Doi, M.; Suetsugu, N.; Kagawa, T.; Wada, M.; Shimazaki, K. Phot1 and phot2 mediate blue light regulation of stomatal opening. Nature 2001, 414, 656–660. [Google Scholar] [CrossRef]
  41. Liu, Y.; Wang, T.; Fang, S.; Zhou, M.; Qin, J. Responses of morphology, gas exchange, photochemical activity of photosystem II, and antioxidant balance in Cyclocarya paliurus to light spectra. Front. Plant Sci. 2018, 9, 1704. [Google Scholar] [CrossRef] [PubMed]
  42. Ye, S.; Shao, Q.; Xu, M.; Li, S.; Wu, M.; Tan, X.; Su, L. Effects of light quality on morphology, enzyme activities, and bioactive compound contents in Anoectochilus roxburghii. Front. Plant Sci. 2017, 8, 857. [Google Scholar] [CrossRef] [PubMed]
  43. Li, Z.; Chen, Q.; Xin, Y.; Mei, Z.; Gao, A.; Liu, W.; Yu, L.; Chen, X.; Chen, Z.; Wang, N. Analyses of the photosynthetic characteristics, chloroplast ultrastructure, and transcriptome of apple (Malus Domestica) grown under red and blue lights. BMC Plant Biol. 2021, 21, 483. [Google Scholar] [CrossRef]
  44. Izzo, L.G.; Mele, B.H.; Vitale, L.; Vitale, E.; Arena, C. The role of monochromatic red and blue light in tomato early photomorphogenesis and photosynthetic traits. Environ. Exp. Bot. 2020, 179, 104195. [Google Scholar] [CrossRef]
  45. Miao, Y.; Chen, Q.; Qu, M.; Gao, L.; Hou, L. Blue light alleviates “red Light syndrome” by regulating chloroplast ultrastructure, photosynthetic traits and nutrient accumulation in cucumber plants. Sci. Hortic. 2019, 257, 108680. [Google Scholar] [CrossRef]
  46. Zheng, L.; Van Labeke, M.-C. Chrysanthemum morphology, photosynthetic efficiency and antioxidant capacity are differentially modified by light quality. J. Plant Physiol. 2017, 213, 66–74. [Google Scholar] [CrossRef]
  47. Fukuda, N.; Ajima, C.; Yukawa, T.; Olsen, J.E. Antagonistic action of blue and red light on shoot elongation in petunia depends on gibberellin, but the effects on flowering are not generally linked to gibberellin. Environ. Exp. Bot. 2016, 121, 102–111. [Google Scholar] [CrossRef]
  48. Lau, O.S.; Deng, X.W. Plant hormone signaling lightens up: Integrators of light and hormones. Curr. Opin. Plant Biol. 2010, 13, 571–577. [Google Scholar] [CrossRef]
  49. Kurepin, L.V.; Emery, R.J.N.; Pharis, R.P.; Reid, D.M. Uncoupling light quality from light irradiance effects in helianthus annuus shoots: Putative roles for plant hormones in leaf and internode growth. J. Exp. Bot. 2007, 58, 2145–2157. [Google Scholar] [CrossRef]
  50. Kurepin, L.V.; Pharis, R.P. Light signaling and the phytohormonal regulation of shoot growth. Plant Sci. 2014, 229, 280–289. [Google Scholar] [CrossRef]
  51. Samuolienė, G.; Sirtautas, R.; Brazaitytė, A.; Duchovskis, P. LED lighting and seasonality effects antioxidant properties of baby leaf lettuce. Food Chem. 2012, 134, 1494–1499. [Google Scholar] [CrossRef]
  52. Kapoor, S.; Raghuvanshi, R.; Bhardwaj, P.; Sood, H.; Saxena, S.; Chaurasia, O.P. Influence of light quality on growth, secondary metabolites production and antioxidant activity in callus culture of Rhodiola imbricata. Edgew. J. Photochem. Photobiol. B 2018, 183, 258–265. [Google Scholar] [CrossRef]
  53. Lanfer-Marquez, U.M.; Barros, R.M.C.; Sinnecker, P. Antioxidant activity of chlorophylls and their derivatives. Food Res. Int. 2005, 38, 885–891. [Google Scholar] [CrossRef]
  54. Eggersdorfer, M.; Wyss, A. Carotenoids in human nutrition and health. Arch. Biochem. Biophys. 2018, 652, 18–26. [Google Scholar] [CrossRef] [PubMed]
  55. Sgherri, C.; Pinzino, C.; Navari-Izzo, F.; Izzo, R. Contribution of major lipophilic antioxidants to the antioxidant activity of basil extracts: An EPR study. J. Sci. Food Agric. 2011, 91, 1128–1134. [Google Scholar] [CrossRef] [PubMed]
  56. Qin, L.; Li, C.; Li, D.; Wang, J.; Yang, L.; Qu, A.; Wu, Q. Physiological, metabolic and transcriptional responses of basil (Ocimum basilicum Linn. var. pilosum (Willd.) Benth.) to heat stress. Agronomy 2022, 12, 1434. [Google Scholar]
  57. Xiao, Y.; Chu, L.; Zhang, Y.; Bian, Y.; Xiao, J.; Xu, D. HY5: A pivotal regulator of light-dependent development in higher plants. Front. Plant Sci. 2021, 12, 800989. [Google Scholar] [CrossRef]
  58. Fiorucci, A.-S.; Michaud, O.; Schmid-Siegert, E.; Trevisan, M.; Allenbach Petrolati, L.; Çaka Ince, Y.; Fankhauser, C. Shade suppresses wound-induced leaf repositioning through a mechanism involving PHYTOCHROME KINASE SUBSTRATE (PKS) genes. PLoS Genet. 2022, 18, e1010213. [Google Scholar] [CrossRef]
  59. Yang, Z.; Liu, B.; Su, J.; Liao, J.; Lin, C.; Oka, Y. Cryptochromes orchestrate transcription regulation of diverse blue light responses in plants. Photochem. Photobiol. 2017, 93, 112–127. [Google Scholar] [CrossRef]
Figure 1. Phenotypes of basil under blue and red light: (A) Shoot phenotype of the W, B, and R groups. (B) Root phenotype of the W, B, and R groups. (C) Fresh weight of leaves and stems. (D) Pigment content of plant leaves. W, white light; B, blue light; R, red light. Scale bar: 1 cm. The data are shown as the mean ± SD (n = 3), and different letters indicate significant differences between the data at p < 0.05.
Horticulturae 09 01172 g001
Figure 2. Measurement of photosynthetic parameters: (A) Pn, the net photosynthetic rate; (B) Gs, the stomatal conductance; (C) Ci, the intercellular CO2 concentration; (D) Tr, the transpiration rate. The data are shown as the mean ± SD (n = 3), and different letters indicate significant differences between the data at p < 0.05.
Horticulturae 09 01172 g002
Figure 3. Antioxidant potential of leaf extracts: (A) DPPH radical scavenging activity. (B) ABTS radical scavenging activity. (C) Hydroxyl radical scavenging activity. The data are shown as the mean ± SD (n = 3), and different letters indicate significant differences between the data at p < 0.05.
Horticulturae 09 01172 g003
Figure 4. Statistical analysis of metabolome data: (A) Classification of identified metabolites. (B) Pearson’s correlation analysis between samples. (C) Heatmap of the quantified identified metabolites. (D) Principal component analysis (PCA) score plot.
Horticulturae 09 01172 g004
Figure 5. The score plots of orthogonal projections to latent structures discriminant analysis (OPLS-DA) pairwise comparisons of differentially accumulated metabolites (DAMs): (A) Comparison groups of W vs. B. (B) Comparison groups of W vs. R. (C) Comparison groups of B vs. R.
Horticulturae 09 01172 g005
Figure 6. Kyoto Encyclopedia of Genes and Genomes (KEGG) pathway classification of DAMs in the comparison groups: (A) Comparison groups of W vs. B. (B) Comparison groups of W vs. R. (C) Comparison groups of B vs. R.
Horticulturae 09 01172 g006
Figure 7. Venn diagram showing the overlapping and unique differentially expressed genes (DEGs) amongst the three comparison groups (W vs. R, W vs. B, and R vs. B).
Horticulturae 09 01172 g007
Figure 8. KEGG enrichment analysis of all DEGs: (A) Comparison groups of W vs. B. (B) Comparison groups of W vs. R. (C) Comparison groups of B vs. R.
Horticulturae 09 01172 g008
Figure 9. Quadrant diagram representing the association of transcriptomic and metabolomic variations in the W vs. B (A), W vs. R (B), and B vs. R (C) groups. The black dashed line indicates the difference threshold. Outside the threshold line, there are significant differences in genes/metabolites, while inside the threshold line the genes/metabolites are unchanged. Each dot represents a gene/metabolite. Black dots represent invariant genes/metabolites, green dots represent differentially accumulated metabolites with unchanged genes, red dots represent differentially expressed genes with unchanged metabolites, and blue dots represent both differentially expressed genes and differentially accumulated metabolites.
Horticulturae 09 01172 g009
Figure 10. Integration analysis of metabolome and transcriptome by O2PLS: (A) The top 10 genes with transcriptomes strongly influencing the metabolome. (B) The top 10 metabolites substantially affecting the transcriptome.
Horticulturae 09 01172 g010
Disclaimer/Publisher’s Note: The statements, opinions and data contained in all publications are solely those of the individual author(s) and contributor(s) and not of MDPI and/or the editor(s). MDPI and/or the editor(s) disclaim responsibility for any injury to people or property resulting from any ideas, methods, instructions or products referred to in the content.

