Article

Utilization of the Fusion of Ground-Space Remote Sensing Data for Canopy Nitrogen Content Inversion in Apple Orchards

1
College of Resources and Environment, Shandong Agricultural University, Tai’an 271018, China
2
National Engineering Research Center for Efficient Utilization of Soil and Fertilizer Resources, Tai’an 271018, China
3
College of Horticulture Science and Engineering, Shandong Agricultural University, National Apple Engineering and Technology Research Center, Tai’an 271018, China
*
Author to whom correspondence should be addressed.
Horticulturae 2023, 9(10), 1085; https://doi.org/10.3390/horticulturae9101085
Submission received: 24 August 2023 / Revised: 22 September 2023 / Accepted: 25 September 2023 / Published: 29 September 2023

Abstract

:
Utilizing multi-source remote sensing data fusion to achieve efficient and accurate monitoring of crop nitrogen content is crucial for precise crop management. In this study, an effective integrated method for inverting nitrogen content in apple orchard canopies was proposed based on the fusion of ground-space remote sensing data. Firstly, ground hyper-spectral data, unmanned aerial vehicles (UAVs) multi-spectral data, and apple leaf samples were collected from the apple tree canopy. Secondly, the canopy spectral information was extracted, and the hyper-spectral and UAV multi-spectral data were fused using the Convolution Calculation of the Spectral Response Function (SRF-CC). Based on the raw and simulated data, the spectral feature parameters were constructed and screened, and the canopy abundance parameters were constructed using simulated multi-spectral data. Thirdly, a variety of machine-learning models were constructed and verified to identify the optimal inversion model for spatially inverting the canopy nitrogen content (CNC) in apple orchards. The results demonstrated that SRF-CC was an effective method for the fusion of ground-space remote sensing data, and the fitting degree (R2) of raw and simulated data in all bands was higher than 0.70; the absolute values of the correlation coefficients (|R|) between each spectral index and the CNC increased to 0.55–0.68 after data fusion. The XGBoost model established based on the simulated data and canopy abundance parameters was the optimal model for the CNC inversion (R2 = 0.759, RMSE = 0.098, RPD = 1.855), and the distribution of the CNC obtained from the inversion was more consistent with the actual distribution. The findings of this study can provide the theoretical basis and technical support for efficient and non-destructive monitoring of canopy nutrient status in apple orchards.

1. Introduction

Nitrogen is an essential element required for the growth and development of apples. Rapid, non-destructive, and accurate monitoring of canopy nitrogen in apple orchards has important practical significance for achieving precise fertilization and scientific management of orchards. Remote sensing technology has gradually replaced the traditional experimental measurement method [1] as an imperative means of quantitative monitoring of CNC due to its superiority of real-time, non-destructive, and dynamic monitoring. However, each sensor has limitations that need to be overcome [2], and it is difficult for a single remote sensing system to simultaneously meet the requirements of rapid rate, large-scale, and high-precision CNC monitoring. Therefore, it is still challenging to integrate remote sensing data from multiple sources to realize accurate inversion of CNC.
The application of hyper-spectral data provides the most valuable information for ground monitoring, through the extraction and combination of characteristic variables of spectral reflectance [3,4], the accurate prediction of CNC can be realized [5,6]. However, the discrete ground data can only meet the research requirements of single fruit trees, and cannot realize the spatial remote sensing inversion of CNC. The emergence of spatial remote sensing platforms makes it possible for the spatial remote sensing inversion of CNC [7]. Unmanned aerial vehicles (UAVs) can collect spectral images with high spatial resolution in orchards. Based on UAV remote sensing data, the CNC inversion research was carried out, and the results showed that the CNC inversion results were different at different growth stages [8]. Satellite remote sensing data cover a wide range of space and can be used for CNC inversion in a wide range [9]. However, due to the mutual restriction of spatial and temporal resolution and the influence of weather and other factors, it is easy to lead to poor imaging quality and affect the accuracy of spatial inversion. Nowadays, the question of how to fuse ground-based remote sensing data with a high spectral resolution and space remote sensing data with a wide observation range and strong continuity in order to realize the accurate inversion of CNC at the orchard scale deserves further exploration.
Some studies have found that the fusion of ground-space remote sensing data can novel significantly improve the accuracy of remote sensing inversion [10,11,12]. There are two main aspects that affect the inversion accuracy: first, the selection of data fusion method, and second, the construction of the inversion model. The Ratio-Mean Correction Method [13] is one of the commonly used methods for remote sensing data fusion. The reflectance of the corresponding bands of ground and satellite data was used to correct the Sentinel-2A image, and the soil salt content can be successfully inverted [14,15]. However, the average reflectance does not adequately capture the non-uniform relationship between the data due to spectral differences. Non-negative Matrix Factorization (NMF) has been widely used in ground-space remote sensing data fusion to obtain high-quality fusion data by selecting the local spatial details of the data in the feature space dimension [16,17,18]. However, this method has a long training time, the factorization result is not unique, and the factorization process can be performed only when all elements in the matrix are non-negative. The Stepwise Multi-Sensor Fusion Approach is a newly developed data fusion method that combines near-ground, satellite data and digital elevation model (DEM) to successfully predict key soil properties at different soil depths [19]. However, it is more difficult to match the ground and satellite data, and the accuracy of the inversion model established is limited. The SRF-CC is more suitable for handling non-uniform relationships caused by differences in reflectivity by integrating each band interval separately. The simulation of ground spectral data and spatial data such as Sentinel-2A and GaoFen-6 (GF-6) has successfully achieved spatial inversion of fractional vegetation cover (FVC), soil salinity, and chlorophyll content [20,21,22,23]. However, further exploration is needed to determine the applicability of the SRF-CC in studying of the CNC in apple orchards.
In recent years, machine learning models have been widely used in the inversion of CNC in apple orchards, and the accuracy was better than traditional statistical models [24]. Neural network algorithms represented by Back-Propagation Artificial Neural Network (BPANN) [4] and Extreme Learning Machine (ELM) [6] models, and ensemble learning models such as Random Forest Regression (RFR), and Support Vector Regression (SVR) [25], which have good generalization ability and high robustness, and show great potential in the CNC inversion studies. To improve the accuracy and reliability of the inversion models, it is necessary to further explore the method of using machine learning models to invert the CNC of the apple orchard.
Overall, most relevant studies based on ground-space remote sensing data fusion focus on the large-scale regional inversion of field crops [26], while there is still a gap in the inversion of CNC at the orchard scale. Due to the high height and complex canopy structure of apple trees, shadows often exist in images, making it difficult to completely remove them even in UAV images, and it is even more difficult to improve the inversion accuracy. Therefore, it is still challenging to achieve the accurate inversion of the CNC in apple orchards based on ground-space remote sensing data fusion.
To overcome the limitations of a single remote sensing system and achieve high-precision inversion of the CNC in apple orchards based on the ground-space remote sensing data fusion, this study focused on the canopy of apple orchards as the research object, and used the SRF-CC to fuse ground hyper-spectral data with UAV multi-spectral data to generate simulated UAV multi-spectral data. Spectral feature parameters with high correlation were screened and the canopy abundance parameters were combined to establish the CNC inversion model. The accuracy of the models constructed based on (1) raw multi-spectral data, (2) simulated multi-spectral data, and (3) simulated multi-spectral data and canopy abundance parameters was compared, and the optimal inversion model was screened to spatially invert the CNC in apple orchards and to explore the effective integration method of ground-space remote sensing data fusion.

2. Materials and Methods
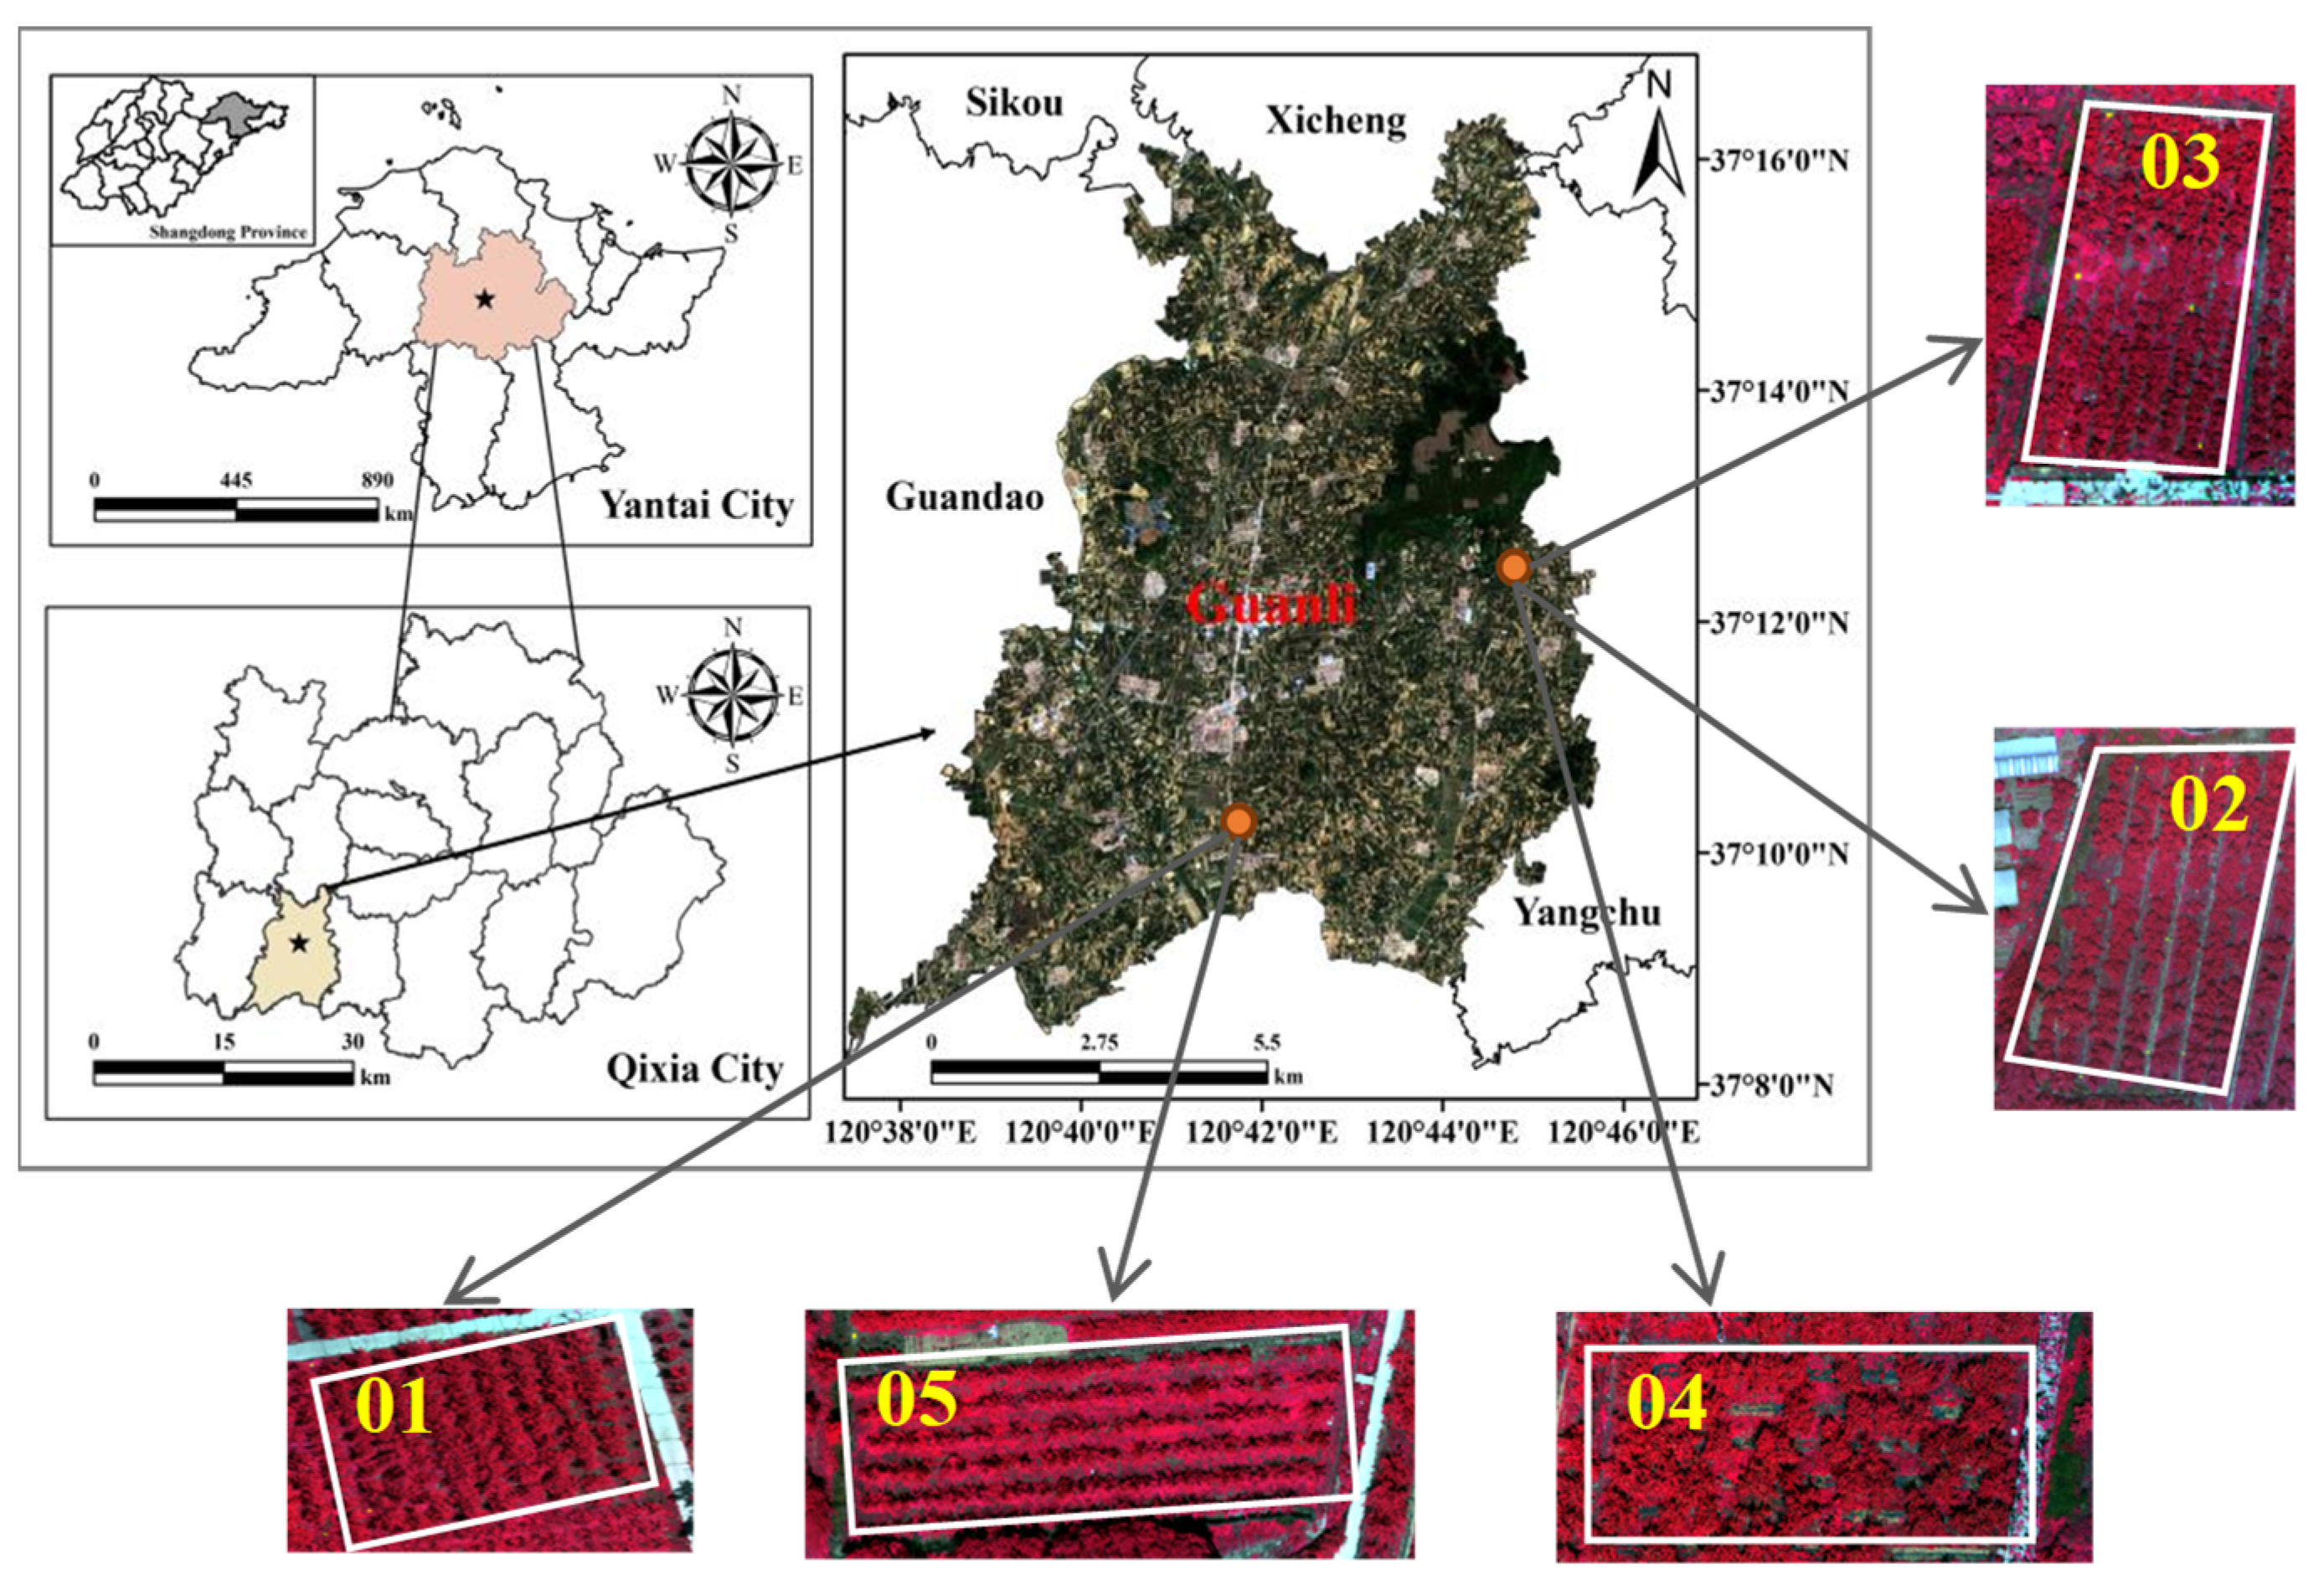
2.1. Study Area

The research area is located in the apple orchards of Guanli Town (37°12′25″ N, 120°44′41″ E), Qixia, Shandong Province (Figure 1). Guanli Town exhibits a predominantly mountainous and hilly topography with a warm-temperate monsoon semi-humid climate. It experiences four distinct seasons, an annual average of 2659.9 h of sunshine, an annual average temperature of 11.4 °C, and possesses a brown loamy soil as its dominant soil type. Qixia City is a representative dominant apple-producing area in the Bohai Rim, in which Guanli Town apple planting area is centrally and continuously distributed, with ideal conditions for basic research.

2.2. Data Collection and Pre-Processing

2.2.1. Leaf Collection and CNC Measurement

Due to the varying growth conditions of apple trees, to ensure the representativeness of the selected samples, 90 apple trees were randomly selected from 5 apple orchards. Following the principle of uniform distribution, 3 healthy and undamaged leaves were taken from the nutrient branches in the middle of each fruit tree in 4 directions, totaling 12 leaves as one canopy leaf sample. The Qianxun positioning SR2 satellite-based RTK was used to collect the coordinates corresponding to the apple tree canopy simultaneously [7]. The leaf samples were sealed and transferred into a refrigerated box for preservation. In the laboratory, the leaf nitrogen content was determined by the Kjeldahl method [27] after weighing, peeling, grinding, and sifting the leaf samples. In addition, we sorted 90 research samples according to their nitrogen content from low to high. According to the principle of equidistant sampling, the sampling was conducted according to the ratio of the modeling set: verification set = 2:1 [28], in which 60 samples were in the modeling set and 30 samples were in the verification set. The statistical indices of nitrogen content in apple tree canopy leaves [29] obtained are described in Table 1.

2.2.2. Ground-Based Hyper-Spectral Data Acquisition and Pre-Processing

The canopy and soil spectral data were collected by Analytica Spectra Devices Field spec 4 (ASD FieldSpec 4) ground object spectrometer between 10:00 and 13:00 on June 5–6 2021 on a clear, wind-free, and cloudless day. The spectral range of the ASD FieldSpec 4 spectrometer is 350–2500 nm. The sampling interval is 1.4 nm in 350–1000 nm, and the spectral resolution is 3 nm. The sampling interval is 2 nm in 1001–2500 nm, and the spectral resolution is 8 nm. The instrument was warmed up for 15 min before use, and calibrated with a standard whiteboard (reference material with a reflectance of 1) to avoid the ‘burrs’ phenomenon of the spectral curve caused by changes in solar radiation brightness. The probe height needed to be adjusted appropriately based on the size of the canopy to ensure that the entire canopy was within the detection field of view. Repeated the measurement of spectral data 5 times at each sample point, and took the average value as the canopy spectral reflectance of the apple tree at that sample point.

2.2.3. UAV Multi-Spectral Data Acquisition and Pre-Processing

The acquisition of UAV multi-spectral data was synchronized with the ground data sampling. The UAV platform used in this study is DJI DJ M600 Pro UAV, equipped with a Parrot Sequoia multi-spectral camera. The Sequoia multi-spectral camera includes 4 bands of green light (G: 530–570 nm), red light (R: 640–680 nm), red edge (REG: 730–740 nm), and near-infrared (NIR: 770–810 nm), as well as one panchromatic band. Before the flight test, white reference boards and 6 control points were arranged at the appropriate position around each orchard to facilitate geometric correction and other operations. The flight missions covering the experimental orchards area were performed with a height of 50 m above the ground, a cruising speed of 5 m/s, and a ground spatial resolution of 0.05 m/2.2 cm. Due to the low flight height of the UAVs, the light was uniform and sufficient during the flight, and no atmospheric correction was required.
This study imported the multi-spectral data of UAVs into Agisoft Metashape Professional software for image stitching. To eliminate the interference of geometric and radiation distortion on image quality, it is necessary to perform preprocessing work such as geometric correction on the concatenated image. Perform geometric correction based on the control points deployed, and the specific operation was implemented in ENVI5.3 software to ensure that the error after correction is less than 1 pixel; the DN value was converted into the surface reflectivity using the Pseudo-standard Ground Radiation Correction Method [30].

2.3. Construction of CNC Inversion Model Based on Ground-Space Remote Sensing Data

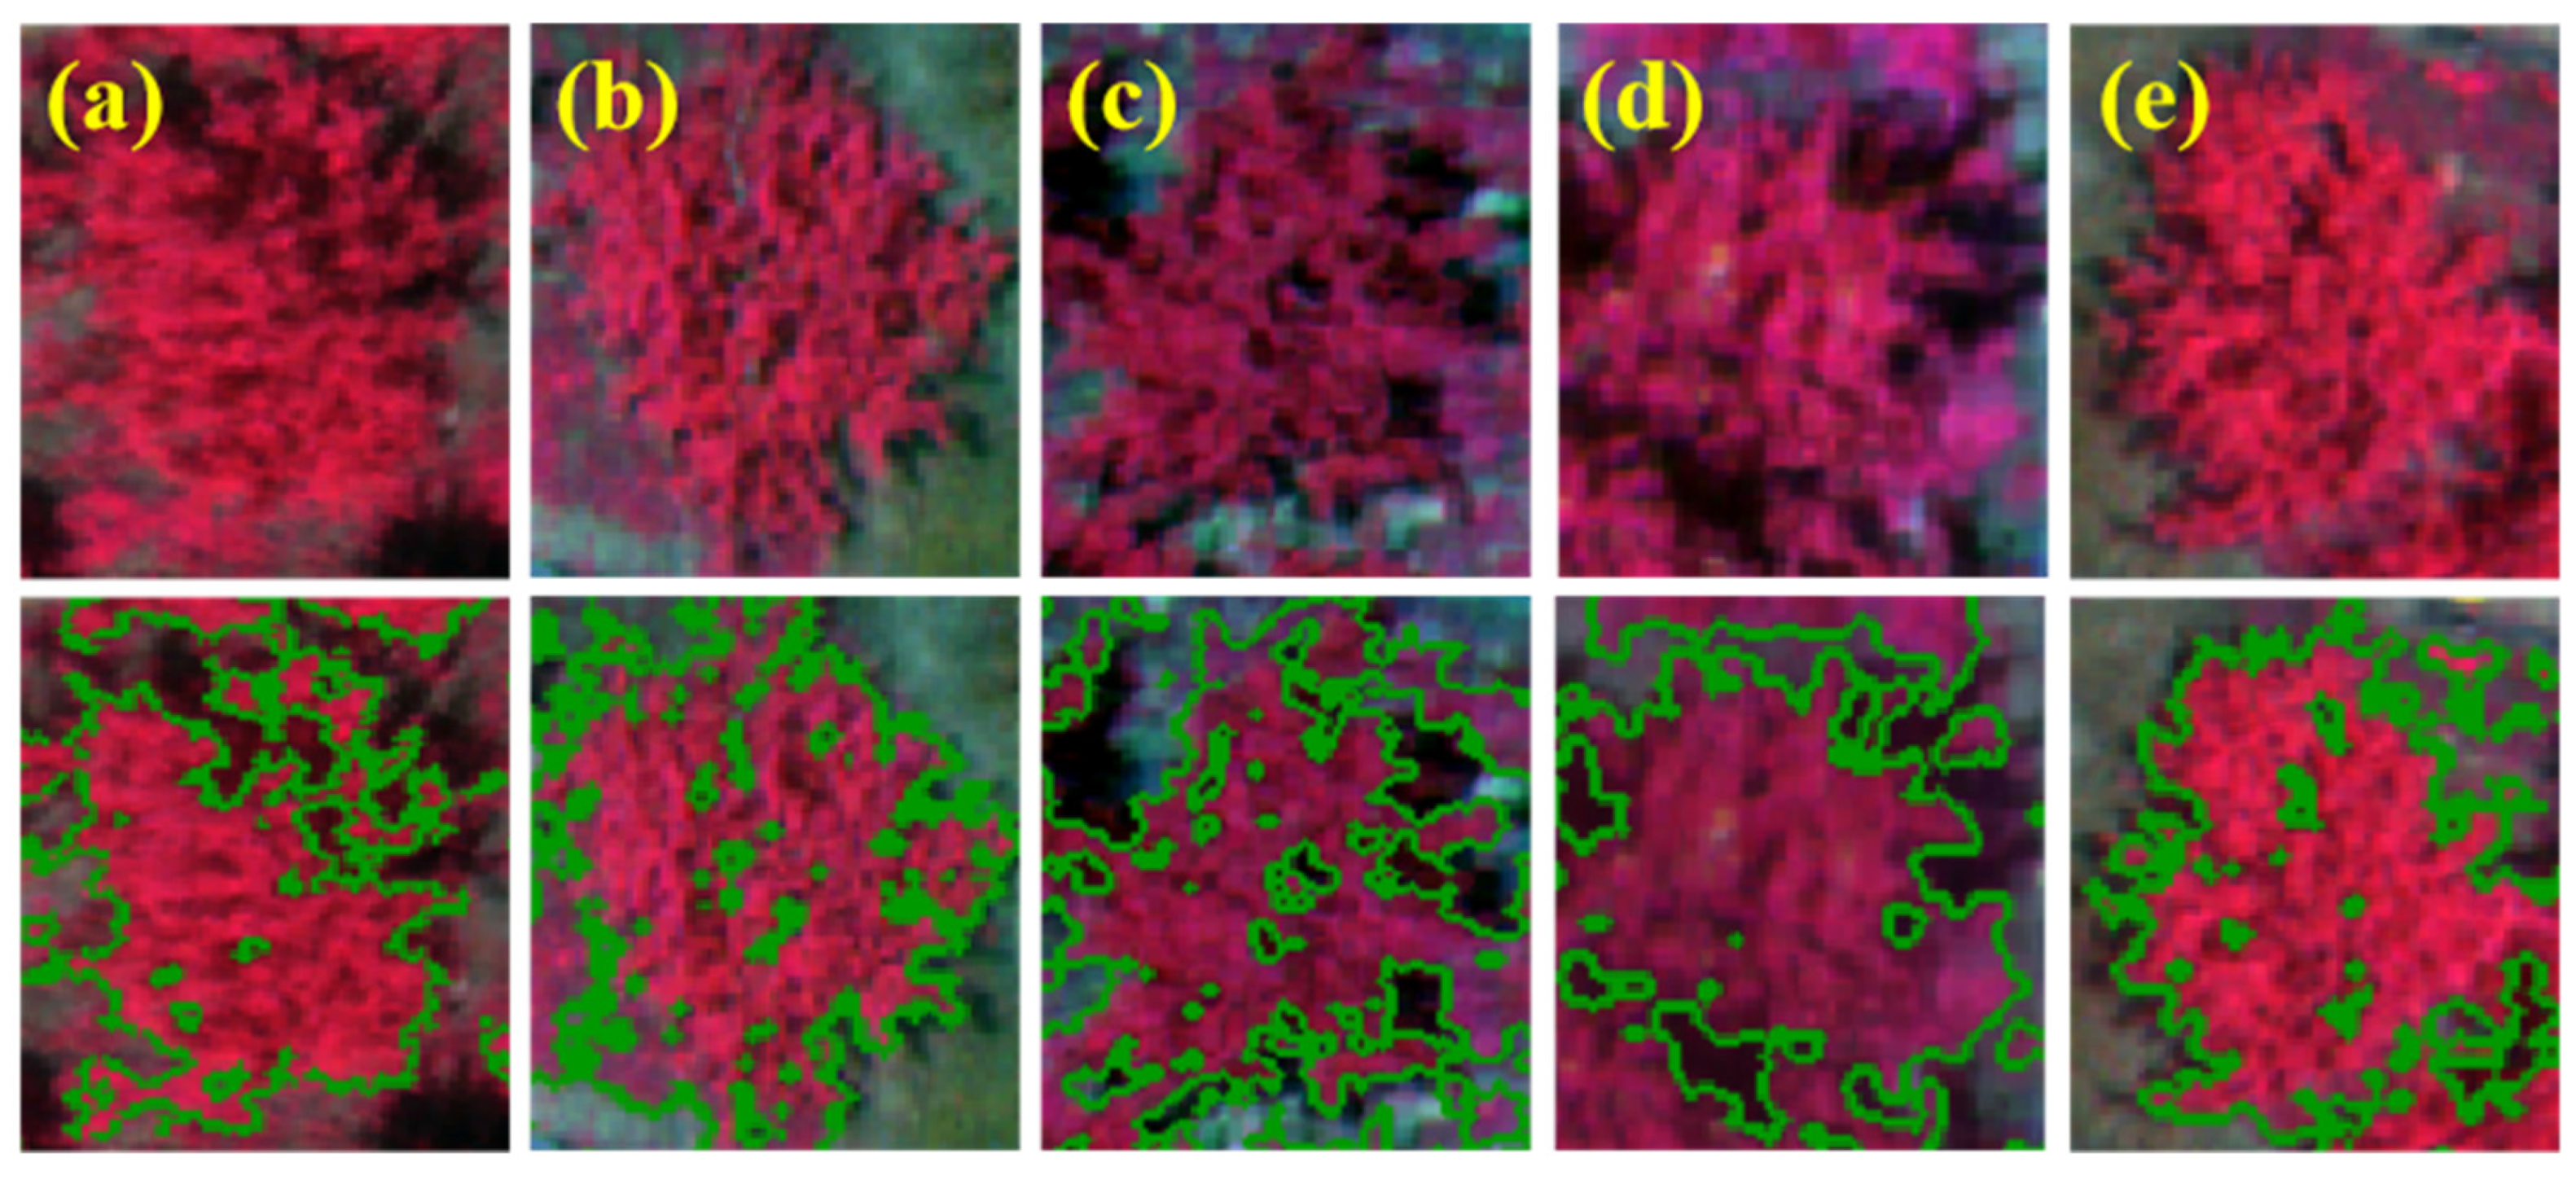
2.3.1. Extraction of Spectral Information of Apple Canopy

The supervised classification method based on neural network (NN-SC) [31,32] was used to remove bare soil and shadows from the images. Firstly, the training samples were chosen through visual interpretation to classify the pixels according to the canopy, bare soil, and shadow. After Majority/Minority analysis, Clump, and Sieve, the classification results were verified by combining the GPS coordinate information collected in the previous period. In this study, the overall accuracy and Kappa coefficient [33] were selected as test indexes to evaluate the classification accuracy. Generally speaking, the overall accuracy of more than 80% can be regarded as high classification accuracy, between 70 and 80% is medium accuracy, and below 70% accuracy is low. Kappa coefficient between 0.81 and 1.00 is considered to be high accuracy, between 0.61 and 0.80 is considered to be high accuracy, whereas between 0.41 and 0.60 can be regarded as medium accuracy, and below 0.40 indicates low accuracy. Finally, zones of interest were manually created to define the apple tree canopy, and canopy reflectances were extracted one by one.

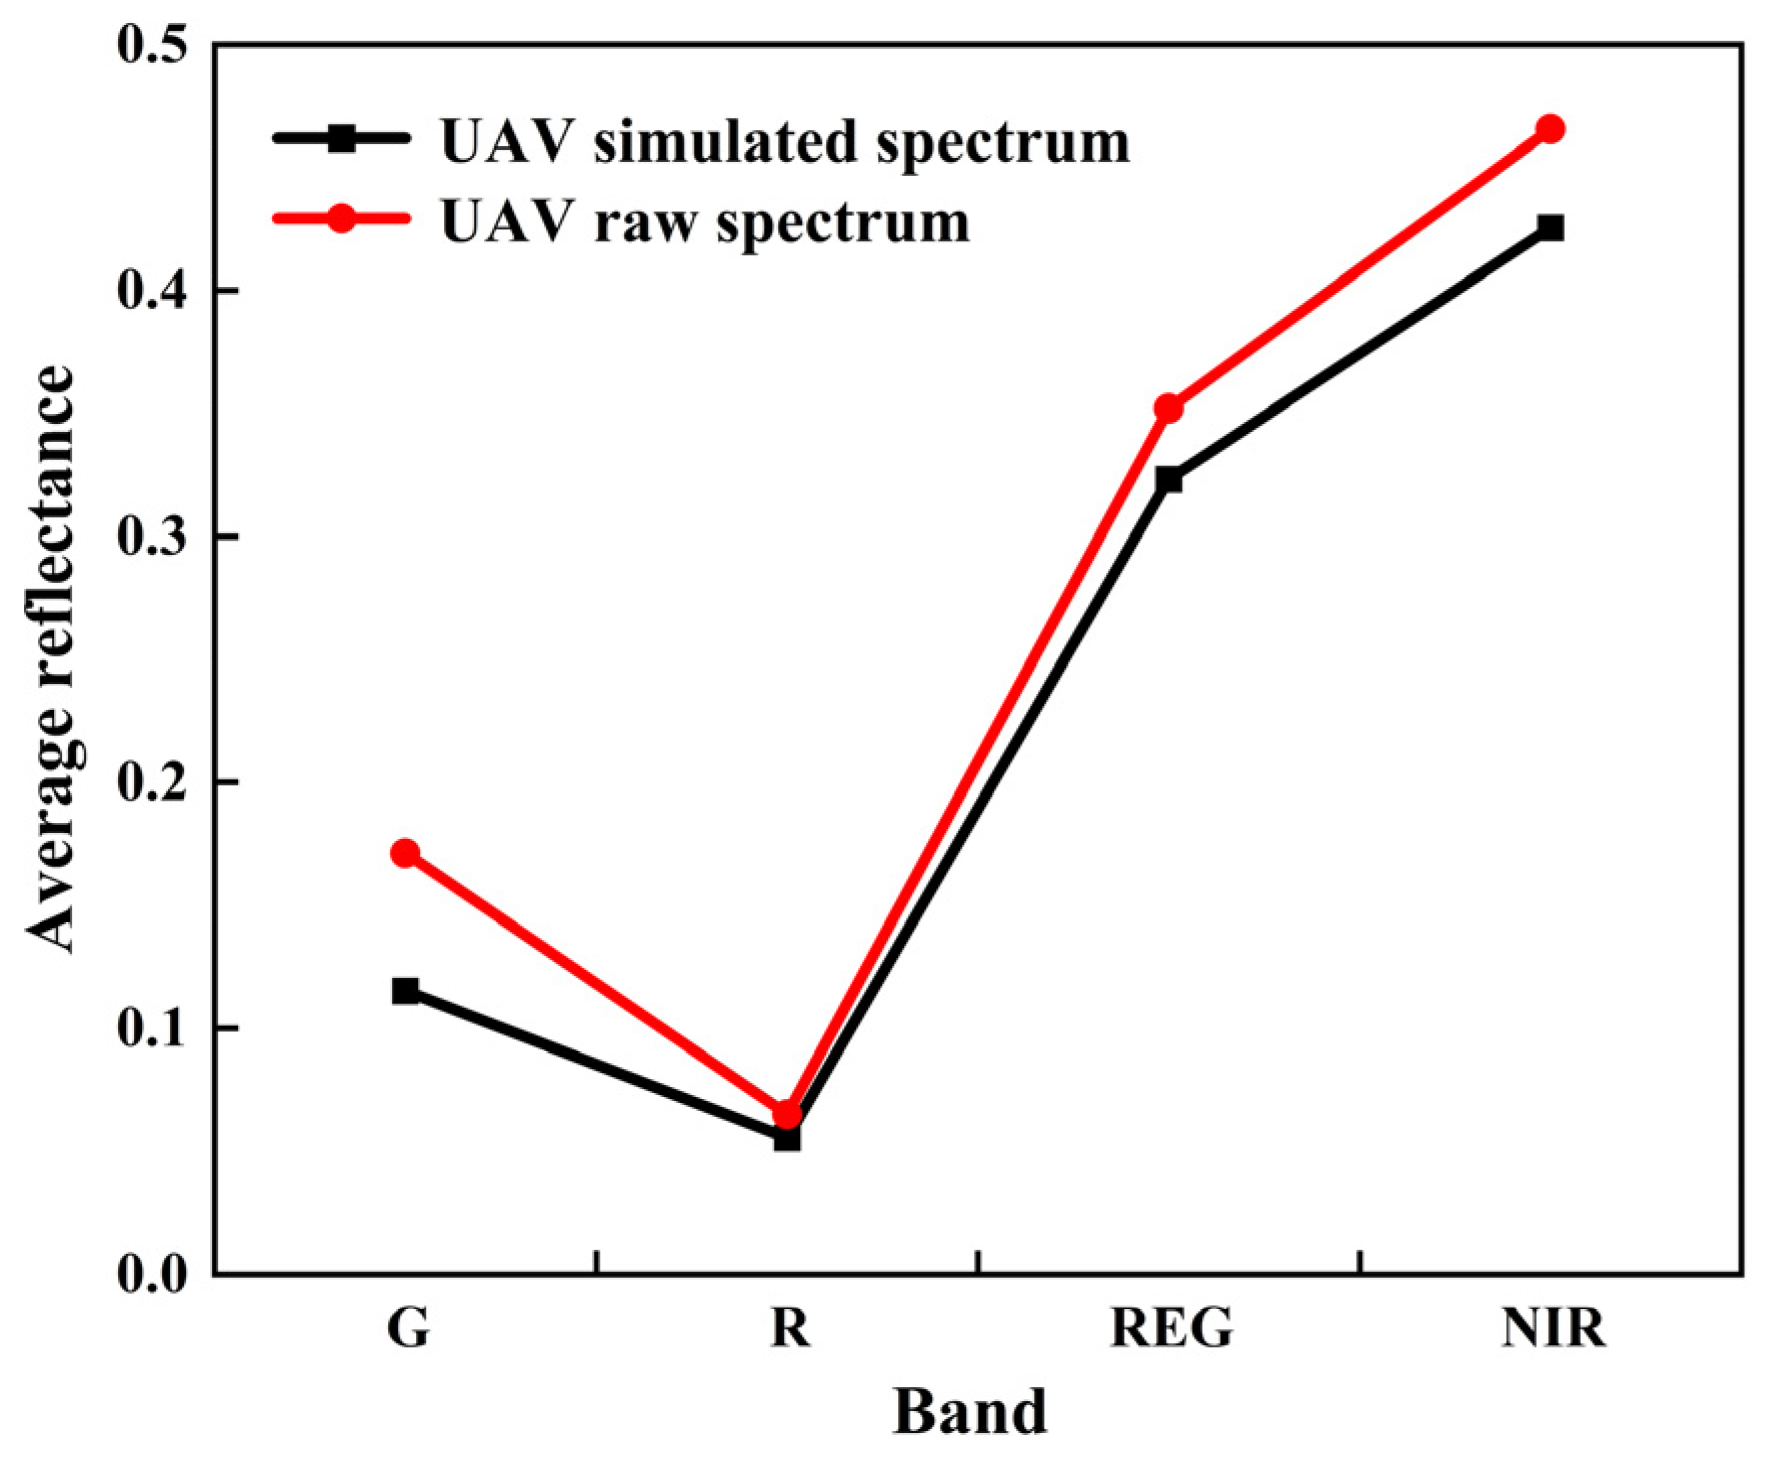
2.3.2. Fusion of Ground-Space Remote Sensing Data

The reflectance measured with the ASD FieldSpec4 spectrometer was taken at 1 nm intervals, with 2151 contiguous hyper-spectral bands per spectrum, whereas the UAV multi-spectral camera acquired a composite reflectance containing only 4 bands. Therefore, to match the multi-spectral data, it is necessary to resample the hyper-spectral data.
Assuming that the spectral response is normal, according to the spectral response function of the UAV sensor, the Gaussian Function (Full Width at Half Maximum, FWHM) [34,35] was used to perform a convolution process to resample the measured ground hyper-spectral to generate the simulated spectrum of the UAVs. The calculation formula is shown in Formula (1):
ρ UAV =   λ min   λ max s ( λ ) ρ ( λ ) d λ   λ min   λ max s ( λ ) d λ
where ρ UAV is the simulated UAV band reflectivity, s ( λ ) is the UAV spectral response function, λ max and λ min are the upper and lower limits of the band, and ρ ( λ ) is the raw ground hyper-spectral data.
Due to the typical nonlinear relationship between ground hyper-spectral and UAV multi-spectral data, the quadratic polynomial model was used to train the mapping relationship between the raw UAV multi-spectral and the simulated UAV multi-spectral homonymy point reflectance [36]. The Quadratic Polynomial Model is as follows:
S U = a   ×   S U 2 + b   ×   S U + c
where a , b are the spectral index conversion coefficients, c is the conversion residual,   S U is the UAV multi-spectral reflectance before data fusion, and S U is the UAV multi-spectral reflectance after data fusion.
The R2 analysis was performed on the raw and simulated UAV multi-spectral homonymy point reflectance, the closer the R2 was to 1, the higher the consistency of spectral information between the two, and vice versa.

2.3.3. Construction and Screening of Spectral Feature Parameters

The spectral feature parameters were divided into two parts: the remote sensing bands and the vegetation indices. The remote sensing band group consisted of 4 bands of G, R, REG, and NIR covered by the Sequoia camera. The vegetation index can effectively reflect the growth and health status of vegetation; therefore, a total of 10 vegetation indices [37,38,39,40,41,42] such as the Difference Vegetation Index (DVI) and Renormalized Difference Vegetation Index (RDVI) were constructed by using the spectral reflectance before and after fusion, the calculation formula is shown in Table 2. The Correlation Coefficient Method was used to analyze the correlation between each spectral feature parameter and CNC and selected the spectral feature parameters that were sensitive to the fusion data before and after the fusion based on the high or low absolute values of the correlation coefficients (|R|).

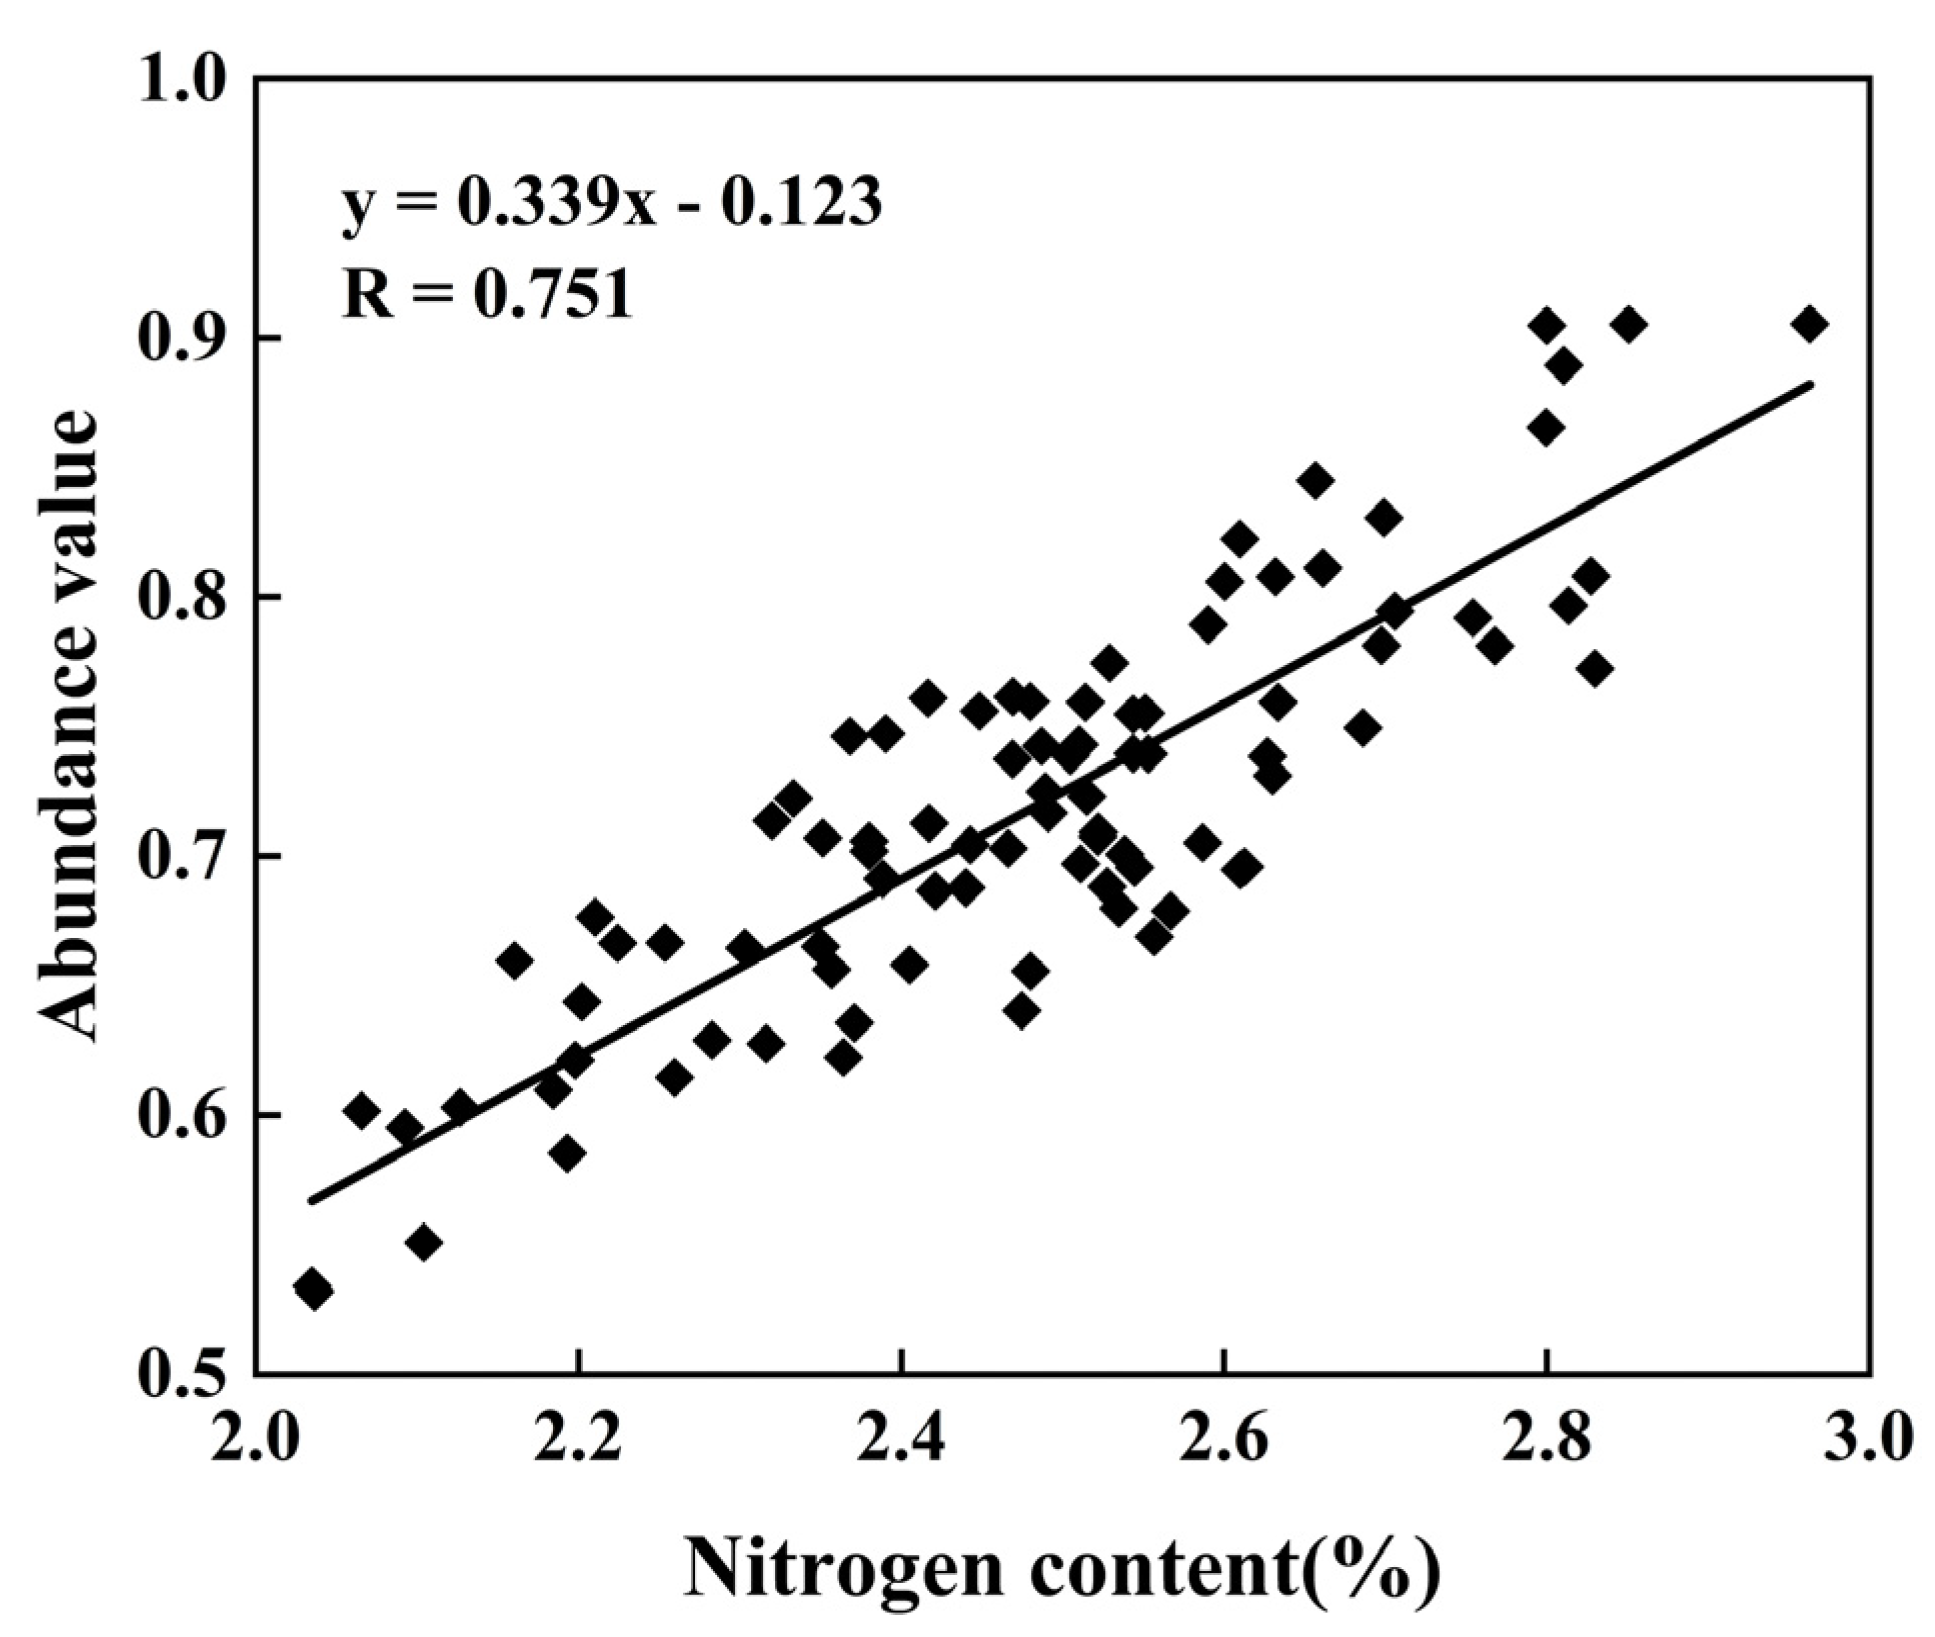
2.3.4. Construction of Canopy Abundance Parameter Based on Data Fusion

The existence of mixed pixels in remote sensing images seriously affects the interpretation accuracy of the images [43], and the key to solving this challenge is to find out the proportion of various typical features in the mixed pixels. In this study, the reflectance extracted from UAV multi-spectral images was treated as the mixed pixel spectral reflectance, whereas the simulated reflectance was regarded as the simulated standard end-element spectral reflectance. Firstly, the Unconstrained Least Squares Mixed Pixel Decomposition was performed on the mixed image elements using the simulated standard end-element spectral reflectance, and then the resulting abundance equivalent values were polar-variance normalized to finally obtain the canopy abundance parameter based on data fusion. The Unconstrained Least Squares-linear Spectral Mixing Model [44] and Extreme Difference Normalization used in this study are specified as follows:
r i = j = 1 m α ij e j + ε j
where r i is the hybrid image element spectral reflectance; e j is the measured end-element spectral reflectance, α ij is the abundance of e j in r i , and its physical significance is the proportion of area occupied by the j th end-element in the ith image element; ε j is the error term, and m is the total number of end-elements.
X i j * = X i j m i n ( X i j ) R j   i = 1 , 2 , , n ;   j = 1 , 2 , , p
where R j = m a x ( X i j ) m i n ( X i j ) , i = 1 , 2 , , n . R j is the extreme variance of the abundance equivalent value, m a x ( X i j ) is the extremely large value of the abundance equivalent value, m i n ( X i j ) is the very small value of the abundance equivalent value, X i j * is the abundance parameter, X i j is the abundance equivalent value.

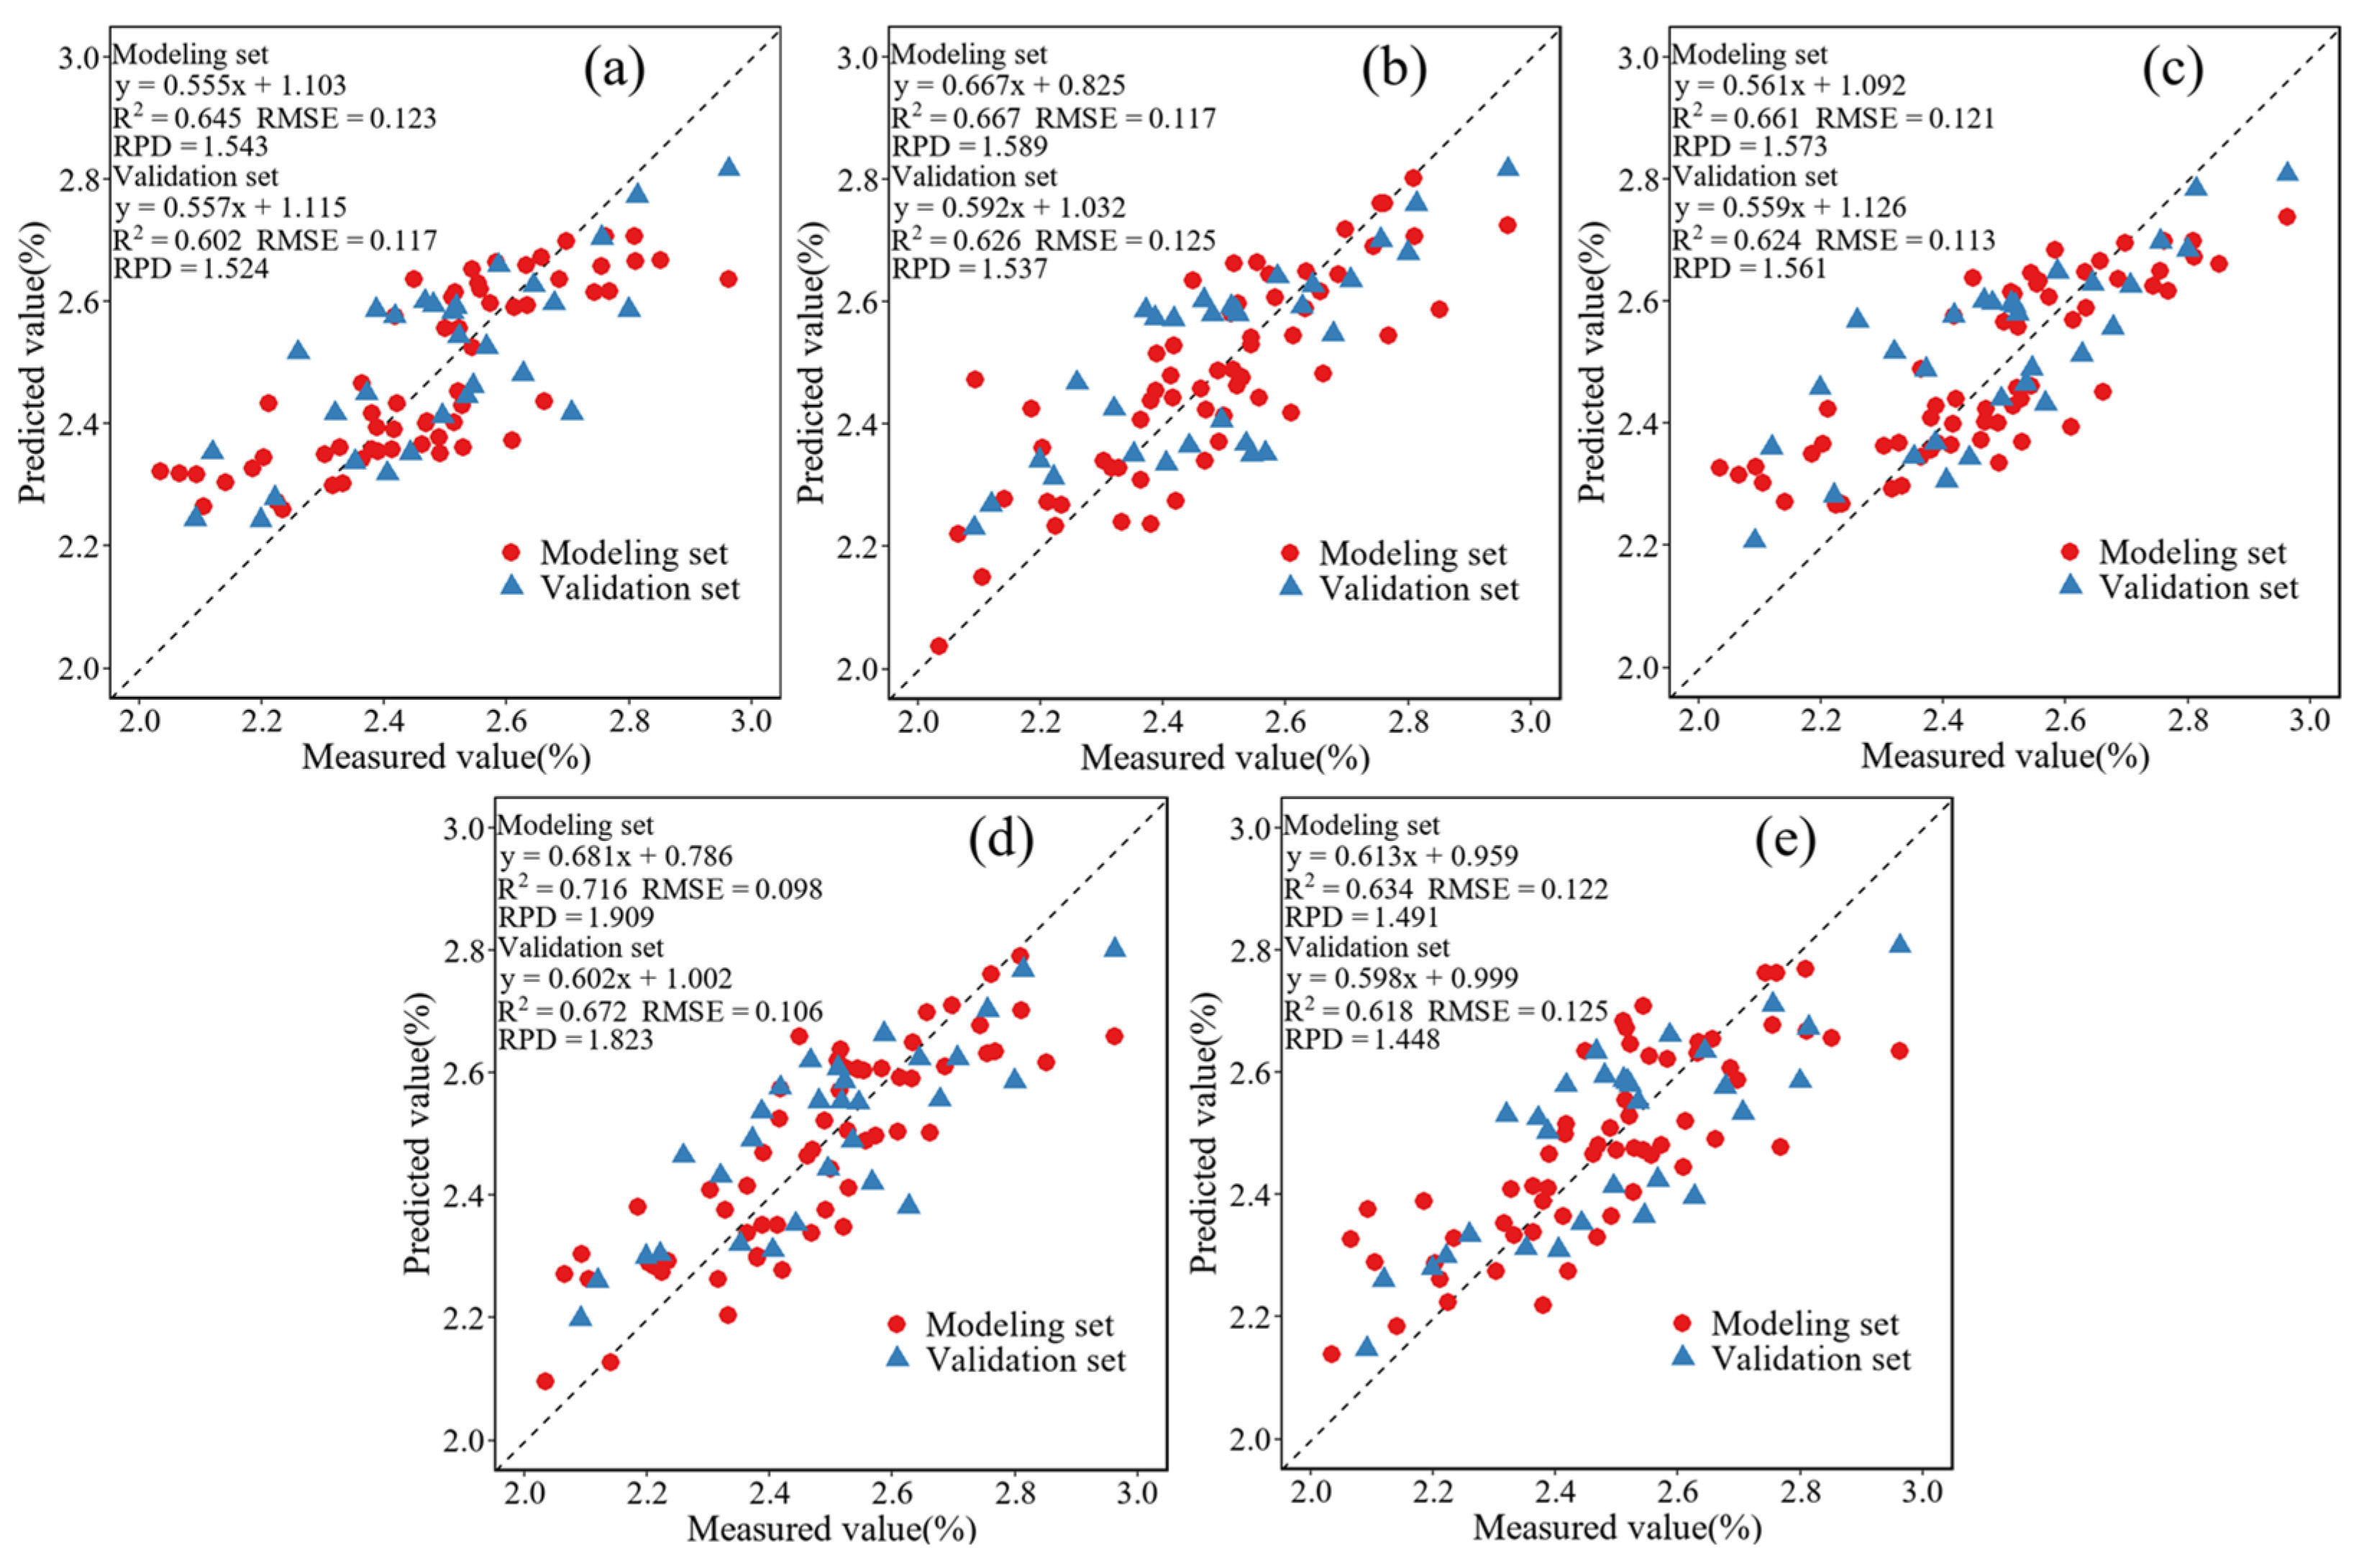
2.3.5. Establishment and Verification of CNC Inversion Model

The study selected 5 machine learning methods, namely Radial Basis Function Neural Network (RBF-NN), Extreme Learning Machine (ELM), Random Forest Regression (RFR), Extreme Gradient Boosting (XGBoost), and Support Vector Regression (SVR) to establish the inversion model of CNC. Among them, the RBF-NN model is based on function approximation theory, and can approximate any nonlinear function with a few neurons during the training process [45]. The ELM model can obtain a unique optimal solution without adjusting the threshold value of neurons, and has been widely used due to its advantages of fast learning speed and good generalization performance [6]. The RFR model is constructed by introducing a random attribute selection based on the Bagging integration, which can effectively reduce the risk of overfitting, and has become one of the commonly used models in quantitative remote sensing research in the agriculture field [46]. The XGBoost model is a new and efficient algorithm for boosting decision tree, which can realize the effect of shortening the operation time and improving the accuracy through multi-threaded parallel operation [47]. The SVR model is based on the principle of minimizing structural risk, which minimizes the upper bound value of the error probability and can achieve the goal of minimizing the error between the measured and predicted values [48].
The Determination Coefficient (R2), Root-Mean-Square Error (RMSE), and Residual Predictive Deviation (RPD) were selected as the accuracy evaluation and test indexes of the inversion model. Among them, R2 can characterize the fitting degree of the model, RMSE can measure the deviation between the predicted value and the measured value, and RPD is an effective index to judge the stability of the model. In general, the larger the R2, the smaller the RMSE and the larger the RPD [49], indicating that the model has the best prediction effect and the strongest stability. The calculation formula for each precision test index is as follows:
R 2 = i = 1 n ( y i ^ y ¯ ) 2 i = 1 n ( y i y ¯ ) 2
R M S E = 1 N i = 1 n ( y i y i ^ ) 2
S D = i = 1 n ( y i y ¯ ) 2 N 1
R P D = S D R M S E
where n is the number of samples, i is the sample serial number, y i is the predicted value of CNC, y ¯ is the mean value of CNC, y i ^ is the measured value of CNC, and S D is the sample difference of the measured value.

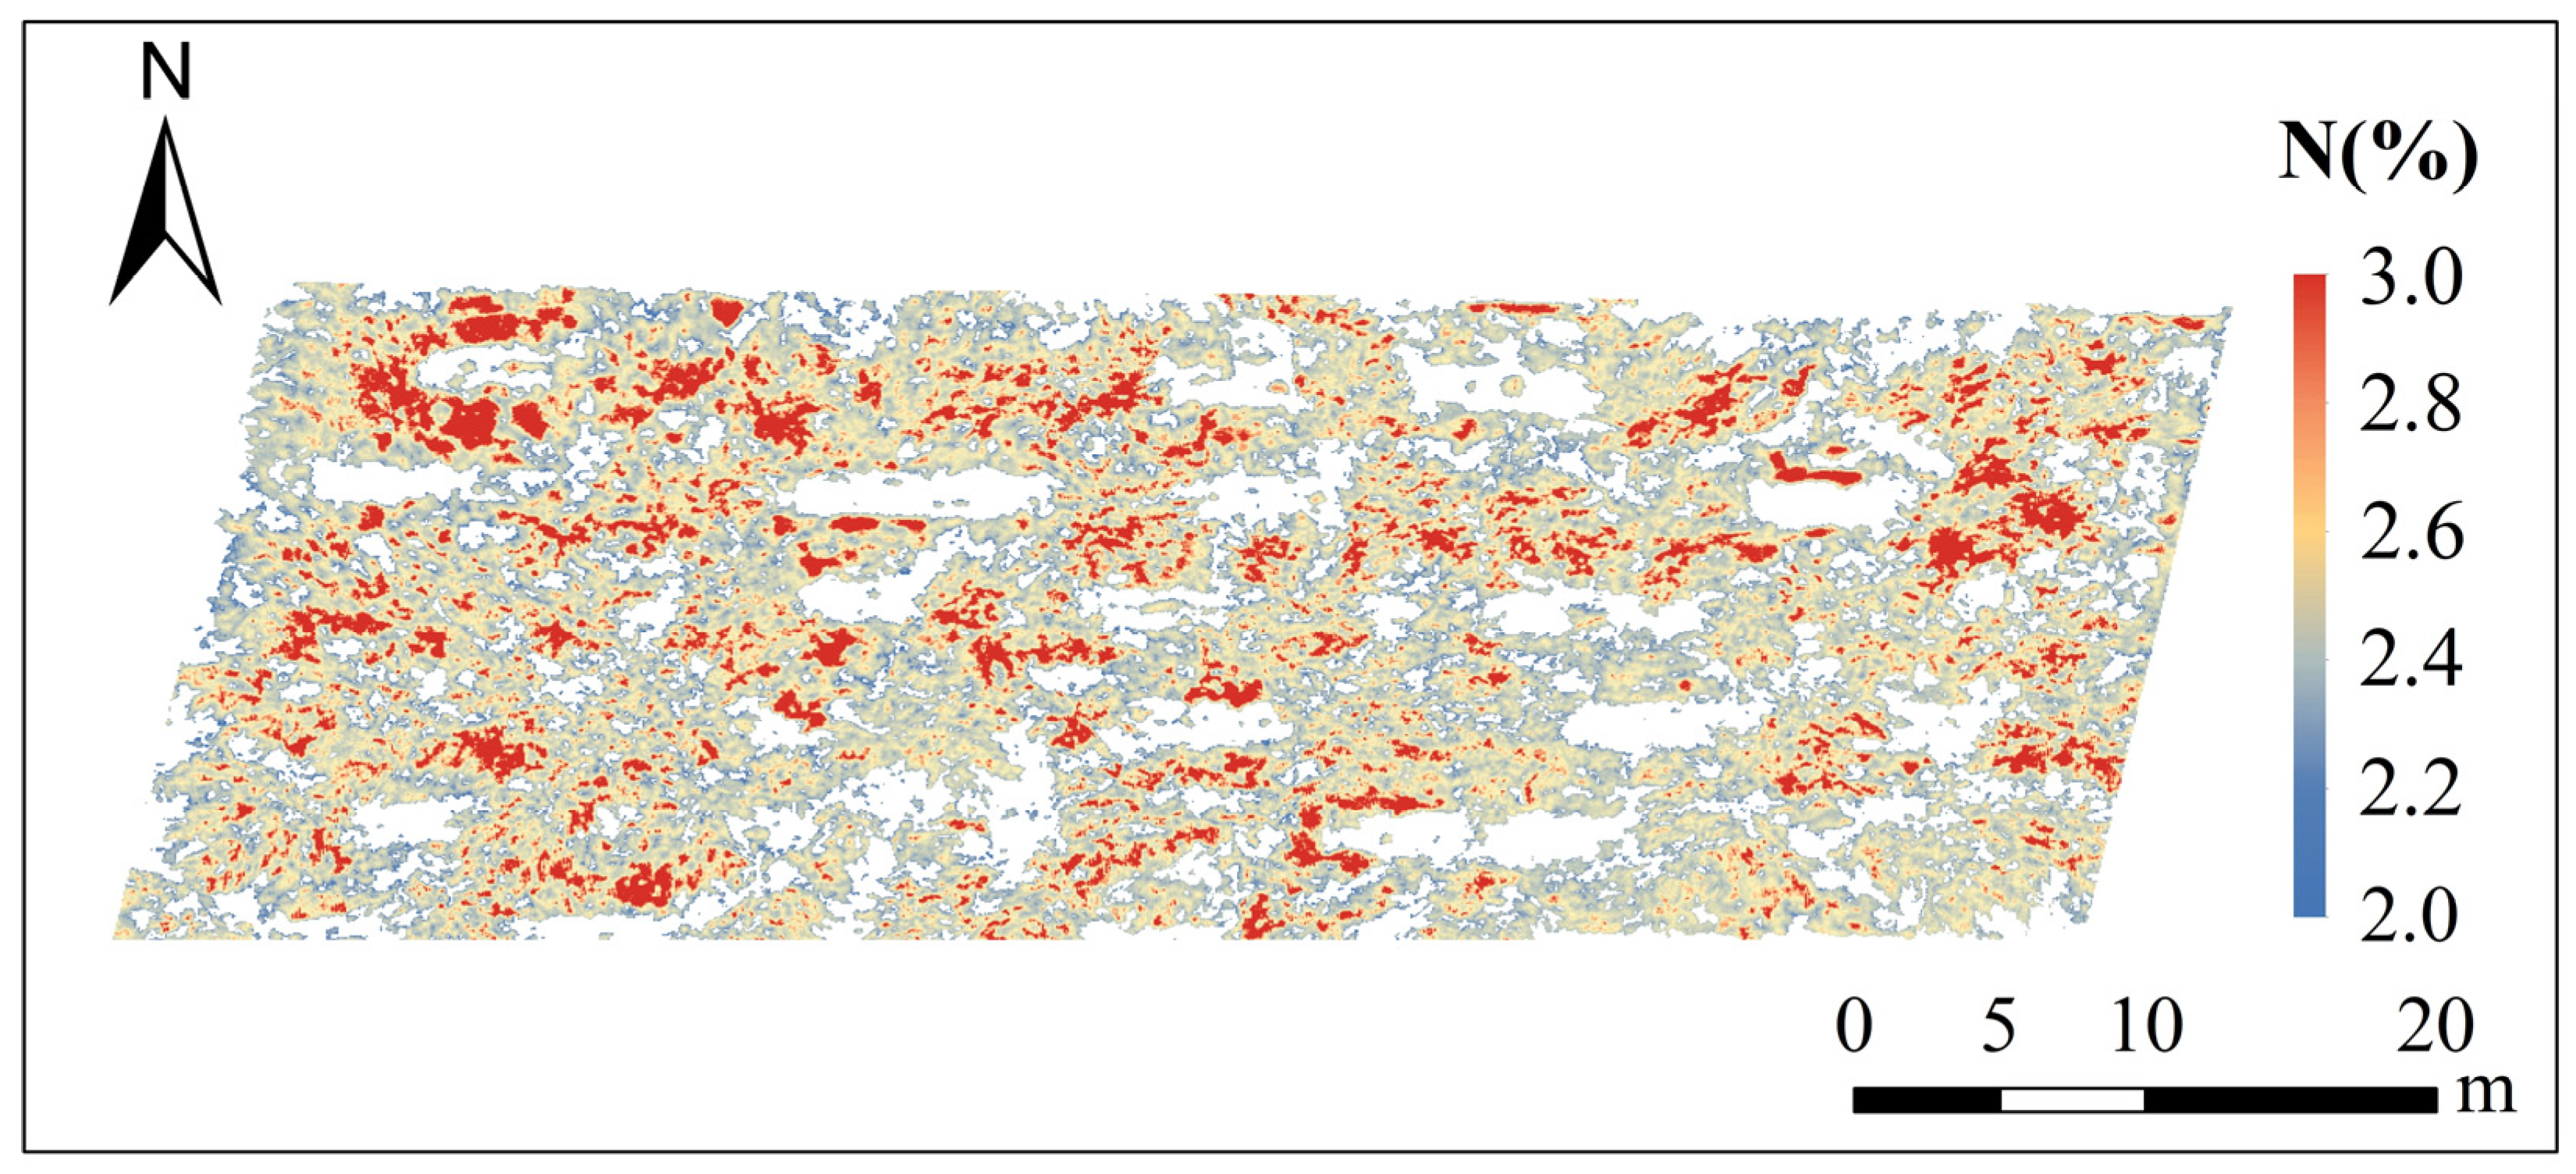
2.3.6. Spatial Inversion Mapping of CNC

The screened optimal model was applied to UAV images for spatial inversion of CNC in apple orchards. Firstly, the spectral feature parameters and canopy abundance parameters files were imported into R Studio and combined using the stack () function; then, each pixel value in the multilayer file was predicted using the raster: predict () function in conjunction with the optimal prediction model; finally, the writeRaster () function was used to generate the predicted image in format and visualize the image features in ArcMap.

3. Results

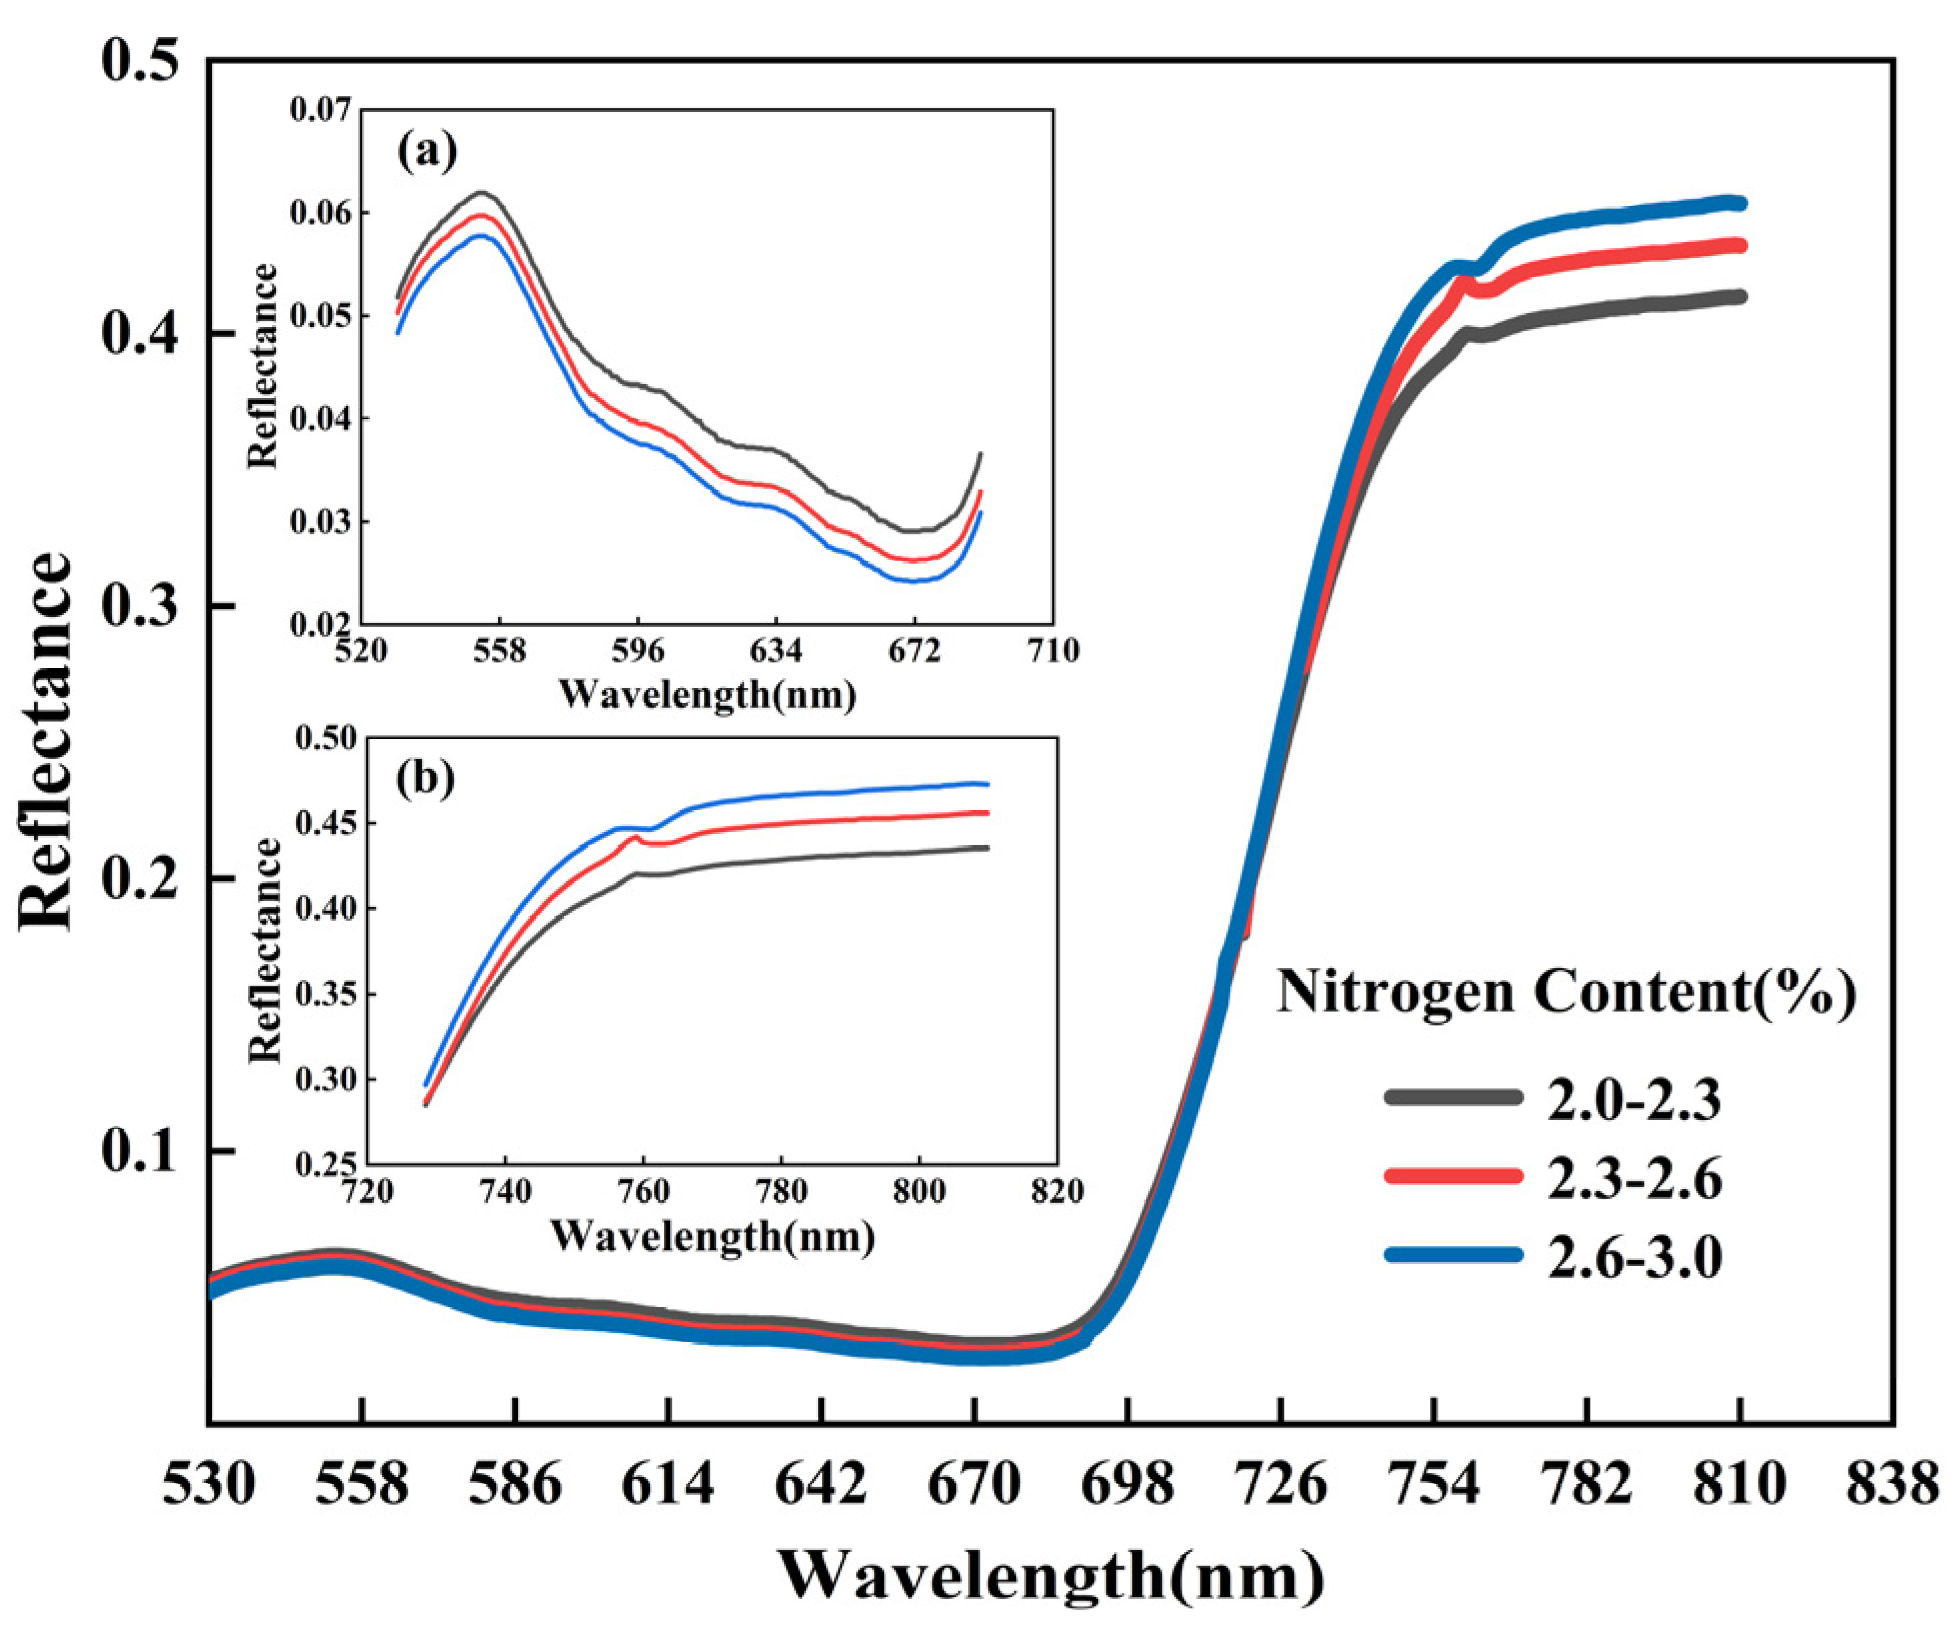
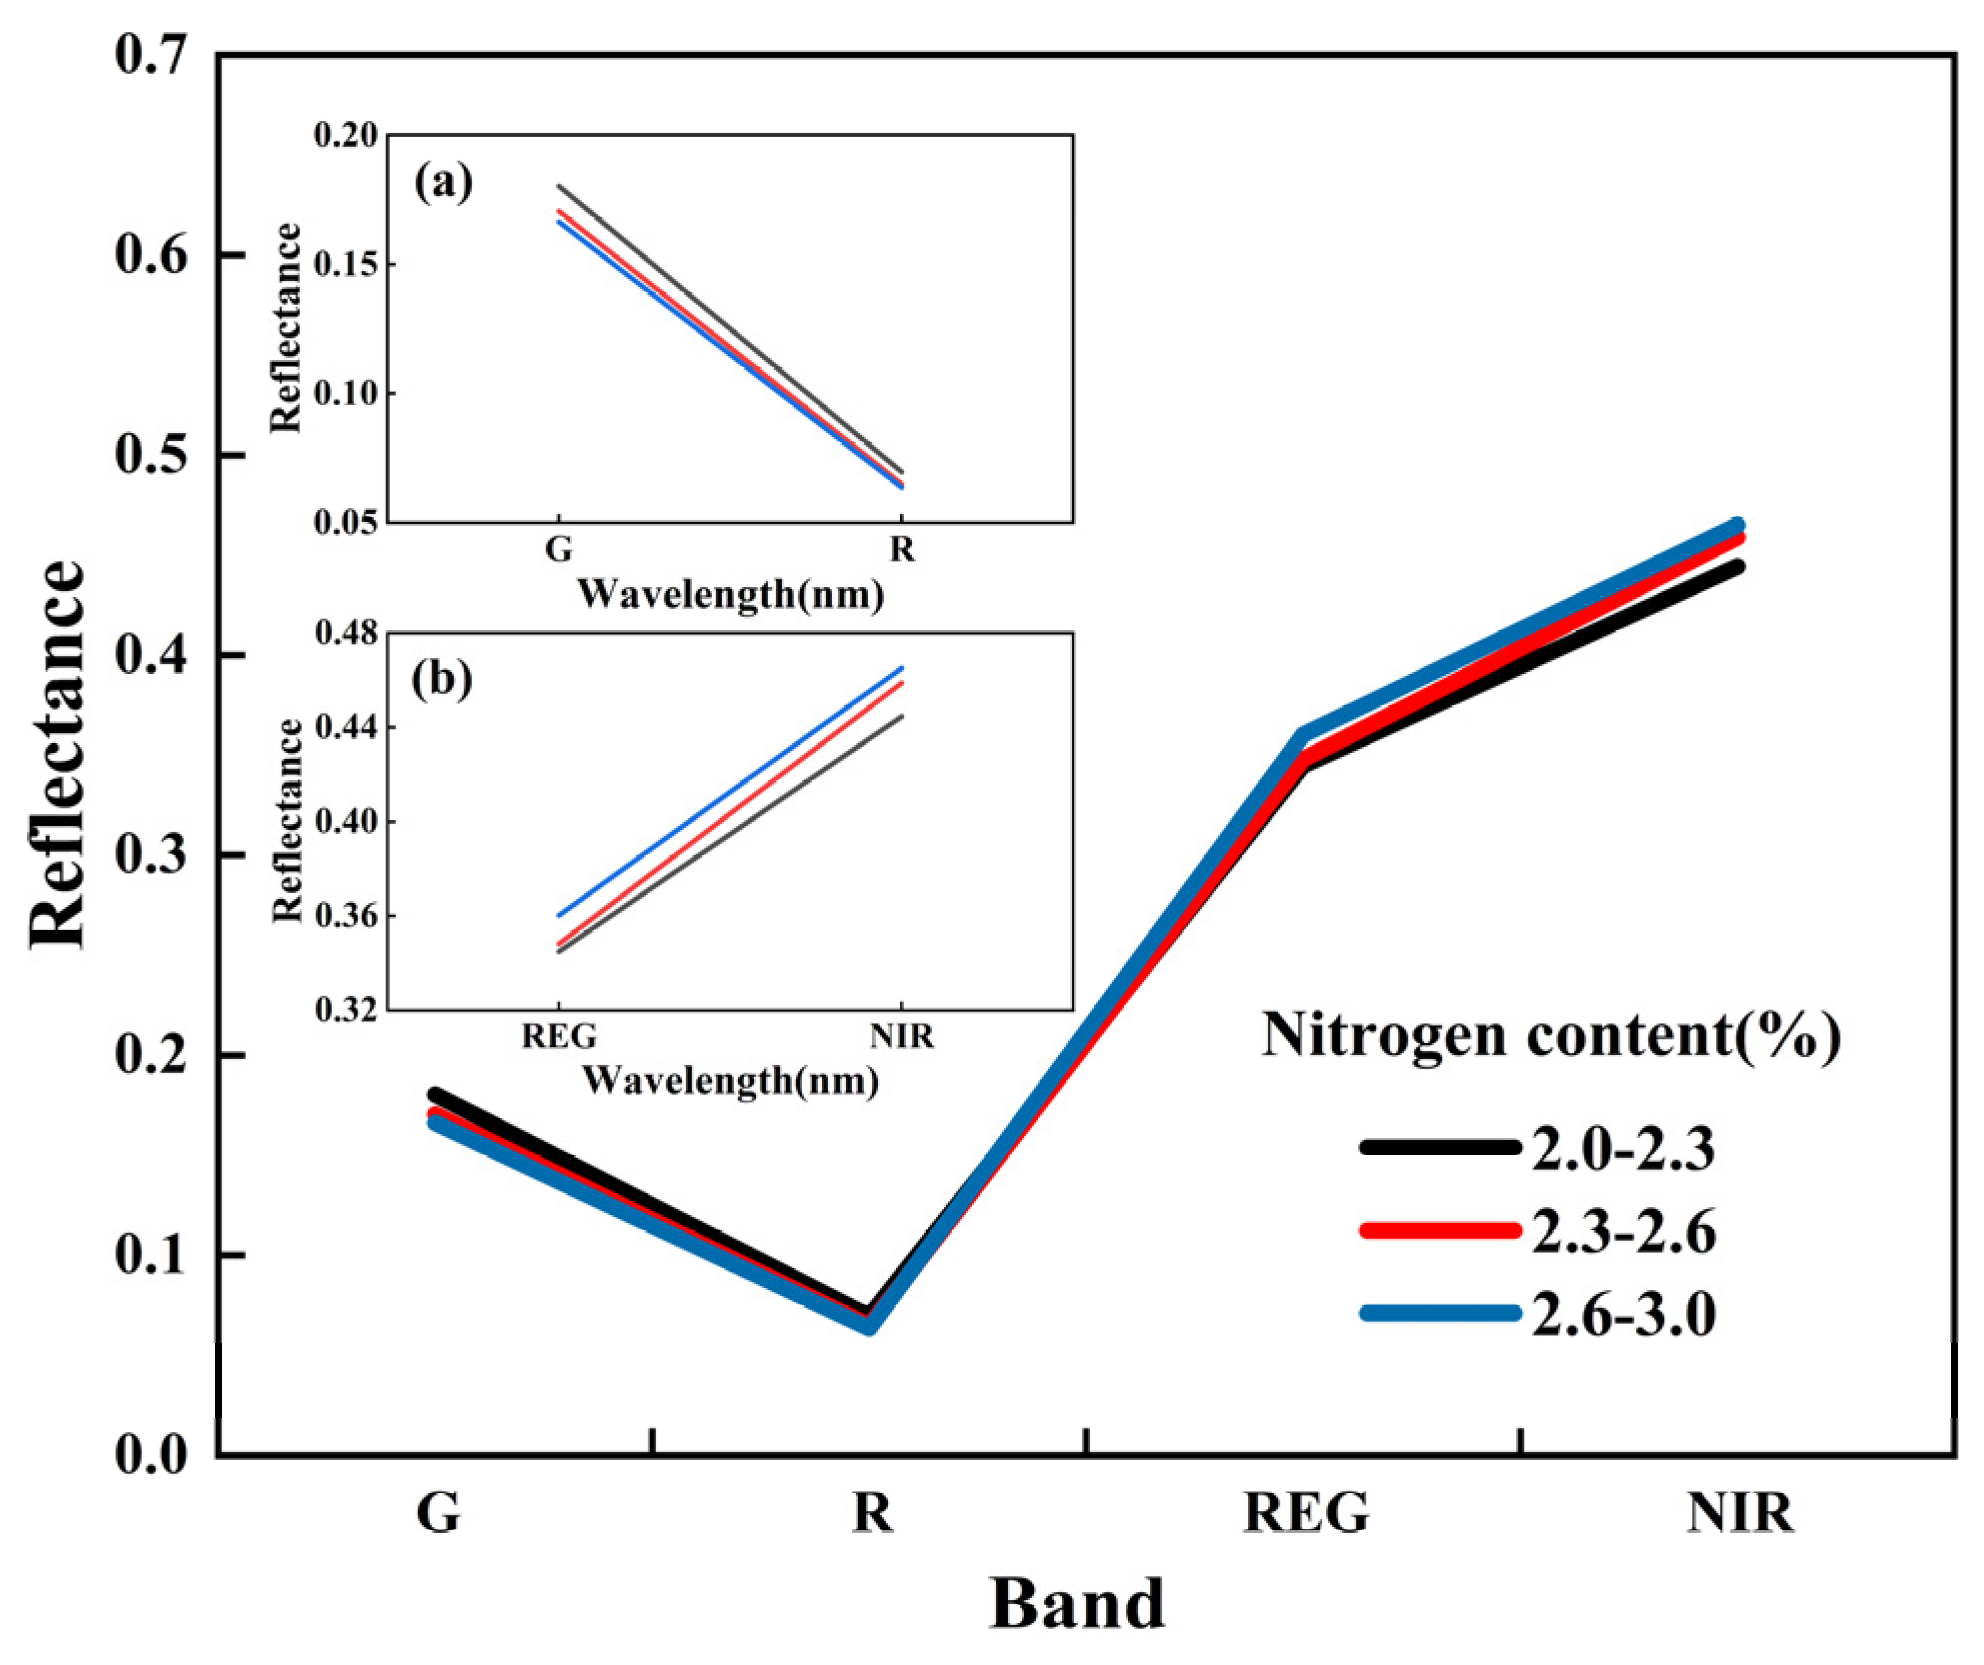
3.1. Analysis of Spectral Features of Apple Canopy

Figure 2 and Figure 3 show the average spectral reflectance curves of the ground hyper-spectral and UAV multi-spectral with different CNC, respectively. It can be seen from the figure that the average spectral reflectance varied approximately the same in the 530–810 nm (G-NIR). Due to the strong absorption of plant pigments, a small reflection peak appeared in the G band (530–610 nm). In the R band (610–690 nm), the absorption of chlorophyll resulted in a low reflectance with a decreasing trend. The reflectivity increased rapidly in the REG band (690–760 nm). Additionally, in the NIR band (760–810 nm), the reflectance reached the high reflectance plateau region. In addition, in the visible light to REG band, the spectral reflectance decreased with the increase in CNC, whereas in the REG to NIR band, the reflectance decreased first and then increased with the increase in CNC. The high similarity of spectral features between ground hyper-spectral data and UAV multi-spectral data indicated that it is reasonable to combine ground-space data to generate simulated multi-spectral data in this study.

3.2. Results of Spectral Information Extraction from Apple Canopy

The apple orchard features were classified into three categories: canopy, shadow, and bare soil by NN-SC, and the classification results were verified by GPS coordinates of sample points. Table 3 shows the overall accuracy and Kappa coefficient of the classification results of five orchards. Among them, the overall accuracy was above 90%, and the Kappa coefficient was above 0.85, indicating high classification accuracy, and the classification results can be used to extract spectral information of the canopy. Figure 4 shows the schematic diagram of the canopy extraction of single fruit tree randomly selected from the orchard, and it can be seen that both the main canopy and the details of the canopy edges were accurately extracted.

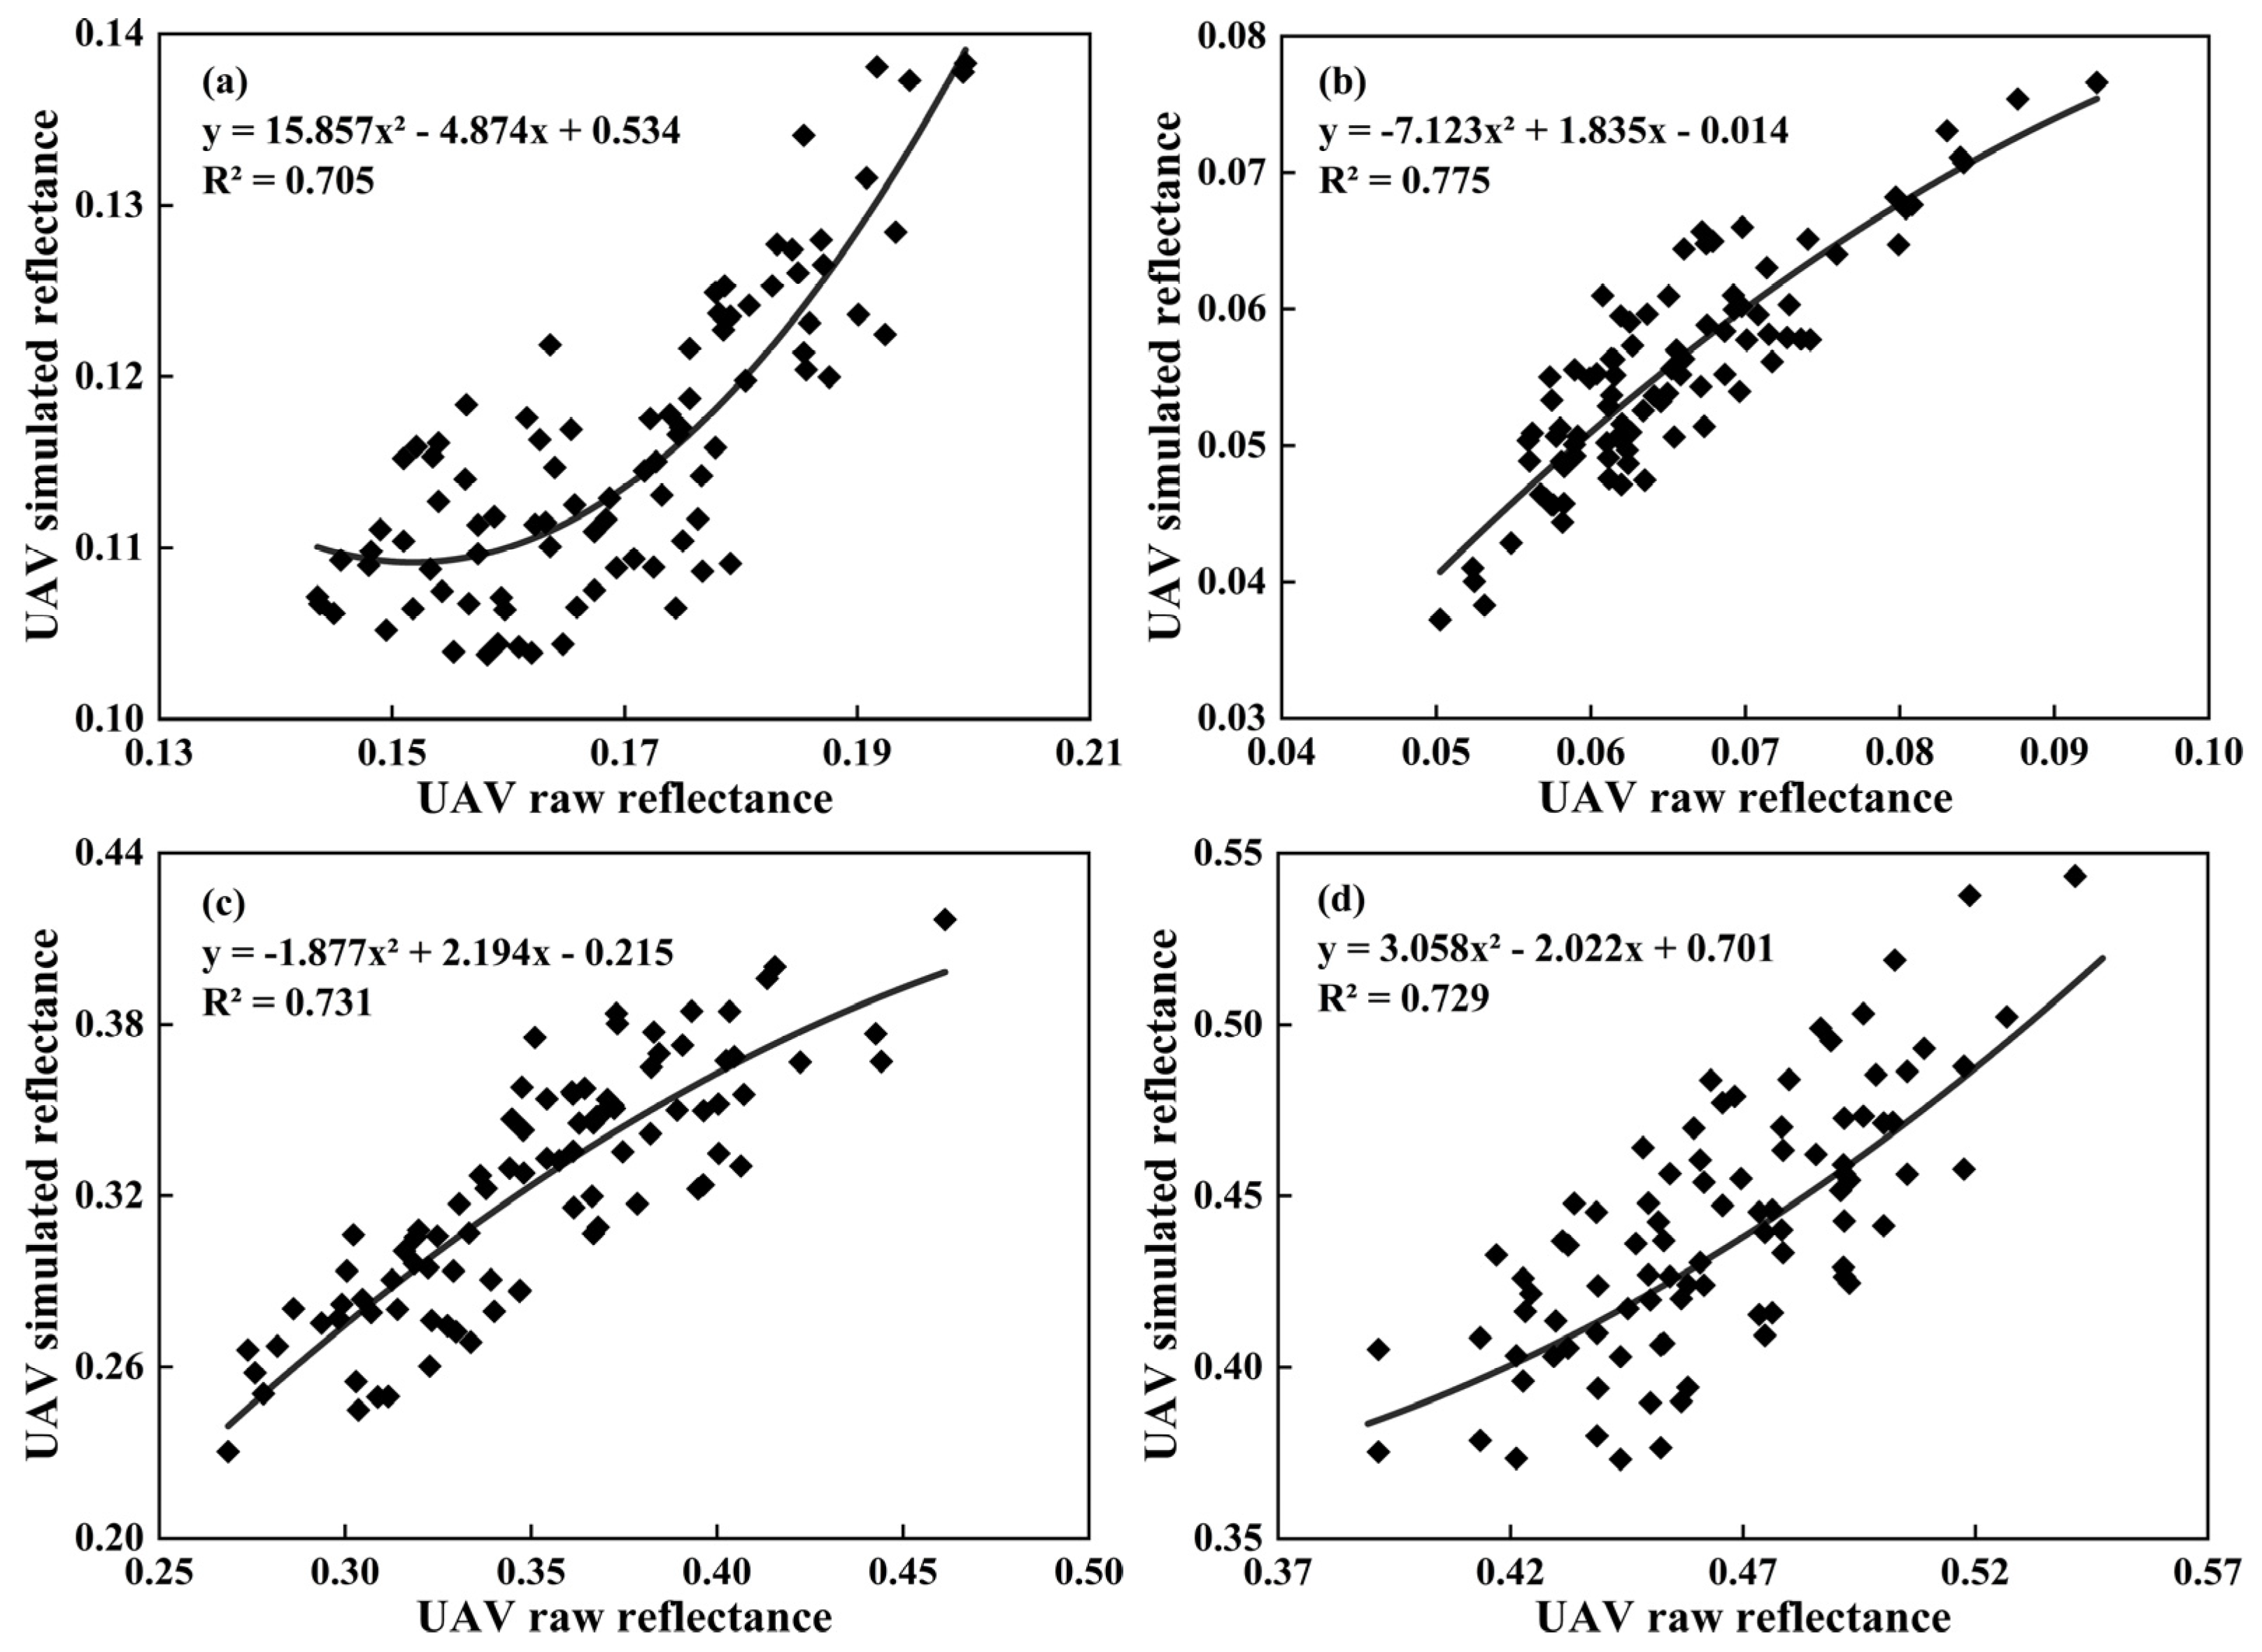
3.3. Results of Ground-Space Remote Sensing Data Fusion

Based on the SRF-CC, the ground-space remote sensing data fusion was carried out, Figure 5 shows a comparison between the average reflectance of the simulated and the raw spectrum of the UAVs. It can be seen from the figure that the reflectance of the four simulated spectral bands was slightly lower than the raw spectral reflectance, but the overall trend of the spectral curve was consistent. Figure 6 shows the Quadratic Polynomial Fusion Models constructed from the raw spectral data and simulated spectral data of the UAVs, as well as the R2 of the homonymy points. It can be seen from the figure that the variation trend of reflectivity values of each band was consistent, and there was a typical nonlinear relationship between the reflectivity of the raw and simulated spectral data of the UAVs, and the R2 of the four bands was high. Among them, the raw R band of the UAVs had the highest R2 with the corresponding simulated R band reflectance (R2 = 0.775), and the R2 of the REG band was 0.731, which was second only to the R band; the R2 of NIR and G bands was relatively low, but still reached 0.729 and 0.705. The above results show that the SRF-CC is effective for the fusion of ground-space remote sensing data.

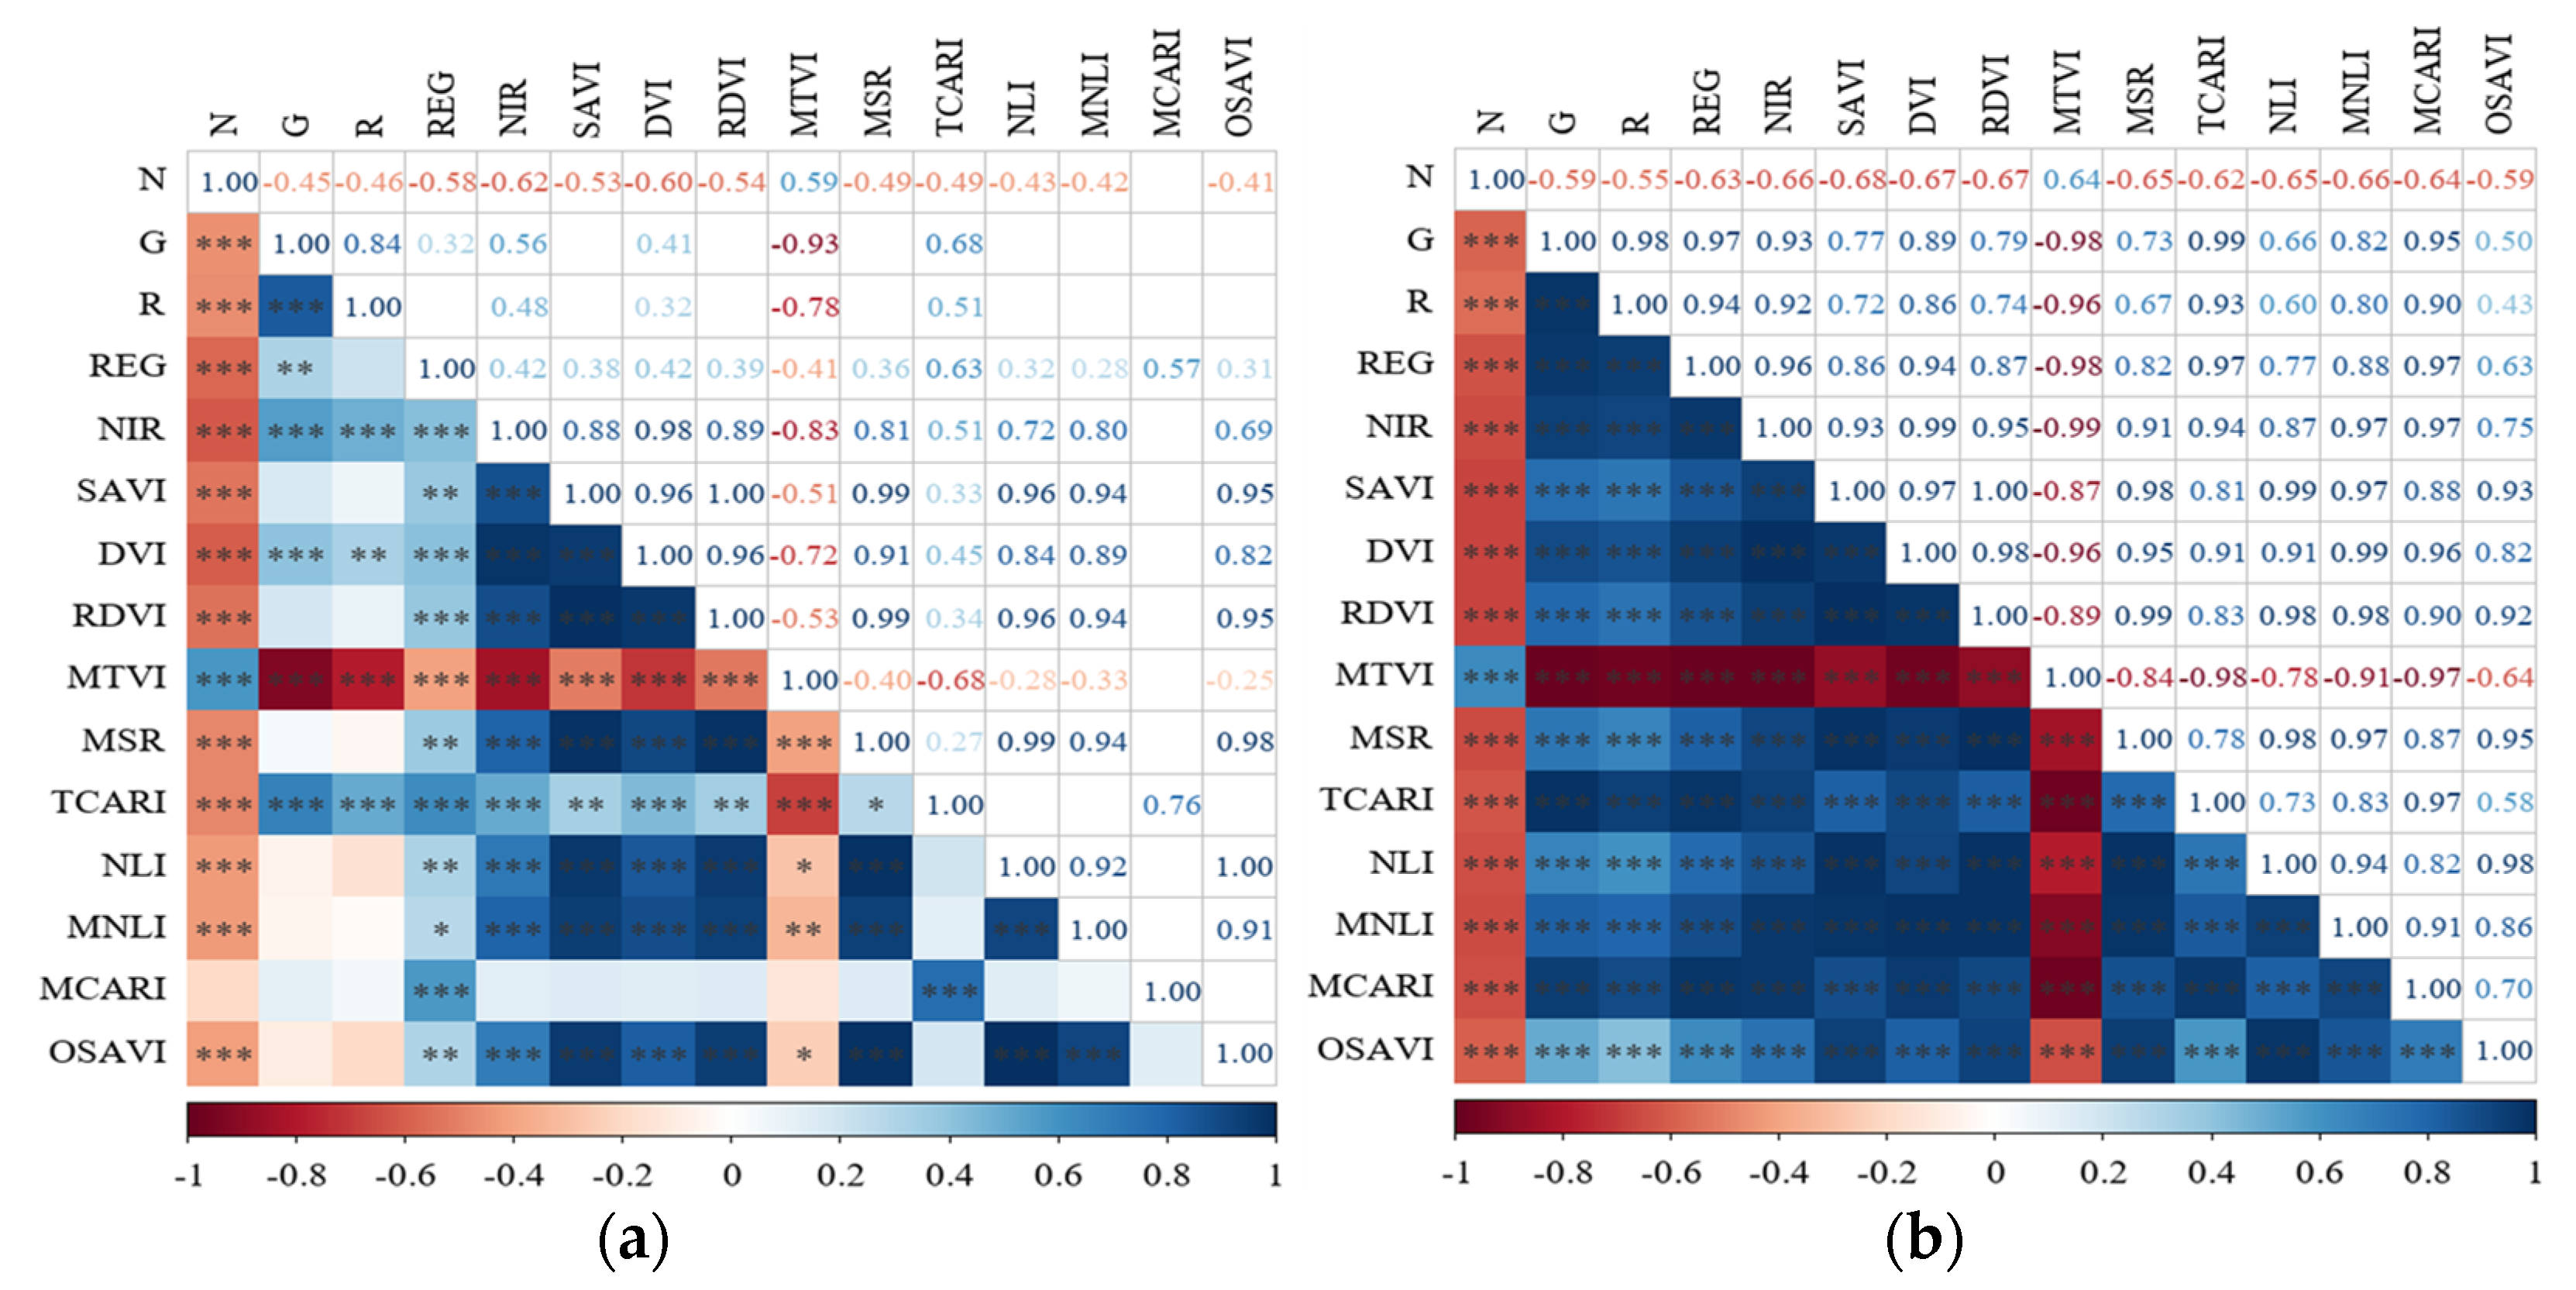
3.4. Results of Spectral Feature Parameters Screening

Figure 7 shows the heat map of the correlation coefficient (R) between each spectral feature parameter and the CNC before and after ground-space data fusion. The results showed that for the unfused data, except for MCARI, whose |R| with the CNC was <0.30, |R| of the rest of the feature parameters were >0.40, among which the absolute value of |R| of NIR reached the highest value of 0.62. For the fused data, |R| between each spectral feature parameter and the CNC was significantly improved, in which |R| of five spectral feature parameters, namely, NIR, SAVI, DVI, RDVI, and MNLI, with the CNC were >0.65. To facilitate the subsequent modeling inversion work, the NIR band and the five spectral feature parameters of RDVI, DVI, MTVI, and SAVI, which had a higher correlation with the CNC before and after the fusion of ground-space data, were finally selected as independent variables to participate in the model construction in this study.

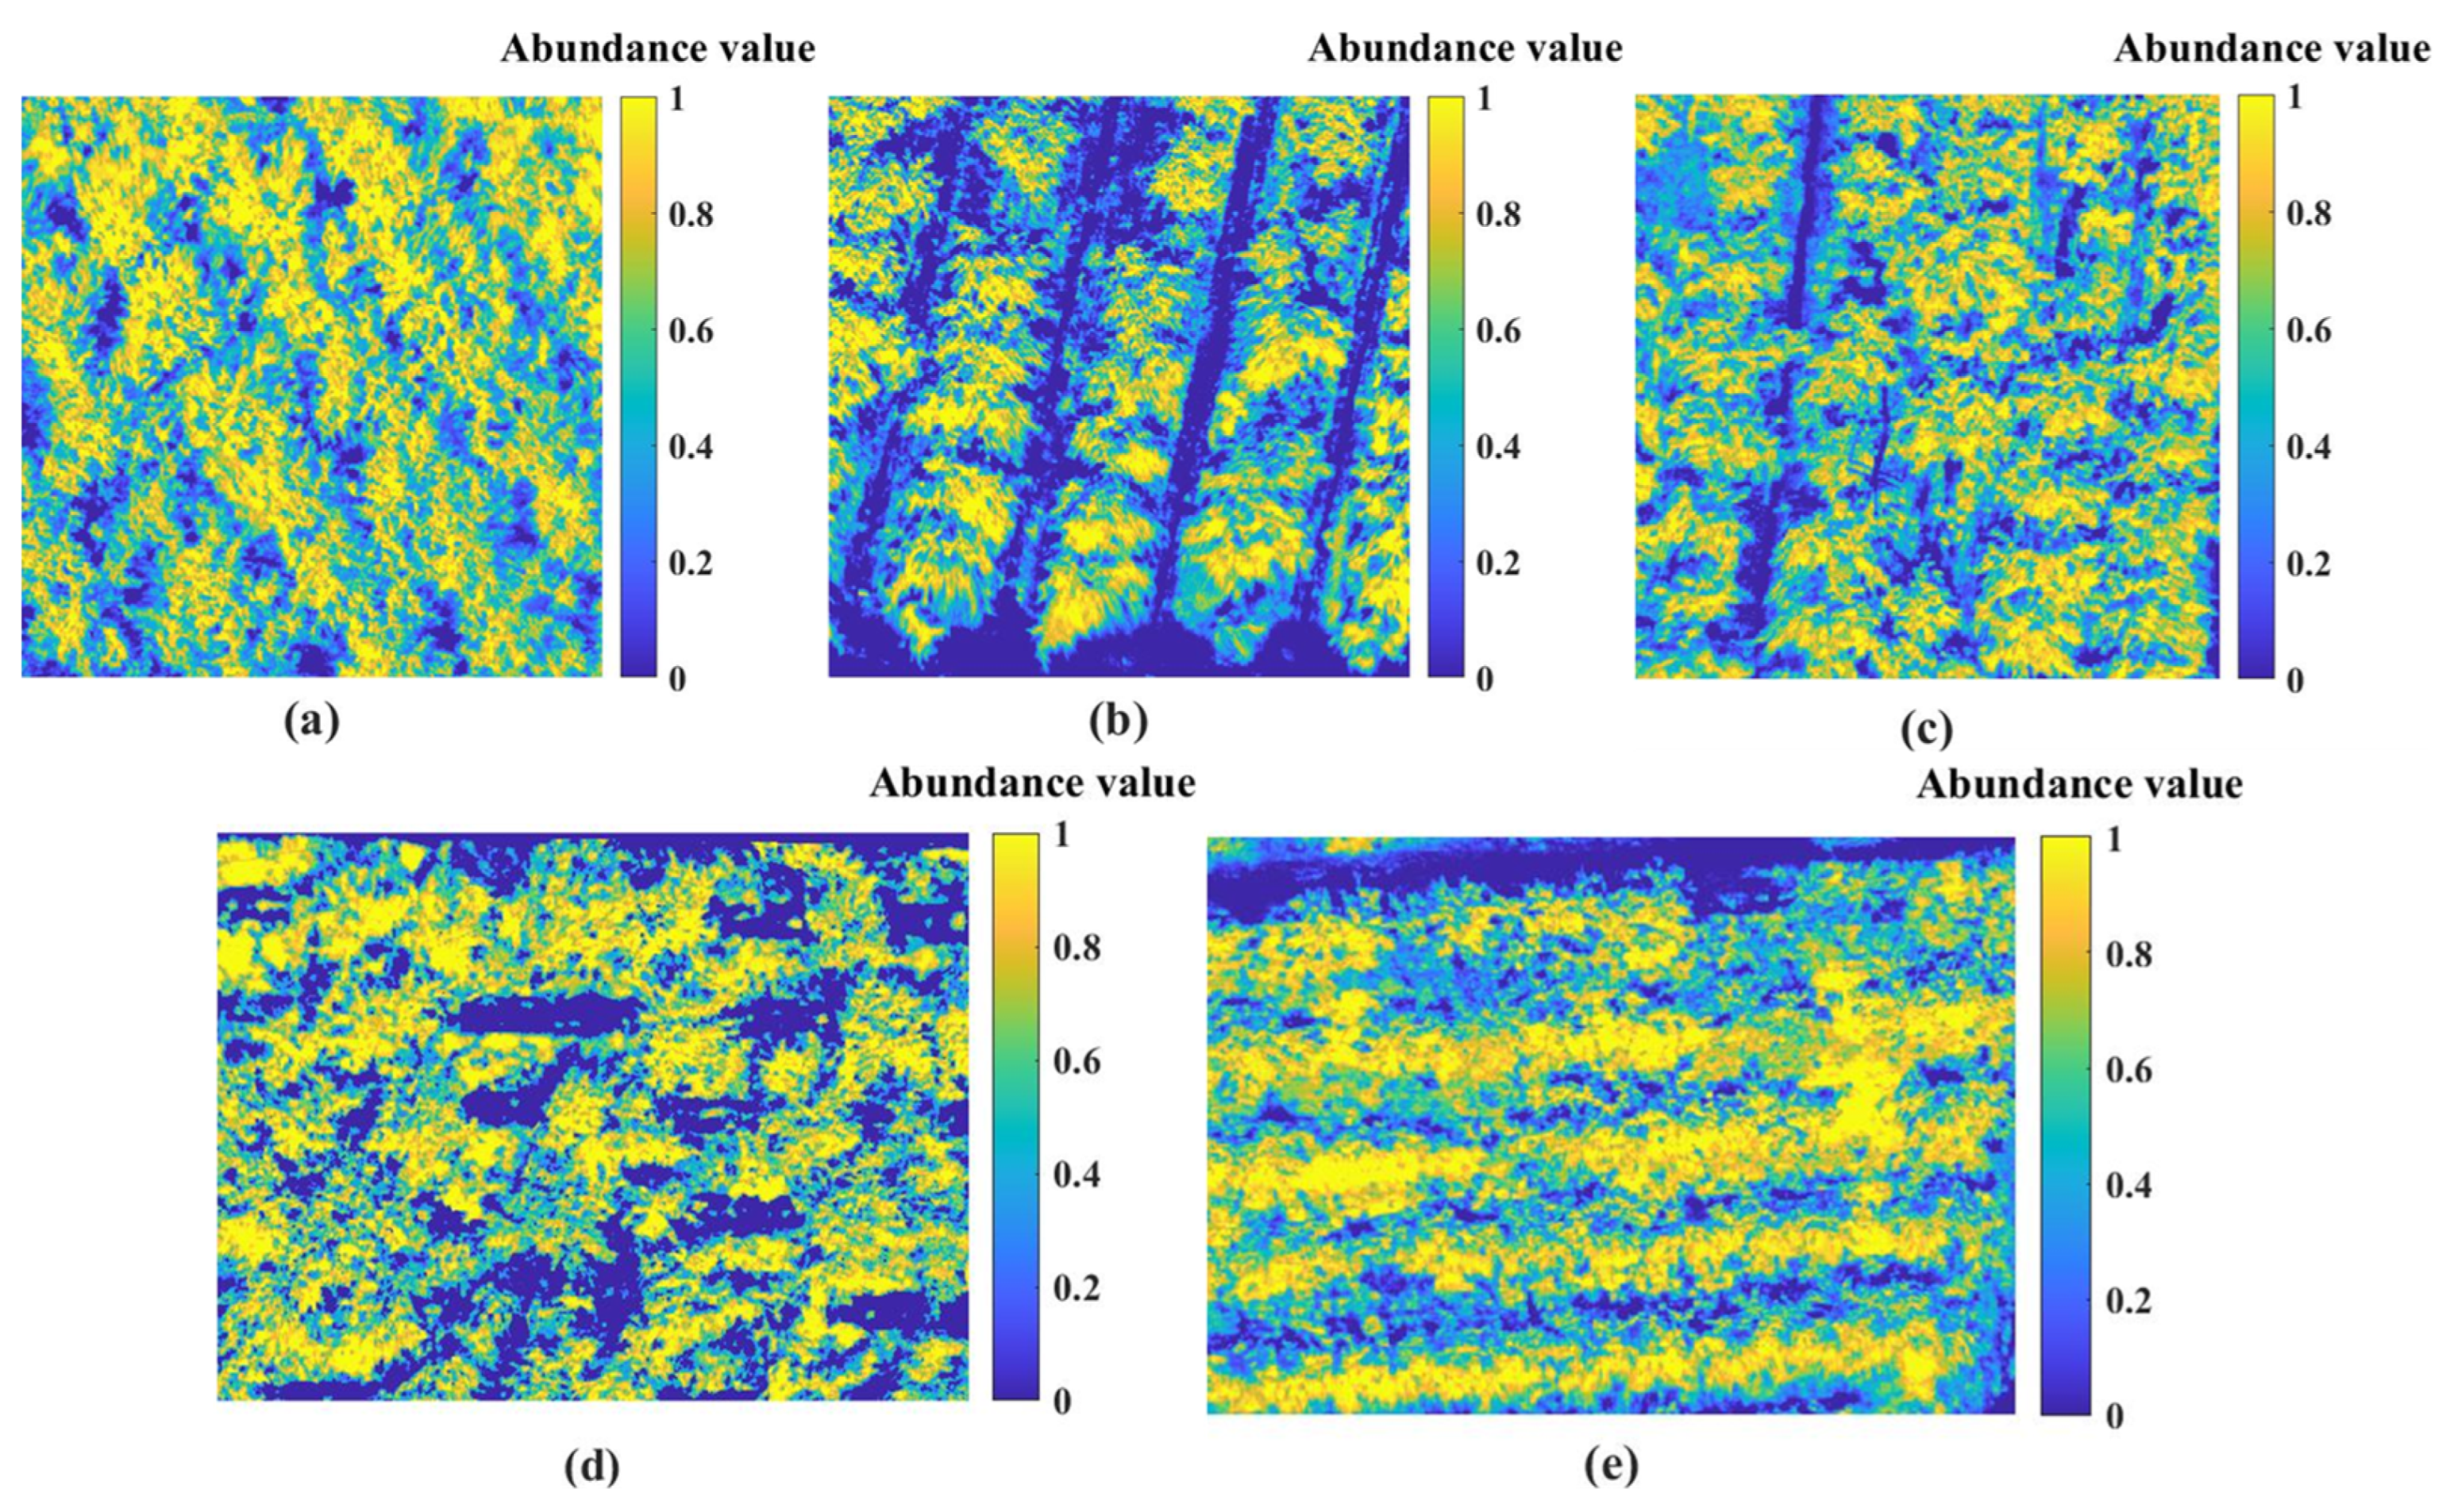
3.5. Construction of Apple Canopy Abundance Parameters Based on Data Fusion

The simulated multi-spectral data were substituted into the spectral mixture model as end-element spectra. Figure 8 shows the canopy abundance map of apple trees in each orchard, where each image value is the abundance value of the canopy spectrum in that image, taking the values between [0, 1]. The canopy corresponding to each sampling point was taken as the region of interest, and the canopy abundance values in the region of interest were averaged to represent the canopy abundance value corresponding to that sampling point.
Figure 9 shows the correlation analysis of canopy abundance value and corresponding CNC at each sampling point of five apple orchards. The results show that the R between canopy abundance values and CNC based on ground-space remote sensing data fusion = 0.751, which can be used as an independent variable to participate in the establishment and testing of the CNC inversion model.

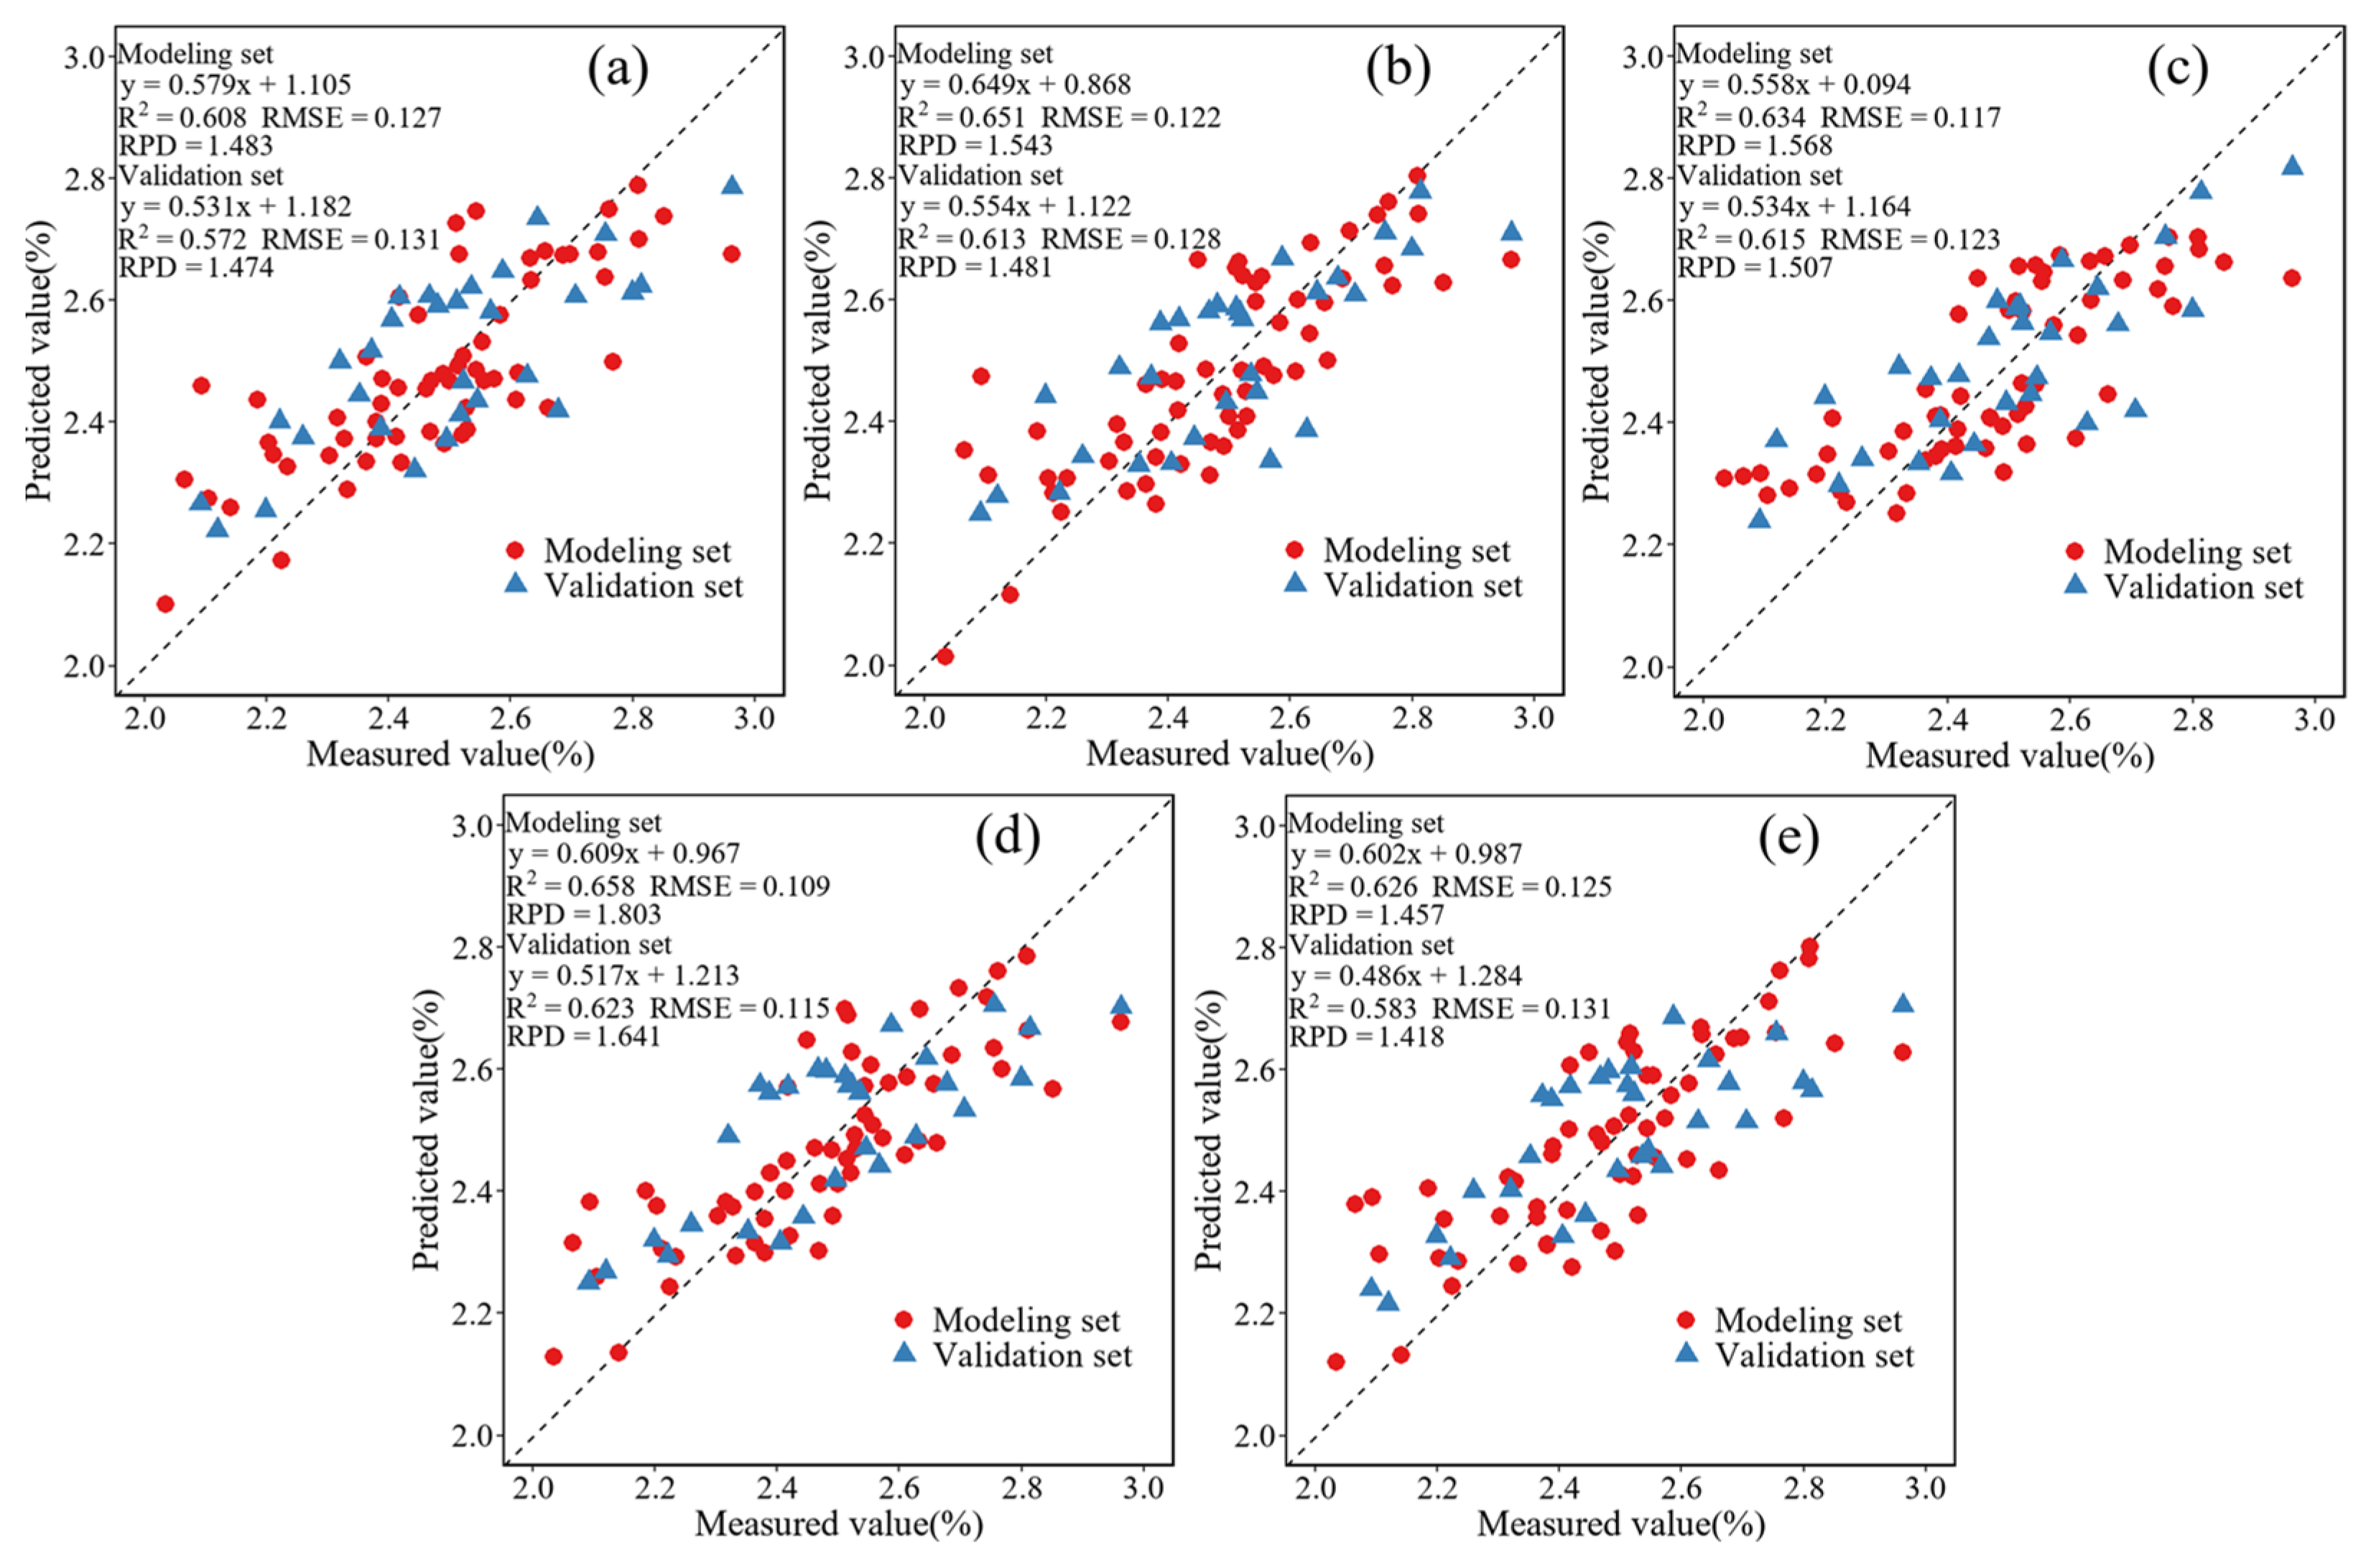
3.6. Selection of the CNC Optimal Inversion Model

To test the effects of the raw multi-spectral data, simulated multi-spectral data, and canopy abundance parameters based on the fused data on the accuracy of the model, the study investigated the following two main ideas for the selection of the independent variables. Firstly, the NIR bands before and after the fusion and the five spectral feature parameters, including RDVI, DVI, MTVI, and SAVI, were used as the independent variables; the second is the use of the five spectral feature parameters and canopy abundance parameters as independent variables. A total of five models, RBF-NN, ELM, RFR, XGBoost, and SVR, were used to invert the CNC.

3.6.1. Inversion Model of CNC Based on Raw Multi-Spectral Data

Figure 10 shows the inversion accuracy of the inversion model of CNC constructed based on the raw multi-spectral data, and the results showed that the R2 of the modeling set and the validation set of the five models, RBF-NN, ELM, RFR, XGBoost, and SVR, were all > 0.570. Among them, the R2 of the XGBoost model modeling set was 0.658, which was higher than other models; for the prediction set, the R2 of the five models were XGBoost > RFR > ELM > SVR > RBF-NN (0.623 > 0.615 > 0.613 > 0.583 > 0.572). The XGBoost model prediction set had RMSE = 0.115 and RPD = 1.641, which was a small model error, but not very stable.

3.6.2. Inversion Model of CNC Based on Simulated Multi-Spectral Data

Figure 11 shows the inversion accuracy of the inversion model of CNC constructed based on simulated multi-spectral data. The results show that compared with the model built before data fusion, the overall accuracy of the model constructed after data fusion was significantly improved, and the R2 of the modeling set grew from 0.608–0.658 to 0.634–0.716; moreover, the R2 of the XGBoost model validation set reached 0.672, and accordingly, the decrease in the value of the RMSE and the increase in the value of the RPD also corroborated the improvement of the modeling accuracy.

3.6.3. Inversion Model of CNC Based on Simulated Multi-Spectral Data and Canopy Abundance Parameters

Figure 12 shows the inversion accuracy of the inversion model of CNC constructed based on the simulated multi-spectral data and canopy abundance parameters, and the results showed that the R2 of both the modeling set and the prediction set were both > 0.630; the R2 of the prediction set of the XGBoost model = 0.759, RMSE = 0.098, and RPD = 1.855, which was the highest accuracy, and the model stability was strong.
Therefore, among the five machine learning models constructed based on the three different data sets, the XGBoost model had the highest accuracy and the strongest stability; among them, the XGBoost model built based on the simulated spectral data with canopy abundance parameters had the best inversion effect, the XGBoost model built based on the simulated spectral data had the second best inversion effect, and the model constructed based on the raw spectral data had the poorest. Therefore, the study selected the XGBoost model with canopy abundance parameters to perform spatial inversion mapping of CNC.

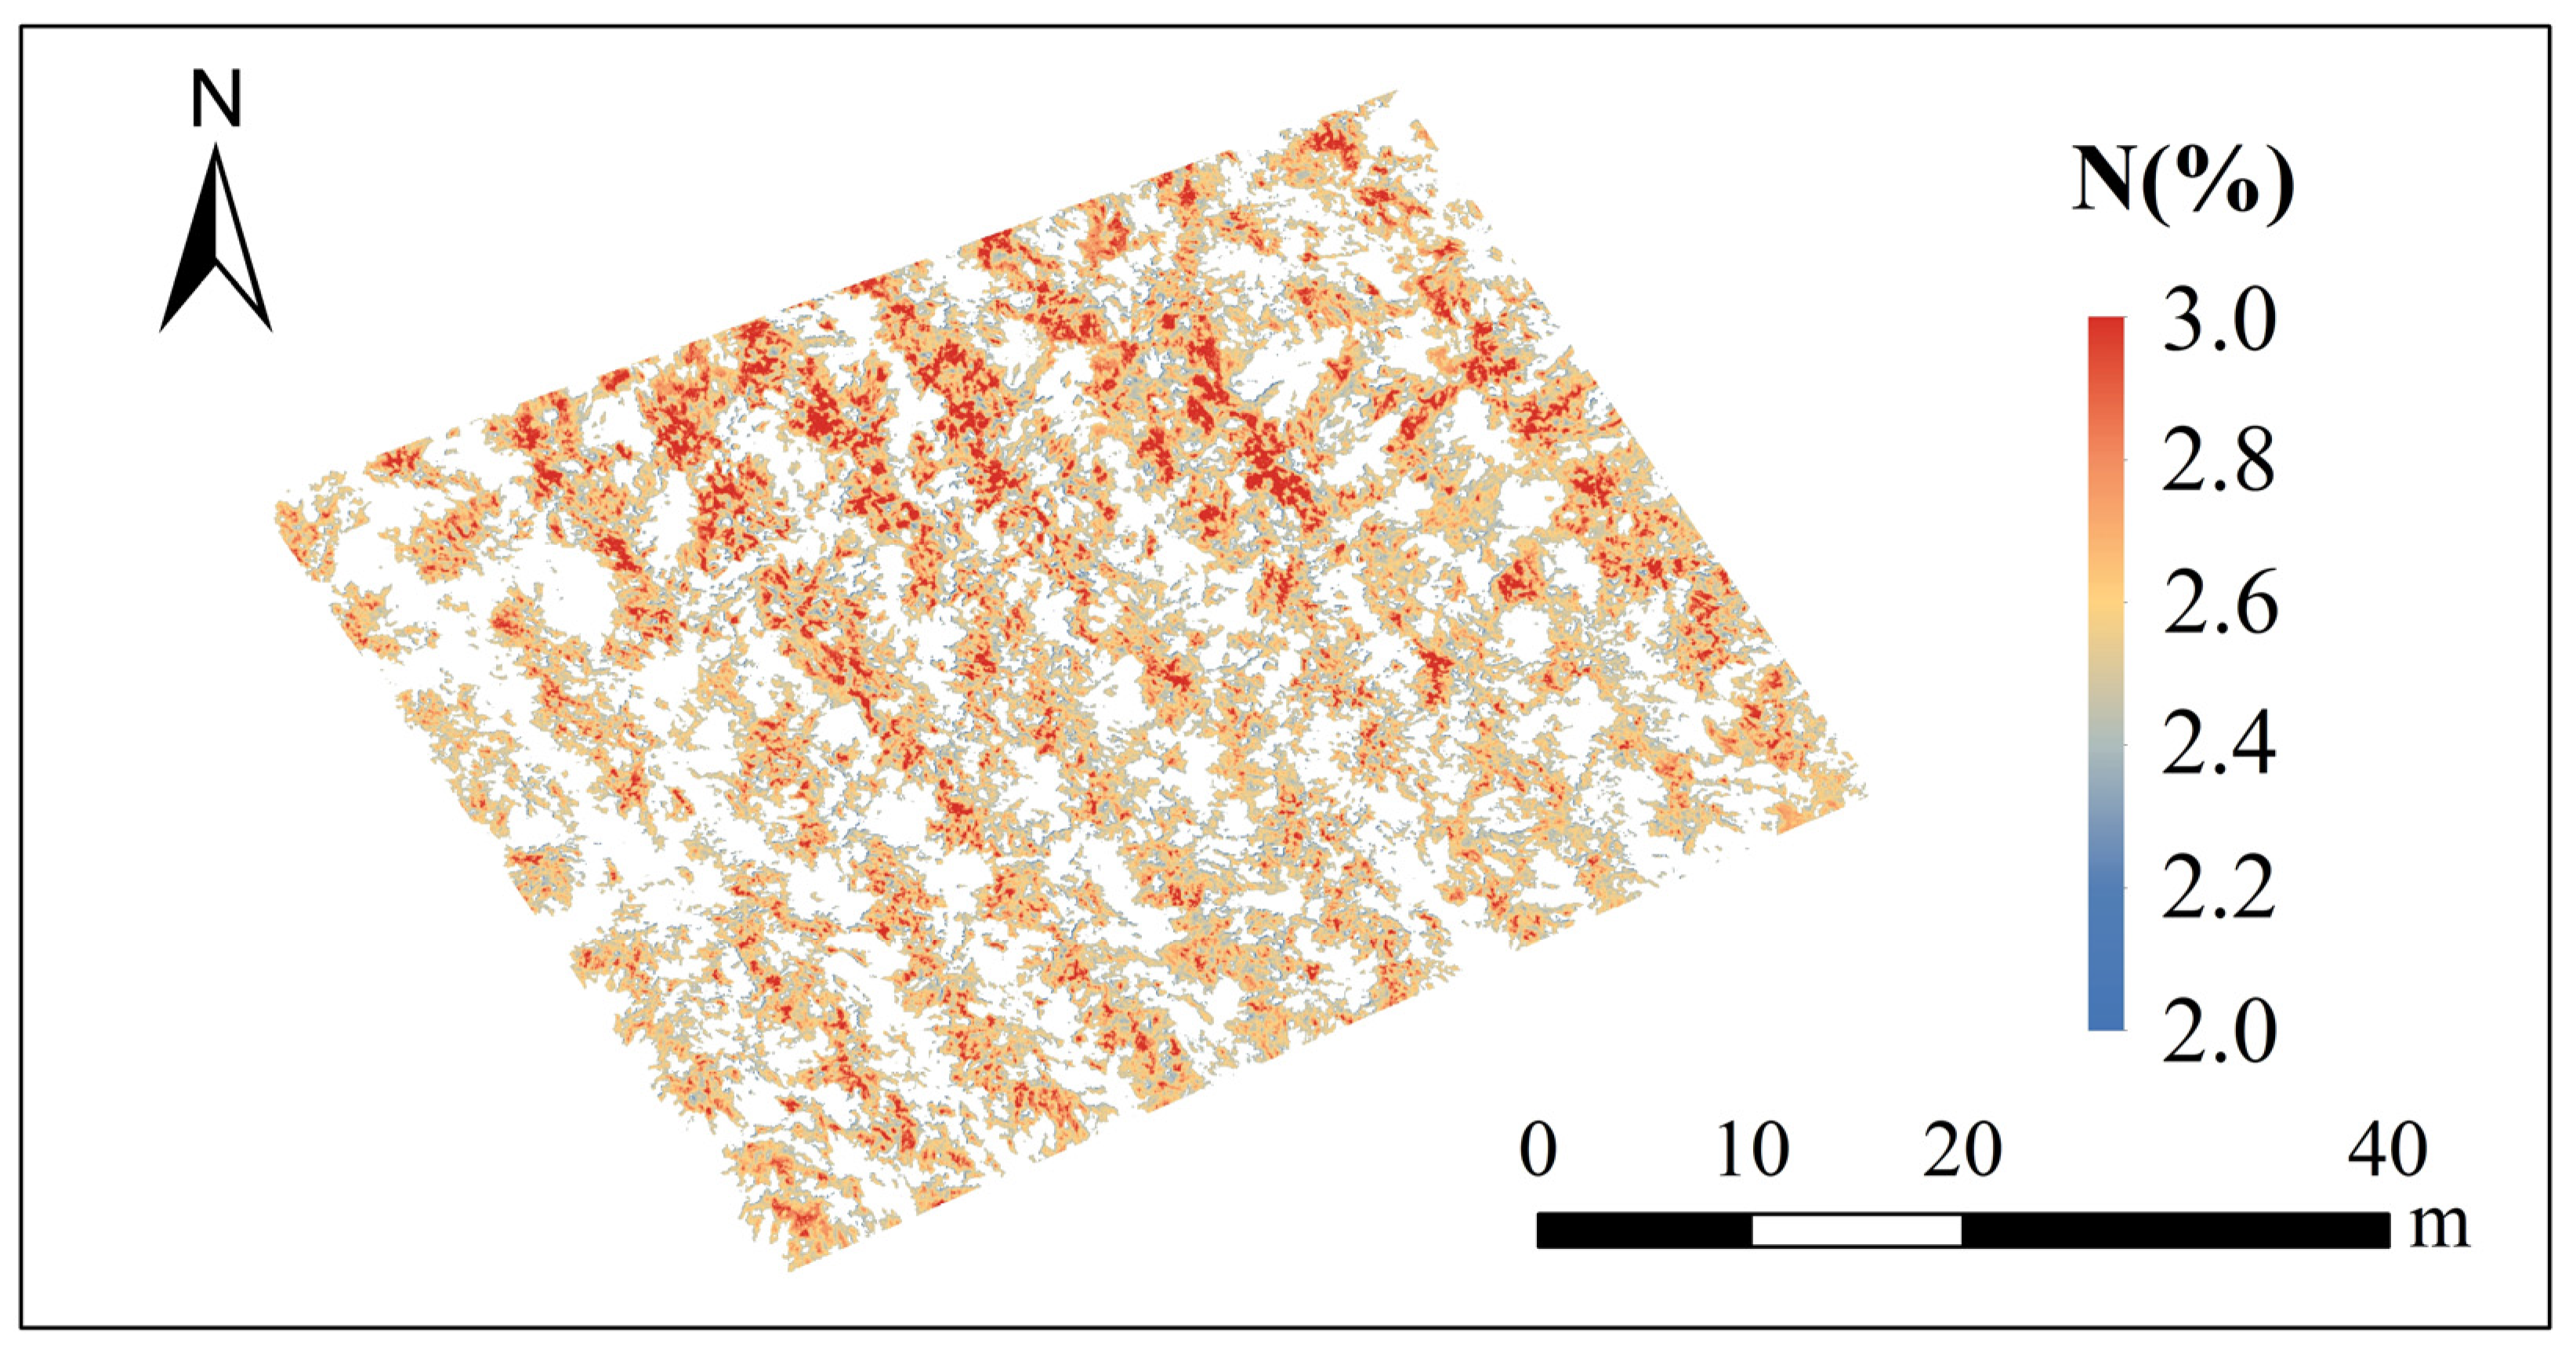
3.7. Spatial Inversion Mapping of CNC Based on Optimal Model

The optimal XGBoost model was applied to the UAV images for the spatial inversion of CNC. Figure 13 and Figure 14 show the distribution maps of CNC spatial inversion in Orchards 01 and 04, respectively, which verified the feasibility of spatial inversion of CNC based on ground-space remote sensing data fusion. It can be seen from the figures that the CNC is centrally distributed between 2.0% and 3.0%, and the distribution between rows is different, but the distribution difference is not obvious. For a single apple tree, the distribution of CNC is roughly high at the top of the canopy and low at the bottom.

4. Discussion

This study explored the feasibility of fusing ground-space remote sensing data for spatial inversion of CNC. We found that NN-SC can accurately extract canopy spectral information, and the simulated data obtained by SRF-CC had a high R2 and a good data fusion effect. The XGBoost model constructed based on the simulated data and canopy abundance parameters was the optimal model for the CNC inversion, and the spatial inversion results were consistent with the actual distribution.

4.1. Extraction of Spectral Information from Canopy Based on NN-SC

The accurate extraction of spectral information from the apple canopy is a prerequisite for the fusion of ground-space remote sensing data. In previous studies, the vegetation index threshold method was commonly used for extracting canopy spectral information [50,51], but it is too subjective to set the threshold only through simple visual interpretation, and it is too arduous to be entirely suitable for the extraction of spectral information in different ranges. Therefore, this study selected the NN-SC to accurately classify remote sensing images to determine the canopy range. Compared with the traditional method, the NN-SC was more rapid in calculation and had stronger robustness and fault tolerance [52,53]; in addition, categorized based on the real distribution points collected, which reduced the influence of subjective factors on the classification results. The final accuracy validation results also showed that the feature classification based on NN-SC had high accuracy, and the canopy spectral information was accurately extracted to accurately classify remote sensing images to determine the canopy range.

4.2. Ground-Space Remote Sensing Data Fusion Based on SRF-CC

In previous studies, hyper-spectral data or multi-spectral data were usually used alone for research work [54,55]. The hyper-spectral data has rich spectral information but is prone to produce data redundancy problems, and data dimensionality reduction and other steps will lead to an increase in workload; due to the discontinuity of wavelength, the complexity of multi-spectral data is low, and the amount of information is not rich enough. In addition, the complexity of the canopy structure of the fruit tree leads to the difficulty of a single data source to satisfy the demand for data fusion at the regional scale. This study utilized the SRF-CC to fuse hyper-spectral and multi-spectral data, and established a Quadratic Polynomial Model to achieve the fitting analysis between the raw and simulated spectral reflectance. The results showed that the R2 of the four bands of the raw and simulated spectral reflectance was >0.70, and the trend of spectral curve changes was consistent, which indicated that the SRF-CC was scientific and effective. However, there were some differences between the simulated spectral values generated by the fusion and the raw values, and some scholars [11,56,57] have found that such differences often had effects on the research results. Firstly, due to the uncertainty of remote sensing data, different sensors have different spectral response functions [58], and the use of SRF-CC for data fusion may result in the loss of spectral information. In addition, the Quadratic Polynomial Model used for data fitting cannot fully explore the inherent relationships between data, which leads to the data dispersion problem. Therefore, in the next step of the research, we should try to use more effective and accurate data feature mining methods to improve the accuracy of data fusion.

4.3. Construction of Canopy Abundance Parameters Based on Mixed Pixel Decomposition

The three-dimensional structure of apple canopy evacuation stratification usually leads to the influence of soil background and shadow on spectral information [59], the extraction of feature composition and abundance by mixed pixel decomposition [60] can accurately extract canopy abundance parameters and reduce the influence of mixed pixels on image interpretation. This study utilized the simulated standard spectral reflectance of the canopy and bare soil to perform the Unconstrained Least Squares Mixed Pixel Decomposition, and successfully extracted and constructed the canopy abundance parameters of apple trees. The canopy abundance parameters of each sample point were highly correlated with CNC, which could further explore the influence of canopy abundance parameters on the accuracy of CNC inversion.

4.4. Selection of the CNC Optimal Inversion Model

To further improve the accuracy of CNC inversion, five machine learning models, such as ELM and XGBoost, were constructed, and the results showed that the accuracy of the XGBoost model was the highest for the three sets of data; among them, the XGBoost model with the participation of the canopy abundance parameter had the best inversion effect. Due to the high light intensity at the top of the canopy leaves during the growth and development process, the chlorophyll concentration is higher, and the photosynthetic rate is higher than that at the bottom, and eventually, the nitrogen content at the top of the canopy is higher than that at the bottom [7], and the spatial inversion result of the CNC in this study are consistent with the actual distribution pattern. However, this study only combined remote sensing bands, vegetation index, and canopy abundance parameters to establish the model, and the stability and generalizability still need to be improved; in addition, there was a lack of research on the matching between the structure of the model algorithms and input variables [61,62]. In future research, improvement of the model algorithm structure and integration of multidimensional features such as remote sensing bands, spectral features, spatial texture, and crop parameters to participate in modeling will be considered to further improve the inversion accuracy.
In conclusion, the method of ground-space remote sensing data fusion proposed in this study has effectively improved the inversion accuracy of CNC. However, the experimental scope was only limited to the orchard scale and cannot verify the inversion effect in larger-scale regions; moreover, this study only used the data collected in the same period, which was not necessarily fully applicable to the data from different seasons and years. Therefore, in future studies, the applicability of the fusion method to county, city, provincial scales, and even larger scales should be further explored with satellite remote sensing data, and the expansion of the inversion area should be achieved by combining the upscale transformation method [63]. On the other hand, the data in different seasons and years differ due to various natural and anthropogenic factors, and multiple validations should be carried out by using multi-temporal data modification to improve the universality of the fusion method.

5. Conclusions

This study fused ground-space remote sensing data, simulated multi-spectral data from UAVs, and used the Unconstrained Least Squares-linear Spectral Mixing Model to obtain the abundance parameters of apple canopies. On this basis, the inversion model of CNC based on different remote sensing data was constructed and the optimal CNC inversion model was screened to realize the inversion of CNC in apple orchards. It was found that the SRF-CC was an effective method for the fusion of ground-space remote sensing data, and the simulated data fused by this method had a high R2 with the raw data in all four bands. The correlation between the spectral feature parameters constructed based on the simulated data and the CNC was improved compared with the raw data, in which the NIR band and RDVI, DVI, MTVI, and SAVI were more sensitive to the CNC. In addition, compared with other models, the XGBoost model based on simulated spectral data with the participation of canopy abundance parameters can more accurately invert the CNC; the inversion maps of the CNC of the apple orchard generated by the optimal model can better reflect the actual distribution of the CNC. The ground-space remote sensing data fusion method proposed in this study provides the theoretical basis and technical support for monitoring and precise management of canopy nutrient status at the orchard scale based on multi-source remote sensing data fusion.

Author Contributions

Conceptualization, C.Z., X.Z. and M.L.; methodology, C.Z., M.L. and Y.X.; formal analysis, C.Z., M.L. and A.Q.; writing—original draft preparation, C.Z.; writing—review and editing, C.Z., X.Z. and M.L.; visualization, C.Z., Y.X., G.G. and M.W.; supervision, Y.J. All authors have read and agreed to the published version of the manuscript.

Funding

This research was supported by the National Natural Science Foundation of China (42171378) and the Shandong Taishan Scholars Climbing Program.

Data Availability Statement

Not applicable.

Acknowledgments

We would like to thank the kind help of the editor and the reviewers to improve the manuscript.

Conflicts of Interest

The authors declare no conflict of interest.

References

  1. Liu, S.B.; Yang, G.J.; Jing, H.T.; Feng, H.K.; Li, H.L.; Chen, P.; Yang, W.P. Inversion of winter wheat nitrogen content based on UAV digital image. Trans. Chin. Soc. Agric. Eng. 2019, 35, 75–85. [Google Scholar]
  2. Meng, X.T.; Bao, Y.L.; Wang, Y.A.; Zhang, X.L.; Liu, H.J. An advanced soil organic carbon content prediction model via fused temporal-spatial-spectral (TSS) information based on machine learning and deep learning algorithms. Remote Sens. Environ. 2022, 280, 113–166. [Google Scholar] [CrossRef]
  3. Peng, Y.; Zhu, X.; Xiong, J.; Yu, R.; Liu, T.; Jiang, Y.; Yang, G. Estimation of Nitrogen Content on Apple Tree Canopy through Red-Edge Parameters from Fractional-Order Differential Operators using Hyperspectral Reflectance. J. Indian Soc. Remote Sens. 2020, 49, 377–392. [Google Scholar] [CrossRef]
  4. Chen, S.M.; Hu, T.T.; Luo, L.H.; He, Q.; Zhang, S.W.; Li, M.Y.; Cui, X.L.; Li, H.X. Rapid estimation of leaf nitrogen content in apple-trees based on canopy hyperspectral reflectance using multivariate methods. Infrared Phys. Technol. 2020, 111, 103542. [Google Scholar] [CrossRef]
  5. Ye, X.J.; Abe, S.; Zhang, S.H. Estimation and mapping of nitrogen content in apple trees at leaf and canopy levels using hyperspectral imaging. Precis Agric. 2020, 21, 198–225. [Google Scholar] [CrossRef]
  6. Chen, S.M.; Hu, T.T.; Luo, L.H.; He, Q.; Zhang, S.W.; Lu, J.S. Prediction of Nitrogen, Phosphorus, and Potassium Contents in Apple Tree Leaves Based on In-Situ Canopy Hyperspectral Reflectance Using Stacked Ensemble Extreme Learning Machine Model. J. Soil Sci. Plant Nutr. 2022, 22, 10–24. [Google Scholar] [CrossRef]
  7. Li, W.; Zhu, X.C.; Yu, X.Y.; Li, M.X.; Tang, X.Y.; Zhang, J.; Xue, Y.L.; Zhang, C.T.; Jiang, Y.M. Inversion of Nitrogen Concentration in Apple Canopy Based on UAV Hyperspectral Images. Sensors 2022, 22, 3503. [Google Scholar] [CrossRef]
  8. Sun, G.Z.; Hu, T.T.; Chen, S.H.; Sun, J.X.; Zhang, J.; Ye, R.R.; Zhang, S.W.; Liu, J. Using UAV-based multispectral remote sensing imagery combined with DRIS method to diagnose leaf nitrogen nutrition status in a fertigated apple orchard. Precis Agric. 2023. [Google Scholar] [CrossRef]
  9. Wang, L.; Zhao, G.X.; Zhu, X.C.; Wang, R.Y.; Chang, C.Y. Satellite remote sensing inversion of crown nitrogen nutrition of apple at flowering stage. Chin. J. Appl. Ecol. 2013, 24, 2863–2870. [Google Scholar]
  10. Sankey, J.B.; Sankey, T.T.; Li, J.; Ravi, S.; Wang, G.; Caster, J.; Kasprak, A. Quantifying plant-soil-nutrient dynamics in rangelands: Fusion of UAV hyperspectral-LiDAR, UAV multispectral-photogrammetry, and ground-based LiDAR-digital photography in a shrub-encroached desert grassland. Remote Sens. Environ. 2021, 253, 112–223. [Google Scholar] [CrossRef]
  11. Qi, G.H.; Chang, C.Y.; Yang, W.; Gao, P.; Zhao, G.X. Soil salinity inversion in coastal corn planting areas by the satellite-uav-ground integration approach. Remote Sens. 2021, 13, 3100. [Google Scholar] [CrossRef]
  12. Zhou, Y.J.; Liu, T.X.; Batelaan, O.; Duan, L.M.; Wang, Y.X.; Li, X.; Li, M.Y. Spatiotemporal fusion of multi-source remote sensing data for estimating aboveground biomass of grassland. Ecol. Indic. 2023, 146, 109892. [Google Scholar] [CrossRef]
  13. Sun, M.Y.; Li, Q.; Jiang, X.Z.; Ye, T.T.; Li, X.J.; Niu, B.B. Estimation of Soil Salt Content and Organic Matter on Arable Land in the Yellow River Delta by Combining UAV Hyperspectral and Landsat-8 Multispectral Imagery. Sensors 2022, 22, 3990. [Google Scholar] [CrossRef] [PubMed]
  14. Zhang, S.; Zhao, G. A Harmonious Satellite-Unmanned Aerial Vehicle-Ground Measurement Inversion Method for Monitoring Salinity in Coastal Saline Soil. Remote Sens. 2019, 11, 1700. [Google Scholar] [CrossRef]
  15. Wang, D.; Chen, H.; Wang, Z.; Ma, Y. Inversion of soil salinity according to different salinization grades using multi-source remote sensing. Geocarto Int. 2022, 37, 1274–1293. [Google Scholar] [CrossRef]
  16. Yang, C.; Lv, D.; Jiang, S.; Lin, H.; Sun, J.; Li, K.; Sun, J. Soil salinity regulation of soil microbial carbon metabolic function in the Yellow River Delta, China. Sci. Total Environ. 2021, 790, 148258. [Google Scholar] [CrossRef]
  17. Yang, L.; Cai, Y.Y.; Zhang, L.; Guo, M.; Li, A.Q.; Zhou, C.H. A deep learning method to predict soil organic carbon content at a regional scale using satellite-based phenology variables. Int. J. Appl. Earth Obs. 2021, 102, 102428. [Google Scholar] [CrossRef]
  18. Chen, H.Y.; Ma, Y.; Zhu, A.X.; Wang, Z.R.; Zhao, G.X.; Wei, Y.A. Soil salinity inversion based on differentiated fusion of satellite image and ground spectra. Int. J. Appl. Earth Obs. 2021, 101, 102360. [Google Scholar] [CrossRef]
  19. Chatterjee, S.; Hartemink, A.E.; Triantafilis, J.; Desai, A.R.; Soldat, D.; Zhu, J.; Townsend, P.A.; Zhang, Y.K.; Huang, J.Y. Characterization of field-scale soil variation using a stepwise multi-sensor fusion approach and a cost-benefit analysis. Catena 2021, 201, 105190. [Google Scholar] [CrossRef]
  20. Fernandez-Guisuraga, J.M.; Verrelst, J.; Calvo, L.; Suarez-Seoane, S. Hybrid inversion of radiative transfer models based on high spatial resolution satellite reflectance data improves fractional vegetation cover retrieval in heterogeneous ecological systems after fire. Remote Sens. Environ. 2021, 255, 112304. [Google Scholar] [CrossRef]
  21. Al-Ali, Z.M.; Bannari, A.; Rhinane, H.; El-Battay, A.; Shahid, S.A.; Hameid, N. Validation and Comparison of Physical Models for Soil Salinity Mapping over an Arid Landscape Using Spectral Reflectance Measurements and Landsat-OLI Data. Remote Sens. 2021, 13, 494. [Google Scholar] [CrossRef]
  22. Qi, G.H.; Chang, C.Y.; Yang, W.; Zhao, G.X. Soil salinity inversion in coastal cotton growing areas: An integration method using satellite-ground spectral fusion and satellite-UAV collaboration. Land Degrad Dev. 2022, 33, 2289–2302. [Google Scholar] [CrossRef]
  23. Shi, J.; Shen, Q.; Yao, Y.; Li, J.; Chen, F.; Wang, R.; Xu, W.; Gao, Z.; Wang, L.; Zhou, Y. Estimation of Chlorophyll-a Concentrations in Small Water Bodies: Comparison of Fused Gaofen-6 and Sentinel-2 Sensors. Remote Sens. 2022, 14, 229. [Google Scholar] [CrossRef]
  24. Li, M.X.; Zhu, X.C.; Li, W.; Tang, X.Y.; Yu, X.Y.; Jiang, Y.M. Retrieval of Nitrogen Content in Apple Canopy Based on Unmanned Aerial Vehicle Hyperspectral Images Using a Modified Correlation Coefficient Method. Sustainability 2022, 14, 1992. [Google Scholar] [CrossRef]
  25. Azadnia, R.; Rajabipour, A.; Jamshidi, B.; Omid, M. New approach for rapid estimation of leaf nitrogen, phosphorus, and potassium contents in apple-trees using Vis/NIR spectroscopy based on wavelength selection coupled with machine learning. Comput. Electron. Agric. 2023, 207, 107746. [Google Scholar] [CrossRef]
  26. Omia, E.; Bae, H.; Park, E.; Kim, M.S.; Baek, I.; Kabenge, I.; Cho, B.K. Remote Sensing in Field Crop Monitoring: A Comprehensive Review of Sensor Systems, Data Analyses and Recent Advances. Remote Sens. 2023, 15, 354. [Google Scholar] [CrossRef]
  27. Saez-Plaza, P.; Navas, M.J.; Wybraniec, S.; Michalowski, T.; Asuero, A.G. An Overview of the Kjeldahl Method of Nitrogen Determination. Part II. Sample Preparation, Working Scale, Instrumental Finish, and Quality Control. Crit. Rev. Anal. Chem. 2013, 43, 224–272. [Google Scholar] [CrossRef]
  28. Zhao, H.S.; Zhu, X.C.; Li, C.; Wei, Y.; Zhao, G.X.; Jiang, Y.M. Improving the Accuracy of the Hyperspectral Model for Apple Canopy Water Content Prediction using the Equidistant Sampling Method. Sci. Rep. 2017, 7, 11192. [Google Scholar] [CrossRef]
  29. Bai, X.Y.; Song, Y.Q.; Yu, R.Y.; Xiong, J.L.; Peng, Y.F.; Jiang, Y.M.; Yang, G.J.; Li, Z.H.; Zhu, X.C. Hyperspectral estimation of apple canopy chlorophyll content using an ensemble learning approach. Appl. Eng. Agric. 2021, 37, 505–511. [Google Scholar] [CrossRef]
  30. Yang, G.J.; Wan, P.; Yu, H.Y.; Xu, B.; Feng, H.K. Automatic radiation consistency correction for UAV multispectral images. Trans. Chin. Soc. Agric. Eng. 2015, 31, 147–153. [Google Scholar]
  31. Paliwal, M.; Kumar, U.A. Neural networks and statistical techniques: A review of applications. Expert Syst. Appl. 2009, 36, 2–17. [Google Scholar] [CrossRef]
  32. Gupta, R.; Nanda, S.J. Cloud detection in satellite images with classical and deep neural network approach: A review. Multimed Tools Appl. 2022, 81, 31847–31880. [Google Scholar] [CrossRef]
  33. Mann, D.; Joshi, P.K. Evaluation of Image Classification Algorithms on Hyperion and ASTER Data for Land Cover Classification. Proc. Natl. Acad. Sci. India Sect. A Phys. Sci. 2017, 87, 855–865. [Google Scholar] [CrossRef]
  34. Xu, H.Y.; Huang, W.X.; Si, X.L.; Li, X.; Xu, W.W.; Zhang, L.M.; Song, Q.J.; Gao, H.T. Onboard spectral calibration and validation of the satellite calibration spectrometer on HY-1C. Opt. Express 2022, 30, 27645–27661. [Google Scholar] [CrossRef]
  35. He, J.; Li, J.; Yuan, Q.; Li, H.; Shen, H. Spatial–Spectral Fusion in Different Swath Widths by a Recurrent Expanding Residual Convolutional Neural Network. Remote Sens. 2019, 11, 2203. [Google Scholar] [CrossRef]
  36. Shao, Z.F.; Cai, J.J. Remote Sensing Image Fusion With Deep Convolutional Neural Network. IEEE Trans. Geosci. Remote Sens. 2018, 11, 1656–1669. [Google Scholar] [CrossRef]
  37. Inoue, Y.; Sakaiya, E.; Zhu, Y.; Takahashi, W. Diagnostic mapping of canopy nitrogen content in rice based on hyperspectral measurements. Remote Sens. Environ. 2012, 126, 210–221. [Google Scholar] [CrossRef]
  38. Wang, L.; Peng, G.; Gregory, S. Individual tree-crown delineation and treetop detection in high-spatial-resolution aerial imagery. Photogramm. Eng. Remote Sens. 2004, 70, 351–357. [Google Scholar] [CrossRef]
  39. Haboudane, D.; Miller, J.R.; Pattey, E.; Zarco-Tejada, P.J.; Strachan, I.B. Hyperspectral vegetation indices and novel algorithms for predicting green LAI of crop canopies: Modeling and validation in the context of precision agriculture. Remote Sens. Environ. 2004, 90, 337–352. [Google Scholar] [CrossRef]
  40. Gong, P.; Pu, R.L.; Biging, G.S.; Larrieu, M.R. Estimation of forest leaf area index using vegetation indices derived from Hyperion hyperspectral data. IEEE Trans. Geosci. Remote Sens. 2003, 41, 1355–1362. [Google Scholar] [CrossRef]
  41. Li, X.C.; Xu, X.G.; Bao, Y.S.; Huang, W.J.; Luo, J.H.; Dong, Y.Y.; Song, X.Y.; Wang, J.H. Remote sensing inversion of leaf area index of winter wheat by selecting sensitive vegetation index based on subsection method. Sci. Agric. Sin. 2012, 45, 3486–3496. [Google Scholar]
  42. Bian, L.L.; Wang, J.L.; Guo, B.; Cheng, K.; Wei, H.S. Remote sensing extraction of soil salt in Kenli County of Yellow River Delta based on feature space. Remote Sens. Technol. Appl. 2020, 35, 211–218. [Google Scholar]
  43. Du, M.M.; Li, M.Z.; Noguchi, N.; Ji, J.T.; Ye, M.C. Retrieval of Fractional Vegetation Cover from Remote Sensing Image of Unmanned Aerial Vehicle Based on Mixed Pixel Decomposition Method. Drones 2023, 7, 43. [Google Scholar] [CrossRef]
  44. Pu, H.Y.; Chen, Z.; Wang, B.; Xia, W. Constrained Least Squares Algorithms for Nonlinear Unmixing of Hyperspectral Imagery. IEEE Trans. Geosci. Remote Sens. 2015, 53, 1287–1303. [Google Scholar] [CrossRef]
  45. Yang, J.; Du, L.; Cheng, Y.J.; Shi, S.; Xiang, C.Z.; Sun, J.; Chen, B.W. Assessing different regression algorithms for paddy rice leaf nitrogen concentration estimations from the first-derivative fluorescence spectrum. Opt. Express 2020, 28, 18728–18741. [Google Scholar] [CrossRef]
  46. Chen, X.; Li, F.; Shi, B.; Chang, Q. Estimation of Winter Wheat Plant Nitrogen Concentration from UAV Hyperspectral Remote Sensing Combined with Machine Learning Methods. Remote Sens. 2023, 15, 2831. [Google Scholar] [CrossRef]
  47. Zhang, Q.; Liu, M.; Zhang, Y.; Mao, D.; Li, F.; Wu, F.; Song, J.; Li, X.; Kou, C.; Li, C.; et al. Comparison of Machine Learning Methods for Predicting Soil Total Nitrogen Content Using Landsat-8, Sentinel-1, and Sentinel-2 Images. Remote Sens. 2023, 15, 2907. [Google Scholar] [CrossRef]
  48. Zhang, J.; Fu, Z.; Zhang, K.; Li, J.; Cao, Q.; Tian, Y.; Zhu, Y.; Cao, W.; Liu, X. Optimizing rice in-season nitrogen topdressing by coupling experimental and modeling data with machine learning algorithms. Comput. Electron. Agr. 2023, 209, 107858. [Google Scholar] [CrossRef]
  49. Gaston, E.; Frias, J.M.; Cullen, P.J.; O’Donnell, C.P.; Gowen, A.A. Prediction of Polyphenol Oxidase Activity Using Visible Near-Infrared Hyperspectral Imaging on Mushroom (Agaricus bisporus) Caps. J. Agric. Food Chem. 2010, 58, 6226–6233. [Google Scholar] [CrossRef]
  50. Jiang, H.; Wang, S.; Cao, X.J.; Yang, C.H.; Zhang, Z.M.; Wang, X.Q. A shadow-eliminated vegetation index (SEVI) for removal of self and cast shadow effects on vegetation in rugged terrains. Int. J. Digit. Earth 2019, 12, 1013–1029. [Google Scholar] [CrossRef]
  51. Liu, X.N.; Jiang, H.; Wang, X.Q. Extraction of mountain vegetation information based on vegetation distinguished and shadow eliminated vegetation index. Trans. Chin. Soc. Agric. Eng. 2019, 35, 135–144. [Google Scholar]
  52. Kuras, A.; Brell, M.; Rizzi, J.; Burud, I. Hyperspectral and Lidar Data Applied to the Urban Land Cover Machine Learning and Neural-Network-Based Classification: A Review. Remote Sens. 2021, 13, 3393. [Google Scholar] [CrossRef]
  53. Chang, L.Y.; Li, D.R.; Hameed, M.K.; Yin, Y.L.; Huang, D.F.; Niu, Q.L. Using a Hybrid Neural Network Model DCNN-LSTM for Image-Based Nitrogen Nutrition Diagnosis in Muskmelon. Horticulturae 2021, 7, 489. [Google Scholar] [CrossRef]
  54. Li, H.J.; Li, J.Z.; Lei, Y.P.; Zhang, Y.M. Diagnosis of nitrogen nutrition in wheat and maize by aerial photography with digital camera. Chin. J. Eco-Agric. 2017, 25, 1832–1841. [Google Scholar]
  55. Li, C.C.; Chen, P.; Lu, G.Z.; Ma, C.Y.; Ma, X.X.; Wang, S.T. Inversion of nitrogen balance index of typical growth period of soybean based on UAV high-definition digital images and hyperspectral remote sensing data. Chin. J. Appl. Ecol. 2018, 29, 1225–1232. [Google Scholar]
  56. Youme, O.; Bayet, T.; Dembele, J.; Cambier, C. Deep Learning and Remote Sensing: Detection of Dumping Waste Using UAV. Procedia Comput. Sci. 2021, 185, 361–369. [Google Scholar] [CrossRef]
  57. Azarang, A.; Kehtarnavaz, N. Image fusion in remote sensing by multi-objective deep learning. Int. J. Remote Sen. 2020, 41, 9507–9524. [Google Scholar] [CrossRef]
  58. Deng, L.; Mao, Z.H.; Li, X.J.; Hu, Z.W.; Duan, F.Z.; Yan, Y.N. UAV-based multispectral remote sensing for precision agriculture: A comparison between different cameras. Isprs. J. Photogramm. 2018, 146, 124–136. [Google Scholar] [CrossRef]
  59. Li, M.X.; Zhu, X.C.; Bai, X.Y.; Peng, Y.F.; Tian, Z.Y.; Jiang, Y.M. Remote sensing inversion of nitrogen content in apple canopy based on shadow removal from unmanned aerial vehicle images. Sci. Agric. Sin. 2021, 54, 2084–2094. [Google Scholar]
  60. Yu, R.; Zhu, X.; Bai, X.; Tian, Z.; Jiang, Y.; Yang, G. Inversion reflectance by apple tree canopy ground and unmanned aerial vehicle integrated remote sensing data. J. Plant Res. 2021, 134, 729–736. [Google Scholar] [CrossRef]
  61. Guo, L.; Zhang, H.T.; Shi, T.Z.; Chen, Y.Y.; Jiang, Q.H.; Linderman, M. Prediction of soil organic carbon stock by laboratory spectral data and airborne hyperspectral images. Geoderma 2019, 337, 32–41. [Google Scholar] [CrossRef]
  62. Bao, Y.L.; Ustin, S.; Meng, X.T.; Zhang, X.L.; Guan, H.X.; Qi, B.S.; Liu, H.J. A regional-scale hyperspectral prediction model of soil organic carbon considering geomorphic features. Geoderma 2021, 403, 115263. [Google Scholar] [CrossRef]
  63. Hao, D.L.; Xiao, Q.; Wen, J.G.; You, D.Q.; Wu, X.D.; Lin, X.W.; Wu, S.B. Research progress of upscaling conversion methods for quantitative remote sensing. Remote Sens. 2018, 22, 408–423. [Google Scholar]
Figure 1. Location of the study area and the experimental area (ID 01–05).
Horticulturae 09 01085 g001
Figure 2. Ground hyper–spectral reflectance average curves: (a) enlarged view of localized details in the G–R band; (b) enlarged view of localized details in the REG–NIR band.
Horticulturae 09 01085 g002
Figure 3. UAV multi–spectral reflectance average curves of apple canopy: (a) enlarged view of localized details in the G–R band; (b) enlarged view of localized details in the REG–NIR band.
Horticulturae 09 01085 g003
Figure 4. Details of fruit tree canopy extraction: (a) details of canopy extraction for single fruit tree in Orchard 01; (b) details of canopy extraction for single fruit tree in Orchard 02; (c) details of canopy extraction for single fruit tree in Orchard 03; (d) details of canopy extraction for single fruit tree in Orchard 04; (e) details of canopy extraction for single fruit tree in Orchard 05.
Horticulturae 09 01085 g004
Figure 5. Comparison of reflectance between simulated spectrum and raw spectrum of UAVs.
Horticulturae 09 01085 g005
Figure 6. The R2 of the raw UAV spectral reflectance and the simulated UAV spectral reflectance based on the SRF−CC: (a) G band; (b) R band; (c) REG band; (d) NIR band.
Horticulturae 09 01085 g006
Figure 7. Heat map of R between feature parameters and CNC before and after ground–space data fusion: (a) before data fusion; (b) after data fusion. The asterisk denote the significance levels, where * 0.05; ** 0.01; *** 0.001.
Horticulturae 09 01085 g007
Figure 8. The apple canopy abundance maps of Orchards: (a) Orchard 01; (b) Orchard 02; (c) Orchard 03; (d) Orchard 04; (e) Orchard 05.
Horticulturae 09 01085 g008
Figure 9. Correlation between CNC and canopy abundance value.
Horticulturae 09 01085 g009
Figure 10. Precision of CNC inversion model based on raw multi-spectral data: (a): RBF−NN, (b): ELM, (c): RFR, (d): XGBoost, (e): SVR.
Horticulturae 09 01085 g010
Figure 11. Precision of CNC inversion model based on simulated multi-spectral data: (a): RBF−NN, (b): ELM, (c): RFR, (d): XGBoost, (e): SVR.
Horticulturae 09 01085 g011
Figure 12. Precision of CNC inversion model based on simulated multi-spectral data and canopy abundance parameters: (a): RBF−NN, (b): ELM, (c): RFR, (d): XGBoost, (e): SVR.
Horticulturae 09 01085 g012
Figure 13. Inversion map of CNC in Orchard 01.
Horticulturae 09 01085 g013
Figure 14. Inversion map of CNC in Orchard 04.
Horticulturae 09 01085 g014
Table 1. Statistical indices of the CNC.
DatasetSamplesMax (%)Min (%)Avg (%)SDCV (%)
Total902.963 2.035 2.483 0.2058.256
Modeling Set602.963 2.035 2.478 0.2068.313
Validation Set302.963 2.091 2.493 0.2078.303
Note: Max, Min, Avg, SD, and CV represent the maximum, minimum, average, standard deviation, and coefficient of variations in apple CNC, respectively.
Table 2. Spectral feature parameters and formulas.
Variable GroupSpectral Feature ParametersFormula
Remote sensing bandsG/
R
REG
NIR
Vegetation indicesDifference Vegetation Index (DVI) R N I R R R
Renormalized Difference Vegetation Index (RDVI) ( R N I R R R ) / R N I R + R R
Soil-Adjusted Vegetation Index (SAVI) 1.5 ( R N I R R R ) / ( R N I R + R R + 0.5 )
Transformed Chlorophyll Absorption in Reflectance Index (TCARI)3[( R R E G R G ) 0.2( R R E G R G )( R R E G / R G )]
Modified Chlorophyll Absorption in Reflectance Index (MCARI)[( R R E G R R ) 0.2( R R E G R G )]( R R E G R R )
Modified Triangular Vegetation Index (MTVI)1.2[1.2( R N I R R G ) 2.5( R R R G )]
Modified Non-Linear Index (MNLI)(1.5 R N I R 2 1.5 R G ) / ( R N I R 2 + R R + 0.5)
Optimized Soil Adjusted Vegetation Index (OSAVI)1.16( R N I R R R ) / ( R N I R + R R + 0.16)
Improved Simple Ratio Vegetation Index (MSR)( R N I R / R R 1 ) / ( R N I R / R R + 1)
Nonlinear Vegetation index (NLI)( R N I R 2 R 2 ) / ( R N I R 2 + R R )
Note: R is spectral reflectance.
Table 3. Accuracy evaluation results of apple orchard ground feature classification.
Orchard IDOverlay Accuracy (%)Kappa Coefficient
0193.4100.888
0295.1320.905
0396.3710.923
0492.9680.861
0595.7630.897
Disclaimer/Publisher’s Note: The statements, opinions and data contained in all publications are solely those of the individual author(s) and contributor(s) and not of MDPI and/or the editor(s). MDPI and/or the editor(s) disclaim responsibility for any injury to people or property resulting from any ideas, methods, instructions or products referred to in the content.

