1. Introduction
Strawberry demand is increasing in the fruit and vegetable market around the world, thanks to consumers who are looking for more high-quality fruits in terms of taste, appearance, and nutritional compounds. Strawberries are non-climacteric fruits, so they must be harvested at near-perfect ripeness to ensure the best quality in terms of flavor and firmness. At present, strawberries for sale are graded according to external qualities, such as uniform distribution, bright red color, shape, absence of surface defects, and size, but internal quality parameters, such as taste, sweetness, and sourness, are also fundamental for determining the quality of fruits, and they strongly influence the evaluation by end consumers [
1]. However, due to their delicate structure and high metabolic rate during storage, strawberries are characterized by a very short shelf life and high susceptibility to tissue damage and infection, mainly by various plant pathogens [
2]. The main pathogen affecting strawberries in post-harvest is
Botrytis cinerea, which is the causative agent of gray mold, followed by
Penicillium spp.,
Colletotrichum spp.,
Mucor spp., and
Rhizopus stolonifer [
3]. Post-harvest diseases caused by these pathogens are the result of latent infections initiated in the field during the growing season and infections caused by injuries during harvesting and handling [
4]. Early detection of fruit affected by the fungus is of great importance both for producers and consumers. Fungal contamination poses a particular danger to packers during storage, transportation, and distribution. This is because even a very small number of infected fruits can spread the infection to neighboring healthy strawberries to cause food loss and less safe products. Some fungal genera and species can produce mycotoxins that cause allergies and infections in susceptible individuals [
5].
The traditional methods to determine the qualitative characteristics of fruits and fungal infection are mainly destructive. On the one hand, clear and reliable information is guaranteed, while on the other hand, there are various limitations regarding the amplitude of the products that can be analyzed, due to the time and cost required for analysis. In fact, destructive methods are not applicable to the entire production batch, but only to a certain representative number of fruits. Destructive methods for measuring these parameters are described in many studies. Sweetness is usually measured with a manual or automatic refractometer and is generally determined by the content of soluble solids (SSC), which is expressed in units of °Brix [
6,
7]. Mycotoxin contamination and fungal infection are commonly measured through several physicochemical and/or microbiological techniques (mass spectrometry, gas and liquid chromatography) [
8]. In the last few years, researchers have been increasingly looking for non-destructive and fast analytical technologies, especially those based on optical properties [
9,
10]. This allows real-time evaluation and analysis of a wider range of samples and requires minimal sample preparation [
11].
In recent years, various optical methodologies have been successfully applied to evaluate quality parameters, such as firmness, acidity, and soluble solids [
12,
13,
14,
15]. Among these methods, near infrared spectroscopy (NIR) is a valuable alternative. This technique uses the infrared region of the electromagnetic spectrum to non-destructively study the chemical and physical properties of the samples. Indeed, chemical bonds (NH-, CH-, and OH- groups) in molecules vibrate differently and at different energy levels depending on the molecular structure of the analyzed sample [
16]. This technology has already been applied in various fields, such as industry [
17], pharmaceuticals [
18], energy [
19,
20], and the food industry [
21,
22]. Spectroscopic techniques produce datasets containing a high amount of data and information, which can be highly exploited using multivariate data analysis techniques or chemometrics. Furthermore, chemometrics can be used to handle effects common in spectroscopic techniques, such as peak shifts, interfering signals, and baseline shifts [
23].
To the best of our knowledge, a number of studies have recently been carried out to evaluate the organoleptic and nutritional quality of strawberries using near infrared spectroscopy. The main disadvantage of these studies is that the number of selected fruits is usually limited, which can reduce the accuracy of the developed predictive models [
24]. In addition, only a few cultivars are usually tested (only one in some cases) they mostly employ different types of sample treatments (e.g., different pesticide treatments, different culture systems, different post-harvest storage conditions), and several quality parameters are taken into account at the same time [
25,
26,
27].
In this context, the first aim of this work was to characterize a key qualitative characteristic, such as soluble solids content, in five strawberry genotypes for two consecutive harvest seasons using traditional destructive methods and NIR spectroscopy in order to develop a regression model for the prediction of the considered parameter. In particular, partial least squares regression (PLS) models have been developed using data from the two harvesting seasons (2020 and 2021), and different variable selection techniques have been applied to the pretreated dataset in order to improve the prediction models. The introduction of non-destructive phenotyping methods makes it possible to monitor quality parameters, ensure fruit quality before the sale, and develop predictive models to speed up the selection process. A second aim of this study was to evaluate the relationship between strawberry sugar composition and susceptibility/tolerance to Botrytis cinerea. For this purpose, fruits of the same genotypes were also subjected to controlled in vitro infection, and their tolerance/susceptibility to this pathogen was monitored and measured for 5 consecutive days. Taken together, the two aims of this study will reveal if there is any relationship between the sugar content and the tolerance/susceptibility of strawberry fruits, and if it will be possible to build a prediction model for the SSC of strawberry fruits through non-destructive NIRS technique. The final goal was the prediction of strawberry SSC and, consequently, its tolerance or susceptibility to B. cinerea infection, without destroying the fruits.
2. Materials and Methods
2.1. Plant Material
The qualitative parameters assessment was performed on five strawberry cultivars: Cristina, Romina, Sibilla, Silvia (in the 2020 harvest season), and Sveva (only in the 2021 harvest season). The analyzed strawberries were cultivated at the Didactic and Experimental Farm Center for Agricultural Research “P. Rosati”, Agugliano (AN, Italy, 43_320N–13_220E) during the 2019–2020 season (4 cultivars) and during the 2020–2021 season (5 cultivars). The cultivation method used cold-stored “A” type plants planted in an open field at the end of July, with 8 plots of each genotype, for a total of 32 plants of each genotype. This experimental design allows us to standardize the natural variation in fruit parameters depending on the location of the plot in the field. The precocity index (PI), defined as the average of the weighted days needed to collect the whole production of a cultivar from January 1 for each genotype in 2020 and 2021, is reported in
Table 1. From each plot, 15 fruits were selected, for a total of 60 fruits of each genotype, which were sent to the laboratory for analysis. The fruits were collected on two harvest dates, for a total of 120 fruits per genotype. The fruits were carefully processed, individually numbered, and divided into two groups: Control (not infected with
B. cinerea spores) and Treated (infected with
B. cinerea spores). Then, fruits were subjected to an external check of the
B. cinerea infection level through the McKinney index for five consecutive days (starting from harvest day, which corresponded to day 0 and coincided with Mondays) and analyzed one by one by means of NIR spectroscopy (the non-destructive method). Then, the fruits were frozen separately and analyzed one by one after a few days for soluble solids content, given that the extraction of more juice from thawed fruits is easier.
2.2. Soluble Solids Content Analysis
The soluble solids content (SSC) of each fruit was measured using an automatic temperature-compensated digital refractometer (Palette PR101, Atago, Tokyo, Japan). For this analysis, frozen fruits, which were previously analyzed by NIR, were thawed one by one and pressed to extract the juice. A few drops of this juice were placed on the surface of a refractometer slide, and the °Brix value for each fruit was measured twice [
12].
2.3. Botrytis Cinerea Infection
The
B. cinerea level of infection of the fruit of the different cultivars was assessed by using the method described by Siedliska et al. [
28]. Before inoculation,
B. cinerea was cultured on agar for two weeks at room temperature. The fungal conidia were scraped off the surface of the agar with a sterile glass rod in a small volume of sterile water and diluted to a concentration of approximately 10
6 mL
−1 spores.
During inoculation, strawberry fruits of tested cultivars were immersed in
B. cinerea spore solutions (concentration 10
6 spores mL
−1) or sterile distilled water, for the Control, for 30 s and dried at room temperature in an air chamber. Throughout the experiment (5 days), from day 0 (D0) to day 4 (D4), the Treated and Control fruits were stored in a dark room at a relative humidity of 90% and a temperature of 20 ± 1 °C [
29,
30].
The severity of damage was recorded on a 6-point empirical scale according to the surface of fruit that was infected: 0, healthy fruit; 1, 1% to 20%; 2, 21% to 40%; 3, 41% to 60%; 4, 61% to 80%; 5, more than 81% of the fruit surface was infected and sporulated. The decay index, or McKinney index (MKI) was calculated from the following equation [
31]
After daily evaluation, fruits were stored at −80 °C for analysis of the SSC.
2.4. NIR Analysis
In this study, the analysis was performed with a Fourier transform (FT) NIR spectrophotometer (FT-NIR mod. Nicolet iS10, Thermo, Waltham, MA, USA), equipped with an integrative sphere. The spectra were acquired in the near infrared range, namely from 10,000 to 4000 cm−1. The analysis was performed using a continuous flow of nitrogen, which was aimed at minimizing the moisture content in the instrument during the assessment and reducing the variability of the spectral analysis. Each spectrum was recorded at 8 cm−1 resolution, and averaged 32 scans, which resulted in 1557 absorbance data. The background spectrum was scanned hourly to reflect the entire electromagnetic signal and reduce variations due to the environmental conditions rather than the sample.
For the 2020 season, each fruit was analyzed twice. The first measurement was performed on a point along the fruit equator. The fruit was then turned 180° for the successive measurement. The resulting dataset (DB-2020) consists of 2784 observations x 1557 wavenumbers (1392 samples). For the 2021 season, an additional NIR measurement was added, so each fruit was analyzed in triplicate to better describe the fruit variability. The resulting dataset (DB-2021) consists of 3096 observations x 1557 wavenumbers (1032 samples).
2.5. Multivariate Data Analysis
First, one-way ANOVA was carried out to determine statistically significant differences between the cultivars and the SSC content, as well as between cultivars and Botrytis cinerea infection at different storage days. To investigate which specific groups differed from each other, the Tukey test was performed. This post-hoc test is based on the studentized range distribution and compares all possible pairs of means to figure out which groups differ from each other.
Chemometrics was used to extract useful information for the spectral data. Before model computation, in order to minimize the effects of baseline shifts, interfering signals, and peak shifts, the spectral data were pretreated. Different pretreatments, including standard normal variate (SNV), multiplicative scatter correction (MSC), first and second derivative spectra (from Savitzky–Golay [
32] with 13 or 21 smoothing points and a second order polynomial), and a combination of the previous ones were applied in order to remove undesired physical phenomena [
23]. As last, each sample was averaged across the replicates.
Principal component analysis (PCA) was used as an explorative method to show the statistical variance of all the samples on a chemical basis and cluster them according to spectral similarity. PCA computation was performed on the pretreated dataset and on mean-centered data. A confidence ellipse was calculated for each cultivar group using the mean score values as the center and the standard deviation of each variability direction as the radius of the ellipse. The loading plot of the two first PCs was investigated to identify the compounds associated with the separation of samples in the PCA space.
Partial least squares regression (PLS) was used to predict the SSC content (°Brix) of both DB-2020 and DB-2021 datasets. The technique works by evaluating the relationship between non-spectral dependent values (Y) and independent spectral values (X) to then maximize the covariance of their scores [
33]. PLS models were validated using venetian blind-cross validation (five segments) and an external test set. The dataset was split into training and test sets using a duplex algorithm [
34].
To evaluate the performance of the developed model and its ability to estimate unknown samples, different parameters were taken into account. In detail, the parameters were R
2cv, or the coefficient of determination of cross-validation, R
2p, or the coefficient of determination of prediction, the root mean square error of cross validation (RMSECV) and the root mean square error of prediction (RMSEP). The ratio of performance to deviation (RPD) and the range error ratio (RER) were also computed. An RPD with values of 2–3 indicated a discrete model, 3–4 indicated a good model for screening applications, and values > 4 indicated an excellent model [
35]. By contrast, RER values < 6, between 7 and 20, and >20 indicated a poor, suitable, and excellent model, respectively [
36]. For each model, the number of latent variables (LVs) was chosen considering the RMSECV plot against the number of LVs searching for a local minimum. In addition, the U vs. T (scores of Y and scores of X) plot and the loading plot were also analyzed.
It is well known that the performance of the prediction models can be enhanced by using variable selection methods in comparison to that of the full-spectrum PLS model [
37]. Therefore, after the selection of the optimal number of LVs, the PLS models were calculated again on the wavenumbers, which were selected on the basis of the following different variable selection methods: recursive weighted partial least squares (rPLS) [
38] and interval partial least squares (iPLS) [
39]. Both backward and forward iPLS were performed with a number of intervals varying from 50 to 100.
All the data analyses were performed using Matlab (ver. R2022a, The MathWorks, Natick, MA, USA) and in-house functions based on existing algorithms.
3. Results
3.1. Analysis of Variance on Soluble Solid Content
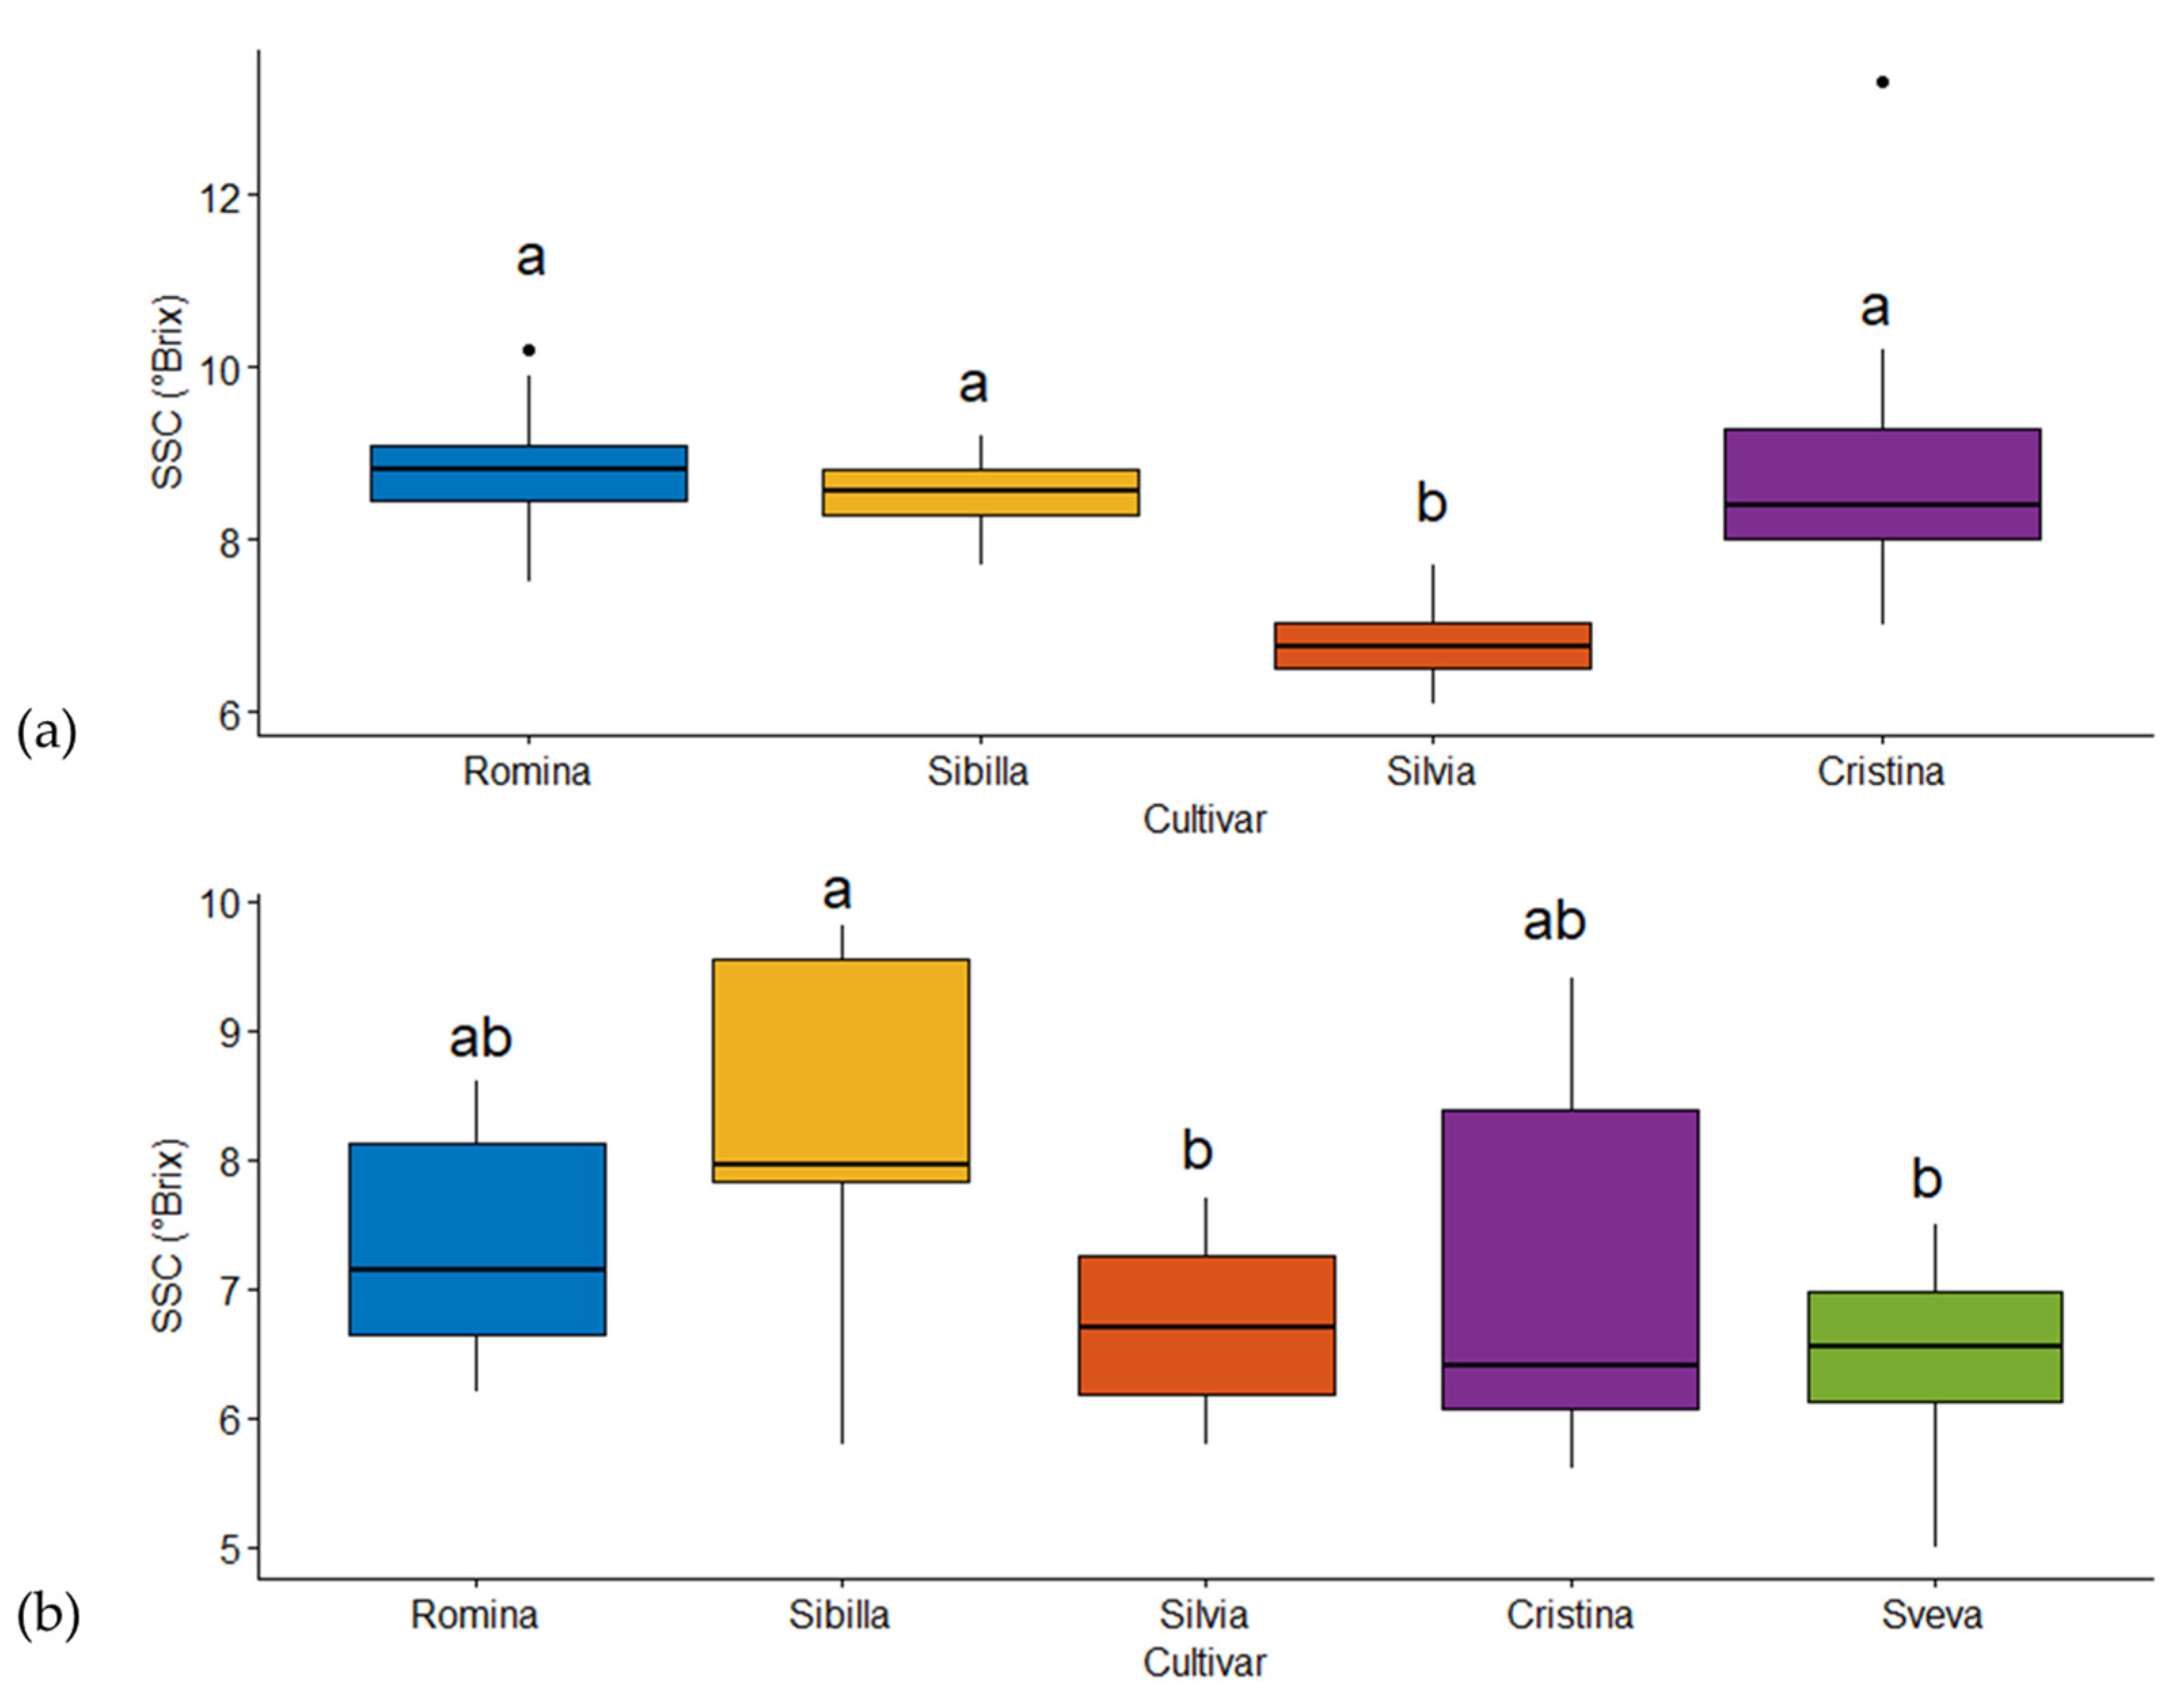
The results of the one-way ANOVA are represented with a box and whisker plot (
Figure 1). The boxes are used to compare groups; if the boxes of two cultivars do not overlap, this is strong evidence that the means differ. Cultivars with the same letters are considered not significantly different (
p ≤ 0.05). The horizontal black line is the mean value, the box represents a group of numerical data through their quartiles, and the whiskers represent the max and min values for each cultivar.
Figure 1a reports the results of harvest season 2020 and clearly shows that Silvia was the cultivar with the lowest value of soluble solid content (b) with respect to the other cultivars (a). For season 2021 (
Figure 1b), the results clearly show that Sveva and Silvia had the lowest values of soluble solid content (b), Cristina and Romina had similar characteristics (ab), and Sibilla had the highest SSC content value (a). The differences in fruit SSC were not surprising and were, in fact, expected. In fact, it is well known that the genotype is one of the main factors affecting the SSC of strawberry fruits. Furthermore, the harvest season (harvest year but also different dates across the same year) is also a key factor influencing the SSC content, as well as the environmental conditions (light exposure, temperature, radiation, and water management) [
1]. Other key factors, such as the soil conditions, the harvest method, and the cultivation conditions, were not considered responsible for these differences, since they were the same for all the cultivars.
3.2. Analysis of Variance on Botrytis Cinerea Susceptibility/Tolerance Trial
Data on
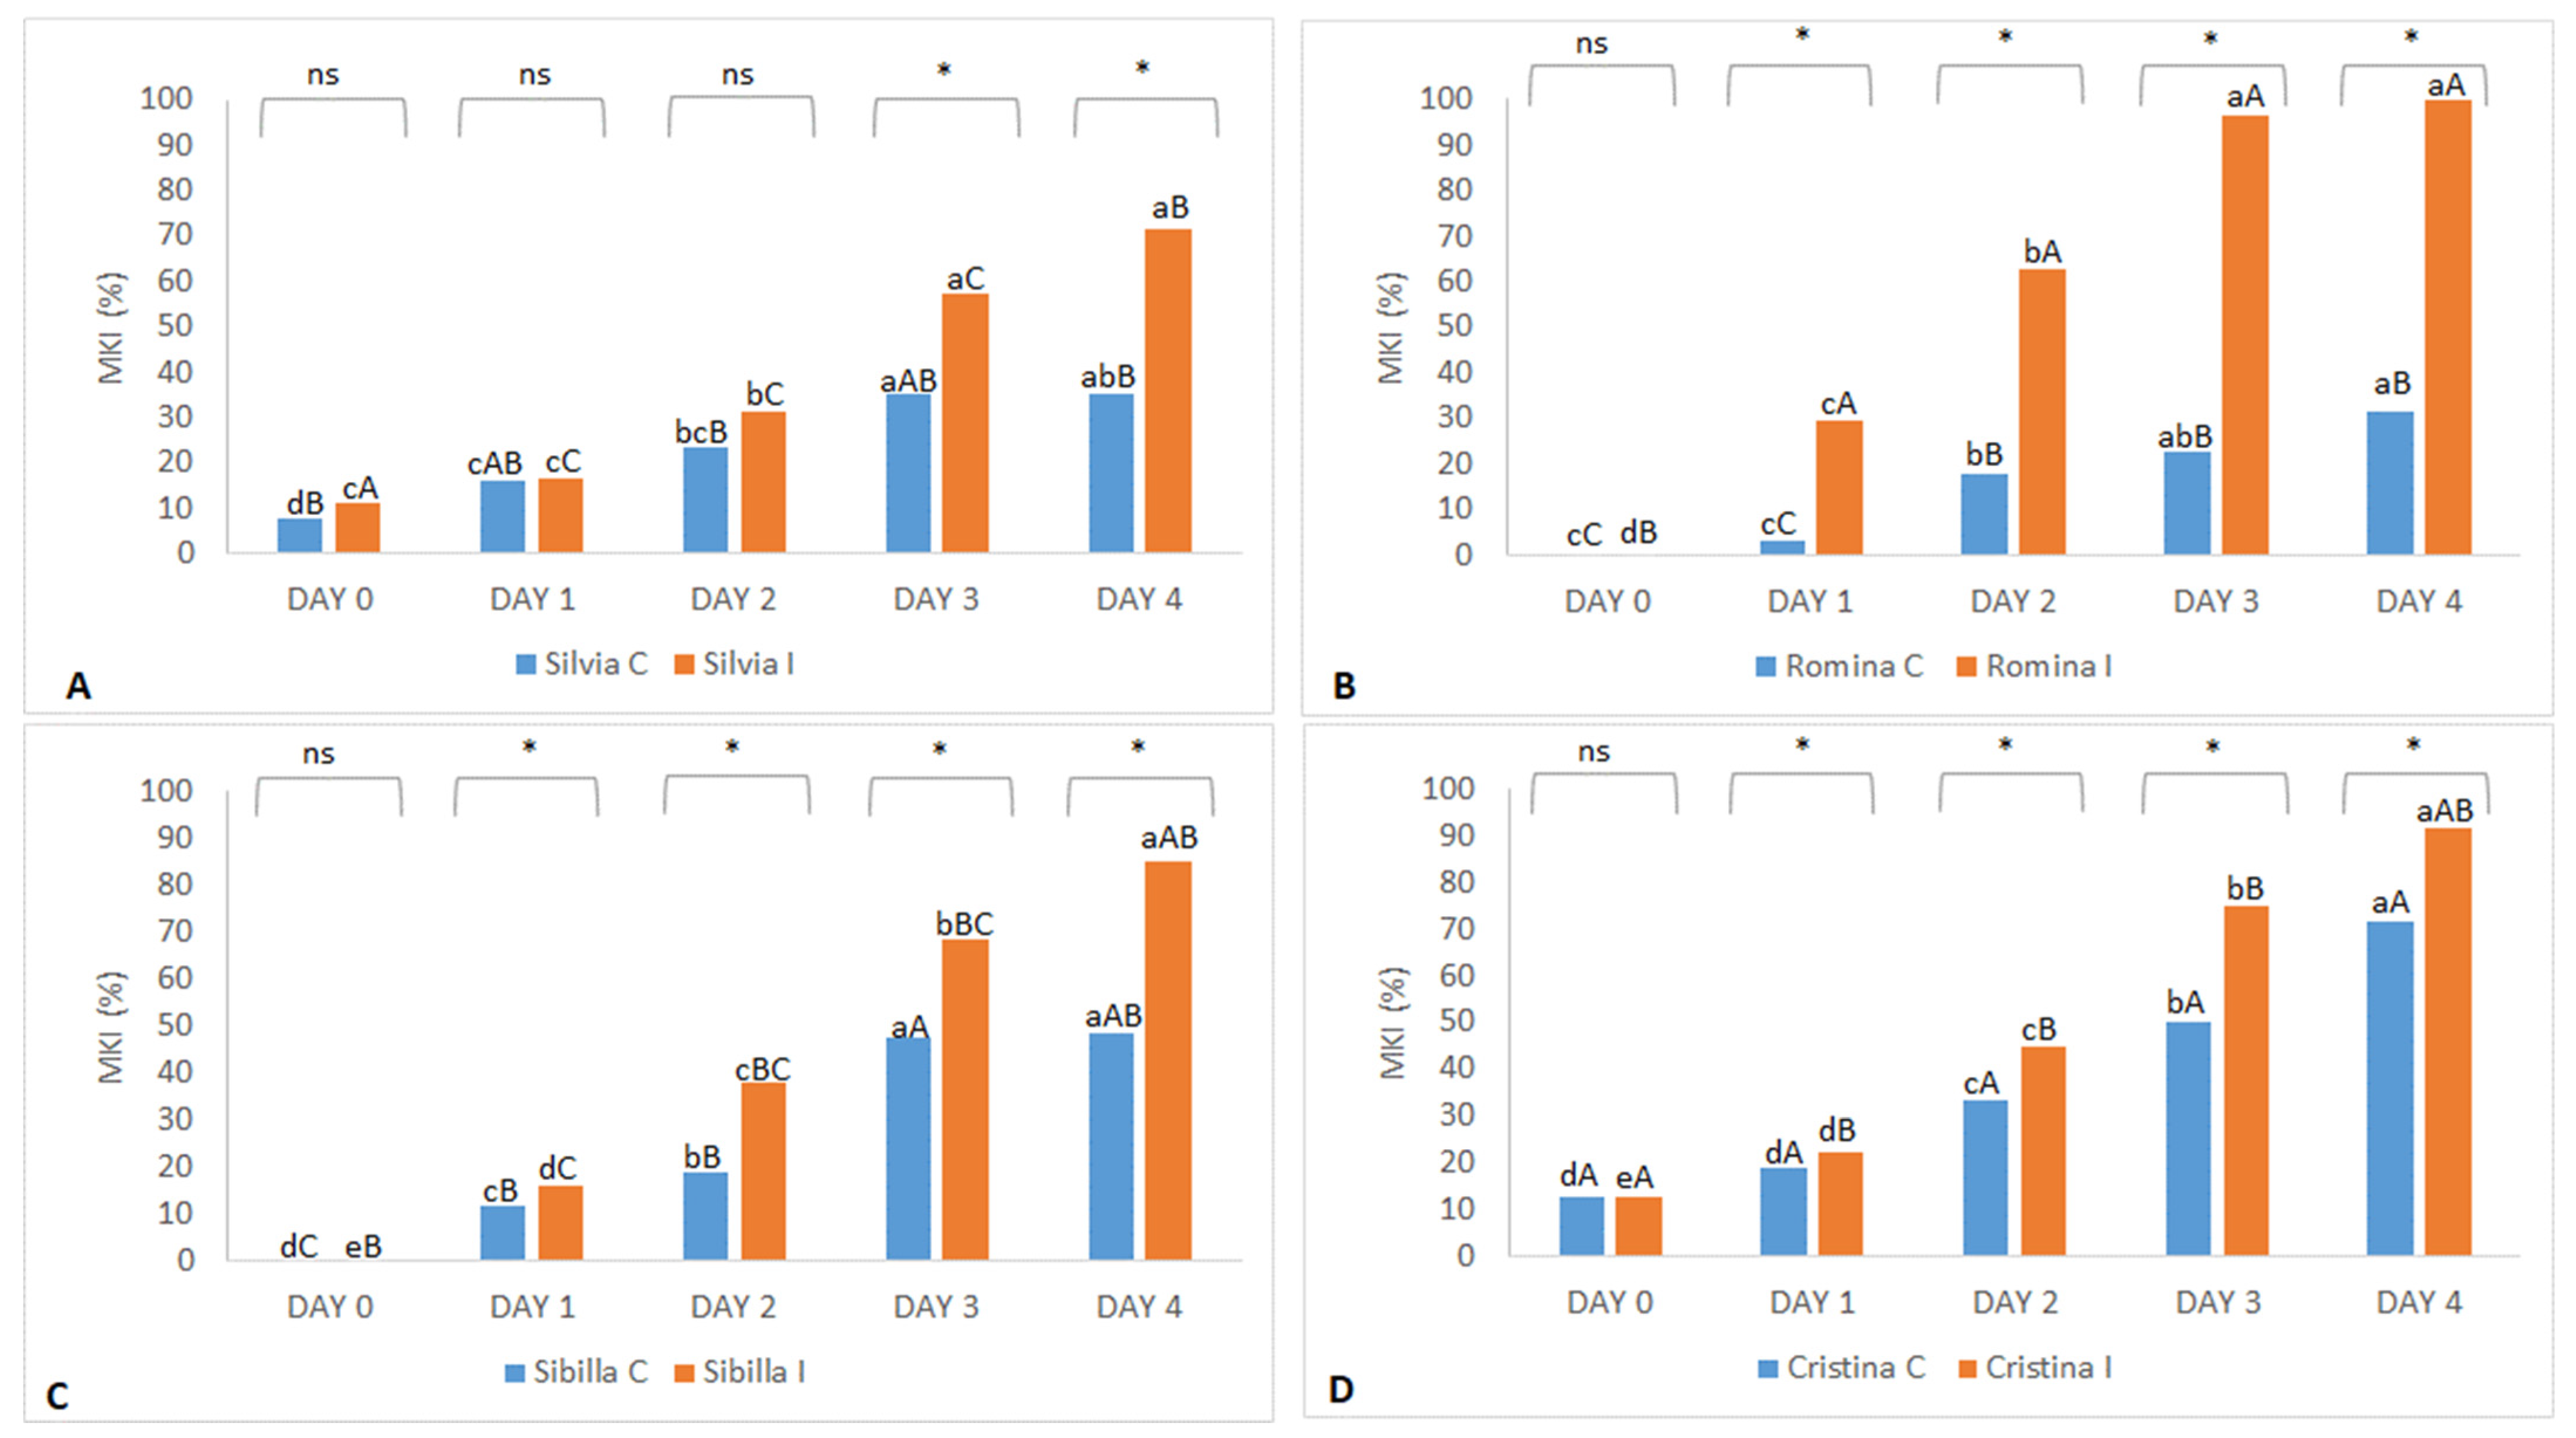
B. cinerea infection tolerance/susceptibility of the 2020 harvest year revealed that Cristina was the most sensitive to
B. cinerea in control conditions (without manual infection) with a more than 70% MKI result. At the same conditions, Romina (about 30% MKI at day 4) and Silvia (about 35% MKI at day 4) were the most tolerant to this pathogen (
Figure 2). Contrarily, Romina was found to be the most sensitive cultivar when the fruits were inoculated with
B. cinerea after harvest (treated trial), with an almost 100% MKI result at day 4, followed by Cristina (about 90% MKI), Sibilla (about 85% MKI), and, finally, Silvia (about 70% MKI), which was found to be the most tolerant cultivar in both control and treated conditions (
Figure 2).
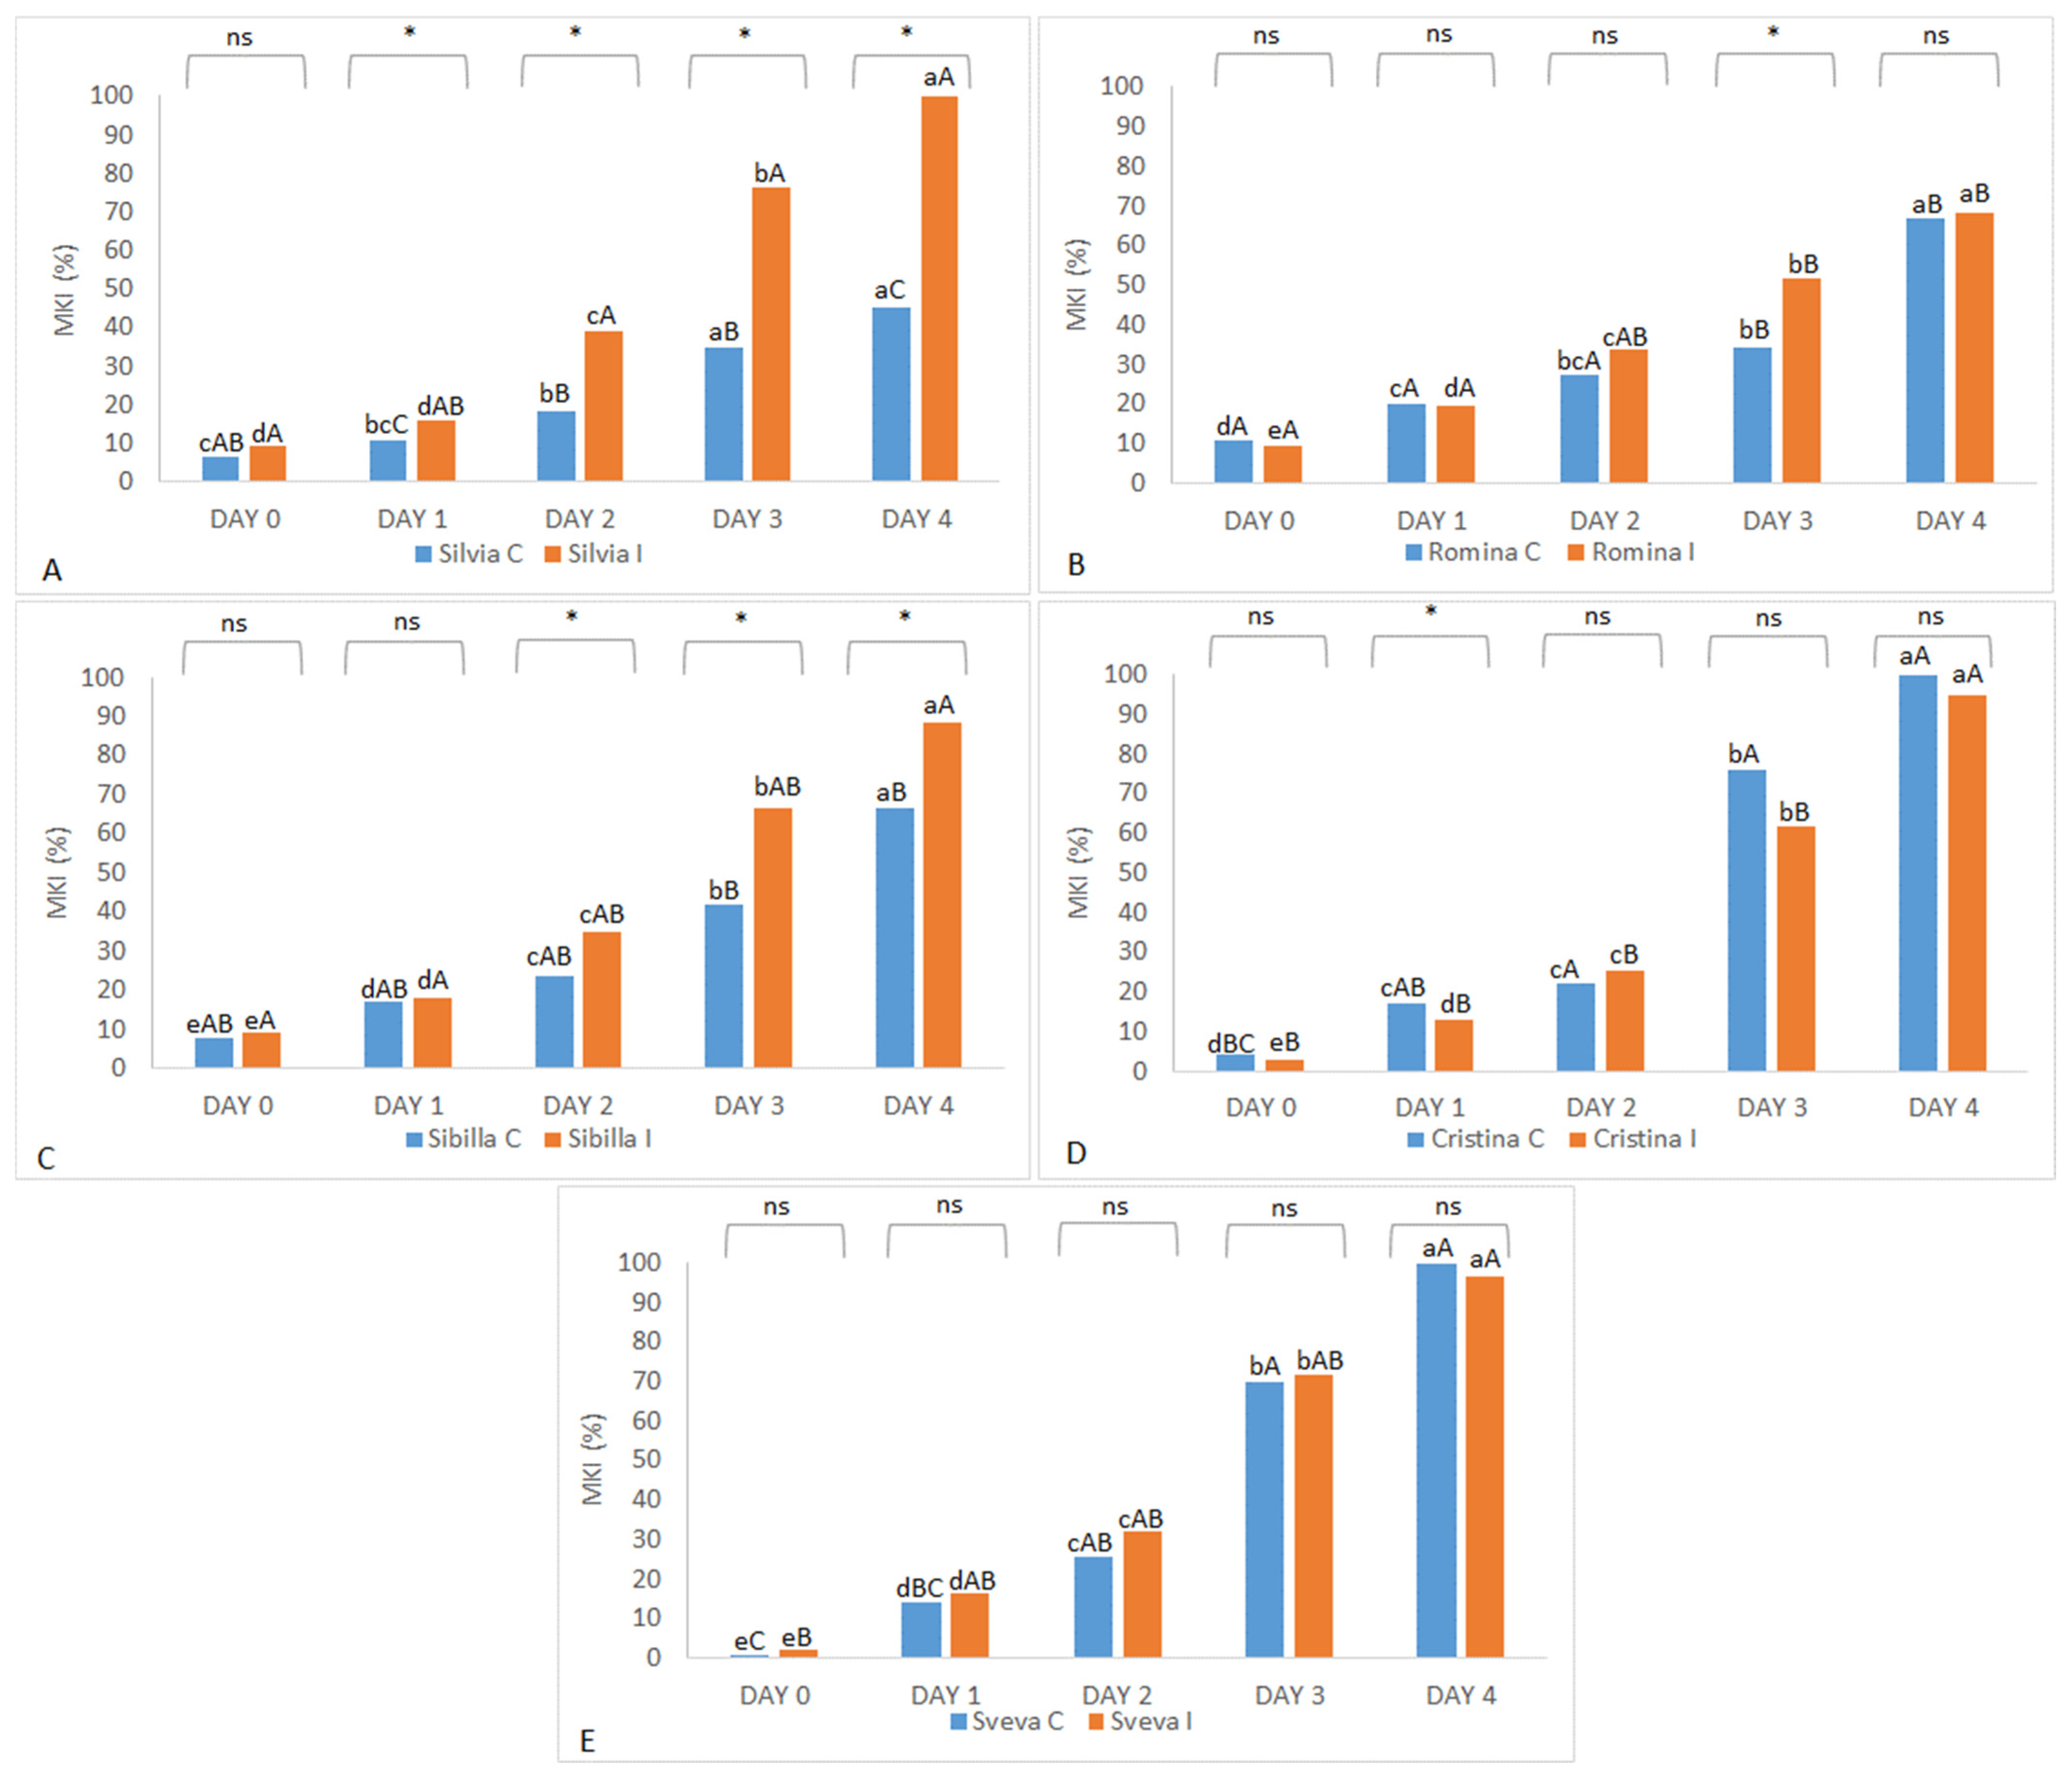
In the 2021 harvest season, Sveva and Cristina were the most sensitive cultivars to
B. cinerea in control conditions, and each reached almost 100% MKIs, even when they were not infected manually with
B. cinerea spores. In addition to the high susceptibility of these two cultivars, this high data could be also explained by the bad weather conditions (heavy rains before fruit collection) that favored infection by gray mold and other fungi and bacteria, which spoil the fruit even without artificial contamination [
40]. As expected, Sveva and Cristina were also found to be the most susceptible cultivars in the treated trial, together with Silvia (100% MKI) and Sibilla (around 90% MKI). The most tolerant cultivar in the treated trial was Romina with about 70% MKI (
Figure 3).
In summarizing both harvest years of study, Silvia, Romina, and Sibilla confirmed a good tolerance to B. cinerea in control conditions, while Cristina and Sveva were the most susceptible. When manually inoculated (treated trial), all genotypes developed higher levels of fruit infection than the control (except Sveva and Cristina in 2021, which showed similar results). Sibilla was the cultivar that showed better average values of tolerance to B. cinerea in both years, while Cristina and Sveva were the most susceptible. Silvia and Romina showed contrasting results, being among the most (Silvia) and least (Romina) tolerant in 2020 and presenting the opposite behavior in 2021. Thus, these results evidenced the importance of also considering the environmental interaction during the ripening period in determining the fruit response to the disease.
When looking at the SSC and
B. cinerea susceptibility/tolerance data, it is possible to identify a connection between the content of fruit sugars content and the
B. cinerea infection, depending on the cultivar. The correlation between MKI at day 4 for strawberries and SSC was highly positive (R
2 = 0.87 for control and 0.61 for treated). These data refer to the 2020 harvest season, which performed better than the 2021 season for the climatic conditions in pre-harvest. These results were in line with our findings, with the fruits of the Silvia cultivar being less sugary (
Figure 1) and having the lowest susceptibility to
B. cinerea (
Figure 2), especially in the treated trial. On the contrary, Romina and Cristina, which presented higher sugar content in their fruits, had the most susceptibility to
B. cinerea in treated and control conditions, respectively. Therefore, from these results, it can be highlighted how the higher sugar content facilitates a greater development of
B. cinerea infection [
41].
3.3. Spectra
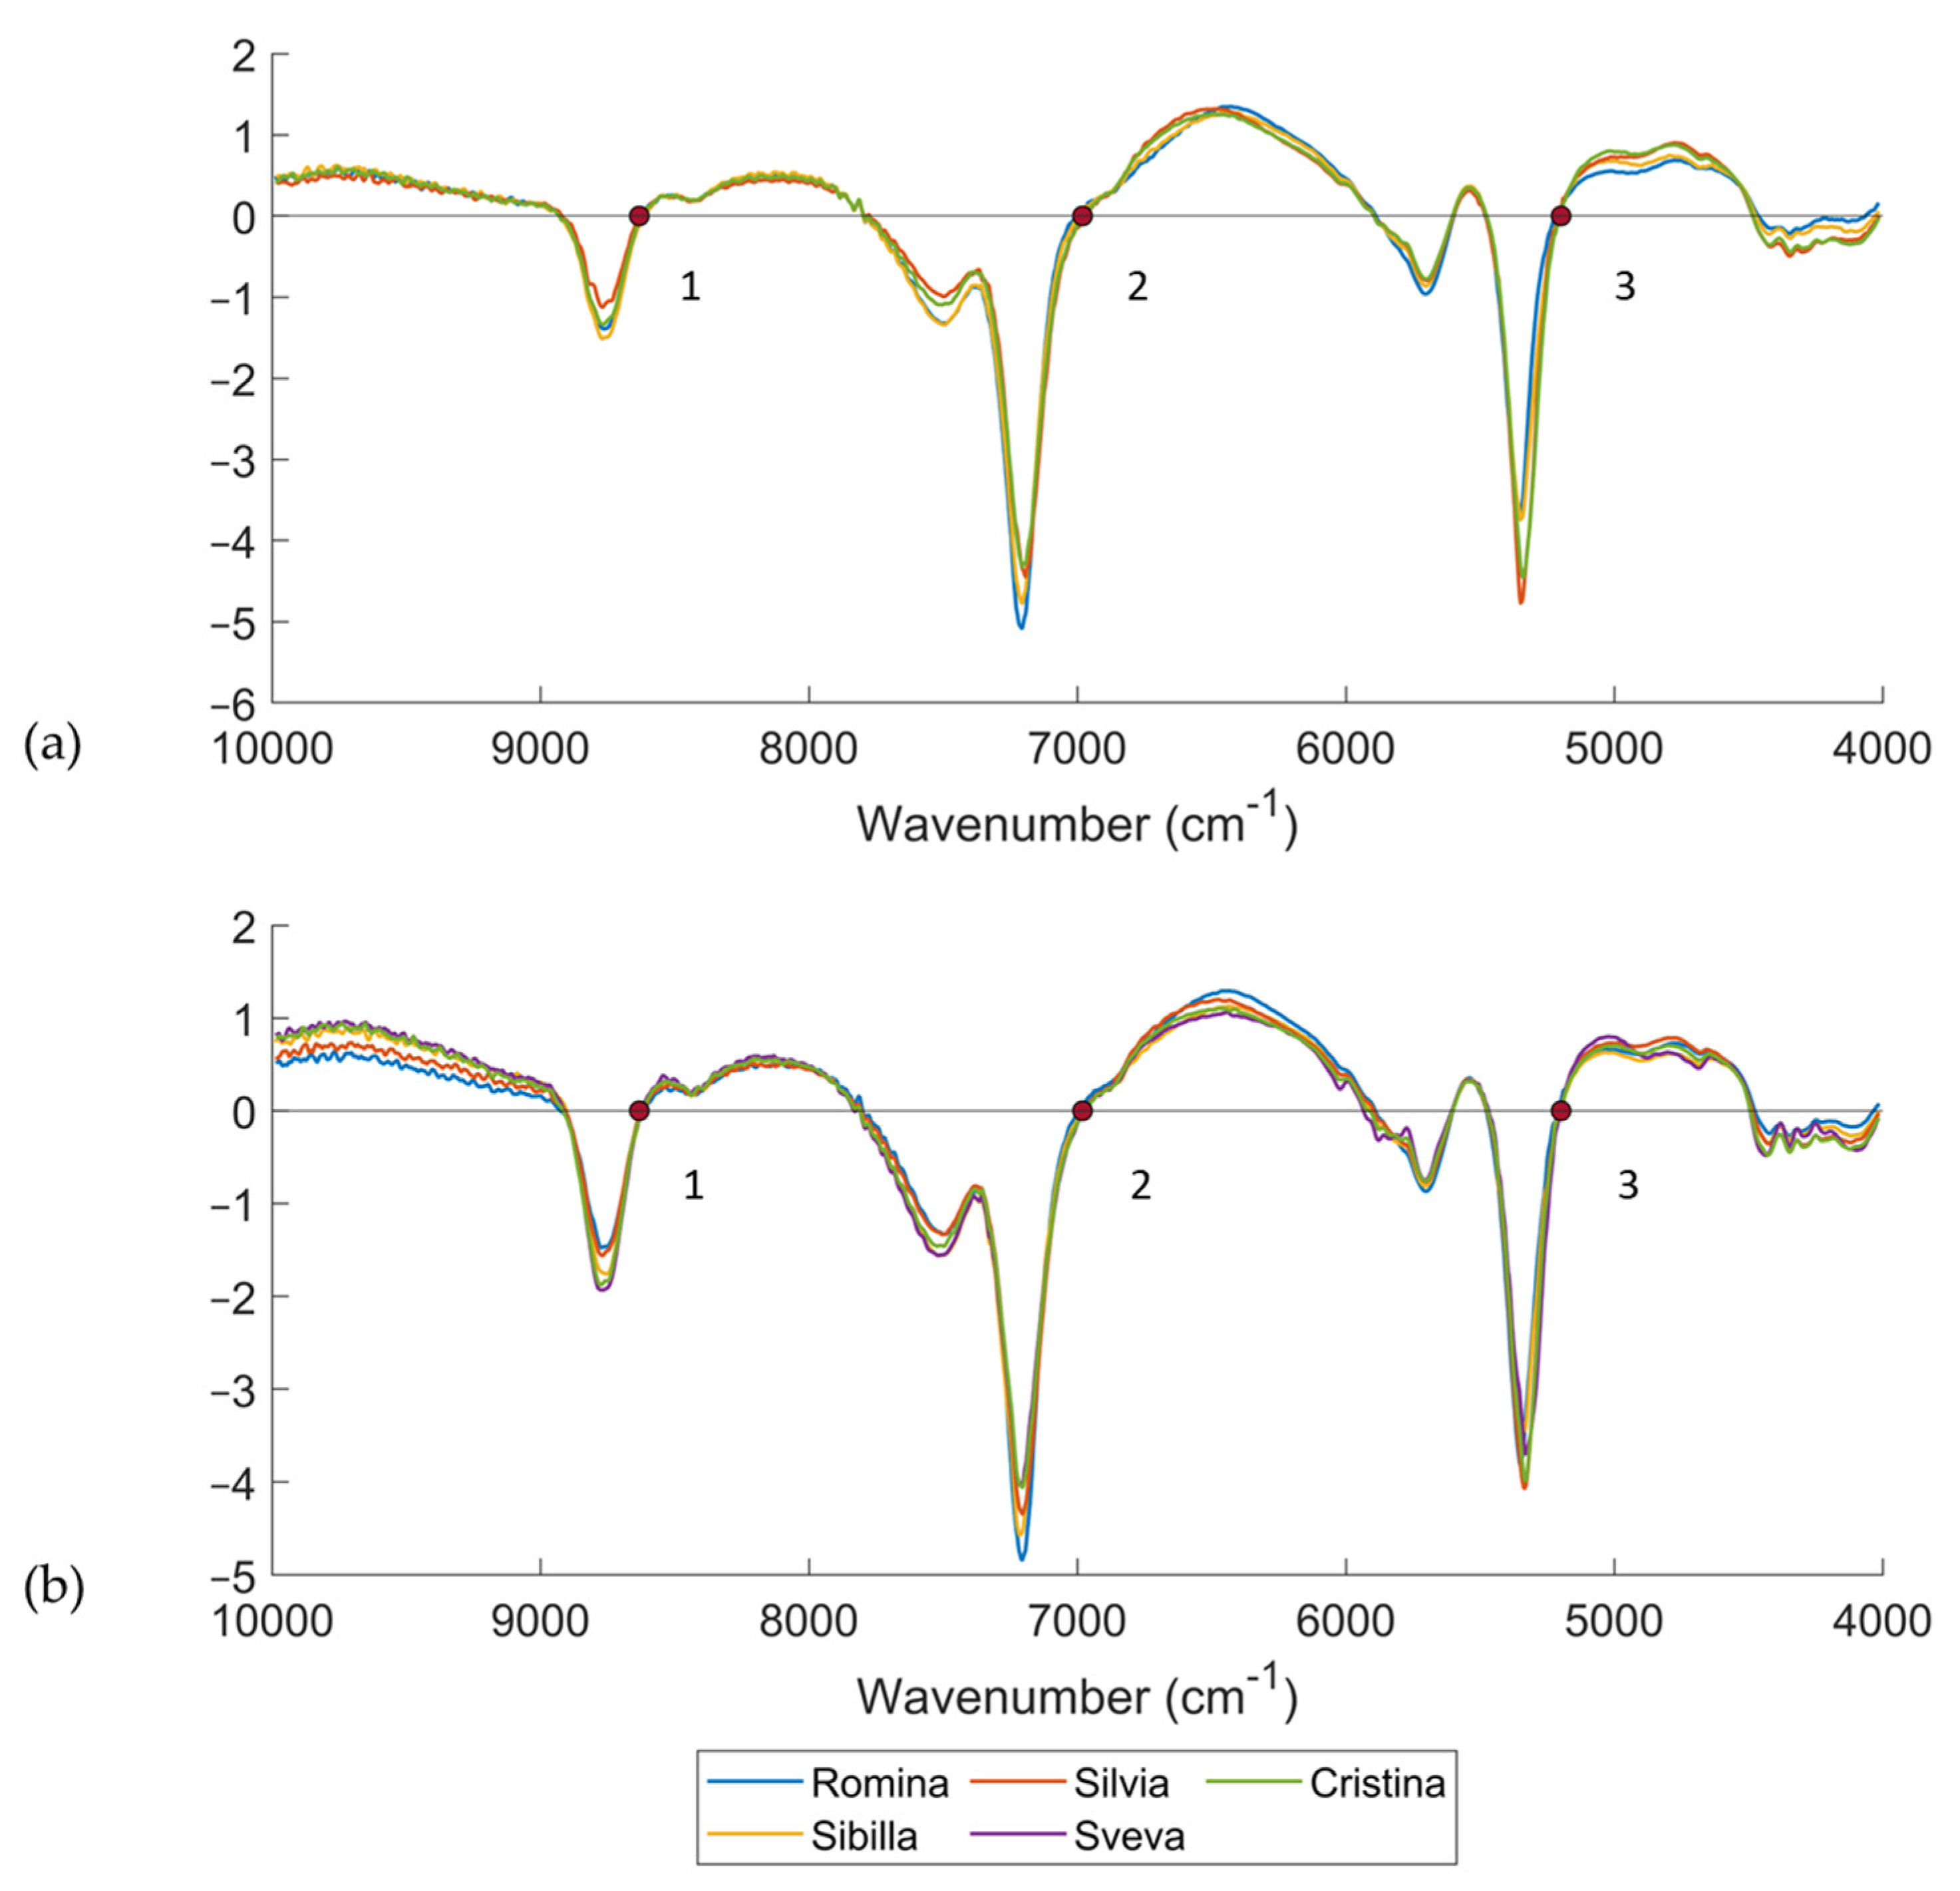
Figure 4 reports the average spectra of the five cultivars considered in this study for both DB-2020 and DB-2021. Only the fruits analyzed at D0 (and without any infection of
B. cinerea) were considered and were pretreated using a first derivative (Savitzky–Golay with 21 smoothing points and a second order polynomial)—21der1—and SNV. It should be noted that the interpretation of first derivative spectra is more complex than the raw spectra, because a peak of maximum absorbance on the original spectra corresponds to zero in the 1st derivative [
42]. For this reason, zero points corresponding to peak in the raw spectra were selected. It is important to take into account that differences between the location of bands in the raw spectrum and in the derivative of the spectrum can occur, by even more than 20 cm
–1 (5 nm) [
43]. This depends not only on the data processing algorithms used, but also on the shape of the spectrum. In fact, the particle size influences the radiation scattering properties of the samples, and spectral changes, such as baseline offset or slope and band shifts to higher or lower wavenumber regions, can be observed [
43].
Three significant bands dominated the spectra. The band at 5199 cm
−1 (3) was related to the OH bonds and was much higher for the Cristina and Silvia cultivars than for the others [
36,
44]. The band at 7004 cm
−1 (2) was assigned to O-H and C-H combinations, and it involved qualitative parameters, such as the soluble solids content or the titratable acidity [
44]. As seen from the plot of spectra, it can be observed that the highest band among the cultivars was reached by Sibilla and Romina, which were the cultivars with the highest soluble solids contents. Lastly, the band at 8632 cm
−1 (1) was in the region of the second overtone of CH. These three major bands were seen in all strawberry cultivars, though the spectral position differed due to the typical characteristics of each cultivar. In fact, wavelength drift or shift in informative peaks may be due to differences in chemical composition [
45].
It is important to take into consideration that water constitutes about 80–90% of fruit and vegetables; consequently, the water absorption bands dominate the NIR spectrum [
46], with the second major component being carbohydrates. In addition, the effective NIR absorption bands (of large molecules such as fruits) are relatively broad and overlapping, and their assignment results are complex. This is due to the different chemical environments of each O–H and C–H bond in water and sugar molecules [
47].
3.4. Principal Component Analysis (PCA)
PCA was used to determine the differences between the cultivars considered in this study and, in general, for looking at groupings among the analyzed samples. The score plot showed the differences/groupings among the samples, while the loading plot was investigated to identify the compounds associated with the differences among the cultivars.
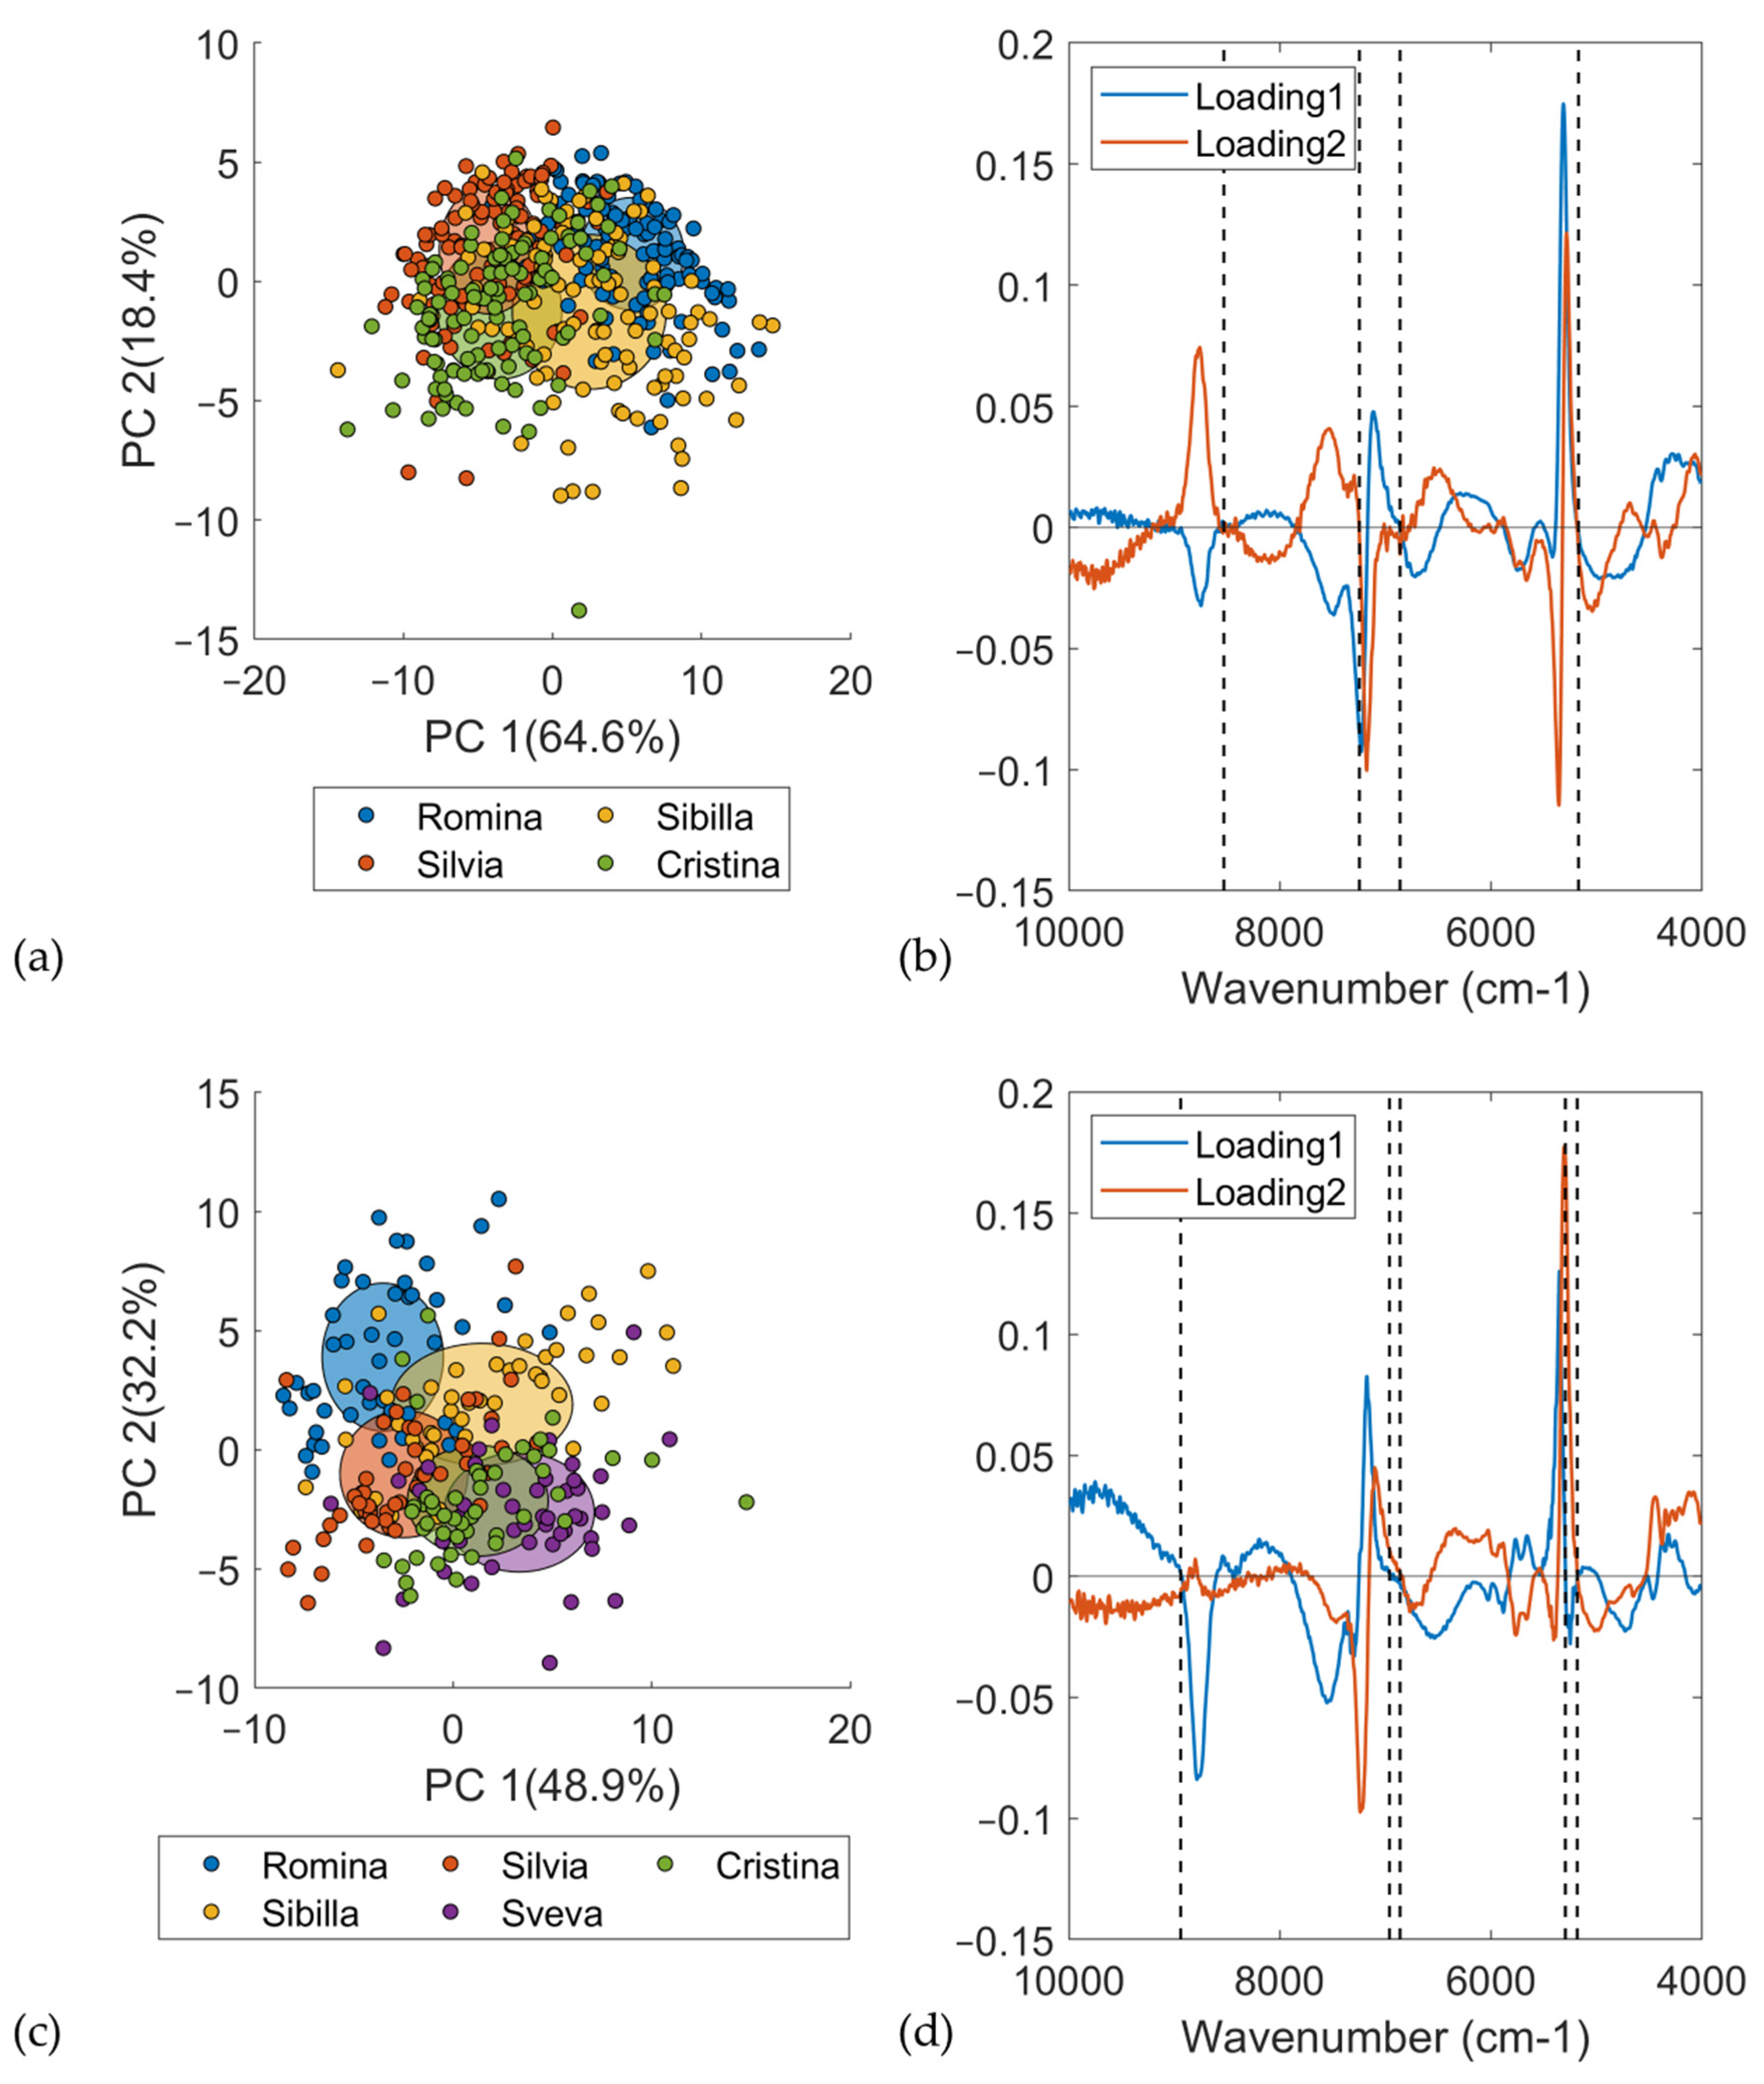
Figure 5a reports the score plot of the PCA computed on the DB-2020 considering only the D0, i.e., the non-infected material/samples. A total of 432 samples belonging to 4 cultivars were used for PCA computation. The spectra were pretreated using a first derivative (Savitzky–Golay with 21 smoothing points and second order)—21der1—and SNV. All the NIR measurements were averaged across the replicates. The first principal component (PC1) separated Romina and Sibilla, which were the cultivars having fruits with the highest SSC content, from Silvia and Cristina. These findings were confirmed by the loading plot (
Figure 5b). To make an easier interpretation of the loadings, a comparison with the pretreated average spectra of the different cultivars (
Figure 4a) was also carried out. The most relevant wavenumbers were 8531, 6862, and 5172 cm
–1 for the first loading, and 7247 and 5172 cm
–1 for the second loading. In addition to bands at 7247 cm
–1, all of the most relevant NIR regions were confirmed by the spectral differences previously reported in
Figure 4a. The band at 6862 cm
–1 was related to first overtone of water [
48] and the band at 5172 cm
–1 was related to an OH combination of water [
46,
49], while the bands at 8531 and 7247 cm
–1 were related to the second overtone of CH [
49] and first overtone of CH, respectively.
Figure 5c reports the score plot of the PCA computed on the DB-2021 considering only the first day of analysis, i.e., the non-infected material/samples. A total of 240 fruit samples belonging to 5 cultivars were used for PCA computation. As was done with DB-2020, the spectra were pretreated using a first derivative (Savitzky–Golay with 21 smoothing points and second order) and SNV, and all the NIR measurements were averaged across replicates. The second principal component (PC2) separated Romina and Sibilla, which were the cultivars with the highest SSC content, from the others. Cristina and Sveva were located in the bottom right part of the score plot, while Silvia was the most different cultivar from the others. PCA nicely confirmed the ANOVA results.
The loading plot was used for investigating the most influencing wavenumbers responsible for the separation of the samples in the PCA space (
Figure 5d). The most relevant wavenumbers were 8940, 6962, and 5296 cm
–1 for the first loading and 6862 and 5184 cm
–1 for the second loading. In addition to bands at 5296 cm
–1, all of the most relevant NIR regions were confirmed by the spectral differences previously reported in
Figure 4b. As last, it is interesting to note that the same wavenumbers for the PCA for DB-2020 were detected for DB-2021, which indicated the same chemical information. The bands at 5296 and 5184 cm
−1 were related to the OH combination bonds, while bands at 6962 and 6862 cm
–1 were assigned to the first overtone of CH and OH combinations [
48,
49] and first overtone of OH bonds [
46,
48], respectively. The last band at 8940 cm
−1 was assigned to third overtone of CH stretching [
49].
To conclude, it can be stated that the difference between the two harvesting seasons was mainly related to the number of cultivars and samples analyzed. The different location of the cultivars in the PCA score plot was only related to the number of samples and cultivars considered in the PCA computation. In DB-2020, PC1 divided Sibilla and Romina from the other cultivars, while, in DB-2021, it was PC2 dividing Sibilla and Romina from the other cultivars. The two aforementioned loadings detected the same wavenumbers, which indicated the same chemical information related to the SSC between the two datasets and, consequently, the two harvesting seasons.
3.5. PLS on DB-2020
PLS regression models were developed on DB-2020 using both the whole dataset (WDB-2020) and a reduced dataset (RDB-2020), i.e., considering only the strawberry fruits analyzed from D0 to D2 after B. cinerea infection and excluding the fruits with a high score of damage.
For WDB-2020, 300 samples were used as a training set and 130 samples as a test set; while for RDB-2020, 240 samples were used as a training set and 100 samples as a test set. The best prediction models were obtained from RDB-2020. In the interest of providing complete information, the best results for WDB-2020 were obtained using a first derivative (Savitzky–Golay with 21 smoothing points and second order)—21der1—or 21der1 and SNV as pretreatments. The models used seven LVs and returned an R
2p = 0.65, and a RMSEP of 0.99 and 1.03 °Brix, respectively.
Table 2 reports the results of the best PLS models developed from the RDB-2020 dataset. Second derivative and MSC/SNV pretreatments were also tested without obtaining acceptable results. The best model for the prediction of the SSC parameter was obtained using a first derivative (Savitzky–Golay with 21 smoothing points and second order) as a pretreatment. The model used seven LVs and had an R
2p = 0.69, a RMSEP = 0.91 °Brix, a RPD = 1.80, and a RER = 7.58. The values indicate the possibility to use the model for screening applications only. Considering that the current dataset, consisting of strawberry fruits from different cultivars, is relatively complex, seven latent variables are an acceptable number.
In order to improve the model performance and get a better prediction, PLS models were computed again by only considering the wavenumber range between 9000 cm
−1 up to 4000 cm
−1, since it contains the most significant information. The results of the best performing PLS models are reported in
Table 2. First derivative (Savitzky–Golay with 13 or 21 smoothing points and second order) was used as a pretreatment and returned models with seven LVs, an R
2p = 0.73 − 0.72, a RMSEP = 0.88 °Brix, a RPD = 1.86, and a RER = 7.84.
Considering the slight improvement of the prediction results, the iPLS and rPLS have were as variable selection techniques on the reduced wavenumber range (9000 cm
−1 up to 4000 cm
−1). The iPLS was tested using both forward and backward methods and at different intervals (50 and 100).
Table 2 reports the results of the best prediction models. It should be noted that the iPLS using the backward method did not return any good results. When comparing the different figures of merit, the rPLS was the superior variable selection method performed by estimating the first derivative with Savitzky–Golay, 13 or 21 smoothing points, and a second order polynomial fit. There was a significant improvement using 13 smoothing points. In the model obtained using the rPLS method (five LVs), the RMSEP value decreased from 0.88 °Brix to 0.84 °Brix, the R
2p increased from 0.73 to 0.75, the RPD increased from 1.86 to 1.95, and the RER increased from 7.84 to 8.21.
3.6. PLS on DB-2021
As with the DB-2020 dataset, PLS regression models were developed for DB-2021 using both the whole dataset (WDB-2021) and a reduced dataset (RDB-2021), i.e., considering only the strawberry analyzed from D0 to D2 after B. cinerea infection and excluding the fruits with a high score of damage.
For the WDB-2020, 400 samples were used as a training set and 162 samples as a test set, while for the RDB-2020, 312 samples were used as a training set and 133 samples as a test set. In this case, the best prediction models were obtained from WDB-2021. Before PLS model computation, one outlier was removed from the training set. The most promising results from the RDB-2021 were obtained using a first derivative (Savitzky–Golay with 21 smoothing points and second order)—21der1—or 21der1 and SNV as pretreatments. The former model (21der1) used nine LVs and returned an R
2p = 0.65 and a RMSEP of 0.75 °Brix.
Table 3 reports the results of the best models developed from the WDB-2021 dataset. Second derivative and MSC/SNV pretreatments were also tested, but without obtaining acceptable results. The best model for the prediction of the SSC parameter was obtained using first derivative (Savitzky–Golay with 21 smoothing points and 2nd order) and SNV as pretreatment. The model used nine LVs and had an R
2p = 0.70, a RMSEP = 0.87 °Brix, a RPD = 1.93, and a RER = 8.51. The values indicate the possibility to use the model for screening applications only.
As for DB-2020, the PLS models were computed again to only consider the wavenumber range between 9000 cm
−1 to 4000 cm
−1. The results of the best performing PLS models are reported in
Table 3. First derivative (Savitzky–Golay with 13 smoothing points and second order) was used as a pretreatment and returned a model with seven LVs, an R
2p = 0.71, a RMSEP = 0.92 °Brix, a RPD = 1.83, and a RER = 8.04.
As well as for DB-2020, variable selection techniques on the best models, reported in
Table 3, were also used. iPLS was tested using both forward and backward methods and at different intervals (50 and 100), but the iPLS using the backward method did not return any good results.
Table 3 reports the results of the best prediction models using variable selection techniques. When comparing the different figures of merit, the rPLS was the superior variable selection method when using a first derivative (Savitzky–Golay with 13 smoothing points and second order). In any case, the model did not show any significant improvement. Both the RMSEP value (from 0.92 °Brix to 0.93 °Brix) and the R
2p (0.71) remained almost constant. In contrast, the RPD decreased from 1.83 to 1.81, and the RER decreased from 8.04 to 7.96. This demonstrates that some of the deleted variables were somehow important for the prediction of the SSC.
3.7. Model Interpretability
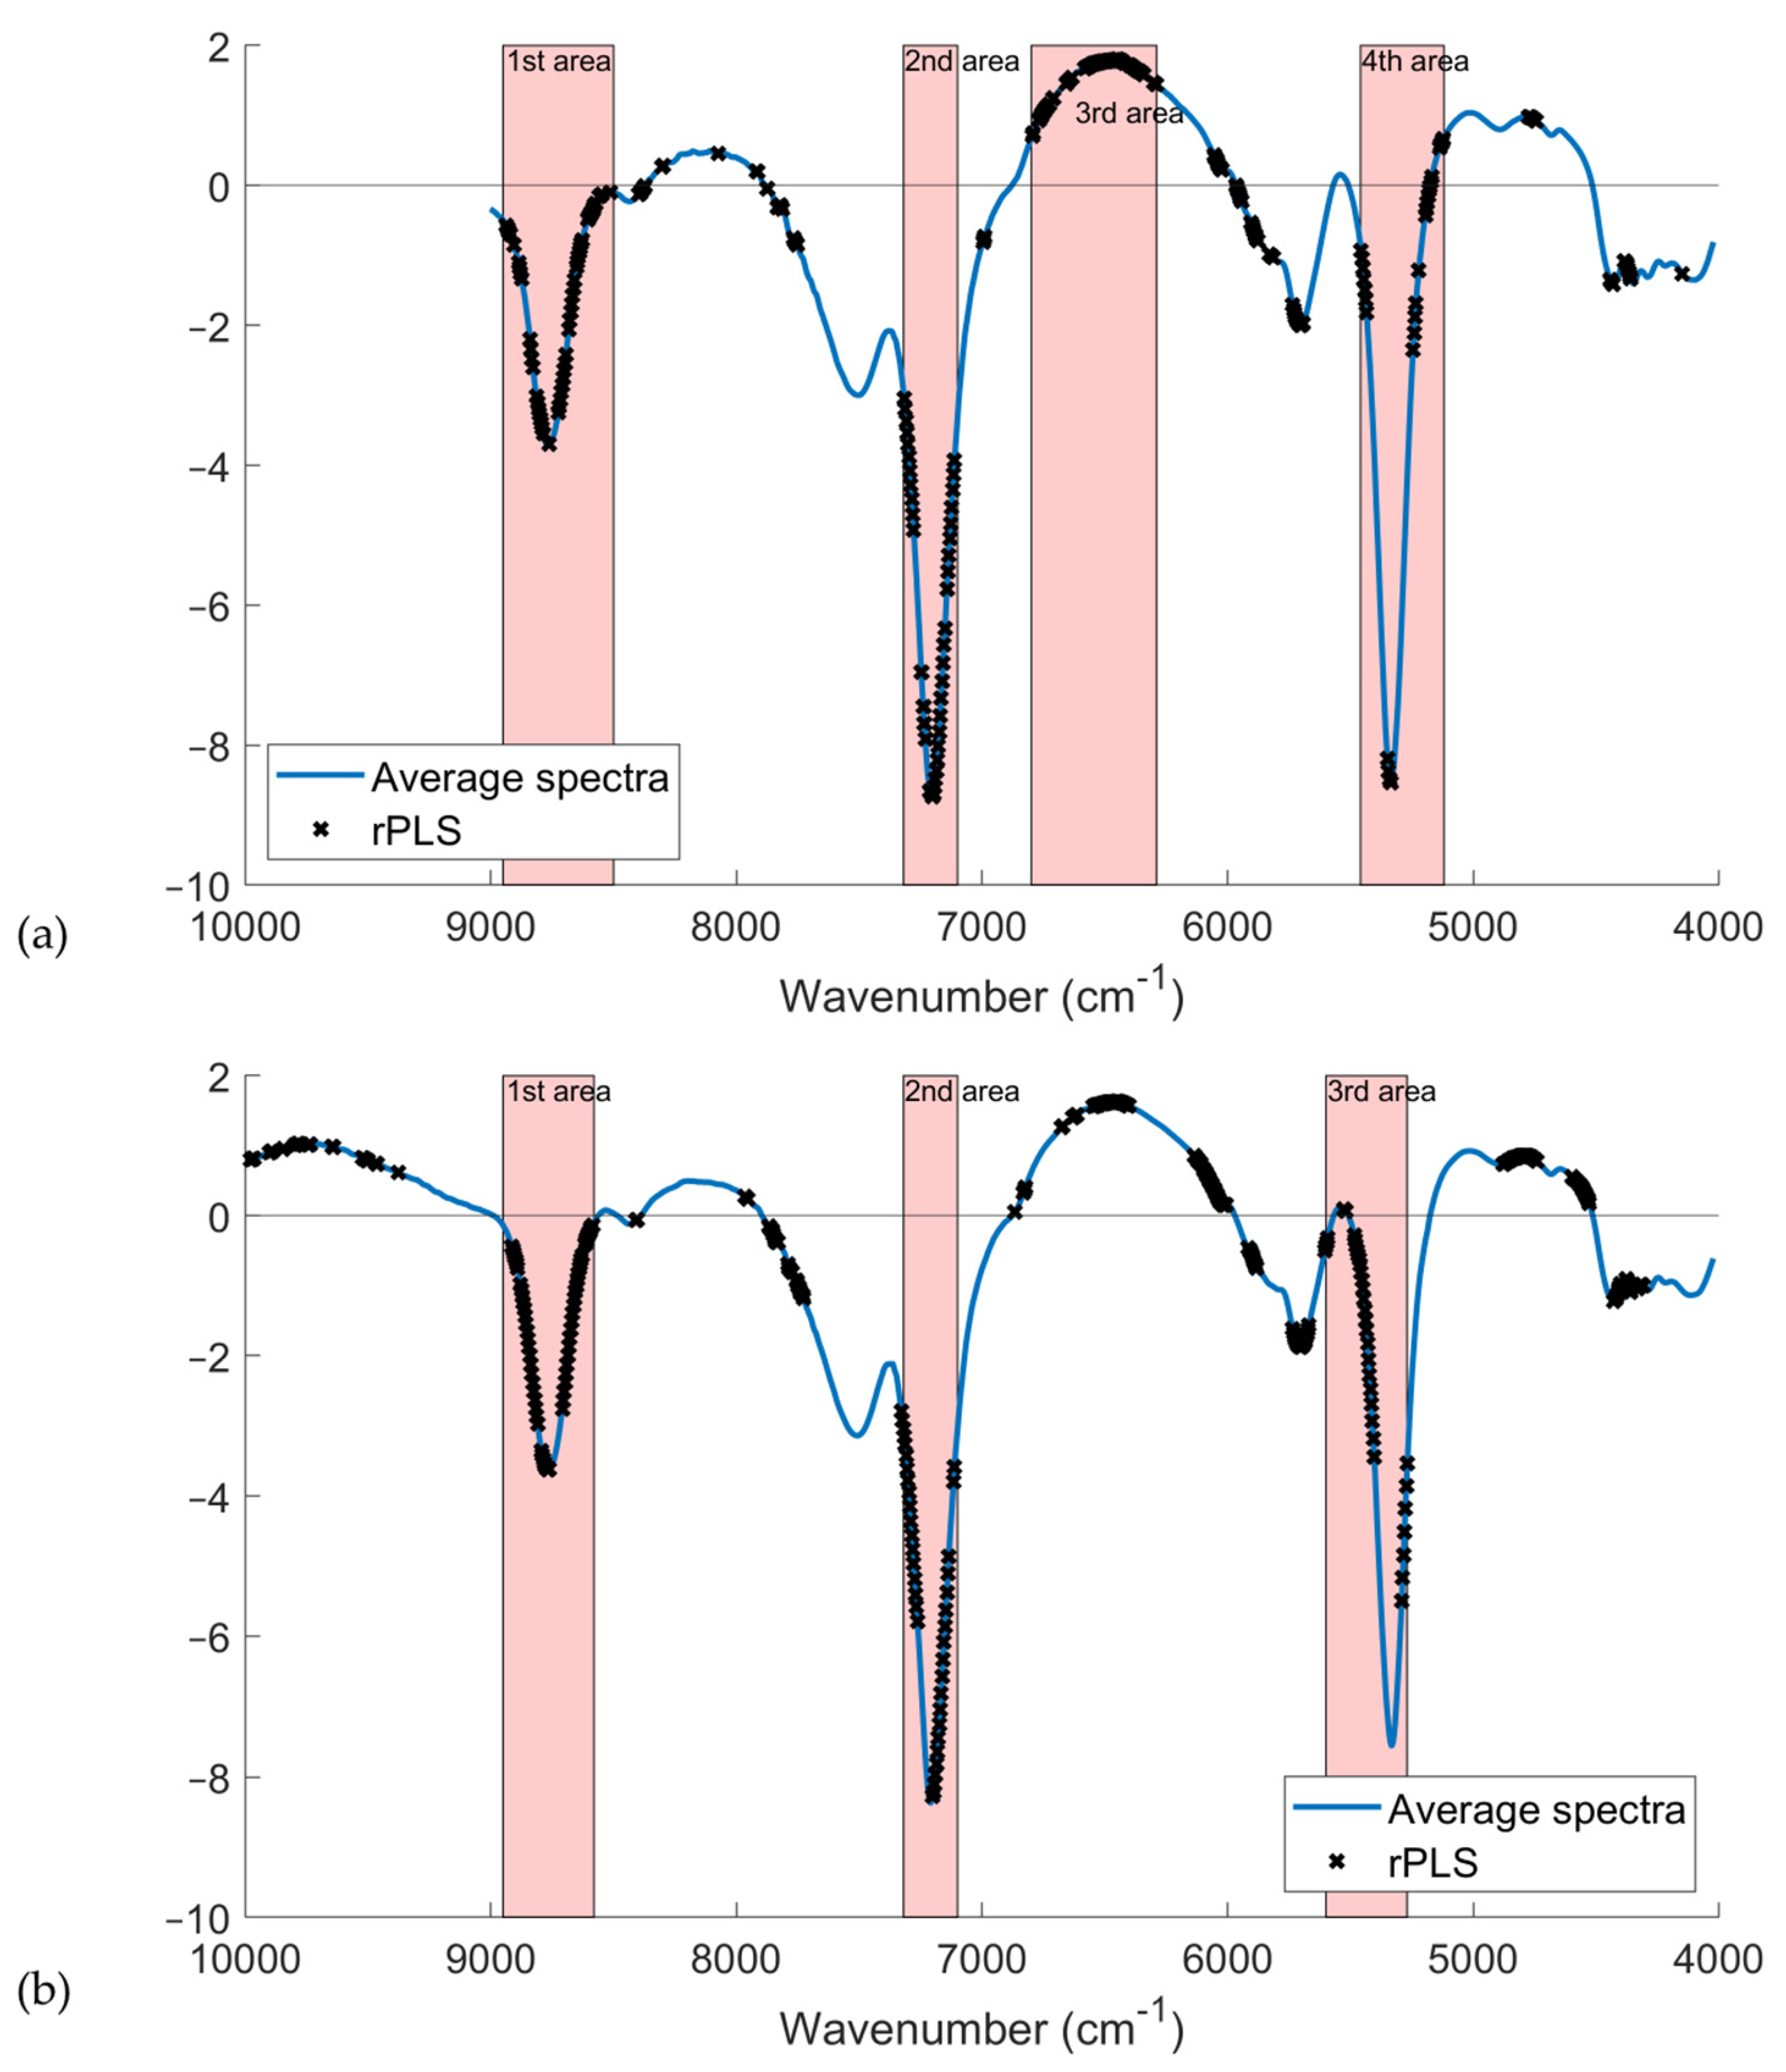
Variable selection has different benefits, including improving the performance of models in terms of prediction, reducing computation time, and facilitating data visualization/interpretability of the models. This last aspect is particularly important for an overall better understanding of the process/results. For this reason,
Figure 6 reports the average spectrum with variables selected by the rPLS for both the DB-2020 and DB-2021 datasets. It is interesting to note that both models selected almost the same spectral areas. In detail, the first (8950–8500 cm
−1) and second (7320–7100 cm
−1) areas matched and were assigned to the second overtone of CH and the first overtone of CH combination bonds, respectively. The rPLS model for DB-2020 also selected variables in the region between 6800 and 6290 cm
−1, which were assigned to the first overtone of OH bonds, while the rPLS model for DB-2021 selected only some wavenumbers in that region. On the other hand, the rPLS for DB-2021 selected variables in a broader third area (5600–5270 cm
−1), which was assigned to OH combination bands, while the rPLS for DB-2020 had a more narrow range (5120–5460 cm
−1).
The fact that the models did not differ significantly is an indication that the system is robust, and that the information on the SSC content wass spread throughout three/four regions of the spectra. This is in line with the findings reported in
Section 3.3 and
Section 3.4.
3.8. Global PLS
The DB-2020 and DB-2021 datasets were merged to investigate if it was possible to develop a global model able to predict the SSC of strawberry fruits from different seasons. First of all, DB-2020 was used as a training set and DB-2021 as a test set, and vice versa. The results demonstrated that it is not possible to develop a model on the data of one harvest season and predict the samples of another season. The prediction model should also contain a percentage of the strawberry fruits of the season to be predicted. This demonstrated the season variability of the fruit, whose characteristics are strongly influenced by environmental and pedoclimatic conditions changing year to year. Even fruits of the same cultivar can present quite different qualitative characteristics in different harvest seasons [
1]. Of course, the model maintenance is expected to last at least a few years until fruit variability is fully described, which would then ensure having strong models and more reliable results.
For this reason, calibration models were cross-validated by leaving out samples from both seasons at the same time; the same applied to the test set. A total of 692 fruit samples were used as a training set and 300 samples as a test set using a duplex algorithm. In detail, around 30% of DB-2020 (132 samples) and 30% of DB-2021 (168 samples) were used as a test set, and the remaining samples were used as a training set. One outlier sample was removed before PLS computation (as also reported in
Section 3.6).
Table 4 reports the results of the best models developed from the merged DB-2020 and DB-2021 datasets. The best prediction model was obtained using a first derivative (Savitzky–Golay with 21 smoothing points and second order) as pretreatment. The model used eight LVs and returned an R
2p = 0.66, a RMSEP of 0.98 °Brix, a RPD = 1.70, and a RER = 10.20. PLS models were also computed to only considering the wavenumber range between 9000 cm
−1 to 4000 cm
−1. The results are also reported in
Table 4. The best performing models were developed by considering a first derivative (Savitzky–Golay with 13 or 21 smoothing points and second order) and SNV as pretreatments. In any case, the models did not improve the performance with respect to the full-range model.
Variable selection techniques were applied to the best performing model reported in
Table 4.
Table 4 reports the results of the best prediction models using variable selection techniques. rPLS led to variable reduction without any improvement in the prediction performance. iPLS (forward, 50 intervals) led to a significant improvement. The RMSEP value decreased from 0.98 °Brix to 0.90 °Brix, the R
2p increased from 0.66 to 0.71, the RPD increased from 1.70 to 1.86, and the RER increased from 10.20 to 11.11. The values indicate the possibility to use the model for screening applications.
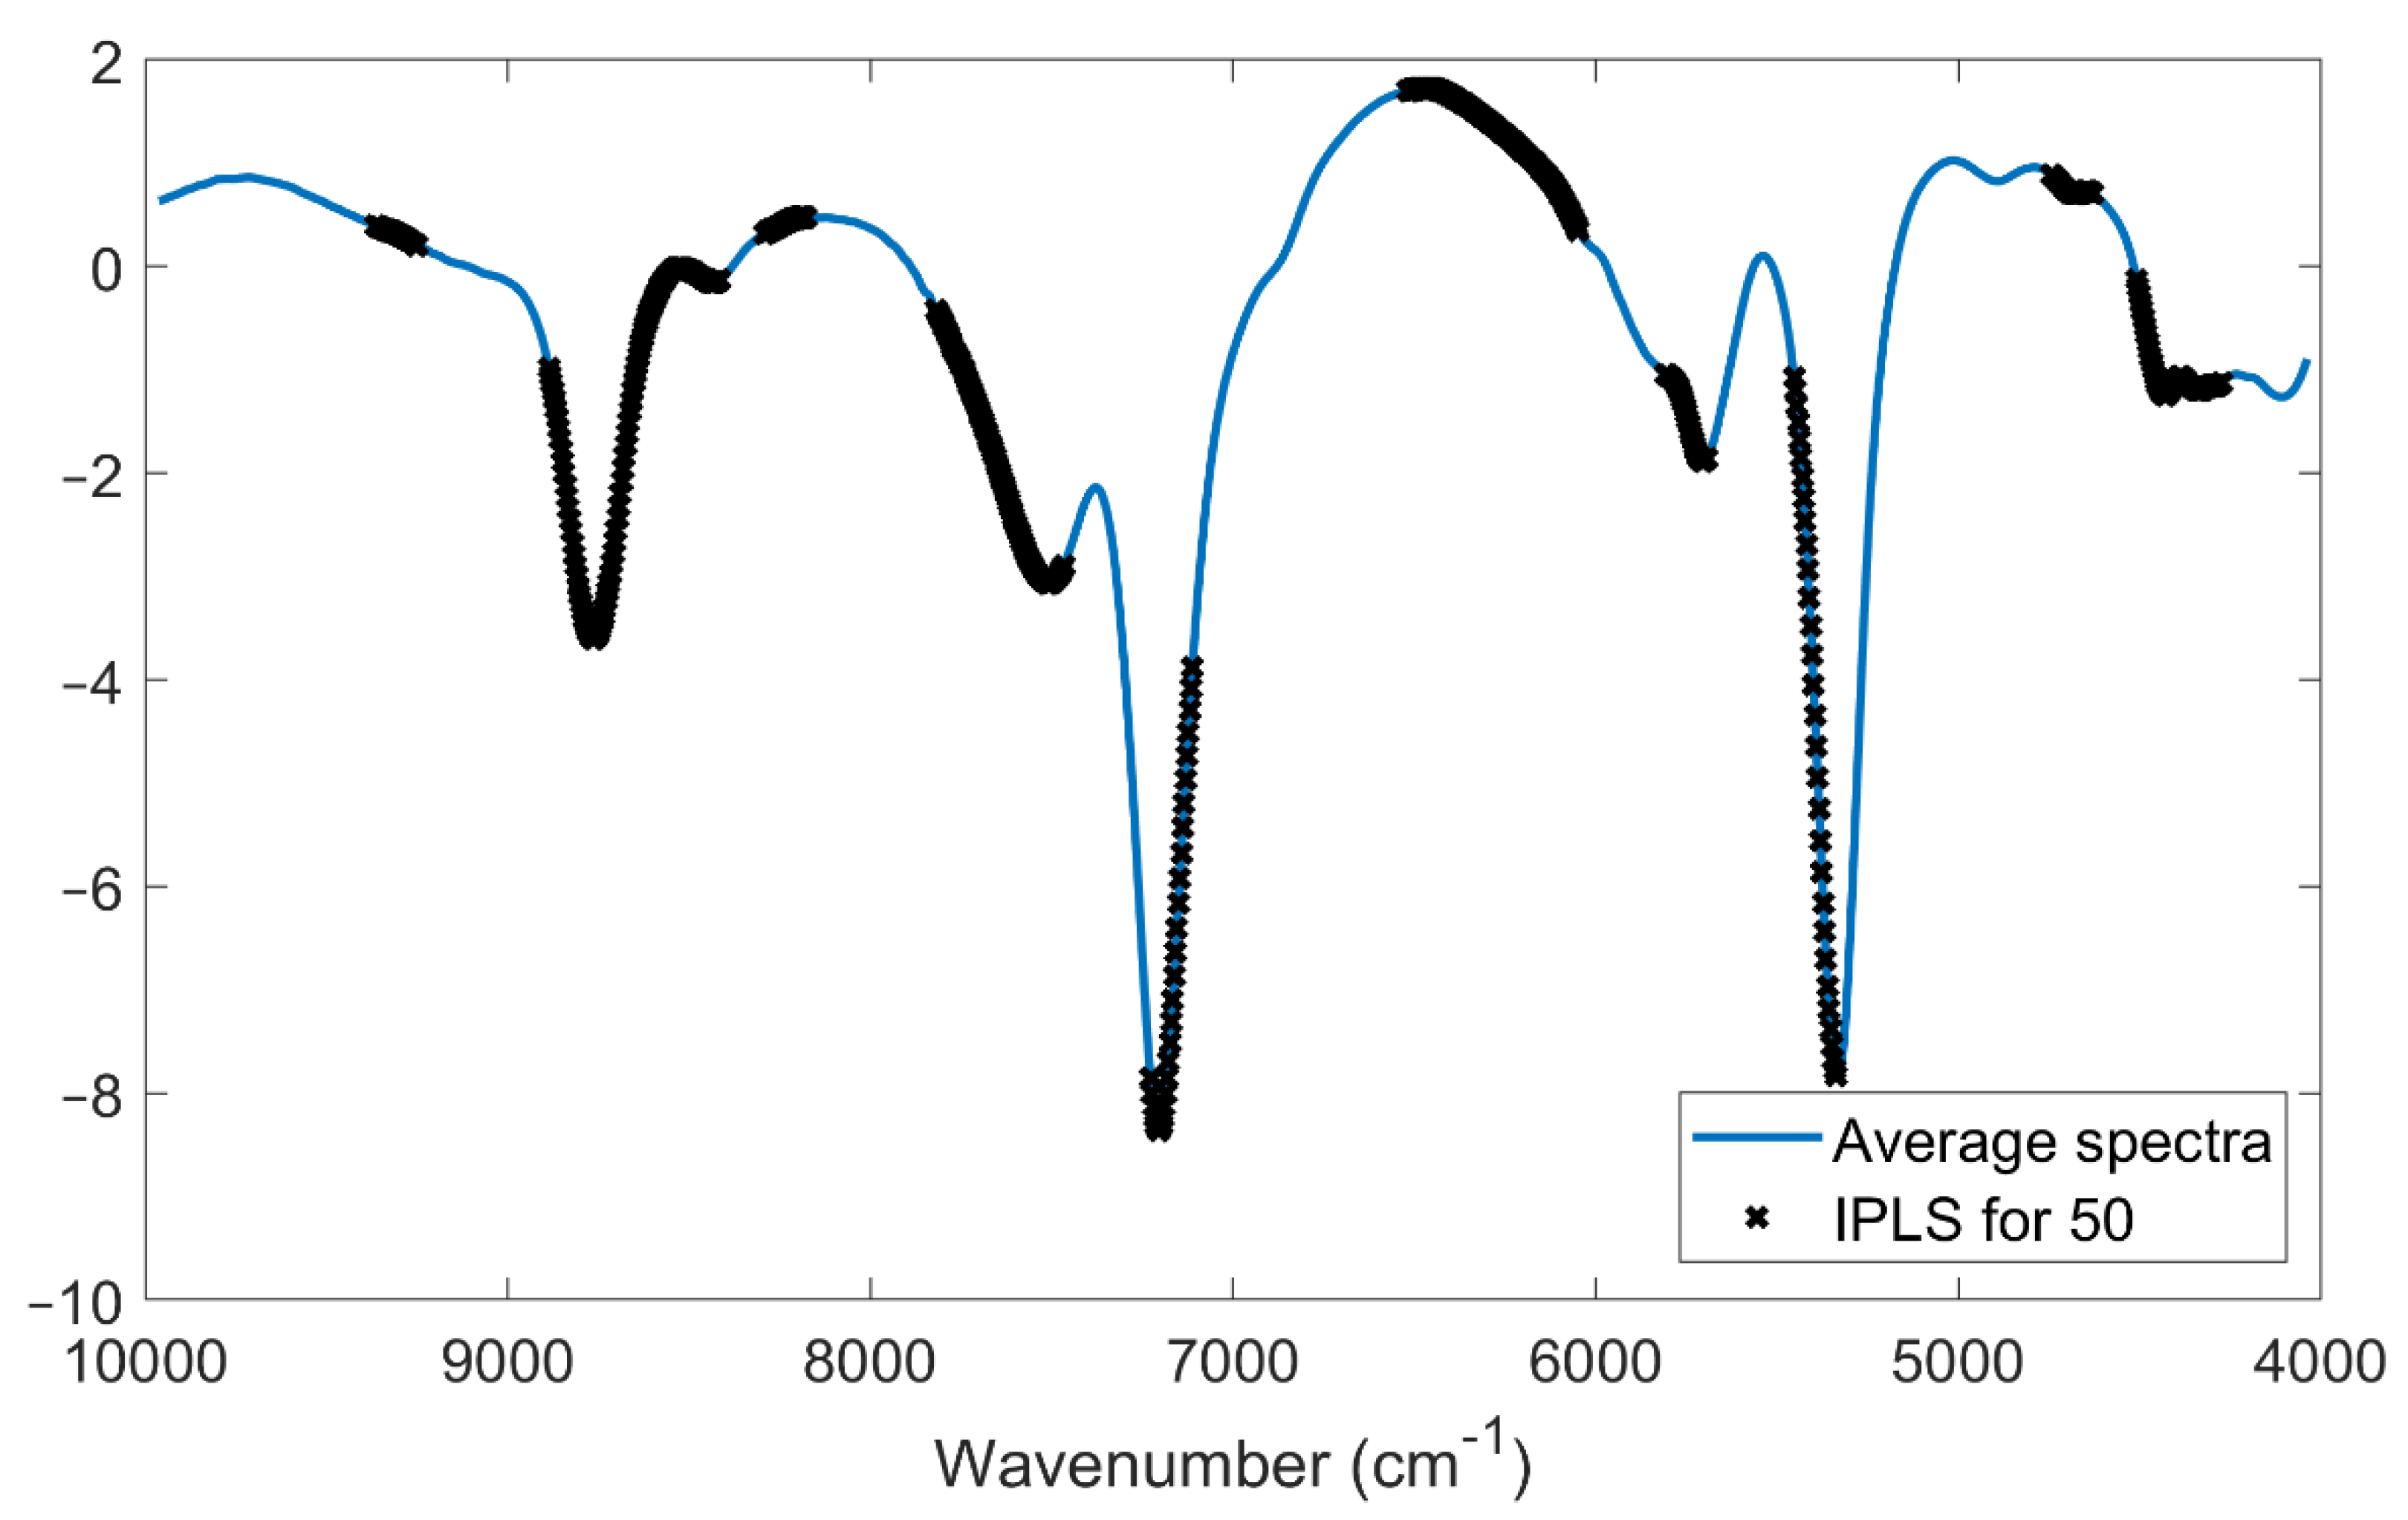
As for the other prediction models, the variables selected by the forward iPLS (50 size interval) method were investigated to figure out the most relevant wavenumbers for the prediction of the SSC and to facilitate the data interpretability of the model. It can be noted in
Figure 7 that the iPLS method applied to the merged DB-2020 and DB-2021 selected the same spectral areas reported in
Figure 6, which confirmed the robustness of the model and that the information of the SSC content was spread throughout the same region of the spectrum.
4. Discussion
The results of this present study are in agreement with those obtained by other authors; Włodarska et al. [
24] found in the NIR range an external test set for predicting strawberry juice (R
2p = 0.98, RMSEP = 0.25%) and fruit (R
2p = 0.93, RMSEP = 0.46%) SSC. Amodio et al. [
26] also used an external test set to predict SSC in strawberry fruits with an R
2p = 0.85 and a RMSEP of 0.58%. Shen et al. [
25] reported that postharvest strawberry quality (SSC) could be predicted online with an R
2p = 0.733, a RMSEP = 0.699 °Brix, and a RPD of 1.96. Also, the study of Sánchez et al. [
15] used the LOCAL-PLS algorithm to predict the SSC in nine strawberry cultivars; they reported an R2p = 0.69 and a SEP = 0.88%. In a recent study, Xie et al. [
50] investigated the relationship between optical properties (i.e., the absorption coefficient and scattering coefficient) and the internal quality of the strawberry (i.e., SSC and moisture content) by using partial least squares regression and support vector machine methods. The authors demonstrated the correlation between optical properties and strawberry quality, which confirmed that the development of non-destructive techniques will open up interesting perspectives for fruit internal quality control.
As previously mentioned, the strawberry chemical composition is strongly influenced by many factors, including pedoclimatic and environmental conditions. The different characteristics of the 2020 and 2021 harvest seasons, especially regarding weather conditions, affected the sensorial characteristics of the strawberry fruits in terms of SSC, which also caused differences in the results for the same cultivars. Furthermore, the presence of heavy rains close to the harvest moment affected the fruit integrity of the external surface; this led to a higher fruit susceptibility to
B. cinerea, which, in turn, can alter neutral sugar and sugar acid levels in the infected host tissues [
41], which affects the good results and the reproducibility of the prediction model.
The NIR method does not replace laboratory methods, but can be used in screening and evaluation processes that give an indication of the quality of fruit products. This method has the potential to become an important decision-making tool for the various stakeholders involved in the strawberry fruit chain. Moreover, this technology can be used both at line and offline. In this case, the main benefits gained from implementing this technology are simplified analytical execution, lower cost, and faster execution.

 ,
, 


