Article

Supplemental Lighting Quality Influences Time to Flower and Finished Quality of Three Long-Day Specialty Cut Flowers

Department of Horticulture, Michigan State University, East Lansing, MI 48824, USA
*
Author to whom correspondence should be addressed.
Horticulturae 2023, 9(1), 73; https://doi.org/10.3390/horticulturae9010073
Submission received: 2 December 2022 / Revised: 28 December 2022 / Accepted: 31 December 2022 / Published: 6 January 2023
(This article belongs to the Section Floriculture, Nursery and Landscape, and Turf)

Abstract

:
Year-round demand for locally sourced specialty cut flowers continues to increase. However, due to low radiation intensities and temperatures, growers in northern latitudes must utilize greenhouses, but limited production information detailing manipulation of the radiation environment exists. Therefore, our objective is to quantify the influence of supplemental lighting (SL) quality on time to flower and harvest and stem quality of three long-day specialty cut flowers. Godetia ‘Grace Rose Pink’ (Clarkia amoena), snapdragon ‘Potomac Royal’ (Antirrhinum majus), and stock ‘Iron Rose’ (Matthiola incana) plugs are transplanted into bulb crates and placed in one of six greenhouse compartments with SL providing a total photon flux density of 120 µmol·m−2·s−1 from 0700 to 1900 HR. After four weeks, SL is extended to provide a 16 h photoperiod to induce flowering. SL treatments are provided by either high-pressure sodium (HPS) fixtures or various light-emitting diode (LED) fixtures. Treatments are defined by their 100 nm wavebands of blue (B; 400–500 nm), green (G; 500–600 nm), red (R; 600–700 nm), and far-red (FR; 700–800 nm) radiation (photon flux density in μmol·m−2·s−1) as B7G60R44FR9 (HPS120), B20G50R45FR5, B20R85FR15, B30G25R65, B120, or R120. Time to harvest (TTH) is up to 14, 15, and 10 d slower under R120 SL for godetia, snapdragon, and stock, respectively, compared to the quickest treatments (HPS120, B120, and B20R85FR15 SL). However, R120 SL produces cut flowers up to 18% longer than those grown under the quickest treatments. Both broad-spectrum LED fixtures slightly delay TTH compared to the quickest treatments. Stem caliper is not commercially different between treatments for godetia or snapdragon, although stems are up to 14% thinner for stock grown under B120 SL compared to the other treatments. Flower petal color is not commercially different between SL treatments. We recommend utilizing a SL fixture providing a spectrum similar to B20R85FR15 SL or B20G50R45FR5, as they elicit desirable crop responses with minimal developmental, quality, and visibility tradeoffs. While HPS lamps perform similarly to the recommended fixtures, we recommend utilizing LEDs for their higher photon efficacy and potential energy savings.

1. Introduction

Demand for locally produced specialty cut flowers exists year-round [1,2]. However, low radiation intensities and temperatures in northern latitudes prohibit the production of specialty cut flowers outdoors or in unheated high tunnels during the winter and early spring [3,4]. For example, the outdoor solar daily light integral (DLI) can fall to as low as 5 to 10 mol∙m−2∙d−1 [5] and as low as ≤5 mol∙m−2∙d−1 in controlled-environment greenhouses because of reflection from glazing and shading from the superstructure [6]. Because of these unfavorable environmental conditions, greenhouses with high-intensity supplemental lighting (SL) must be employed to maintain environmental conditions suitable for cut flower growth, so growers can tap into local markets and satisfy consumer demand throughout the year.
In recent years, the advent of horticultural light-emitting diodes (LEDs) has given growers the potential to further customize the emission spectra of their lighting sources, allowing for the inclusion of narrow wavebands [7,8,9,10]. Thus, a large variety of SL fixtures with different static or customizable emission spectra have become commercially available. The composition of radiation emitted from a lighting fixture can have substantial effects on plant growth and development, especially when the solar DLI is low [11,12], with some wavebands acting not only as photosynthetic stimuli, but as developmental signals [13]. Photosynthetically active radiation (PAR; 400–700 nm) is primarily responsible for driving photosynthesis, although isolated wavebands within and outside of this range can bring about specific photomorphogenic responses. Although outside of the traditional definition of PAR, far-red (FR) radiation (700–800 nm) has recently been shown to contribute to photosynthesis directly by working synergistically with photons within the traditional designation of PAR, and indirectly by promoting leaf expansion [14,15,16,17,18]. However, the inclusion of FR radiation in the range of PAR is yet to be widely accepted by the greater scientific community. For decades, however, it has been broadly understood that FR radiation predominantly influences plant morphology and development [9,17,19,20].
Photomorphogenic responses such as internode elongation, leaf expansion, and flowering are regulated by various photoreceptors within plant cells including cryptochromes, phototropins, and phytochromes [10,12,17]. For instance, a decreasing ratio of red (R; 600–700 nm) and FR radiation emitted from a radiation source generally promotes extension growth [9,21], which is a function of phytochrome photoreceptors [21,22]. The influence of R and FR radiation on crop morphology is well-documented. For instance, Elkins and van Iersel [19] reported that the height of foxglove ‘Dalmatian Peach’ (Digitalis purpurea) cut flower seedlings grown under sole-source lighting for 16 h·d−1 increased by 38% as the R to FR ratio of the light source decreased from 13.7 to 0.6.
Phytochrome photoreceptors exist in two reversible conformations: PR and PFR. These conformations are designated as the “inactive” and “active” conformations, respectively [10,23], as PFR is primarily responsible for initiating phytochrome-mediated photomorphogenic responses on the cellular level [12]. The ratio of R:FR radiation in a radiation source’s spectrum can influence the ratios of these conformations. When exposed to R radiation, PR changes conformation to PFR, while PFR can revert to PR in the presence of either FR radiation or through natural degradation [24]. The ratio of these phytochrome conformations is referred to as the phytochrome photoequilibrium (PPE; PFR/PR+FR), and it is closely associated with the activity of phytochromes within plant cells [23,24].
R and FR radiation are not only prominent drivers of crop architecture; they are also integral to the flowering responses of many long-day plants (LDPs) [25,26]. When grown under a FR-radiation deficient filter, flowering of campanula ‘Blue Clips’ (Campanula carpatica), coreopsis ‘Early Sunrise’ (Coreopsis ×grandiflora) and pansy ‘Crystal Bowl Yellow’ (Viola ×wittrockiana) was delayed by 2, 14, and 21 d, respectively, compared to plants grown under a neutral filter that allowed for the transmission of FR radiation [26]. It has also been shown that SL emitting moderate intensities of FR radiation (≥15 µmol∙m−2∙s−1) can hasten flowering in LDPs compared to SL without FR radiation [27]. For instance, the LDP snapdragon ‘Liberty Classic Yellow’ (Antirrhinum majus) grown under SL containing 15 µmol∙m−2∙s−1 of FR radiation for a 16 h·d−1 for 28 d during the plug stage reached open flower 6 d faster than plants grown under SL containing only blue (B) and R radiation during the plug stage [27].
B radiation (400–500 nm) inhibits extension growth in many crops, which is a function of cryptochrome and phototropin photoreceptors [28,29,30]. However, B radiation mediated stem compaction responses are species-specific, and some crops defy this phenomenon [12]. In a 2017 study, Poel and Runkle reported that geranium ‘Pinto Premium Salmon’ (Pelargonium ×hortorum) and petunia ‘Single Dreams White’ (Petunia ×hybrida) grown under (%) B45R55 LEDs emitting a photosynthetic photon flux density (PPFD) of 90 ± 10 µmol∙m−2∙s−1 for 16 h·d−1 were ≈17% and 22% shorter, respectively, than those grown under SL provided by B10G5R85 LEDs [10]. In a separate study, poinsettia ‘Christmas Spirit’ and ‘Christmas Eve’ (Euphorbia pulcherrima) grown under 100 ± 20 µmol·m−2·s−1 of high-pressure sodium (HPS) SL with 5% B radiation for 10 h·d−1 were ≈52% and 36% taller, respectively, than those grown under the same intensity and duration of SL provided by LEDs emitting 20% B radiation for 12 weeks [31].
Additionally, a moderate intensity of B radiation can function as a long-day signal for some crops. For instance, a 4 h night interruption (NI) provided by 30 µmol·m−2·s−1 of B radiation was as effective as a 4 h NI provided by 2 µmol·m−2·s−1 from R + white (W) + FR LEDs at promoting flowering in calibrachoa ‘Callie Yellow Improved’ (Calibrachoa ×hybrida), coreopsis ‘Early Sunrise’, petunia ‘Wave Purple Improved’, rudbeckia ‘Indian Summer’ (Rudbeckia hirta), and snapdragon ‘Liberty Classic Yellow’ [32]. Furthermore, Sharath Kumar et al. [33] demonstrated the efficacy of a 4 h day extension (DE) provided by 40 µmol·m−2·s−1 of 100% B radiation at inhibiting flowering of greenhouse-grown chrysanthemum ‘Radost’ (Chrysanthemum morifolium).
Traditionally, high-intensity horticultural LED fixtures utilized a combination of B and R diodes because of the higher absorption of B and R photons in upper leaf cells, consistent with the peak absorbances of chlorophyll a and b, compared to other wavebands [34,35]. However, recent research has found that green radiation (G; 500–600 nm) can be comparably effective for photosynthesis. For example, Liu and van Iersel [35] reported that whole-plant photosynthetic efficacy of G radiation applied to lettuce ‘Green Towers’ (Lactuca sativa) was higher than that of B radiation when applied at intensities > 500 µmol·m−2·s−1, as G photons are transmitted farther into the plant canopy than other wavebands [8,35].
In addition to stimulating photosynthesis, G radiation has been shown to inhibit branching of some ornamental plants when applied at moderate intensities [36]. For example, petunia ‘Easy Wave Burgundy Star’ had an average of roughly five fewer lateral branches when the G radiation photon flux density (PFD) during a 16 h DE was 25 µmol·m−2·s−1 compared to 2 µmol·m−2·s−1. Furthermore, moderate fluxes of G radiation can serve as a long-day signal for some floriculture crops [36]. G radiation saturated the flowering response of ageratum ‘Hawaii Blue’ (Ageratum houstonianum) when applied at intensities of 2 µmol·m−2·s−1 during a 16 h DE, although 13 µmol·m−2·s−1 was required to saturate the flowering responses of petunia ‘Easy Wave Burgundy Star’ and ‘Wave Purple Improved’, and snapdragon ‘Liberty Classic Yellow’ [36]. Furthermore, in several studies on nonhorticultural crops, G radiation inhibited some B radiation-mediated photomorphogenic responses, such as hypocotyl compaction and anthocyanin accumulation [12]. In addition, certain fluxes of G radiation can elicit stem elongation responses similar to that of FR radiation, which can be counteracted with B radiation [37]. Interestingly, stem elongation of plants exposed to a combination of G and FR radiation was greater than that of plants exposed to either waveband alone [38].
When applied simultaneously, B, G, R, and FR wavebands can have compounding effects on crop growth and development. Height of high-wire cucumber ‘Elsie’ (Cucumis sativus) and tomato ‘Climstar’ (Solanum lycopersicum) were up to ≈17% and 25% taller when grown under 120 µmol·m−2·s−1 of B30G30R60 SL for 16 h·d−1 compared to the same intensity and duration of B25R95 SL, suggesting that the addition of G radiation counteracted B-mediated plant compaction, producing taller plants [39]. Moreover, when B, G, and R radiation is applied together, the resulting broad-spectrum radiation appears white (W) to the human eye, increasing the visibility in the work environment. This can aid in detection of pests and nutrient deficiencies compared to spectra comprised of one or two wavebands [34].
Radiation quality can also influence flower petal color by influencing the accumulation of pigments such as anthocyanins, carotenoids, and flavonoids [40,41]. Petal color is influenced in part by petal morphology, i.e., tissue thickness and inhomogeneity [40], which may be affected by radiation quality. While flower color is of ecological importance to angiosperms as it helps attract specific pollinators [40], it is also of significant aesthetic importance to consumers [42]. Manipulating radiation quality to produce cut flowers with more vibrant colors can increase consumers’ willingness to buy and the subsequent product enjoyment [42].
To our knowledge, minimal research examining the influence of supplemental radiation quality on the greenhouse production of LDP specialty cut flowers has been published and, thus, additional research could provide utility to cut flower greenhouse growers. Therefore, the objective of this study was to quantify the influence of SL radiation quality on time to flower and harvest and on the finished quality of three long-day specialty cut flowers. We hypothesized that flowering would be delayed for plants grown under SL lacking FR radiation. Additionally, we hypothesized that plants grown under R120 SL would exhibit greater stem elongation compared to the other treatments, particularly B120 SL, where we predicted that stems would remain compact. We also postulated that treatments with a combination of B, G, R, and FR wavebands would yield shorter cut flowers when the emission spectrum contained a higher flux of B radiation and longer cut flowers when the emission spectrum contained a higher flux of FR radiation.

2. Materials and Methods

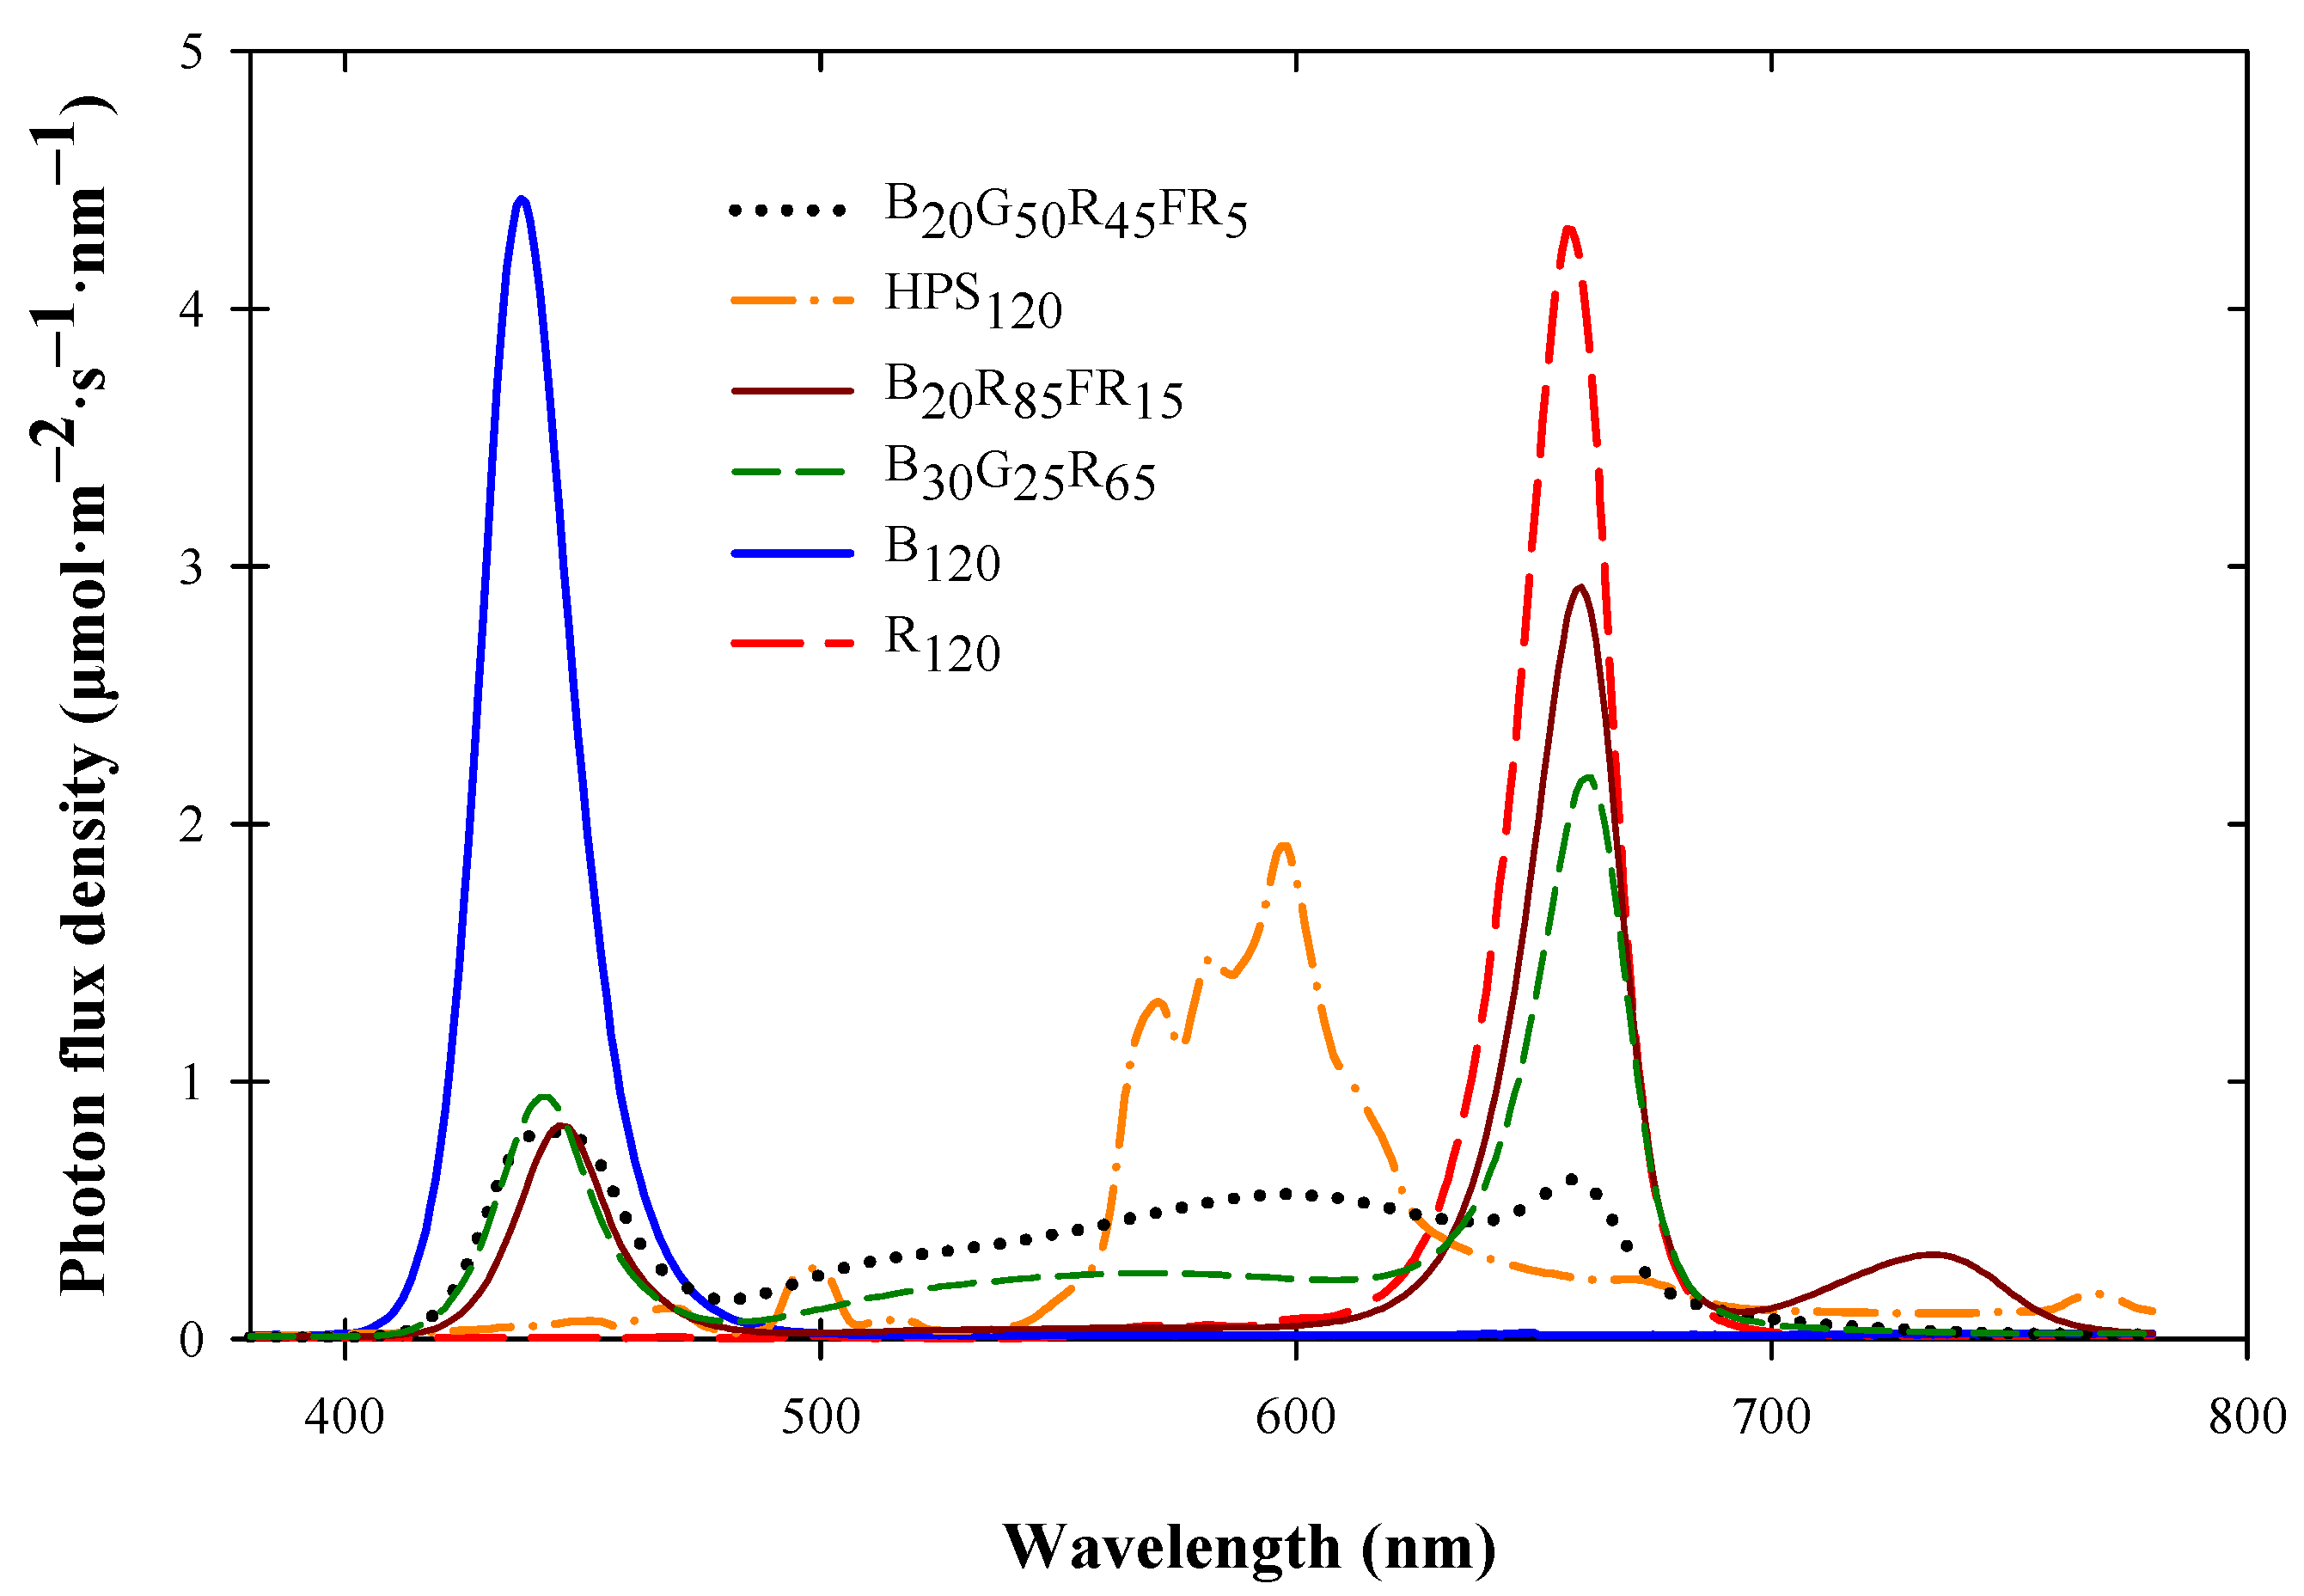
2.1. Plant Material, Culture, and Lighting Treatments

Seeds of godetia ‘Grace Rose Pink’ (Clarkia amoena; Sakata Seed America, Morgan Hill, CA, USA), snapdragon ‘Potomac Royal’ (PanAmerican Seed, West Chicago, IL, USA), and stock ‘Iron Rose’ (Matthiola incana; Sakata Seed America) were sown in 162-cell trays at a commercial propagator (Raker-Roberta’s Young Plants, Litchfield, MI, USA). Three trays each of godetia, snapdragon, and stock were received one day after sowing on 18 December 2020 (Replication (Rep.) 1) and 28 December 2021 (Rep. 2).
Young plants were grown in a glass-glazed greenhouse under a natural short-day photoperiod with LED fixtures (Philips GP-TOPlight DRW-MB; Koninklijke Philips N.V., Eindhoven, The Netherlands) providing a supplemental PPFD of ≈200 µmol·m−2·s−1 from 0730 to 1730 HR, creating a DLI of ≈15 mol·m−2·d−1. The greenhouse air average daily temperature (ADT) set point during young plant culture was a constant 16 °C. Stock were thinned after cotyledon expansion to increase the amount of double flowering phenotypes, according to protocols provided by the breeder [43]. Godetia and snapdragon were thinned upon cotyledon expansion. Young plants were irrigated as needed with MSU Plug Special (13 N–2.2 P–10.8 K water-soluble fertilizer containing (mg·L–1) 61 nitrogen, 10 phosphorus, 50 potassium, 28.1 calcium, 4.7 magnesium, 1.3 iron, 0.6 manganese, 0.6 zinc, 0.6 copper, 0.4 boron, and 0.1 molybdenum (GreenCare Fertilizers Inc., Kankakee, IL, USA)) blended with reverse-osmosis water and applied with a mist nozzle (Super Fine Fogg-It Nozzle; Fogg-It Nozzle Co. Inc., Belmont, CA, USA).
After 30 d under short days (17 January 2021 (Rep. 1) and 27 January 2022 (Rep. 2)), 180 godetia, snapdragon, and stock young plants were randomly selected for transplant. Seventy-two bulb crates (39.3 cm wide × 59.7 cm long × 17.8 cm tall; 0.04 m3) were filled with a soilless medium containing (by volume) 70% peat moss, 21% perlite, and 9% vermiculite (Suremix; Michigan Grower Products Inc., Galesburg, MI, USA). Each bulb crate held 10 young plants of an individual genus, yielding 18 total bulb crates per genus. Young plants were transplanted at a density of 43 plants per m2.
Three bulb crates of each genus were placed on benches on the ground in one of six glass-glazed greenhouse compartments. High-intensity SL fixtures providing a total photon flux density of 120 µmol·m−2·s−1 from 0700 to 1900 HR, creating a total DLI of ≈11 mol·m−2·d−1. This was denoted as the vegetative stage. After four weeks, SL duration was increased to provide a 16 h photoperiod from 0600 to 2200 HR, creating a total DLI of ≈15 mol·m−2·d−1. This was denoted as the reproductive stage. Whitewash (KoolRay Classic Liquid Shade, Continental Products, Euclid, OH, USA) and/or opaque black cloth covered compartment walls to prevent radiation pollution between compartments and adjacent greenhouses. A quantum sensor (LI-190R, LI-COR Biosciences, Lincoln, NE, USA) positioned horizontally at plant height in each compartment measured the PPFD every 10 s and a datalogger (CR1000; Campbell Scientific, Logan, UT, USA) recorded hourly averages. The actual DLIs during the vegetative and reproductive stages of the two replications of the experiment were calculated and are provided in Table 1 and Table 2.
SL treatments consisted of either 460 W HPS fixtures (LR48877; P.L. Light Systems, Beamsville, ON, Canada), 631 W LED fixtures (VYPR 2p; Fluence, Austin, TX, USA), 325 W LED fixtures (LumiGrow Pro 325; LumiGrow, Emeryville, CA, USA), 600 W LED fixtures (LX601G, Heliospectra, Göteborg, Sweden), a combination of 72 W LED fixtures (HortiLED MULTI, P.L. Light Systems) and 625 W LED fixtures (LumiGrow Pro 650E, LumiGrow), or 625 W LED fixtures (LumiGrow Pro 650E; LumiGrow). SL treatments, defined by the PFD delivered at each 100 nm waveband of B (400–500 nm), G (500–600 nm), R (600–700 nm), and FR (700–800 nm) radiation, were B7G60R44FR9 (HPS120), B20G50R45FR5, B20R85FR15, B30G25R65, B120, or R120, respectively. The spectral distribution of the SL fixtures was measured at crop height in ten random locations throughout each compartment with a spectrometer (LI-180; LI-COR Biosciences) and are presented in Figure 1. The PPE of each SL treatment were estimated according to Sager et al. (1988) and are presented in Table 3.
Two layers of 15 cm supportive netting (HGN32804; Hydrofarm, Petaluma, CA, USA) were positioned ≈15 and 30 cm, respectively, above each bench. Greenhouse compartments were equipped with evaporative-pad cooling and radiant hot water heating, which, in addition to lighting fixtures, were controlled by an environmental control system (Priva Office version 725–3030, Vineland Station, ON, Canada). The air ADT set points in each greenhouse compartment were 15.8 °C (day/night 18.5/13 °C), with day temperatures maintained from 0800 to 1900 HR and night temperatures maintained from 1900 to 0800 HR. An aspirated thermocouple (36-gauge (0.127 mm diameter) type E, Omega Engineering, Stamford, CT, USA) positioned in the middle of each compartment measured the air temperature at plant height every 10 s, and the datalogger recorded hourly means. Additionally, an infrared thermocouple (Type T, OS36-01; Omega Engineering) positioned against an individual leaf of a snapdragon plant in each compartment measured leaf temperature every 10 s, and the datalogger recorded hourly means. The actual air ADTs, average daytime and nighttime temperatures at plant height, as well as average leaf temperatures of each treatment during the vegetative and reproductive stages of the two reps. of the experiment were calculated and are provided in Table 1 and Table 2.
Plants were irrigated as needed with MSU Orchid RO Special (13 N–1.3 P–12.5 K water-soluble fertilizer containing (mg∙L–1) 125 nitrogen, 13 phosphorus, 121 potassium, 76 calcium, 19 magnesium, 1.7 iron, 0.4 copper and zinc, 0.9 manganese, 0.2 boron, and 0.2 molybdenum (GreenCare Fertilizers Inc.)), blended with reverse-osmosis water.

2.2. Data Collection and Analysis

Plants were monitored daily for the presence of the first visible flower bud (VB) and first open flower (OF). On the date of harvest (≥50 cm tall and three OFs for godetia; ≥50 cm tall and inflorescence 50% open for snapdragon; ≥45 cm tall and inflorescence 50% open for stock), stem length from the substrate surface to the tallest point of the inflorescence and caliper at the thickest point of the stem (recorded with a digital caliper (3-inch carbon fiber digital caliper, General Tools & Instruments, LLC, New York, NY, USA)) were recorded for all plants. Additionally, the total number of initiated inflorescences and branch number were recorded for snapdragon. A colorimeter (CR-20 Color Reader; Konica Minolta Sensing, Inc., Chiyoda, Tokyo, Japan) was utilized to measure flower petal color on three petals of each plant. Godetia flower color measurements were taken on the pink portion of the flower petal interiors. Data were analyzed using the SAS (version 9.4; SAS Institute, Cary, NC, USA) mixed-model procedure (PROC MIXED) for analysis of variance (ANOVA), and means were separated by Tukey’s honest significant difference (hsd) test at p ≤ 0.05. SAS general linear models procedure (PROC GLM) was used to fit regressions. Godetia and stock data were pooled across replications because of low harvestable stem yield and undetected single-flowering phenotypes being removed after transplant, respectively.

3. Results

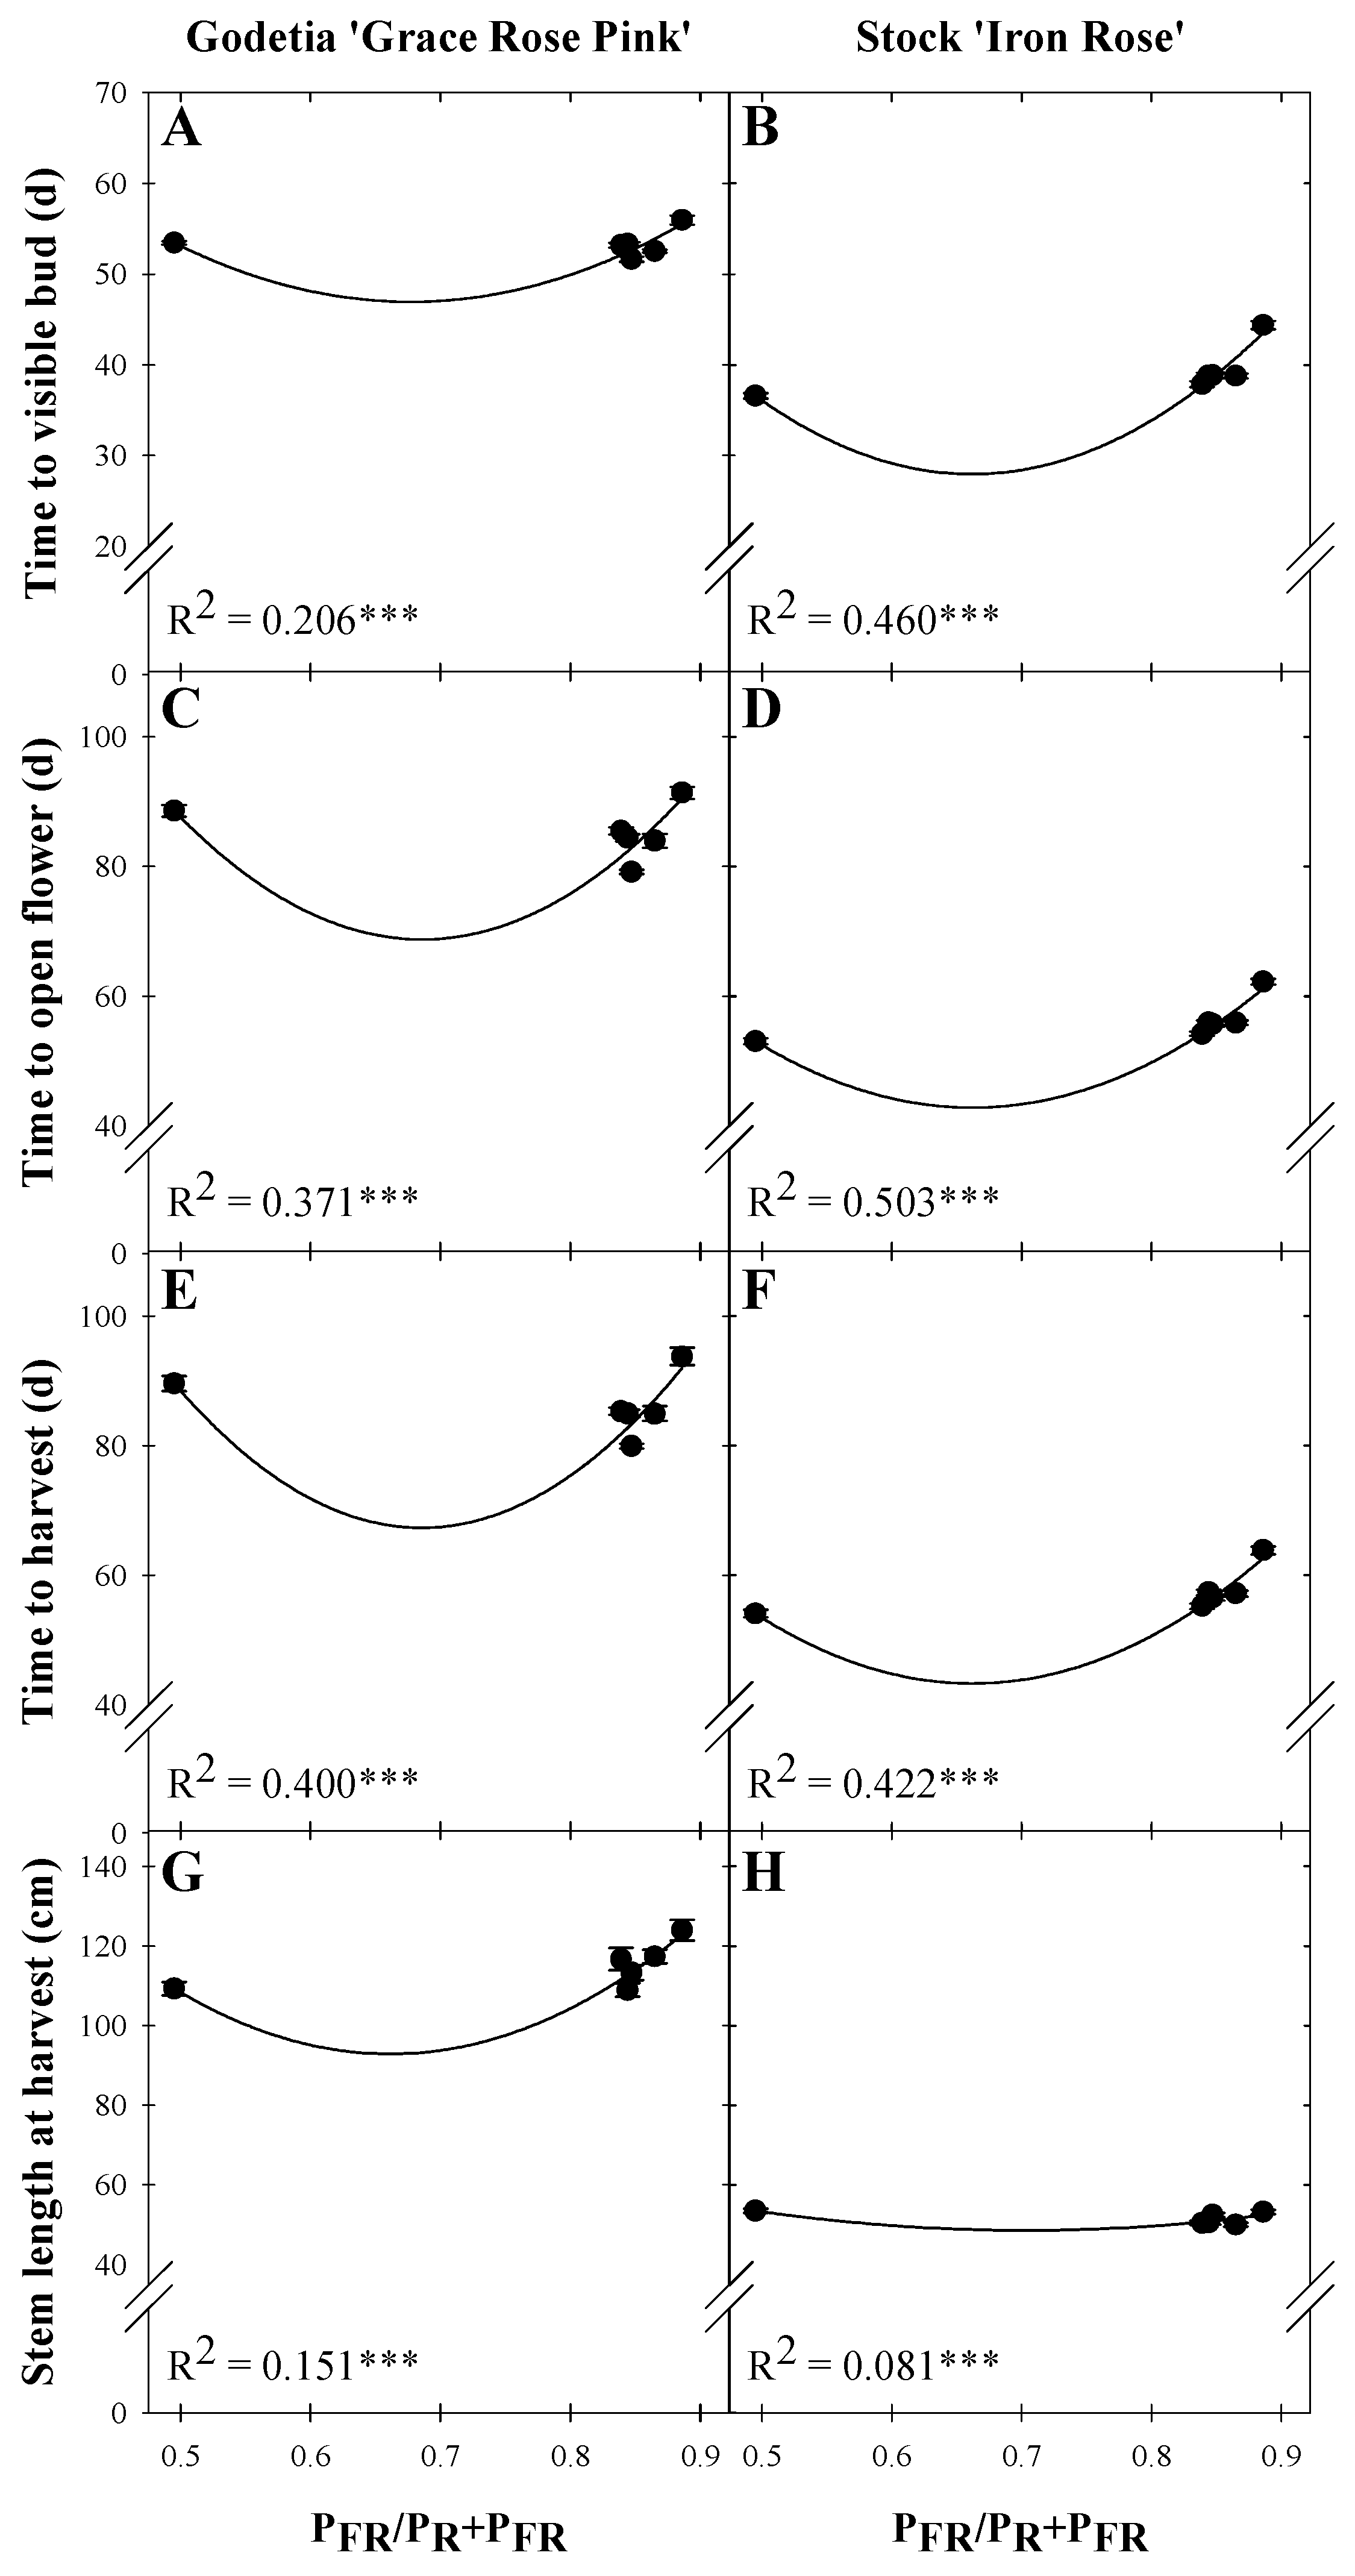
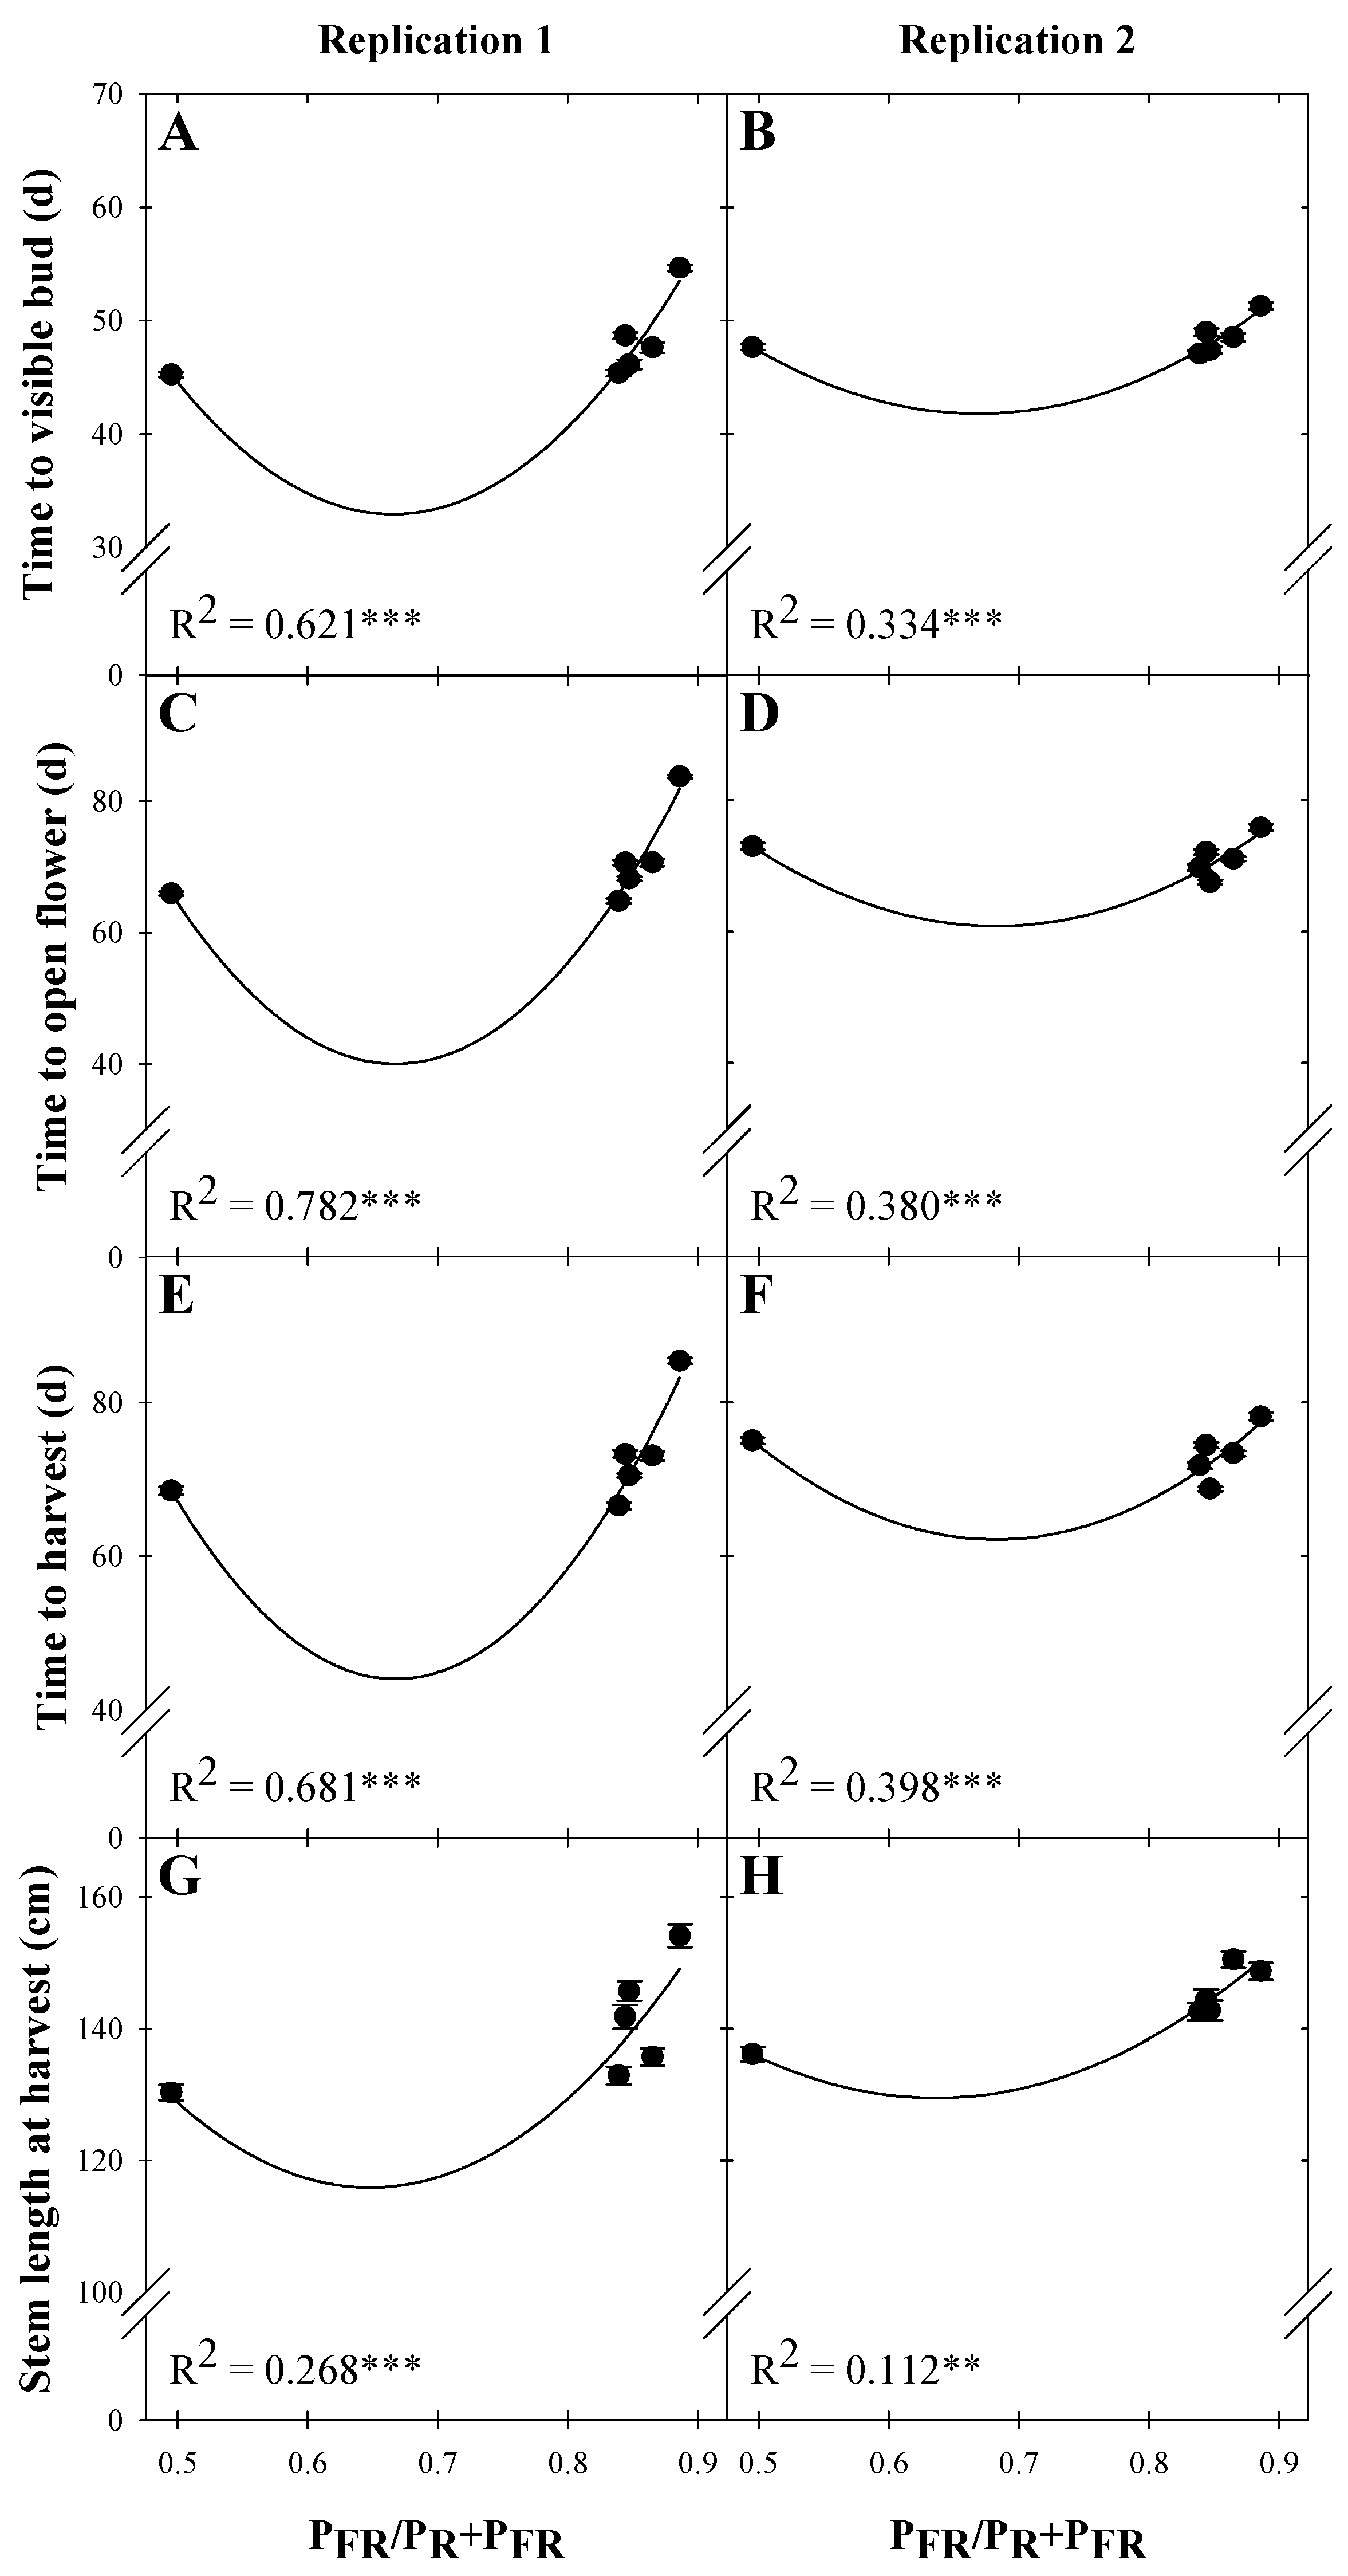
3.1. Time to Visible Flower Bud

Time to VB (TVB) of godetia was influenced, albeit slightly, by the SL spectrum. TVB was the fastest for plants grown under HPS fixtures (52 d) and the slowest for plants grown under R120 SL (56 d). TVB was similar under all other treatments (≈53 d; Figure 2A). Snapdragon grown under B20R85FR15, B120, and HPS120 SL reached VB the fastest (45–47 d), whereas TVB was delayed by up to 10 and 4 d under R120 SL during reps. 1 and 2, respectively (Figure 3A,B). TVB was delayed by 2–4 d and 1–3 d under B20G50R45FR5 and B30G25R65 SL, respectively, compared to the fastest treatments. TVB of stock was the fastest for plants grown under B120 SL (36 d). TVB was delayed by ≈2, 3, 3, and 3 d when grown under B20R85FR15, B20G50R45FR5, B30G25R65, and HPS120 SL, respectively, compared to B120 SL. TVB was delayed by 9 d for plants grown under R120 SL compared to B120 SL (Figure 2B).

3.2. Time to Open Flower

Godetia time to OF (TOF) was the fastest for plants grown under HPS SL (79 d) and the slowest for plants grown under B120 and R120 SL (88 and 91 d, respectively). TOF was similar for all other SL treatments (84–86 d; Figure 2C). Snapdragon reached OF the fastest when grown under B20R85FR15 and B120 SL during rep. 1 (65 and 66 d, respectively; Figure 3C,D). However, HPS120 and B20R85FR15 SL hastened flowering the most during rep. 2 (68 and 70 d, respectively). TOF was consistently delayed under R120 SL compared to the other treatments by up to 19 and 8 d during reps. 1 and 2, respectively. Flowering was slightly delayed under B20G50R45FR5 and B30G25R65 SL compared to the fastest treatments during both reps, although by not as much as R120 SL. TOF was hastened for stock when grown under B120 and B20R85FR15 SL (53 and 54 d, respectively). Flowering was delayed by 2–3 d for plants grown under B30G25R65, HPS120, and B20G50R45FR5 SL. Similar to TVB, TOF was delayed by 9 d when grown under R120 SL compared to B120 SL (Figure 2D).

3.3. Time to Harvest

Time to harvest (TTH) of godetia was the fastest under HPS120 SL and the slowest under R120 SL (80 and 94 d, respectively). TTH was 85 d for plants grown under B20G50R45FR5, B20R85FR15, and B30G25R65 SL, and 90 d for plants grown under B120 SL (Figure 2E). TTH of snapdragon was hastened when grown under B20R85FR15 and B120 SL during rep. 1 (67 and 69 d, respectively; Figure 3E), while TTH was fastest under HPS120 and B20R85FR15 SL during rep. 2 (69 and 72 d, respectively; Figure 3F). TTH was slightly delayed when grown under B20G50R45FR5 and B30G25R65 SL compared to the quickest treatments (4–5 d), while R120 SL delayed harvest by up to 18 and 9 d during reps. 1 and 2, respectively. TTH of stock was the fastest when grown under B120 and B20R85FR15 SL (54 and 55 d, respectively). Flowering was delayed by ≈2 d for plants grown under B30G25R65, HPS120, and B20G50R45FR5 SL. TTH was delayed by 10 d when grown under R120 SL compared to B120 SL (Figure 2F).

3.4. Cut Flower Morphology at Harvest

Godetia cut flower stems were the longest when grown under R120 SL and the shortest when grown under B120, B20G50R45FR5, and HPS120 SL (124 and 109–113 cm, respectively; Figure 2G). Godetia stem caliper was not influenced by SL treatment (p = 0.79). Snapdragon stems were the shortest when grown under B120 SL, regardless of rep. (Figure 3G,H). Plants were ≈13 or 24 cm longer when grown under R120 SL during reps. 1 and 2, respectively. During rep. 1, stems grown under B20R85FR15 SL were comparable in length to those grown under B120 SL, although during rep. 2 they were approximately 10 cm longer. Similarly, under B30G25R65 SL, stems were of similar length to those under B120 SL during rep. 1, while these stems were ≈17 cm longer during rep. 2. Stems were of similar thickness regardless of SL treatment (11.6 to 12.9 mm). Moreover, snapdragon grown under B20R85FR15, B120, and HPS120 SL had the fewest branches at harvest (52–55 branches), while plants grown under R120 SL produced stems with 8–11 more branches. The broad-spectrum LED fixtures produced stems with roughly five fewer branches than the R120 SL and up to six more branches than the other treatments. Snapdragon grown under R120, B120, and HPS120 SL had the fewest inflorescences at harvest, while B20R85FR15 SL produced stems with ≈5 more inflorescences. B30G25R65 and B20G50R45FR5 SL yielded stems with 1–2 fewer inflorescences than B20R85FR15 SL.
Stock stem length at harvest was commercially, but not statistically, similar between all treatments. B120 and R120 SL produced the longest stems (53 to 54 cm), while B30G25R65 and B20R85FR15 SL produced shorter cut flowers with an average stem length of ≈50 cm (Figure 2H). Stock stem caliper was similar for all treatments except B120, which produced stems up to 1.8 mm thinner than the other treatments.

3.5. Flower Petal Coloration at Harvest

Godetia and stock flower petal coloration was not influenced by any SL treatment (Table 4). Snapdragon petal coloration was not commercially different between treatments.

4. Discussion

With a variety of commercially available SL fixtures on the market, it is important to understand the influence that the supplemental radiation quality can have on the growth and development of cut flowers. We found that development time, in addition to cut flower morphology, varied between the spectra that were studied. Generally, TVB, TOF, and TTH were the slowest for plants grown under R120 SL, regardless of variety. However, the varieties studied exhibited different developmental responses to the remaining SL spectra. Godetia consistently developed the fastest under HPS120 SL. Stock developed the fastest when grown under B120 and B20R85FR15 SL, while snapdragon consistently developed the fastest when grown under B20R85FR15, B120, and HPS120 SL.
While R radiation alone is sufficient to inhibit flowering in most short-day plants, many LDPs require R and FR radiation to induce flowering, particularly when the DLI is low (e.g., <8 mol∙m−2∙d−1). Craig and Runkle [21] reported that flowering of snapdragon ‘Liberty Classic Cherry’ was delayed by up to 14 d when grown under a 4 h NI provided by ≈1.5 µmol∙m−2∙s−1 of R radiation (PPE = 0.89) compared to the same NI provided by both R and FR radiation (PPE = 0.72). This phenomenon may have contributed to the developmental delay seen under R120 SL across all genera (Figure 4 and Figure 5), which had an equivalent PPE of 0.89. While FR radiation from solar radiation was available for plants under each treatment, SL emitting a moderate flux of FR radiation reduced the estimated PPE and appeared to hasten plant development. The same is true of the B120 SL treatment, which reduced the estimated PPE by 0.39 compared to the R120 treatment.
The effect of B120 SL on development time varied between the LDPs studied. While stock and snapdragon experienced hastened development when grown under B120 SL, development of godetia slowed when grown under B120 SL compared to most of the other treatments, indicating that this response may be genus specific. This is supported by Hori et al. [44], who reported that baby’s breath ‘Bristol Fairy’ (Gypsophila paniculata) did not flower when grown under a 12 h DE provided by 20–30 µmol∙m−2∙s−1 of B radiation for 18 weeks. However, flowering occurred after ≈75 or 98 d when plants were grown under 9 µmol∙m−2∙s−1 of incandescent lighting or 20–30 µmol∙m−2∙s−1 of FR radiation for the same duration, respectively [44]. TVB, TOF, and TTH of stock and snapdragon was delayed as the estimated PPE increased from 0.50 (B120) to 0.89 (R120; Figure 4 and Figure 5), indicating that the developmental delay between SL treatments could be at least partly due to increased phytochrome activity. This is in agreement with Craig and Runkle [23], who reported that TOF of the LDPs petunia ‘Easy Wave White’ (Petunia ×hybrida) and snapdragon ‘Liberty Classic Cherry’ was delayed by up to ≈6 d and 12 d, respectively, as the estimated PPE of NI lighting increased from 0.46 to 0.89.
Both B20G50R45FR5 and B30G25R65 SL slightly delayed development compared to the fastest treatments, but not as significantly as R120 SL. This delay could be attributed to the minimal emission of FR radiation in the former treatment and the lack of FR radiation in the latter treatment, which resulted in higher estimated PPEs (0.85 to 0.87), although not as high as R120 SL (0.89). Moreover, this delay may have lasted longer if these spectra did not contain B and G radiation, as both wavebands can serve as long-day signals when applied at moderate intensities.
SL quality also influenced cut flower morphology. Stem lengths at harvest were generally the shortest under B120 SL regardless of genus and increased with the estimated PPE (Figure 4 and Figure 5). Many floriculture crops exhibit a compact growth habit when grown under B radiation. For instance, Zou [45] found that geranium ‘Calliope Dark Red’ plants grown with 100% B radiation for 24 h·d−1 was up to 6.7 cm wider in comparison to those grown with 100% R radiation for 24 h·d−1. Moreover, baby’s breath ‘Bristol Fairy’ grown under a 24 h photoperiod created with 16 h of DE lighting providing 20–30 µmol∙m−2∙s−1 of B radiation was ≈43 cm shorter than those grown under the same intensity and duration provided by 100% FR radiation [44]. This compaction could be at least partly regulated by phytochrome activity. Kong et al. [46] found that continuous exposure of 100 µmol∙m−2∙s−1 of B radiation for 14–20 d promoted stem elongation of several bedding plants compared to the same intensity and duration of R radiation. However, when ≈90 µmol∙m−2∙s−1 of B radiation was applied with an additional flux of ≈10 µmol∙m−2∙s−1 of R radiation, plants were more compact than any other treatment. The authors concluded that this response could be due to reduced phytochrome activity under sole-source B radiation (PPE = 0.49), promoting stem elongation, compared to a combination of B and R radiation (PPE = 0.74). Considering that plants in the present study were grown in greenhouses with solar and supplemental radiation, the actual PPE under B120 SL would likely be >0.50 because of the presence of other wavebands, potentially contributing to our similar findings. However, stock cut flowers were the longest when grown under B120 and R120 SL and the shortest when grown under B30G25R65 and B20R85FR15 SL, though differences were minimal.
This further supports the argument that B-mediated stem elongation is a genus-specific response. Another instance of B-mediated stem elongation was published by Zou [45], who found that marigold ‘P-4’ (Tagetes erecta) grown under sole-source lighting providing 180 µmol∙m−2∙s−1 of B radiation for 12 h·d−1 was up to 54% taller than those grown under 180 µmol∙m−2∙s−1 of R radiation for the same duration. It was also found that petunia and dianthus seedlings grown under SL emitting 19% B radiation for 16 h·d−1 were 59% and 3% taller, respectively, than those grown under SL emitting 6% B radiation [47]. However, the former SL treatment included 5% G radiation, which may have antagonized B-mediated stem compaction compared to the latter treatment, which did not contain G radiation.
Additionally, snapdragon grown under B20R85FR15 SL (estimated PPE = 0.84) had ≈5 more inflorescences at harvest compared to those grown under R120 SL (estimated PPE = 0.89). This contrasts with Craig and Runkle [21], who found that snapdragon ‘Liberty Classic Cherry’ had up to eight more VBs when grown under 100% R NI lighting (estimated PPE = 0.89) compared to other NI treatments creating an estimated PPE of 0.16 to 0.85.
The present study demonstrates the influence that SL quality can have on crop growth and development. However, these effects cannot be relied on year-round as a means of crop steering and growth regulation, as the effects of SL quality on crop growth and developmental responses are the strongest when the solar DLI is low [48,49]. For instance, when the quotient of B radiation provided by SL increased from 0% to 30% when SL provided 45–70% of the total DLI (ranging from 2.1–8.4 mol·m−2·d−1), stem elongation of celosia ‘Fresh Look Gold’ (Celosia argentea), snapdragon ‘Rocket Pink’, and vinca ‘Titan Punch’ (Catharanthus roseus) was suppressed by ≈20%, ≈10%, and ≈30%, respectively [48,50]. In a separate study, where the DLI was consistently > 6.7 mol·m−2·d−1 and SL only provided 20–40% of the total DLI, there was no commercial effect on seedling stem elongation as the quotient of B radiation provided by SL increased from 10% to 45% [10,48]. Moreover, Hernández and Kubota [51] reported no statistical morphological differences between greenhouse-grown tomato seedlings grown with SL of varying spectra and a DLI of either 8.9 or 19.4 mol·m−2·d−1. These findings indicate that while SL spectrum may be less influential as the DLI increases, particularly > 7 mol·m−2·d−1, it can have noticeable effects on crop growth and development when the solar DLI is below this threshold.
While parameters including TOF, TTH, and finished stem quality must be considered when selecting a spectrum for a SL strategy, human work suitability must also be considered. In the present study, B20R85FR15, B120, and HPS120 SL consistently hastened plant development and yielded cut flowers with moderate stem lengths. Conversely, R120 SL delayed TTH and produced longer cut flowers. While a given spectrum may elicit desirable crop responses, it may create a challenging work environment for humans by making it more difficult to diagnose cultural issues, including nutrient deficiencies and pest prevalence on plant tissue [52]. This may be particularly true when the solar DLI is low, and SL contributes more to the total DLI than solar radiation.
The color fidelity index (CFI; Rf) is an independent, unbiased indication of how well natural colors can be perceived by the human eye under a particular light source [34]. The CFI exists on a scale of 0 to 100, where values closer to 100 indicate that the colors perceived under a given light source are truer to nature [34]. The CFI values of each SL treatment were calculated with each source’s spectral power distribution according to supplemental materials provided by IES [52] and can be found in Table 3. While B20R85FR15 SL generally hastened TTH and produced stems with moderate lengths, it created an environment with a lower CFI than HPS120 SL or either broad-spectrum fixture, meaning that human visibility capacity would be impaired under that spectrum. However, the effects of B20R85FR15 SL’s low CFI were the strongest during the early morning and evening, while solar radiation was limiting. During the day, the higher fraction of solar radiation subjectively allowed for sufficient human visibility. Additionally, both B120 (Rf < 0) and R120 SL (Rf = 33) created environments that were inadequate for human visibility and sufficient crop supervision (Table 3). Similar to B20R85FR15 SL, the impact on visibility by these treatments was the strongest when solar radiation was limiting; however, visibility was still noticeably impaired during the day compared to any other treatments.
SL fixtures also vary in their capability to convert electrical power to photons. Photon efficacy is defined as the number of moles of photons generated per energy input, typically expressed as µmol∙J−1 [8,53]. Currently, LED fixtures can have a photon efficacy of up to 3 µmol∙J−1, trumping the photon efficacy of HPS fixtures by approximately 60%. This is partly because a substantial amount of energy consumed by HPS fixtures is re-emitted as heat, whereas LED fixtures typically function at a lower temperature. This can have a significant impact on a greenhouse operation’s overall energy expenditure. While more energy must be used to heat a greenhouse when using LED fixtures compared to HPS fixtures, the net energy expenditure, and associated energy costs, can be 10–25% lower than greenhouses utilizing HPS fixtures [53].
Rate of development, finished stem quality, crop visibility, and photon efficacy must be considered when selecting a SL spectrum for one’s growing operation. Based on our findings, we recommend utilizing an LED fixture that provides a light ratio similar to B20R85FR15 SL or broad-spectrum light; both elicited desirable crop responses with minimal tradeoffs, while allowing for sufficient human visibility. Although crops grown under HPS120 SL performed similarly, we recommend utilizing LEDs as they most likely offer higher photon efficacy and the potential for long-term energy and monetary savings.

Author Contributions

C.E.S. and R.G.L. conceptualized and designed the study, C.E.S. performed the experiments, conducted data analysis, and prepared the manuscript. R.G.L. obtained funding and revised the manuscript. All authors have read and agreed to the published version of the manuscript.

Funding

This research was funded by BloomStudios, Sakata Seed America, the Association of Specialty Cut Flower Growers, and the USDA National Institute of Food and Agriculture, Hatch project MICL02472.

Institutional Review Board Statement

Not applicable.

Informed Consent Statement

Not applicable.

Data Availability Statement

The data supporting the conclusions of this article will be made available by the authors, without undue reservation, to any qualified researcher.

Acknowledgments

We gratefully acknowledge BloomStudios and Sakata Seed America for providing seeds, and Fluence Bioengineering, Heliospectra, LumiGrow, and P.L. Light Systems for LED fixtures. We thank Nate DuRussel, John Gove, and Ian Holcomb for greenhouse assistance and data collection, Hydrofarm for netting, Raker Roberta’s Young Plants for sowing seeds, and Syndicate Sales for floral supplies.

Conflicts of Interest

The authors declare no conflict of interest. The funders had no role in the design of the study, in the collection, analyses, or interpretation of data, in the writing of the manuscript, or in the decision to publish the results.

References

  1. Prinzing, D. New Findings on Consumer Attitudes toward Domestic & Locally-Grown Cut Flowers. Available online: https://slowflowersjournal.com/new-findings-on-consumer-attitudes-toward-domestic-locally-grown-flowers/ (accessed on 27 April 2021).
  2. Produce Marketing Association and Food Marketing Institute (PMAFMI). Trends in Mass-Market Floral; Produce Marketing Association: Newark, DE, USA, 2016. [Google Scholar]
  3. Owen, W.G.; Hilligoss, A.; Lopez, R.G. Late-season high tunnel planting of specialty cut flowers in the midwestern United States influences yield and stem quality. HortTechnology 2016, 26, 338–343. [Google Scholar] [CrossRef] [Green Version]
  4. Ortiz, M.A.; Hyrczyk, K.; Lopez, R.G. Comparison of high tunnel and field production of specialty cut flowers in the Midwest. HortScience 2012, 47, 1265–1269. [Google Scholar] [CrossRef] [Green Version]
  5. Faust, J.E.; Logan, J. Daily light integral: A research review and high-resolution maps of the United States. HortScience 2018, 53, 1250–1257. [Google Scholar] [CrossRef] [Green Version]
  6. Lopez, R.G.; Runkle, E.S. Photosynthetic daily light integral during propagation influences rooting and growth of cuttings and subsequent development of new guinea impatiens and petunia. HortScience 2008, 43, 2052–2059. [Google Scholar] [CrossRef] [Green Version]
  7. Paradiso, R.; Proietti, S. Light-quality manipulation to control plant growth and photomorphogenesis in greenhouse horticulture: The state of the art and the opportunities of modern LED systems. J. Plant Growth Reg. 2021, 41, 742–780. [Google Scholar] [CrossRef]
  8. Kusuma, P.; Pattison, P.M.; Bugbee, B. From physics to fixtures to food: Current and potential LED efficacy. Hortic. Res. 2020, 7, 56. [Google Scholar] [CrossRef] [Green Version]
  9. Owen, W.G.; Meng, Q.; Lopez, R.G. Promotion of flowering from far-red radiation depends on the photosynthetic daily light integral. HortScience 2018, 53, 465–471. [Google Scholar] [CrossRef] [Green Version]
  10. Poel, B.R.; Runkle, E.S. Spectral effects of supplemental greenhouse radiation on growth and flowering of annual bedding plants and vegetable transplants. HortScience 2017, 52, 1221–1228. [Google Scholar] [CrossRef]
  11. Runkle, E.S. Including far red in an LED lighting spectrum. Greenhouse Prod. News 2019, 29, 58. [Google Scholar]
  12. Hernández, R.; Kubota, C. Light quality and photomorphogenesis. In Light Management in Controlled Environments; Lopez, R.G., Runkle, E.S., Eds.; Meister Media Worldwide: Willoughby, OH, USA, 2017; p. 29. [Google Scholar]
  13. Goins, G.D.; Yorio, N.C.; Sanwo, M.M.; Brown, C.S. Photomorphogenesis, photosynthesis, and seed yield of wheat plants grown under red light-emitting diodes (LEDs) with and without supplemental blue lighting. J. Exp. Bot. 1997, 48, 1407–1413. [Google Scholar] [CrossRef] [Green Version]
  14. Zhen, S.; van Iersel, M.W.; Bugbee, B. Why far-red photons should be included in the definition of photosynthetic photons and the measurement of horticultural fixture efficacy. Front. Plant Sci. 2021, 22, 1158. [Google Scholar] [CrossRef] [PubMed]
  15. Zhen, S.; Bugbee, B. Far-red photons have equivalent efficiency to traditional photosynthetic photons: Implications for redefining photosynthetically active radiation. Plant Cell Environ. 2020, 43, 1259–1272. [Google Scholar] [CrossRef] [PubMed]
  16. Zhen, S.; Bugbee, B. Substituting far-red for traditionally defined photosynthetic photons results in equal canopy quantum yield for CO2 fixation and increased photon capture during long-term studies: Implications for re-defining PAR. Front. Plant Sci. 2020, 11, 581156. [Google Scholar] [CrossRef] [PubMed]
  17. Park, Y.; Runkle, E.S. Far-red radiation promotes growth of seedlings by increasing leaf expansion and whole-plant net assimilation. Environ. Exp. Bot. 2017, 136, 41–49. [Google Scholar] [CrossRef] [Green Version]
  18. Zhen, S.; van Iersel, M.W. Far-red light is needed for efficient photochemistry and photosynthesis. J. Plant Phys. 2016, 209, 115–122. [Google Scholar] [CrossRef] [Green Version]
  19. Elkins, C.; van Iersel, M.W. Supplemental far-red light-emitting diode light increases growth of foxglove seedlings under sole-source lighting. HortTechnology 2020, 30, 564–569. [Google Scholar] [CrossRef]
  20. Craig, D.S.; Runkle, E.S. A moderate to high red to far-red light ratio from light-emitting diodes controls flowering of short-day plants. J. Am. Soc. Hortic. Sci. 2013, 138, 167–172. [Google Scholar] [CrossRef] [Green Version]
  21. Craig, D.S.; Runkle, E.S. Using LEDs to quantify the effect of the red to far-red ratio of night-interruption lighting on flowering of photoperiodic crops. Acta Hortic. 2012, 956, 179–186. [Google Scholar] [CrossRef]
  22. Borthwick, H.A.; Hendricks, S.B. Photoperiodism in plants. Science 1960, 132, 1223–1228. [Google Scholar] [CrossRef]
  23. Craig, D.S.; Runkle, E.S. An intermediate phytochrome photoequilibria from night-interruption lighting optimally promotes flowering of several long-day plants. Environ. Exp. Bot. 2016, 121, 132–138. [Google Scholar] [CrossRef]
  24. Sager, J.C.; Smith, W.O.; Edwards, J.L.; Cyr, K.L. Photosynthetic efficiency and phytochrome photoequilibria determination using spectral data. Am. Soc. Agric. Eng. 1988, 31, 1882–1889. [Google Scholar] [CrossRef]
  25. Walters, K.J.; Hurt, A.A.; Lopez, R.G. Flowering, stem extension growth, and cutting yield of foliage annuals in response to photoperiod. HortScience 2019, 54, 661–666. [Google Scholar] [CrossRef] [Green Version]
  26. Runkle, E.S.; Heins, R.D. Specific functions of red, far red, and blue light in flowering and stem extension of long-day plants. J. Amer. Soc. Hortic. Sci. 2001, 126, 275–282. [Google Scholar]
  27. Kohler, A.E.; Lopez, R.G. Duration of light-emitting diode (LED) supplemental lighting providing far-red radiation during seedling production influences subsequent time to flower of long-day annuals. Sci. Hortic. 2021, 30, 109956. [Google Scholar] [CrossRef]
  28. Park, Y.; Runkle, E.S. Far-red radiation and photosynthetic photon flux density independently regulate seedling growth but interactively regulate flowering. Environ. Exp. Bot. 2018, 155, 206–216. [Google Scholar] [CrossRef]
  29. Fankhauser, C.; Christie, J.M. Plant phototropic growth. Curr. Biol. 2015, 25, R384–R389. [Google Scholar] [CrossRef] [PubMed] [Green Version]
  30. Wollaeger, H.M.; Runkle, E.S. Growth and acclimation of impatiens, salvia, petunia, and tomato seedlings to blue and red light. HortScience 2015, 50, 522–529. [Google Scholar] [CrossRef] [Green Version]
  31. Ashraful Islam, M.; Kuwar, G.; Clarke, J.L.; Blystad, D.-R.; Gislerød, H.R.; Olsen, J.E.; Torre, S. Artificial light from light-emitting diodes (LEDs) with a high portion of blue light results in shorter poinsettias compared to high pressure sodium (HPS) lamps. Sci. Hortic. 2012, 147, 136–143. [Google Scholar] [CrossRef]
  32. Meng, Q.; Runkle, E.S. Moderate-intensity blue radiation can regulate flowering, but not extension growth, of several photoperiodic ornamental crops. Environ. Exp. Bot. 2017, 134, 12–20. [Google Scholar] [CrossRef] [Green Version]
  33. SharathKumar, M.; Heuvelink, E.; Marcelis, L.F.M.; van Ieperen, W. Floral induction in the short-day plant chrysanthemum under blue and red extended long-days. Front. Plant Sci. 2021, 11, 610041. [Google Scholar] [CrossRef]
  34. Kusuma, P.; Fatzinger, B.; Bugbee, B.; Soer, W.; Wheeler, R. LEDs for Extraterrestrial Agriculture: Tradeoffs between Color Perception and Photon Efficacy (NASA/TM-20210016720); National Aeronautics and Space Administration: Merritt Island, FL, USA, 2021.
  35. Liu, J.; van Iersel, M.W. Photosynthetic physiology of blue, green, and red light: Light intensity effects and underlying mechanisms. Front. Plant Sci. 2021, 12, 619987. [Google Scholar] [CrossRef] [PubMed]
  36. Meng, Q.; Runkle, E.S. Regulation of flowering by green light depends on its photon flux density and involves cryptochromes. Phys. Plantarum 2019, 166, 762–771. [Google Scholar] [CrossRef]
  37. Zhang, T.; Maruhnich, S.A.; Folta, K.M. Green light induces shade avoidance symptoms. Plant Phys. 2011, 157, 1528–1536. [Google Scholar] [CrossRef] [PubMed] [Green Version]
  38. Wang, Y.; Folta, K.M. Contributions of green light to plant growth and development. Am. J. Bot. 2013, 100, 70–78. [Google Scholar] [CrossRef]
  39. Garcia, C.; Lopez, R.G. Supplemental radiation quality influences cucumber, tomato, and pepper transplant growth and development. HortScience 2020, 55, 804–811. [Google Scholar] [CrossRef]
  40. Van der Kooi, C.J.; Elzen, J.T.M.; Staal, M.; Stavenga, D.G. How to color a flower: On the optical principles of flower coloration. Proc. Biol. Sci. 2016, 283, 20160429. [Google Scholar]
  41. Zhao, D.; Tao, J. Recent advances on the development and regulation of flower color in ornamental plants. Front. Plant Sci. 2015, 6, 261. [Google Scholar] [CrossRef] [Green Version]
  42. Yue, C.; Behe, B.K. Consumer color preferences for single-stem cut flowers on calendar holidays and noncalendar occasions. HortScience 2010, 45, 78–82. [Google Scholar] [CrossRef] [Green Version]
  43. Sakata Ornamentals. Stock Iron Culture Sheet. Available online: https://sakataornamentals.com/wp-content/uploads/sites/13/2022/02/Stock-Iron-1121-SAKATA.pdf (accessed on 11 November 2022).
  44. Hori, Y.; Nishidate, K.; Nishiyama, M.; Kanahama, K.; Kanayama, Y. Flowering and expression of flowering-related genes under long-day conditions with light-emitting diodes. Planta 2011, 234, 321–330. [Google Scholar] [CrossRef]
  45. Zou, Y. Light-Emitting Diode Lighting Quality Effects on Morphology, Growth, Flowering, and Carotenoid Content of Potted Plant, Cut Flower, and Medicinal Flower Production. Master’s Thesis, University of California, Davis, CA, USA, 2018. [Google Scholar]
  46. Kong, Y.; Stasiak, M.; Dixon, M.A.; Zheng, Y. Blue light associated with low phytochrome activity can promote elongation growth as shade-avoidance response: A comparison with red light in four bedding plant species. Environ. Exp. Bot. 2018, 155, 345–359. [Google Scholar] [CrossRef]
  47. Collado, C.; Hernández, R. Effects of Light Intensity, Spectral Composition, and Paclobutrazol on the Morphology, Physiology, and Growth of Petunia, Geranium, Pansy, and Dianthus Ornamental Transplants. J. Plant Growth Regul. 2022, 41, 461–478. [Google Scholar] [CrossRef]
  48. Runkle, E.S.; Park, Y.; Meng, Q. High photosynthetic photon flux density can attenuate effects of light quality. Acta Hortic. 2022, 1337, 333–340. [Google Scholar] [CrossRef]
  49. Runkle, E.S. Does light quantity trump light quality? Greenhouse Prod. News 2017, 27, 38. [Google Scholar]
  50. Randall, W.C.; Lopez, R.G. Comparison of supplemental lighting from high-pressure sodium lamps and light-emitting diodes during bedding plant seedling production. HortScience 2014, 49, 589–595. [Google Scholar] [CrossRef]
  51. Hernández, R.; Kubota, C. Tomato seedling growth and morphological responses to supplemental LED lighting red:blue ratios under varied daily solar light integrals. Acta Hortic. 2012, 956, 187–194. [Google Scholar] [CrossRef]
  52. Illuminating Engineering Society (IES). IES Method for Evaluating Light Source Color Rendition (IES TM-30-20); IES: New York, NY, USA, 2020. [Google Scholar]
  53. Katzin, D.; Marcelis, L.F.M.; van Mourik, S. Energy savings in greenhouses by transition from high-pressure sodium to LED lighting. Appl. Energy 2021, 281, 116019. [Google Scholar] [CrossRef]
Figure 1. Emission spectra of supplemental lighting (SL) fixtures utilized throughout the study. SL treatments consisted of either 460 W high-pressure sodium fixtures (HPS120; LR48877; P.L. Light Systems, Beamsville, ON, Canada), 631 W light-emitting diode (LED) fixtures (B20G50R45FR5; VYPR 2p; Fluence, Austin, TX, USA), 325 W LED fixtures (B20R85FR15; LumiGrow Pro 325; LumiGrow, Emeryville, CA, USA), 600 W LED fixtures (B30G25R65; LX601G, Heliospectra, Göteborg, Sweden), a combination of 72 W LED fixtures (B120; HortiLED MULTI, P.L. Light Systems) and 625 W LED fixtures (R120; LumiGrow Pro 650E, LumiGrow), or 625 W LED fixtures (LumiGrow Pro 650E; LumiGrow).
Horticulturae 09 00073 g001
Figure 2. (A,B) time to visible flower bud, (C,D) time to open flower, (E,F) time to harvest, and (G,H) stem length at harvest of godetia ‘Grace Rose Pink’ and stock ‘Iron Rose’ in response to SL spectrum, pooled over two replications. SL treatments consisted of either 460 W HPS fixtures (HPS120; LR48877; P.L. Light Systems, Beamsville, ON, Canada), 631 W LED fixtures (B20G50R45FR5; VYPR 2p; Fluence, Austin, TX, USA), 325 W LED fixtures (B20R85FR15; LumiGrow Pro 325; LumiGrow, Emeryville, CA, USA), 600 W LED fixtures (B30G25R65; LX601G, Heliospectra, Göteborg, Sweden), a combination of 72 W LED fixtures (B120; HortiLED MULTI, P.L. Light Systems) and 625 W LED fixtures (R120; LumiGrow Pro 650E, LumiGrow), or 625 W LED fixtures (LumiGrow Pro 650E; LumiGrow). Means not followed by the same letter are significantly different by Tukey–Kramer honestly significant difference (HSD) test at p ≤ 0.05. Bars represent the mean and error bars indicate standard error.
Horticulturae 09 00073 g002
Figure 3. (A,B) Time to visible flower bud, (C,D) time to open flower, (E,F) time to harvest, and (G,H) stem length at harvest of snapdragon ‘Potomac Royal’ in response to SL spectrum over two replications. SL treatments consisted of either 460 W HPS fixtures (HPS120; LR48877; P.L. Light Systems, Beamsville, ON, Canada), 631 W LED fixtures (B20G50R45FR5; VYPR 2p; Fluence, Austin, TX, USA), 325 W LED fixtures (B20R85FR15; LumiGrow Pro 325; LumiGrow, Emeryville, CA, USA), 600 W LED fixtures (B30G25R65; LX601G, Heliospectra, Göteborg, Sweden), a combination of 72 W LED fixtures (B120; HortiLED MULTI, P.L. Light Systems) and 625 W LED fixtures (R120; LumiGrow Pro 650E, LumiGrow), or 625 W LED fixtures (LumiGrow Pro 650E; LumiGrow). Means not followed by the same letter are significantly different by Tukey–Kramer honestly significant difference (HSD) test at p ≤ 0.05. Bars represent the mean and error bars indicate standard error.
Horticulturae 09 00073 g003
Figure 4. Influence of estimated phytochrome photoequilibrium (PFR/PR+PFR) of supplemental lighting treatments (A,B) on time to visible bud, (C,D) time to open flower, (E,F) time to harvest, and (G,H) stem length at harvest of godetia ‘Grace Rose Pink’ and stock ‘Iron Rose’. Black symbols represent means; error bars represent standard error. R2 values are presented; *** indicate model significance at p < 0.00001. Coefficients are presented in Table 5.
Horticulturae 09 00073 g004
Figure 5. Influence of estimated phytochrome photoequilibrium (PFR/PR+PFR) of supplemental lighting treatments on (A,B) time to visible bud, (C,D) time to open flower, (E,F) time to harvest, and (G,H) stem length at harvest of snapdragon ‘Potomac Royal’ during replications 1 and 2. Black symbols represent means; error bars represent standard error. R2 values are presented; ** and *** indicate model significance at p < 0.001 and p < 0.0001, respectively. Coefficients are presented in Table 5.
Horticulturae 09 00073 g005
Table 1. Actual daily light integrals (DLIs) (mean ± SD (mol·m−2·d−1)), average daily temperatures (ADTs), mean day temperature, mean night temperature, and mean leaf temperature (mean ± SD (°C)) for each supplemental light (SL) treatment during the vegetative (VEG) and reproductive (REP) stages of replication 1. SL treatments consisted of either 460 W HPS fixtures (HPS120; LR48877; P.L. Light Systems, Beamsville, ON, Canada), 631 W LED fixtures (B20G50R45FR5; VYPR 2p; Fluence, Austin, TX, USA), 325 W LED fixtures (B20R85FR15; LumiGrow Pro 325; LumiGrow, Emeryville, CA, USA), 600 W LED fixtures (B30G25R65; LX601G, Heliospectra, Göteborg, Sweden), a combination of 72 W LED fixtures (B120; HortiLED MULTI, P.L. Light Systems) and 625 W LED fixtures (R120; LumiGrow Pro 650E, LumiGrow), or 625 W LED fixtures (LumiGrow Pro 650E; LumiGrow).
SL Treatment and StageDLI
(Mean ± SD (mol·m−2·d−1))
ADT
(Mean ± SD (°C))
Day Temperature
(Mean ± SD (°C))
Night Temperature
(Mean ± SD (°C))
Leaf Temperature
(Mean ± SD (°C))
HPS120
VEG10.7 ± 2.015.6 ± 0.618.4 ± 1.612.7 ± 0.817.9 ± 3.5
REP15.7 ± 4.516.1 ± 1.918.6 ± 2.713.5 ± 3.218.3 ± 3.4
B20G50R45FR5
VEG10.8 ± 2.015.6 ± 0.518.3 ± 0.812.9 ± 1.017.0 ± 2.7
REP15.6 ± 5.016.2 ± 1.718.9 ± 2.513.4 ± 3.118.4 ± 3.6
B20R85FR15
VEG10.6 ± 2.015.6 ± 0.418.2 ± 0.812.9 ± 0.717.1 ± 2.9
REP15.4 ± 8.916.2 ± 1.818.8 ± 2.516.2 ± 1.819.9 ± 4.4
B30G25R65
VEG10.9 ± 2.115.5 ± 0.418.1 ± 0.812.9 ± 0.617.6 ± 2.9
REP15.1 ± 4.216.2 ± 1.818.9 ± 2.613.5 ± 3.218.3 ± 2.7
B120
VEG10.8 ± 2.116.1 ± 0.518.8 ± 1.313.3 ± 0.817.6 ± 0.9
REP15.0 ± 4.116.5 ± 1.619.3 ± 2.513.7 ± 2.918.8 ± 2.8
R120
VEG11.5 ± 2.515.5 ± 0.818.4 ± 2.612.6 ± 0.916.5 ± 3.8
REP15.9 ± 5.316.0 ± 1.818.3 ± 3.113.8 ± 2.817.9 ± 3.5
Table 2. Actual daily light integrals (DLIs) (mean ± SD (mol·m−2·d−1)), average daily temperatures (ADTs), mean day temperature, mean night temperature, and mean leaf temperature (mean ± SD (°C)) for each supplemental light (SL) treatment during the vegetative (VEG) and reproductive (REP) stages of replication 2. SL treatments consisted of either 460 W high-pressure sodium fixtures (HPS120; LR48877; P.L. Light Systems, Beamsville, ON, Canada), 631 W light-emitting diode (LED) fixtures (B20G50R45FR5; VYPR 2p; Fluence, Austin, TX, USA), 325 W LED fixtures (B20R85FR15; LumiGrow Pro 325; LumiGrow, Emeryville, CA, USA), 600 W LED fixtures (B30G25R65; LX601G, Heliospectra, Göteborg, Sweden), a combination of 72 W LED fixtures (B120; HortiLED MULTI, P.L. Light Systems) and 625 W LED fixtures (R120; LumiGrow Pro 650E, LumiGrow), or 625 W LED fixtures (LumiGrow Pro 650E; LumiGrow).
SL Treatment and StageDLI
(Mean ± SD (mol·m−2·d−1))
ADT
(Mean ± SD (°C))
Day Temperature
(Mean ± SD (°C))
Night Temperature
(Mean ± SD (°C))
Leaf Temperature
(Mean ± SD (°C))
HPS120
VEG11.7 ± 2.216.0 ± 0.518.7 ± 2.113.3 ± 0.818.0 ± 4.0
REP16.1 ± 4.616.0 ± 1.018.9 ± 2.112.9 ± 1.518.7 ± 4.0
B20G50R45FR5
VEG10.9 ± 2.816.3 ± 0.719.0 ± 2.413.6 ± 0.818.0 ± 3.1
REP16.2 ± 5.215.9 ± 0.818.9 ± 2.212.9 ± 1.118.3 ± 3.2
B20R85FR15
VEG11.6 ± 2.616.0 ± 0.518.7 ± 2.113.3 ± 0.818.3 ± 3.9
REP15.9 ± 3.915.9 ± 1.018.9 ± 2.412.9 ± 1.318.5 ± 3.7
B30G25R65
VEG11.6 ± 2.616.3 ± 0.719.0 ± 2.413.6 ± 0.818.0 ± 3.8
REP16.4 ± 4.316.3 ± 1.419.3 ± 2.713.3 ± 1.718.0 ± 3.1
B120
VEG11.6 ± 2.316.0 ± 1.019.1 ± 2.512.7 ± 1.217.9 ± 3.3
REP15.9 ± 5.115.9 ± 0.918.9 ± 2.313.0 ± 1.618.3 ± 3.0
R120
VEG11.8 ± 2.616.0 ± 1.019.1 ± 2.413.6 ± 0.817.8 ± 3.4
REP15.9 ± 6.416.2 ± 1.419.5 ± 2.313.4 ± 1.218.3 ± 3.4
Table 3. Estimated phytochrome photoequilibria (PPE; PFR/PR+FR) and color fidelity index (CFI; Rf) of each supplemental lighting (SL) treatment. PPEs were calculated according to Sager et al. (1988), and CFI values were calculated according to supplemental materials provided by IES (2018). SL treatments consisted of either 460 W high-pressure sodium fixtures (HPS120; LR48877; P.L. Light Systems, Beamsville, ON, Canada), 631 W light-emitting diode (LED) fixtures (B20G50R45FR5; VYPR 2p; Fluence, Austin, TX, USA), 325 W LED fixtures (B20R85FR15; LumiGrow Pro 325; LumiGrow, Emeryville, CA, USA), 600 W LED fixtures (B30G25R65; LX601G, Heliospectra, Göteborg, Sweden), a combination of 72 W LED fixtures (B120; HortiLED MULTI, P.L. Light Systems) and 625 W LED fixtures (R120; LumiGrow Pro 650E, LumiGrow), or 625 W LED fixtures (LumiGrow Pro 650E; LumiGrow).
SL Treatment
HPS120B20G50R45FR5B20R85FR15B30G25R65B120R120
Estimated PPE0.850.850.840.870.500.89
CFI (Rf)4480055<033
Table 4. Adjusted hue angle (h°), chroma (C), and Hunter CIELAB (L*, a*, b*) values at harvest for godetia, snapdragon, and stock grown under six different supplemental lighting (SL) treatments. SL treatments consisted of either 460 W high-pressure sodium fixtures (HPS120; LR48877; P.L. Light Systems, Beamsville, ON, Canada), 631 W light-emitting diode (LED) fixtures (B20G50R45FR5; VYPR 2p; Fluence, Austin, TX, USA), 325 W LED fixtures (B20R85FR15; LumiGrow Pro 325; LumiGrow, Emeryville, CA, USA), 600 W LED fixtures (B30G25R65; LX601G, Heliospectra, Göteborg, Sweden), a combination of 72 W LED fixtures (B120; HortiLED MULTI, P.L. Light Systems) and 625 W LED fixtures (R120; LumiGrow Pro 650E, LumiGrow), or 625 W LED fixtures (LumiGrow Pro 650E; LumiGrow). Letters indicate mean separations across treatments using Tukey–Kramer honestly significant difference (hsd) test at p ≤ 0.05.
SL Treatment
ParameterHPS120B20G50R45FR5B20R85FR15B30G25R65B120R120
Godetia ‘Grace Rose Pink’
355.2 NS354.9354.5354.3353.6355.2
C48.5 NS49.147.749.447.450.1
L*43.2 NS42.844.842.544.543.8
a*48.3 NS48.947.549.147.149.9
b*−3.9 NS−4.2−4.5−4.4−5.2−3.7
Snapdragon ‘Potomac Royal’
355.1 C356.8 A357.2 A356.3 AB356.9 A355.7 BC
C34.4 A34.2 AB33.0 BC33.7 ABC32.7 C34.3 ABC
L*19.4 B19.7 B19.6 B20.2 B19.8 B21.7 A
a*34.5 A34.2 AB33.0 BC33.7 ABC32.7 C34.2 ABC
b*−2.7 D−1.8 BC−0.9 A−1.8 B−1.3 AB−2.6 CD
Stock ‘Iron Rose’
336.8 337.3337.0336.9337.5337.0
C49.6 49.249.549.149.949.8
L*33.9 33.934.133.634.133.3
a*45.6 45.345.645.146.045.8
b*−19.5 −19.0−19.3−19.3−19.1−19.5
Means not followed by the same letter are significantly different by by Tukey–Kramer honestly significant difference (HSD) test at p ≤ 0.05.
Table 5. Regression equations and R2 for time to visible bud, time to open flower, time to harvest, and stem length at harvest of godetia ‘Grace Rose Pink’, stock ‘Iron Rose’, and snapdragon ‘Potomac Royal’ in response to the estimated phytochrome photoequilibrium of each supplemental lighting treatment. ** and *** indicate model significance at p < 0.001 and p < 0.0001, respectively. All models are in the form of: ƒ = y0 + a ∗ PPE + b ∗ PPE2.
Parameter y0 AbR2
Godetia ‘Grace Rose Pink’
Time to visible bud (d)136.93 z−265.74196.250.206 ***
Time to open flower (d)324.77−746.35543.980.371 ***
Time to harvest (d)355.71−841.28613.570.400 ***
Stem length at harvest (cm)352.60−785.44593.810.151 ***
Stock ‘Iron Rose’
Time to visible bud (d)163.75−410.27309.940.460 ***
Time to open flower (d)203.47−485.22366.370.503 ***
Time to harvest (d)212.48−510.96385.820.422 ***
Stem length at harvest (cm)104.79−160.00113.780.081 ***
Snapdragon ‘Potomac Royal’
Time to visible bud (d)
Rep. 1220.56−563.92423.740.621 ***
Rep. 2128.57−259.47193.970.334 ***
Time to open flower (d)
Rep. 1429.16−1166.49874.180.782 ***
Rep. 2221.23−469.85344.120.380 ***
Time to harvest (d)
Rep. 1410.51−1097.96822.360.681 ***
Rep. 2232.81−500.12366.460.398 ***
Stem length at harvest (cm)
Rep. 1362.45−760.81586.910.268 ***
Rep. 2264.58−424.62333.720.112 **
z Coefficients for model equations were used to generate Figure 4 and Figure 5.
Disclaimer/Publisher’s Note: The statements, opinions and data contained in all publications are solely those of the individual author(s) and contributor(s) and not of MDPI and/or the editor(s). MDPI and/or the editor(s) disclaim responsibility for any injury to people or property resulting from any ideas, methods, instructions or products referred to in the content.

