Article

Falanghina Grapevine (Vitis vinifera L.) Yield and Berry Quality under Different Pedoclimatic Conditions in Southern Italy

1
Department of Agricultural Sciences, University of Naples Federico II, Via Università 100, 80055 Portici, NA, Italy
2
National Research Council of Italy (CNR), Institute for Mediterranean Agricultural and Forest Systems, ISAFOM, P.le Enrico Fermi 1, 80055 Portici, NA, Italy
3
La Guardiense Farm, via Santa Lucia 104, 82034 Guardia Sanframondi, BN, Italy
*
Authors to whom correspondence should be addressed.
Horticulturae 2022, 8(9), 829; https://doi.org/10.3390/horticulturae8090829
Submission received: 27 July 2022 / Revised: 3 September 2022 / Accepted: 7 September 2022 / Published: 8 September 2022

Abstract

:
Climate is a determinant driver for grapevine geographical distribution, influencing yield and berry quality. The current environmental changes are intensifying the need to improve the knowledge of the soil–plant–atmosphere system in the vineyard, to properly manage cultivation factors and to increase berry yield and quality. Since most of the berry growth and ripening phases occur during the driest period in the Mediterranean area, increasing environmental constraints are expected to impose more and more limitations on grapevine productivity and finally on wine quality. The aim of this study was to evaluate whether different pedoclimatic conditions in four proximally located vineyards of the Campania Region in Southern Italy determine differences in crop yield and must quality of Vitis vinifera L. subsp. vinifera “Falanghina”. This study was conducted over three growing seasons, by monitoring vine growth and characterizing yield and must quality. The overall results showed differences in yield and berry quality characteristics for the four vineyards, with the field CA (Calvese) and GR (Grottole) showing pedoclimatic conditions limiting growth and yield compared to SL (Santa Lucia) and AC (Acquefredde).

1. Introduction

Climate is a determinant driver for grapevine geographical distribution, berry characteristics, and must and wine quality around the world [1]. The Mediterranean region is threatened by climate change, where climate models consistently project significant increase in temperature and high irregularities in precipitation patterns [2]. Since a dramatic change in the landscape has been forecasted with geographical shifting of the grapevine production regions, climate change is one of the major challenges for future viticulture, especially in arid and semi-arid regions of Europe [3]. Often, the combination of heat and severe water-deficit stress may compromise photosynthesis, causing a source–sink imbalance and incomplete berry maturation, with the consequence of obtaining reduced yield and low quality grapes and musts for vinification. Increases in the frequency, duration, and severity of drought events, as well as a shift in time of their occurrence, will likely induce plastic adaptive responses in plants, with a negative impact on plant growth, as is the case of grapevine, which is one of the most widespread crops worldwide, with about 38% of vineyards areas located in Europe [4,5]. Mild water stress can positively impact berry composition, flavors, and color, while high drought stress negatively affects grapevine production, acting on vine vigor, yield, and berry quality [6]. Water-deficit stress can also lead to a reduction in yield through metabolic pathways modifications, shifting the relative abundance of transcripts and metabolites involved in phenylpropanoid, isoprenoid, carotenoid, amino acid, and fatty acid metabolism [7,8,9]. Temperature variability strongly influences the developmental cycle of plants, affecting both carbon assimilation in source organs, as well as the activity of carbon sinks. The optimum temperature for photosynthesis is between 25 and 35 °C, while below 10 °C and above 40 °C physiological processes decline [10]. Therefore, changes in temperature can promote or inhibit the development and growth rate of flowers, fruits, and shoots, according to vine sensitivity, risking impairing the balance between vegetative growth, reproductive activity, and then grapevine quality and wine production [10,11]. The first effect of climate changes is an alteration of the normal course of the phenological phases (e.g., flowering, fruit set, veraison, ripening), which are reached earlier [12,13,14]. As consequence of increasing temperature, grape ripening occurs earlier in the season and in warmer conditions than in the past. Concerning grape quality, a common problem in Mediterranean vineyards is related to the influence of high temperature on the dynamics of soluble solids accumulation in the berries during ripening, with subsequent changes in berry chemical composition, resulting in higher sugar content, lower organic acid concentration, and higher pH [15,16]. High temperature is also known to decrease the accumulation of anthocyanins in berry skins, with effects on color and aromas [14,17,18,19]. Moreover, the high temperatures in summer, combined with drought stress, create optimal conditions for sunburn damages in sun-exposed grapes, inducing an imbalance between light energy absorption and usage, which compromises the electron transport activity. As a consequence, fruit respiratory mechanisms are altered and the higher level of anaerobic respiration caused by raising temperatures induces the accumulation of reactive oxygen species [20]. The temperature level that berries reach during the day is a function of radiative heat transfer and air temperature [21]. In particular, a direct exposure to the sun increases fruit surface temperature by 12–15 °C above air temperature on the berry’s sun-exposed side [17].
As in any agricultural crop, an increased water deficit is likely to impact the yield and economic sustainability of wine producing estates. In the last 15 years, a decrease in yield has been recorded in most winegrowing regions in France [14]. For this reason, in semi-arid areas, irrigation management is becoming a compelling solution to better control grape ripening, mitigating the negative effects of climatic changes. In order to adapt the viticulture to this changing situation, there is increasing interest in designing proper management techniques, suitable either to improve the way the vines use water or to introduce irrigation techniques, such as deficit irrigation (DI) at different percentages of the estimated crop evapotranspiration (ETc). However, there are still difficulties in precisely establishing the irrigation strategies (e.g., volumes, timing, etc.), in order to stabilize seasonal yield and improve must and wine quality. Indeed, there is still a lack of systematic knowledge about if, how, and to what extent the same cultivar in different pedoclimatic contexts can develop different morpho-physiological traits, affecting the quantity and quality of berries and related musts [22].
Within this general framework, the aim of this work was to analyze the variability in terms of growth, yield, and berry/must quality, as well as their relations, in four vineyards of Falanghina grapevine growing in Southern Italy under four pedoclimatic conditions, two more mesic the others more xeric, over three years. The Falanghina grapevine is a cultivar cultivated for the production of white wines, autochthonous of the Campania region in southern Italy [23]. It is characterized by a middle trunk conical bunch, medium sized grapes with waxy peel, and crispy pulp [24,25]. The pulp has a slightly floral flavor and musts generally have high acidity [25]. In this cultivar, climate changes are expected to influence the quality of musts more than yield, therefore knowing the relations between vegetative growth and berry quality can furnish valuable information for vineyard management targeted to specific oenological objectives.

2. Materials and Methods
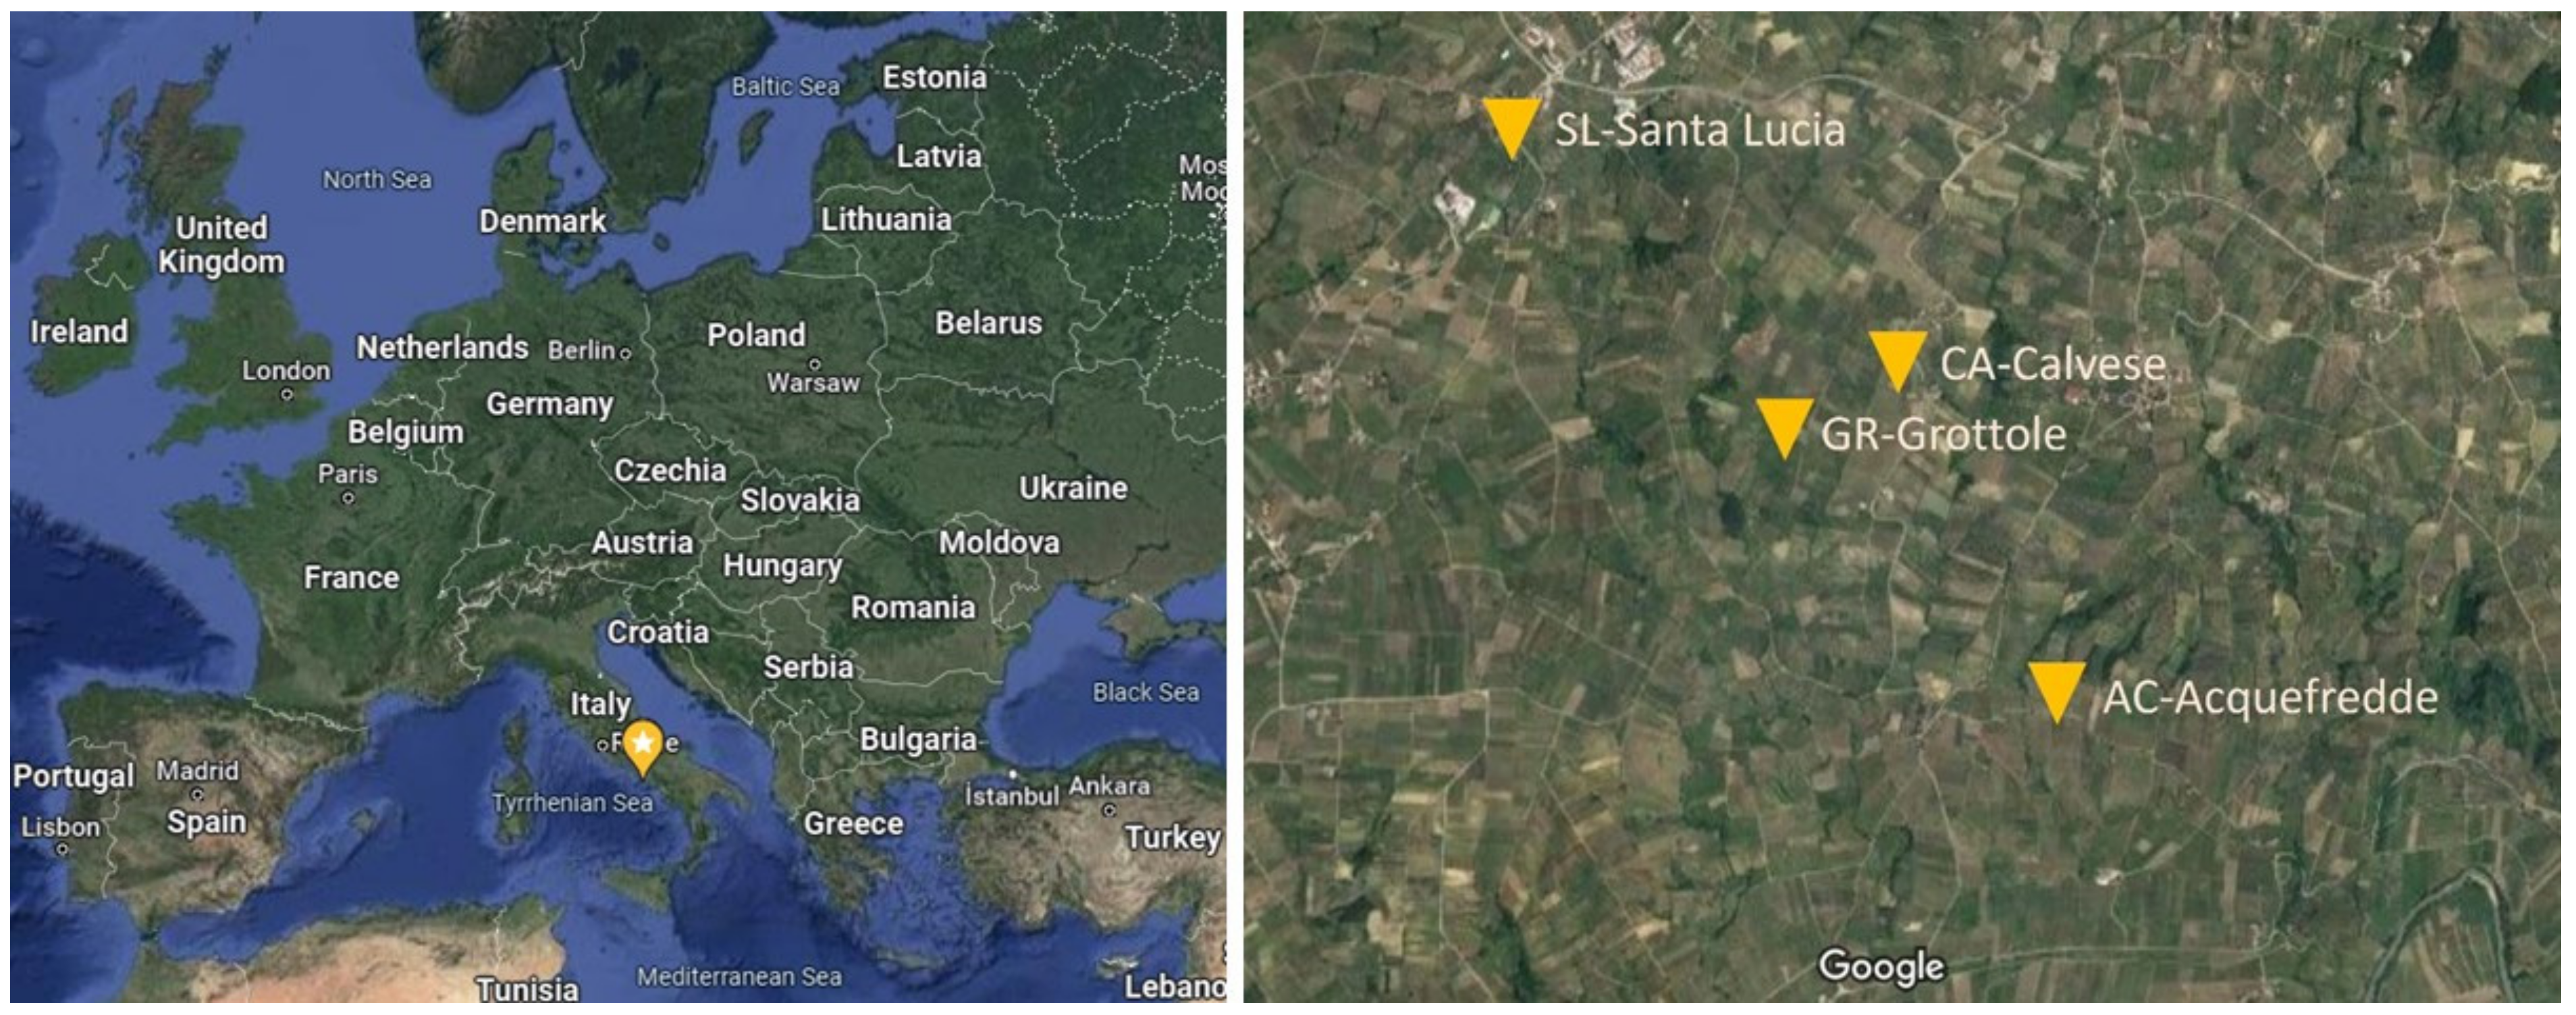
2.1. Study Site

The selected study area was located at Guardia Sanframondi (Benevento), in a hilly environment in the Campania region (southern Italy), characterized by a Mediterranean climate (cold wet winters and hot dry summers). The four selected vineyards are owned by members of La Guardiense consortium and they are named referring to their geographical district: (1) SL-Santa Lucia, on flat ground; (2) CA-Calvese, with a slope of 10% facing the west side; (3) GR-Grottole, on flat ground; (4) AC-Acquafredde, with a slope of 15% facing the west side (Figure 1). The vine cultivar studied was Vitis vinifera L. subsp. vinifera “Falanghina” (Controlled origin designation—DOC/AOC), and the vineyards were selected with the idea of identifying four sites similar for their plant material and cultivation management, but different in water availability and plant water usage [26]. For the three years of study, in each vineyard were closed 20 vines, 8–13 years old, grafted onto 157-11 Couderc rootstock, spaced 1–1.25 m on the row and with 2.1–2.2 m between the rows, and trained at double Guyot. The SL, GR, and CA vineyards are cultivated with a rain-fed regime, while at AC supplemental irrigation is applied [27]. Air temperature during the phenological phase of veraison (Guardia Sanframondi meteorological station—www.agricoltura.regione.campania.it/meteo/agrometeo.htm, accessed on 20 December 2021) was similar in 2019, 2020, and 2021. In July, the average temperature was 26.9 °C, 26.0 °C, and 26.2 °C, maximum temperature was 34.0 °C, 34.3 °C, and 34.0 °C, minimum temperature was 20.4 °C, 19.1 °C, and 19.2 °C, respectively, in 2019, 2020, and 2021. The cumulative rainfall and ET0 in July were 29 mm and 176 mm in the year 2019, 14 mm and 120 mm in 2020, and 43 mm and 167 mm in 2021. A different distribution of the soil water content (SWC) among the four vineyards at three different soil depth levels (15 cm, 30 cm, and 75 cm) was observed [27].
The soils in the experimental sites are the Mollisols type, classified as Typic Calciustolls and assigned to two principal soil series of the Valle Telesina soil map 1:50.000, [28], which are Consociazione dei suoli Pennine (SL, CA and GR sites) and Consociazione dei suoli Taverna Starze (CA site). The differences between the four sites are principally due to the variability of the percentage of stones along the soil profile [27] and due to the modification in thickness and depth of the soil horizons in the sites, induced by vineyard planting. Moreover, previous studies demonstrated that the four vineyards can be grouped into two groups, with SL and CA characterized by higher water availability compared to CA end GR [26]. Growth and development analyses and analytical determinations on berries and musts were performed in the three growing seasons 2019, 2020, and 2021.

2.2. Vegetative Growth and Yield Components, at Harvest

The biometrical parameters total leaf area, bunch weight per vine (yield), and number of bunches per vine (n° bunches) were recorded on 20 vines per vineyard. On the same vines, the actual fertility was calculated as the ratio between the number of fertile shoots and the total number of shoots per vine. The total shoot leaf area was estimated during the maximum vegetative vigor, corresponding to the veraison phenological phase 81 BBCH (Biologische Bundesantalt, Bundessortenamt, and Chemische Industrie). Estimation of leaf area was performed by applying an allometric estimation model measuring the leaf lamina width in the field and applying equations calculated based on the measurement of width and area of 20 leaves per site, by means of an electronic leaf area meter (LI-3100 model, LI-COR Inc., Lincoln, NE, USA) [29,30]. The yield and n° bunches were quantified at ripening stage (89 BBCH), by weighing and counting the entire grape production for each of the 20 selected vines in the four studied vineyards. The yield/total leaf area ratio (Y/LA) was also calculated for each vineyard.

2.3. Berry and Must Quality Traits

At harvest, for each vineyard, analytical determinations of standard chemical parameters were performed. For each vineyard, pH and titratable acidity (TA) were analyzed on 6 must samples (i.e., fresh juice without any fermentation). Samples were obtained by squeezing 60 berries from 6 vines (selected among the 20 vines), and the soluble solids content (SSC) was analyzed on 10 berries for each of the 20 selected vines. Berries were sampled by picking from the internal to the external part and from the top to the bottom of the harvested bunches, to ensure a representative sample. The SSC expressed in °Brix, was determined using a digital refractometer (HI96801, HANNA Instruments Italia Srl, Padua) by individually squeezing the 10 berries [31]. For pH and TA, 6 must samples per vineyard were filtered, 20 mL of must was kept and diluted 1:1 in distilled water. Afterwards, pH values were measured using a digital pH-meter (CLB22, Crison Instruments, Alella, Barcelona, Spain); whereas for TA determination, samples were titrated with a solution of NaOH 0.1 N to the endpoint of pH 8.2, and TA was expressed as g/L of tartaric acid equivalents [31].
Then, for each vineyard, a WineScan™ analysis with Foss Integrator software v. 2.0.4 (FOSS Italia s.r.l., Padova, Italy) and Dyonisos 150 (SinaTech s.r.l., Grottazzolina, Fermo, Italy) was performed on the 3 must samples obtained by squeezing 60 berries from 3 vines to quantify the following parameters: reducing sugars (RSU), pH, yeast assimilable nitrogen (YAN), calcium (Ca), catechins (CAT), total polyphenols (TPO), titratable acidity (TA), volatile acidity (VOL), malic acid (MAL), gluconic acid (GLU), citric acid (CIT), and tartaric acid (TAR).

2.4. Berry Mineral Composition

The analyses of must mineral composition were performed on 3 must samples obtained by squeezing 60 berries of 3 vines for each vineyard. For the evaluation of must mineral composition in terms of cations (Na+, K+, Mg2+, and Ca2+), anions (SO42−, PO43−), and organic acids (malate, tartrate, citrate, and isocitrate), 1 g of must was suspended in 20 mL of ultrapure water (Milli-Q, Merk Millipore, Darmstadt, Germany), frozen and subjected to 10 min shaking in a water bath (ShakeTemp SW22, Julabo, Seelbach, Germany) at 80 °C. Subsequently, the extracts were centrifuged, and the supernatant was collected and stored in vials. Anions and cations were separated and quantified by ion chromatography, equipped with conductivity detection (ICP 3000 Dionex, Thermo fisher Scientific Inc., Waltham, MA, USA), according to Zhifeng and Chengguang [32].

2.5. Data Elaboration

All experimental data were analyzed with the SPSS 13 statistical software (SPSS Inc., Chicago, IL, USA). A two-way ANOVA was performed considering the main effects of field (F) and year (Y) on data collected for growth parameters, yield, must quality, and mineral composition. Whenever the interactions were significant, a one-way ANOVA was performed. To separate means for each measured parameter, Duncan’s multiple range test was performed. Verification of normality was performed using the Shapiro–Wilk test; the percentage data were pre-subjected to arcsine transformation. Pearson correlation was performed among biometrical parameters, yield, and must quality traits. Asterisks indicate the significance of the Pearson correlation coefficient (*, **, ***, **** correspond to p < 0.1, 0.05, 0.02, and 0.01, respectively).

3. Results

3.1. Growth and Berry Quality Traits

Growth parameters (total leaf area, yield (bunch weight), bunch number, actual fertility, and Y/LA) and berry quality traits (SSC, pH, and TA) of the four vineyards, measured during the three growing seasons (2019–2020–2021) are reported in Table 1. The main effect of field (F) was significant for all analyzed parameters, except for pH and TA; the year (Y) as main factor showed significant effects on all parameters (Table 1). In particular, the total shoot leaf area was significantly different among the vineyards, with SL showing the highest value, followed by GR, CA, and AC.
Yield was significantly different among vineyards, with the highest value in SL followed by AC, GR, and CA. Bunch number showed the highest value in SL, followed by GR, AC, and CA. Actual fertility in AC reached a significant higher value than both SL and GR, which in turn were higher than CA. The rate of Y/LA in AC showed a significantly higher value than SL, which in turn was significantly higher than both CA and GR. For SSC, CA grapes showed a higher value than GR, while AC grapes showed intermediate values; SL grapes showed the lowest value. Concerning the main factor Y, its effect was significant for all analyzed parameters: for total shoot leaf area, SSC, and TA, the values in 2019 were significantly higher than 2020, which in turn were significantly higher than 2021. For yield and actual fertility, in 2019 and 2021 the values were similar and were higher than 2020. Bunch number showed the highest value in year 2021, followed by 2019 and 2020. The rate of Y/LA showed significant higher values for the year 2021 than both 2019 and 2020. The pH in 2021 was higher than in 2020, while 2019 showed intermediate values. The interaction F × Y was significant for bunch weight, bunch number, actual fertility, Y/LA, and SSC (Table S1). For bunch weight, the highest values were found in SL among the three years, and for SSC, the highest values were found in the years 2019 and 2020 for all the fields (Table S1).

3.2. Must Mineral and Organic Acids Composition

Must mineral and organic acids composition of the four vineyards in the three years (2019–2020–2021) are reported in Table 2 and Table 3. The main effect of field (F) was significant for all analyzed parameters, except Na⁺. Considering the main factor F, the values for SO₄2 and Isocitrate concentrations were significantly higher for must in CA and GR than the SL and AC must. For the PO₄3 in the must of CA, the value was higher than SL, with the musts of AC and GR having intermediate values (Table 2). For malate, SL and AC must showed higher values than the CA and GR must. For tartrate and Ca2⁺, CA grapes showed values significantly higher than GR, which in turn showed significantly higher values than SL and AC (Table 2 and Table 3). For citrate, GR must showed significantly higher values than all the other fields. For Mg2⁺, CA must showed significantly higher values than all the other fields. For K+,, CA grapes had a higher value than GR and AC, which in turn showed higher values than SL. The main factor year (Y) was significant for all parameters apart from Na⁺ and K⁺. For SO₄2 and Ca2⁺, the values in 2019 were significantly lower than 2020 and 2021. For PO₄3 and Mg2⁺, in the must of 2020 there was a significant higher value than 2019 and 2021 (Table 2). For malate in the must of 2019, there was a value significantly higher than 2020 and 2021. For tartrate in must of 2021, there was a significantly higher value in 2021 than the previous years. For citrate in the must of 2019 and 2020, there were values significantly lower than 2021. For isocitrate in the must of 2020, the value was higher than 2019, which in turn was higher than in 2021 (Table 3). The interaction F × Y was significant for tartrate, citrate, isocitrate, K⁺, Mg2⁺, and Ca2⁺, with the differences shown in the table of the Supplementary Materials. For K+, the highest values were found in CA must and the lowest in SL must. Mg2⁺ was significantly higher in the must of 2020 than the other two years for all the fields. Ca2⁺ showed the highest values in the must of CA 2021, CA 2020, and GR 2020. Tartrate showed highest values for the must CA 2021, CA 2019, and GR 2021. Citrate showed highest values in the must of GR 2019, GR 2020, and CA 2019. Isocitrate showed the highest values for the musts of GR 2020 and AC 2020 (Table S2).

3.3. Must Chemical Analysis

Must chemical analysis of the four vineyards in the three years (2019-2020-2021) is reported in Table 4. The main effect of field (F) was significant for all parameters analyzed, with the exception of catechins. For reducing sugars, SL and AC showed significantly lower values than CA, with GR showing an intermediate value. For pH, the AC must showed a higher value than GR, which in turn had a higher value than SL, with CA showing an intermediate value. For YAN, the musts of SL, CA, and AC showed a significant lower values than GR. Calcium content was significantly higher in the must of CA than GR musts, which in turn showed significantly higher values than AC; SL showed intermediate values. Total polyphenols content was significantly lower in the must of SL and GR compared to CA, with AC must showing intermediate values. The main factor of year (Y) was significant for all the studied parameters, apart from Catechins. The reducing sugars showed a higher value in 2020 compared to 2019 and 2021. For pH, in 2021 there was a higher value than in 2019, which in turn showed a higher value than 2020. For YAN, in 2021 there was a significant lower value than 2019 and 2020. For calcium, in 2020 there was a significant lower value than 2019 and 2021. For total polyphenols, the year 2019 showed a significant higher value than the subsequent years. The interaction F × Y was significant for YAN, calcium, and total polyphenols, with significant differences shown in the table of Supplementary Materials. Reducing sugars showed the highest values for CA 2020, AC 2020, and AC 2021, and the lowest for SL in the three years. The highest values of YAN were found in GR 2019 and GR 2020. Calcium showed the highest value in CA 2019. Total polyphenols were significantly higher in 2019 than 2020 and 2021 for all the fields (Table S3).

3.4. Must Organic Acids

The analysis of must organic acids analysis of the four vineyards in the three years (2019–2020–2021) is reported in Table 5. The main effect of field (F) was significant for all the parameters, with the exception of gluconic acid. Titratable acidity was significantly higher in the must of SL, CA, and GR than in AC. Volatile acidity in the must of CA showed a higher value than both GR and SL, with must of AC showing an intermediate values. Malic acid in must of SL showed a significantly higher value than AC, with the must of GR showing an intermediate value; CA must showed the lowest value. For citric acid, the must in CA showed a higher value than SL, GR, and AC. For tartaric acid, the must CA showed a higher value than SL and GR, which in turn showed a higher value than must of AC. The effect of the main factor year (Y) was significant for all parameters, except gluconic acid. Titratable acidity in the must of 2020 showed a significantly lower value than 2019 and 2021. The volatile acidity in the must of 2020 showed a significantly higher value than 2019, which in turn was higher than the must of 2021. Malic acid was significantly higher in the must of 2019 than in 2020 and 2021. Citric acid showed a significant lower value in must of 2021 compared to 2019 and 2020. Tartaric acid showed a significant lower value in the must of 2020 compared to the other two years. The interaction F × Y was significant for all analyzed parameters, except Gluconic acid. The interaction effects are shown in the table of Supplementary Materials. Titratable acidity showed the highest values for SL 2019, CA 2019, and GR 2019. Volatile acidity showed values highest in CA 2020 and AC 2020. Malic acid content was highest in SL 2019, GR 2019, and AC 2021, whereas citric acid was highest only in CA for all the three years of study. Tartaric acid showed highest values for CA 2019, CA 2021, and GR 2019 (Table S4).
A correlation analysis was carried out to highlight the possible relationships among biometrical, berry yield, and must quality traits for each season of the trial (Table 6). Concerning the data collected in the season 2019, a significant negative correlation was observed between bunch weight and SSC and pH, whereas a significant positive correlation was found between SSC and pH. The pH and TA (as well as the content of organic acids) were positively correlated with total polyphenols.
In 2020, bunch weight was significantly positively correlated with total SLA. SSC was positively correlated with pH, citric acid, and total polyphenols, and negatively correlated with TA, malic acid, and tartaric acid. The parameter pH was significantly correlated with total polyphenols. In 2021, bunch weight was negatively correlated with SSC and Citric Acid. SSC was positively correlated with total polyphenols and organic acids, with the exclusion of tartaric acid.

4. Discussion

Falanghina grapevine is one of the most economically important and cultivated varieties of the Campania region [23]. Since climate changes are expected to affect vine growth and the quality of the production, the variability of growth and must quality traits were investigated in vineyards characterized by different microclimatic and pedological characteristics. Vine growth, yield, and grape quality in the four analyzed experimental vineyards were characterized by significant differences, suggesting a different regulation of the source-sink balance according to the different microclimatic and pedological conditions, which can differentially influence the water availability for the vines [26]. In general, during the three years, the SL vineyard proved to be the best performing in terms of vegetative growth compared to the other four vineyards, in agreement with the morphophysiological and carbon isotopic analyses performed in the 2019–2020 season for the same vineyards [26,27]. Indeed, in a previous study, Damiano et al. [26] found that SL and AC showed lower values of δ13C in must, indicating that the two vineyards experienced reduced stress compared to the other two vineyards CA and GR. Plants grown under water-limited conditions are known to experience a strong stomatal regulation, which leads to partial or total stomatal closure, determining a decrease in 13CO2 discrimination and an increase of δ13C values [33]. In CA, the lowest yield was not only due to the morpho-physiological traits [26,27], but also to the actual fertility that resulted as the lowest among the four vineyards, partly accounting for the low number of bunches at harvest.
Moreover, the grapes of vineyard CA showed significantly higher values of SSC, suggesting that the more limiting drought condition experienced by the vines at this site may have significantly accelerated the ripening dynamics in the bunches developed by the vines. Probably, as reported in [34], the period after veraison is the period for which the thermal conditions have a more significant effect on the technical ripening process. Usually in drought conditions there is a common reaction of the plants, which consists in the closure of leaf stomata in order to avoid an excess of water loss and the increase of soluble solids concentration in the berries, but when the drought is strong this mechanism it is probably not sufficient to avoid a concentration effect of soluble solids. Grape berry water loss in the ripening stage, known as berry dehydration, is an irreversible regression process in berry fresh weight, accelerated by hot and dry growing conditions, which occurs as a consequence of berry water depletion through xylem back-flow and transpiration that exceeds the import of water and solutes into the berry [35,36]. Another indicator of the advanced metabolic process in the ripening stage of the CA vineyard was the level of malic acid in grapes, which was significantly lower than in grapes of the other three vineyards. Malic acid breakdown is not an intrinsic part of the veraison program because external parameters such as temperature and internals such as carbon balance may be determinants of malate breakdown. Normally, malic acid is the main organic acid that is actively metabolized throughout the ripening of grapes, and the degradation of grape berry malate occurs after an earlier period of accumulation [16] compared to tartaric acid, which is less dependent on increasing temperature [37]. Under high-temperature regimes, malate content decreases as soon as sugar accumulates in the berry. On the contrary, in cool conditions, the malic acid decrease is only evident when sugar content has reached 500 mM [38]. Observing the interaction among the analyzed parameters, a negative correlation for Bunch Weight-Brix° was observed over the three years, confirming the dilution effect of the grape chemical compounds with the increase in bunch weight. Concerning the yield of grape production when observing the bunch weight, in CA there was a lower significant value, in accordance with the significant lower values Y/LA ratio. The leaf area is crucial for carbohydrates allocation in the reproductive organs of grapevine, for reaching and maintaining a high productivity in terms of fruit yield [39,40]. For this reason, CA may have had a reduced yield compared to the other three vineyards, while in SL vineyards, the high shoot leaf area may have been able to hold a higher yield.
Regarding the mineral nutrition, vines need an adequate supply of macro- and micro-nutrients in order to achieve their normal physiological and biochemical function. Basic mineral nutrients are considered to be essential for plant metabolic processes, seeing that they are cofactors and/or activators of many metabolic enzymes [41]. These nutrients are required for vine life cycle from budburst to leaf senescence, and generally they limit grape production [42]. Excessive nutrient supply and deficiencies can both lead to physiological disorders. Deficiencies occur when plants do not have sufficient availability of nutrients for their basic metabolism in the surrounding environment, while an abundance of minerals, in particular trace metals (e.g., zinc, copper, manganese) can sometimes induce toxicity phenomena [43]. In the case of CA, a significantly higher level of the cations K⁺, Mg2⁺, and Ca2⁺ and anions SO₄2¯ and PO₄3¯ was found compared to the other three vineyards. A high level of salt in soils generates both ionic and osmotic disruptions in plant function [44,45]. The osmotic effect, with similar symptoms to water deficit [45], characterized by low water potential in the soils due to the increased salt concentration, could have been responsible for the low vigor of the vines in these vineyards. This reduction of soil water potential restrains water uptake into the plant, consequently decreasing growth and nutrient uptake [46]. Another indicator of the drought stress conditions in the vineyard CA was the high content of total polyphenols in the berries (Table 4). Usually, water stress causes relevant losses of berry weight, also affecting the concentration of several polyphenols [47]. Due to the drought stress, in CA the plant may have reacted with the polyphenol accumulation, being part of the chemical resources mediating the adaptive response to abiotic stress, by acting against oxidative damages through the scavenging of reactive oxygen species produced during drought stress [48]. The YAN was significantly higher in GR compared to the other three vineyards, indicating a high presence of nitrogen in the must of this vineyard.
Observing Table 6 with the correlations among biometrical, berry yield, and must quality traits for each season, with bunch weight tending to increase, there is a decrease of SSC and pH, showing a negative correlation between the parameters, due to both a well-known crop load effect and a dilution effect. This negative correlation is significant for the years 2019 and 2021, which are also the years with a significantly high bunch weight compared to the year 2020.
The optimal grape maturity is cultivar specific and defined by a specific combination of three main factors: (i) technological maturity (i.e., sugar, acids or their ratio); (ii) phenolic maturity (i.e., quantity and quality of all tannins and pigments); (iii) aromatic ripeness (i.e., typical olfactory features reached without appearance of untypical aging or excessive veggie-green aromas). The decoupling between the above three factors is strongly aggravated under a global warming scenario [49]. Higher temperatures increase the speed of sugar accumulation, hasten acid degradation, alter flavor compounds [7,50,51], and affect the synthesis/degradation of certain compounds as polyphenols [17,52,53,54].
In this scenario, there is an increasing interest in avoiding alterations of ripening and controlling berry quality in the white berry grapevine, in order to preserve the features of the wines. Besides the regulation of source-sink relationships through correct summer pruning, recently the application of anti-transpirant treatments at veraison has been evaluated to reduce berry sugar content, ultimately aiming at the production of medium alcohol wines [24].
Concerning the water management and irrigation in the vineyard, due to the wide cultivation under quality label regulations, no results are available for southern Italy local cultivars. This indicates a future need to better investigate pedoclimatic impact on vine water use, yield, and quality, to design optimal irrigation strategies to counteract the drought season and avoid unbalances in the grape ripening process.

5. Conclusions

The overall results showed differences in growth, yield, and must quality characteristics for the four vineyards, with the field CA and GR showing pedoclimatic conditions constraining vegetative growth and berry production compared to SL and AC. These findings are in line with data from previous studies, in which a different leaf anatomical development was evidenced in the four vineyards, being the reason for the different eco-physiological behaviors. Therefore, it is clear that microclimatic and spatial variability in soil water availability can induce a different vine development and eco-physiological behavior, which is reflected in yield and berry quality and must be taken into account when designing strategies for Falanghina cultivation management in the pursuit of precision viticulture in a climate change scenario.

Supplementary Materials

The following supporting information can be downloaded at: https://www.mdpi.com/article/10.3390/horticulturae8090829/s1, Table S1, Data of interaction analysis F × Y for bunch weight and SSC; Table S2, Data of interaction analysis F × Y for Reducing sugar, YAN, Calcium, Total polyphenols; Table S3, Data of interaction analysis F × Y for K⁺, Mg2⁺, Ca2⁺, Tartrate, Citrate, Isocitrate; Table S4, Data of interaction analysis F × Y for Titratable acidity, Volatile acidity, Malic acid, Gluconic acid, Citric acid, Tartaric acid.

Author Contributions

Conceptualization, N.D., V.D.M. and C.C.; methodology, C.C., M.G. and V.D.M.; formal analysis, N.D., F.P., R.C. and A.E.; investigation, N.D., C.C. and V.D.M.; resources, C.C., M.G. and V.D.M.; data curation, N.D., F.P., R.C., A.E., C.C. and V.D.M.; writing—original draft preparation, N.D., C.C. and V.D.M.; writing—review and editing, N.D., C.C., F.P., R.C., A.E., M.G. and V.D.M.; supervision, C.C., M.G. and V.D.M.; project administration, V.D.M.; funding acquisition, V.D.M. All authors have read and agreed to the published version of the manuscript.

Funding

The work of Nicola Damiano was funded within the PhD Programme “Dottorati di Ricerca con Caratterizzazione Industriale”, P.O.R. CAMPANIA FSE 2014/2020. ASSE III—OBIETTIVO SPECIFICO 14 Azione 10.4.5.

Data Availability Statement

The data supporting the findings of this study are available from the corresponding authors (V.D.M. and C.C.) upon reasonable request.

Acknowledgments

The authors wish to thank La Guardiense Farm (Guardia Sanframondi—BN) for logistic support and especially Concetta Pigna for support during the different phases of the project. The authors also wish to thank Antonello Bonfante for scientific consulting, Chiara Amitrano and Sara De Francesco for technical support in field and laboratory activities.

Conflicts of Interest

The authors declare no conflict of interest.

References

  1. de Rosas, I.; Deis, L.; Baldo, Y.; Cavagnaro, J.B.; Cavagnaro, P.F. High Temperature Alters Anthocyanin Concentration and Composition in Grape Berries of Malbec, Merlot, and Pinot Noir in a Cultivar-Dependent Manner. Plants 2022, 11, 926. [Google Scholar] [CrossRef]
  2. Pörtner, H.-; Roberts, D.; Tignor, M.; Poloczanska, E.; Mintenbeck, K.; Alegría, A.; Craig, M.; Langsdorf, S.; Löschke, S.; Möller, V.; et al. Sixth Assessment Report Citations to the Sixth Assessment Report of the Intergovernmental Panel on Climate Change; IPCC: Geneva, Switzerland, 2022. [Google Scholar]
  3. Chmielewski, F.-M.; Rötzer, T. Response of Tree Phenology to Climate Change across Europe. Agric. For. Meteorol. 2001, 108, 101–112. [Google Scholar] [CrossRef]
  4. Bonfante, A.; Monaco, E.; Langella, G.; Mercogliano, P.; Bucchignani, E.; Manna, P.; Terribile, F. A Dynamic Viticultural Zoning to Explore the Resilience of Terroir Concept under Climate Change. Sci. Total Environ. 2018, 624, 294–308. [Google Scholar] [CrossRef] [PubMed]
  5. Tomás, M.; Medrano, H.; Escalona, J.M.; Martorell, S.; Pou, A.; Ribas-Carbó, M.; Flexas, J. Variability of Water Use Efficiency in Grapevines. Environ. Exp. Bot. 2014, 103, 148–157. [Google Scholar] [CrossRef]
  6. Deluc, L.G.; Quilici, D.R.; Decendit, A.; Grimplet, J.; Wheatley, M.D.; Schlauch, K.A.; Mérillon, J.M.; Cushman, J.C.; Cramer, G.R. Water Deficit Alters Differentially Metabolic Pathways Affecting Important Flavor and Quality Traits in Grape Berries of Cabernet Sauvignon and Chardonnay. BMC Genom. 2009, 10, 212. [Google Scholar] [CrossRef] [PubMed]
  7. Conde, C.; Silva, P.; Fontes, N.; Dias, A.C.P.; Tavares, R.M.; Sousa, M.J.; Agasse, A.; Delrot, S.; Gerós, H. Biochemical Changes throughout Grape Berry Development and Fruit and Wine Quality. Food Glob. Sci. Books 2007, 1, 1–22. [Google Scholar]
  8. Oliveira, C.; Silva Ferreira, A.C.; Mendes Pinto, M.; Hogg, T.; Alves, F.; Guedes De Pinho, P. Carotenoid Compounds in Grapes and Their Relationship to Plant Water Status. J. Agric. Food Chem. 2003, 51, 5967–5971. [Google Scholar] [CrossRef]
  9. Cabral, I.L.; Teixeira, A.; Lanoue, A.; Unlubayir, M.; Munsch, T.; Valente, J.; Alves, F.; da Costa, P.L.; Rogerson, F.S.; Carvalho, S.M.P.; et al. Impact of Deficit Irrigation on Grapevine Cv. ‘Touriga Nacional’ during Three Seasons in Douro Region: An Agronomical and Metabolomics Approach. Plants 2022, 11, 732. [Google Scholar] [CrossRef]
  10. Tombesi, S.; Sabbatini, P.; Frioni, T.; Grisafi, F.; Barone, F.; Zani, P.; Palliotti, A.; Poni, S. Grapevine Response to Stress Generated by Excessive Temperatures during the Budburst. Horticulturae 2022, 8, 187. [Google Scholar] [CrossRef]
  11. Greer, D.H.; Weedon, M.M. Modelling Photosynthetic Responses to Temperature of Grapevine (Vitis vinifera Cv. Semillon) Leaves on Vines Grown in a Hot Climate. Plant Cell Environ. 2012, 35, 1050–1064. [Google Scholar] [CrossRef]
  12. Zarrouk, O.; Brunetti, C.; Egipto, R.; Pinheiro, C.; Genebra, T.; Gori, A.; Lopes, C.M.; Tattini, M.; Chaves, M.M. Grape Ripening Is Regulated by Deficit Irrigation/Elevated Temperatures According to Cluster Position in the Canopy. Front. Plant Sci. 2016, 7, 1640. [Google Scholar] [CrossRef] [PubMed] [Green Version]
  13. Parker, A.K.; de Cortázar-Atauri, I.G.; van Leeuwen, C.; Chuine, I. General Phenological Model to Characterise the Timing of Flowering and Veraison of Vitis vinifera L. Aust. J. Grape Wine Res. 2011, 17, 206–216. [Google Scholar] [CrossRef]
  14. van Leeuwen, C.; Destrac-Irvine, A. Modified Grape Composition under Climate Change Conditions Requires Adaptations in the Vineyard. Oeno One 2017, 51, 147–154. [Google Scholar] [CrossRef]
  15. Yamane, T.; Jeong, S.T.; Goto-Yamamoto, N.; Koshita, Y.; Kobayashi, S. Effects of Temperature on Anthocyanin Biosynthesis in Grape Berry Skins.Aust. J. Grape Wine Res. 2006, 57, 54. [Google Scholar]
  16. Sweetman, C.; Deluc, L.G.; Cramer, G.R.; Ford, C.M.; Soole, K.L. Regulation of Malate Metabolism in Grape Berry and Other Developing Fruits. Phytochemistry 2009, 70, 1329–1344. [Google Scholar] [CrossRef] [PubMed]
  17. Spayd, S.E.; Tarara, J.M.; Mee, D.L.; Ferguson, J.C. Separation of Sunlight and Temperature Effects on the Composition of Vitis vinifera Cv. Merlot Berries. Aust. J. Grape Wine Res. 2002, 53, 171–182. [Google Scholar]
  18. Sadras, V.O.; Petrie, P.R.; Moran, M.A. Effects of Elevated Temperature in Grapevine. II Juice PH, Titratable Acidity and Wine Sensory Attributes. Aust. J. Grape Wine Res. 2013, 19, 107–115. [Google Scholar] [CrossRef]
  19. Sugiura, T.; Shiraishi, M.; Konno, S.; Sato, A. Prediction of Skin Coloration of Grape Berries from Air Temperature. J. Hortic. 2018, 87, 18–25. [Google Scholar] [CrossRef]
  20. Gambetta, J.M.; Holzapfel, B.P.; Stoll, M.; Friedel, M. Sunburn in Grapes: A Review. Front. Plant Sci. 2021, in press. [CrossRef]
  21. Hulands, S.; Greer, D.H.; Harper, J.D.I. The Interactive Effects of Temperature and Light Intensity on Vitis vinifera Cv. “Semillon” Grapevines. II. Berry Ripening and Susceptibility to Sunburn at Harvest. Europ. J. Hortic. Sci. 2014, 79, 1–7. [Google Scholar]
  22. Pérez-Álvarez, E.P.; Intrigliolo Molina, D.S.; Vivaldi, G.A.; García-Esparza, M.J.; Lizama, V.; Álvarez, I. Effects of the Irrigation Regimes on Grapevine Cv. Bobal in a Mediterranean Climate: I. Water Relations, Vine Performance and Grape Composition. Agric. Water Manag. 2021, 248, 106772. [Google Scholar] [CrossRef]
  23. Boselli, M.; Corso, C.; Monaco, A. Ampelographic Characterization of White Grape Varieties in Campania (Southern Italy) by Multivariate Analysis. Acta Hortic. 2000, 528, 75–81. [Google Scholar] [CrossRef]
  24. Di Vaio, C.; Villano, C.; Lisanti, M.T.; Marallo, N.; Cirillo, A.; di Lorenzo, R.; Pisciotta, A. Application of Anti-Transpirant to Control Sugar Accumulation in Grape Berries and Alcohol Degree in Wines Obtained from Thinned and Unthinned Vines of Cv. Falanghina (Vitis vinifera L.). Agronomy 2020, 10, 345. [Google Scholar] [CrossRef]
  25. de Filippis, F.; Aponte, M.; Piombino, P.; Lisanti, M.T.; Moio, L.; Ercolini, D.; Blaiotta, G. Influence of Microbial Communities on the Chemical and Sensory Features of Falanghina Sweet Passito Wines. Food Res. Int. 2019, 120, 740–747. [Google Scholar] [CrossRef] [PubMed]
  26. Damiano, N.; Altieri, S.; Battipaglia, G.; de Micco, V. Comparing Methods for the Analysis of Δ13C in Falanghina Grape Must from Different Pedoclimatic Conditions. Horticulturae 2022, 8, 226. [Google Scholar] [CrossRef]
  27. Damiano, N.; Arena, C.; Bonfante, A.; Caputo, R.; Erbaggio, A.; Cirillo, C.; de Micco, V. How Leaf Vein and Stomata Traits Are Related with Photosynthetic Efficiency in Falanghina Grapevine in Different Pedoclimatic Conditions. Plants 2022, 11, 1507. [Google Scholar] [CrossRef]
  28. Terribile, F.; Gennaro, A.D.; Mascellis, R.D. Carta dei suoli della Valle Telesina (1:50,000). In Progetto UOT Relazione Finale Convenzione CNR-ISPAIM-Regione Campania Assessorato Alla Agricoltura; Raccolta di 10 Carte Pedologiche della Regione Campania; Stampa System Cart: Rome, Italy, 1996. [Google Scholar]
  29. Cirillo, C.; Arena, C.; Rouphael, Y.; Caputo, R.; Amitrano, C.; Petracca, F.; de Francesco, S.; Vitale, E.; Erbaggio, A.; Bonfante, A.; et al. Counteracting the Negative Effects of Copper Limitations Through the Biostimulatory Action of a Tropical Plant Extract in Grapevine Under Pedo-Climatic Constraints. Front. Environ. Sci. 2021, 9, 587550. [Google Scholar] [CrossRef]
  30. Caccavello, G.; Giaccone, M.; Scognamiglio, P.; Forlani, M.; Basile, B. Influence of Intensity of Post-Veraison Defoliation or Shoot Trimming on Vine Physiology, Yield Components, Berry and Wine Composition in Aglianico Grapevines. Aust. J. Grape Wine Res. 2017, 23, 226–239. [Google Scholar] [CrossRef]
  31. European Union [EU] Commission Regulation (EEC) No 2676/90(REGULATION, H.A.T. 1990. Commission Regulation (EEC) No. 2676/90 Community Methods for the Analysis of Wines Official Journal L, 3 October 1990; European Union: Brussels, Belgium, 1990; pp. 1–192. [Google Scholar]
  32. Zhifeng, G.; Chengguang, F. Determination of organic acids and inorganic anions by single-column ion chromatography. J. Instrum. Anal. 1994, 5, 32–36. [Google Scholar]
  33. Farquhar, G.D.; O’Leary, M.H.; Berry, J.A. On the Relationship Between Carbon Isotope Discrimination and the Intercellular Carbon Dioxide Concentration in Leaves. Funct. Plant Biol. 1982, 9, 121–137. [Google Scholar] [CrossRef]
  34. Rodrigues, P.; Pedroso, V.; Gonçalves, F.; Reis, S.; Santos, J.A. Temperature-Based Grapevine Ripeness Modeling for Cv. Touriga Nacional and Encruzado in the Dão Wine Region, Portugal. Agronomy 2021, 11, 1777. [Google Scholar] [CrossRef]
  35. Cirilli, M.; Bellincontro, A.; de Santis, D.; Botondi, R.; Colao, M.C.; Muleo, R.; Mencarelli, F. Temperature and Water Loss Affect ADH Activity and Gene Expression in Grape Berry during Postharvest Dehydration. Food Chem. 2012, 132, 447–454. [Google Scholar] [CrossRef] [PubMed]
  36. Chou, H.C.; Šuklje, K.; Antalick, G.; Schmidtke, L.M.; Blackman, J.W. Late-Season Shiraz Berry Dehydration That Alters Composition and Sensory Traits of Wine. J. Agric. Food Chem. 2018, 66, 7750–7757. [Google Scholar] [CrossRef] [PubMed]
  37. Ollat, N.; Cookson, S.J.; Destrac-Irvine, A.; Lauvergeat, V.; Ouaked-Lecourieux, F.; Marguerit, E.; Barrieu, F.; Dai, Z.; Duchêne, E.; Gambetta, G.A.; et al. Grapevine Adaptation to Abiotic Stress: An Overview. Acta Hortic. 2019, 1248, 497–512. [Google Scholar] [CrossRef]
  38. Rienth, M.; Torregrosa, L.; Sarah, G.; Ardisson, M.; Brillouet, J.M.; Romieu, C. Temperature Desynchronizes Sugar and Organic Acid Metabolism in Ripening Grapevine Fruits and Remodels Their Transcriptome. BMC Plant Biol. 2016, 16, 164. [Google Scholar] [CrossRef]
  39. Zhu, J.; Gou, F.; Rossouw, G.; Begum, F.; Henke, M.; Johnson, E.; Holzapfel, B.; Field, S.; Seleznyova, A. Simulating Organ Biomass Variability and Carbohydrate Distribution in Perennial Fruit Crops: A Comparison between the Common Assimilate Pool and Phloem Carbohydrate Transport Models. Silico Plants 2021, 3, diab024. [Google Scholar] [CrossRef]
  40. Li, Y.M.; Forney, C.; Bondada, B.; Leng, F.; Xie, Z. sen The Molecular Regulation of Carbon Sink Strength in Grapevine (Vitis vinifera L.). Front. Plant Sci. 2021, 11, 606918. [Google Scholar] [CrossRef]
  41. Pandey, R. Mineral Nutrition of Plants. In Plant Biology and Biotechnology: Plant Diversity, Organization, Function and Improvement; Springer: New Delhi, India, 2015; Volume 1, pp. 499–538. ISBN 9788132222866. [Google Scholar]
  42. Brataševec, K.; Sivilotti, P.; Vodopivec, B.M. Soil and Foliar Fertilization Affects Mineral Contents in Vitis vinifera L. Cv. “rebula” Leaves. J. Soil Sci. Plant Nutr. 2013, 13, 650–663. [Google Scholar]
  43. He, Z.L.; Yang, X.E.; Stoffella, P.J. Trace Elements in Agroecosystems and Impacts on the Environment. J. Trace Elem. Med. Biol. 2005, 19, 125–140. [Google Scholar] [CrossRef]
  44. Baggett, J.P.; Habibsadeh, S.; Toups, H.S.; Cochetel, N.; Ghan, R.; Robinson, M.L.; Barrios-Masias, F.H.; Cramer, G.R. Is Foliar Cl- Concentration the Cause of Photosynthetic Decline in Grapevine during Mild Salinity? Oeno One 2021, 55, 33–48. [Google Scholar] [CrossRef]
  45. Munns, R. Comparative Physiology of Salt and Water Stress. Plant Cell Environ. 2002, 25, 239–250. [Google Scholar] [CrossRef]
  46. Acosta-Motos, J.R.; Ortuño, M.F.; Bernal-Vicente, A.; Diaz-Vivancos, P.; Sanchez-Blanco, M.J.; Hernandez, J.A. Plant Responses to Salt Stress: Adaptive Mechanisms. Agronomy 2017, 7, 18. [Google Scholar] [CrossRef]
  47. Sadras, V.O.; Moran, M.A. Elevated Temperature Decouples Anthocyanins and Sugars in Berries of Shiraz and Cabernet Franc. Aust. J. Grape Wine Res. 2012, 18, 115–122. [Google Scholar] [CrossRef]
  48. Pinasseau, L.; Vallverdú-Queralt, A.; Verbaere, A.; Roques, M.; Meudec, E.; le Cunff, L.; Péros, J.P.; Ageorges, A.; Sommerer, N.; Boulet, J.C.; et al. Cultivar Diversity of Grape Skin Polyphenol Composition and Changes in Response to Drought Investigated by LC-MS Based Metabolomics. Front. Plant Sci. 2017, 8, 1826. [Google Scholar] [CrossRef] [PubMed]
  49. Palliotti, A.; Tombesi, S.; Silvestroni, O.; Lanari, V.; Gatti, M.; Poni, S. Changes in Vineyard Establishment and Canopy Management Urged by Earlier Climate-Related Grape Ripening: A Review. Sci. Hortic. 2014, 178, 43–54. [Google Scholar] [CrossRef]
  50. Coombe, B.G.; Iland, P.G. Grape Berry Development and Winegrape Quality. Viticulture 2004, 1, 210–248. [Google Scholar]
  51. Lund, S.; Bohlmann, J. The Molecular Basis for Wine Grape Quality-A Volatile Subject. Science 2006, 311, 804–805. [Google Scholar] [CrossRef] [Green Version]
  52. Bergqvist, J.; Dokoozlian, N.; Ebisuda, N. Sunlight Exposure and Temperature Effects on Berry Growth and Composition of Cabernet Sauvignon and Grenache in the Central San Joaquin Valley of California. Aust. J. Grape Wine Res. 2001, 52, 1–7. [Google Scholar]
  53. Mori, K.; Goto-Yamamoto, N.; Kitayama, M.; Hashizume, K. Loss of Anthocyanins in Red-Wine Grape under High Temperature. J. Exp. Bot. 2007, 58, 1935–1945. [Google Scholar] [CrossRef]
  54. Teixeira, A.; Eiras-Dias, J.; Castellarin, S.D.; Gerós, H. Berry Phenolics of Grapevine under Challenging Environments. Int. J. Mol. Sci. 2013, 14, 18711–18739. [Google Scholar] [CrossRef] [Green Version]
Figure 1. Location of the four selected vineyards: SL-Santa Lucia (41°14′45″ N, 14°34′16″ E, 194 m above sea level—a.s.l.), CA-Calvese (41°14′19″ N, 14°35′11″ E, 163 m a.s.l.), GR-Grottole (41°14′21″ N, 14°34′56″ E, 158 m a.s.l.), AC-Acquefredde (41°13′44″ N, 14°35′33″ E, 84 m a.s.l.). Source: Google Earth Pro.
Horticulturae 08 00829 g001
Table 1. Effects of field (F), year (Y), and their interaction (F × Y) on total total leaf area, yield, bunch number, actual fertility, Y/LA, SSC, pH, TA, of V. vinifera subsp. vinifera “Falanghina” vines at the four study sites: SL-Santa Lucia, CA-Calvese, GR-Grottole, and AC-Acquafredde. Mean values and standard errors are shown. Different letters within each column indicate significant differences according to Duncan’s multiple-range test (p ≤ 0.05).
Total Leaf AreaYieldBunch NumberActual
Fertility
Y/LASSCpHTA
m2 vine1kg vine1n° vine1 Kg m−2°Brix g l1 tartaric acid
equivalent
Field (F)
SL7.87 ± 0.60 a6.92 ± 0.28 a23.2 ± 1.20 a1.06 ± 0.030 b1.12 ± 0.12 b16.3 ± 0.32 c3.16 ± 0.076 a6.26 ± 0.615 a
CA5.04 ± 0.30 c2.25 ± 0.15 d13.8 ± 0.65 d0.92 ± 0.037 c0.53 ± 0.03 c19.3 ± 0.45 a3.30 ± 0.082 a5.47 ± 0.600 a
GR6.30 ± 0.46 b3.65 ± 0.23 c20.4 ± 0.99 b1.06 ± 0.034 b0.67 ± 0.09 c17.8 ± 0.47 b3.39 ± 0.079 a5.61 ± 0.572 a
AC3.79 ± 0.22 d4.37 ± 0.20 b17.1 ± 0.81 c1.23 ± 0.053 a1.40 ± 0.10 a 18.4 ± 0.57 ab3.22 ± 0.042 a5.76 ± 0.443 a
Year (Y)
20197.14 ± 0.48 a4.85 ± 0.27 a17.7 ± 0.60 b1.22 ± 0.034 a0.89 ± 0.07 b20.0 ± 0.40 a3.26 ± 0.070 ab7.62 ± 0.603 a
20205.49 ± 0.22 b3.56 ± 0.23 b14.2 ± 0.59 c0.80 ± 0.031 b0.66 ± 0.03 b17.8 ± 0.44 b3.16 ± 0.033 b5.63 ± 0.195 b
20213.50 ± 0.24 c4.48 ± 0.29 a23.9 ± 1.04 a1.18 ± 0.029 a1.56 ± 0.16 a16.0 ± 0.32 c3.38 ± 0.073 a4.07 ± 0.186 c
Significance 1
F*****************NSNS
Y********************
F × YNS***************NSNS
1 NS, *, **, and ***, not significant or significant at p ≤ 0.05, 0.01, and 0.001, respectively.
Table 2. Effects of field (F), year (Y), and their interaction (F × Y) on must minerals (Na⁺, K⁺, Mg2⁺, Ca2⁺, SO₄2, PO₄3) content in V. vinifera subsp. vinifera “Falanghina” vines at the four study sites: SL-Santa Lucia, CA-Calvese, GR-Grottole, and AC-Acquafredde. Mean values and standard errors are shown. Different letters within each column indicate significant differences according to Duncan’s multiple-range test (p ≤ 0.05).
Na⁺K⁺Mg2Ca2SO₄2PO₄3
(g kg−1 DW)(g kg1 DW)(g kg1 DW)(g kg−1 DW)(g kg−1 DW)(g kg−1 DW)
Field (F)
SL0.150 ± 0.024 a0.97 ± 0.04 c0.066 ± 0.004 b0.081 ± 0.003 bc0.034 ± 0.002 b0.101 ± 0.007 c
CA0.091 ± 0.030 a1.60 ± 0.10 a0.089 ± 0.005 a0.128 ± 0.016 a0.045 ± 0.004 a0.174 ± 0.012 a
GR0.106 ± 0.021 a1.34 ± 0.07 b0.065 ± 0.006 b0.086 ± 0.007 b0.045 ± 0.003 a0.128 ± 0.009 bc
AC0.097 ± 0.016 a1.38 ± 0.04 b0.068 ± 0.008 b0.068 ± 0.006 c0.035 ± 0.003 b 0.156 ± 0.014 ab
Year (Y)
20190.091 ± 0.023 a1.31 ± 0.09 a0.064 ± 0.002 b0.069 ± 0.004 b0.033 ± 0.002 b0.140 ± 0.012 ab
20200.129 ± 0.019 a1.31 ± 0.08 a0.093 ± 0.003 a0.101 ± 0.005 a0.042 ± 0.002 a0.155 ± 0.012 a
20210.113 ± 0.020 a1.35 ± 0.09 a0.059 ± 0.006 b0.103 ± 0.015 a0.044 ± 0.004 a0.123 ± 0.011 b
Significance 1
FNS**************
YNSNS*********
F × YNS*******NSNS
1 NS, *, **, and ***, not significant or significant at p ≤ 0.05, 0.01, and 0.001, respectively.
Table 3. Effects of field (F), year (Y), and their interaction (F × Y) on must organic acids content in V. vinifera subsp. vinifera “Falanghina” vines at the four study sites: SL-Santa Lucia, CA-Calvese, GR-Grottole, AC-Acquafredde. Mean values and standard errors are shown. Different letters within each column indicate significant differences according to Duncan’s multiple-range test (p ≤ 0.05).
Malate Tartrate CitrateIsocitrate
(g kg−1 DW)(g kg−1 DW)(g kg−1 DW)(g kg−1 DW)
Field (F)
SL2.46 ± 0.37 a6.64 ± 0.27 c0.358 ± 0.011 b0.079 ± 0.011 b
CA1.59 ± 0.33 b10.0 ± 1.18 a0.371 ± 0.028 b0.098 ± 0.011 a
GR1.86 ± 0.25 b7.63 ± 0.43 b0.458 ± 0.028 a0.100 ± 0.013 a
AC2.76 ± 0.22 a6.48 ± 0.26 c0.373 ± 0.018 b0.083 ± 0.012 b
Year (Y)
20193.04 ± 0.24 a7.18 ± 0.42 b0.430 ± 0.024 a0.101 ± 0.007 b
20201.83 ± 0.12 b6.60 ± 0.25 b0.403 ± 0.022 a0.119 ± 0.006 a
20211.63 ± 0.28 b9.29 ± 0.94 a0.338 ± 0.009 b0.051 ± 0.003 c
Significance 1
F*********
Y************
F × YNS******
1 NS, *, **, and ***, not significant or significant at p ≤ 0.05, 0.01, and 0.001, respectively.
Table 4. Effects of field (F), year (Y) and their interaction (F × Y) on reducing sugars, pH, YAN, calcium, catechins, total polyphenols of V. vinifera subsp. vinifera “Falanghina” vines at the four study sites: SL-Santa Lucia, CA-Calvese, GR-Grottole, and AC-Acquafredde. Mean values and standard errors are shown. Different letters within each column indicate significant differences according to Duncan’s multiple comparison tests (p ≤ 0.05).
Reducing SugarspHYANCalciumCatechinsTotal Polyphenols
g/L mg/Lmg/Lmg/Lppm
Field (F)
SL201 ± 4.90 b3.11 ± 0.01 c88.4 ± 15.7 b58.8 ± 7.49 bc5.49 ± 1.24 a628.5 ± 254.2 b
CA230 ± 12.07 a3.14 ± 0.05 bc81.0 ± 10.2 b103 ± 16.4 a8.78 ± 1.61 a1011 ± 233.5 a
GR213 ± 6.88 ab3.21 ± 0.04 b144 ± 22.8 a66.0 ± 7.02 b6.98 ± 1.35 a708.2 ± 218.8 b
AC208 ± 25.47 b3.32 ± 0.05 a82.0 ± 13.0 b46.6 ± 9.01 c7.47 ± 1.48 a854.4 ± 120.4 ab
Year (Y)
2019196 ± 16.08 b3.14 ± 0.03 b117 ± 17.5 a81.5 ± 15.4 a7.40 ± 1.23 a1467 ± 123.6 a
2020236 ± 8.60 a3.32 ± 0.04 c125 ± 11.3 a42.4 ± 6.13 b6.49 ± 1.19 a543.4 ± 130.0 b
2021207 ± 9.72 b3.13 ± 0.03 a53.7 ± 6.39 b82.3 ± 2.01 a7.65 ± 1.35 a391.3 ± 105.1 b
Significance 1
F**********NS*
Y************NS***
F × Y***NS****NS***
1 NS, * and ***, not significant or significant at p ≤ 0.05, and 0.001, respectively.
Table 5. Effects of field (F), year (Y), and their interaction (F × Y) on titratable acidity, volatile acidity, malic acid, gluconic acid, citric acid, tartaric acid of V. vinifera subsp. vinifera “Falanghina” vines at the four study sites: SL-Santa Lucia, CA-Calvese, GR-Grottole, and AC-Acquafredde. Mean values and standard errors are shown. Different letters within each column indicate significant differences according to Duncan’s multiple comparison tests (p ≤ 0.05).
Titratable
Acidity
Volatile
Acidity
Malic
Acid
Gluconic
Acid
Citric
Acid
Tartaric
Acid
g/Lg/Lg/Lg/Lg/Lg/L
Field (F)
SL6.80 ± 0.44 a0.067 ± 0.012 b2.81 ± 0.36 a0.350 ± 0.033 a0.290 ± 0.023 b5.09 ± 0.24 b
CA6.56 ± 0.49 a0.091 ± 0.018 a1.93 ± 0.13 c0.462 ± 0.088 a0.396 ± 0.017 a6.06 ± 0.56 a
GR6.34 ± 0.37 a0.064 ± 0.111 b2.53 ± 0.29 ab0.281 ± 0.058 a0.285 ± 0.042 b5.38 ± 0.26 b
AC4.64 ± 0.44 b0.082 ± 0.022 ab2.33 ± 0.23 b0.408 ± 0.111 a0.161 ± 0.054 b3.22 ± 0.17 c
Year (Y)
20196.88 ± 0.58 a0.233 ± 0.004 b2.98 ± 0.30 a0.436 ± 0.079 a0.340 ± 0.037 a5.47 ± 0.52 a
20205.12 ± 0.27 b0.127 ± 0.009 a1.97 ± 0.11 b0.348 ± 0.067 a0.360 ± 0.026 a4.07 ± 0.20 b
20216.26 ± 0.24 a0.078 ± 0.007 c2.23 ± 0.18 b0.343 ± 0.059 a0.276 ± 0.036 b5.28 ± 0.38 a
Significance 1
F*******NS******
Y*********NS*****
F × Y*******NS*****
1 NS, *, **, and ***, not significant or significant at p ≤ 0.05, 0.01, and 0.001, respectively.
Table 6. Correlations among the main analyzed parameters during the three-year study.
Year 2019 Year 2020 Year 2021
rs 1 rs 1 rs 1
BWTLA−0.111NSBWTLA0.585****BWTLA0.054NS
BWSSC−0.749****BWSSC−0.198NSBWSSC−0.615****
BWpH−0.551****BWpH−0.475**BWpH0.226NS
BWGLU−0.421NSBWGLU−0.112NSBWGLU−0.051NS
BWCIT−0.359NSBWCIT0.001NSBWCIT−0.650***
BWANT −0.555**BWANT −0.427NSBWANT −0.216NS
SSCpH0.546****SSCpH0.620****SSCpH−0.252NS
SSCTA0.180NSSSCTA−0.368*SSCTA0.327NS
SSCMAL−0.386NSSSCMAL−0.497*SSCMAL0.642***
SSCGLU0.390NSSSCGLU0.206NSSSCGLU0.688****
SSCCIT0.373NSSSCCIT0.718****SSCCIT0.860****
SSCTAR0.394NSSSCTAR−0.683****SSCTAR−0.374NS
SSCTPO0.320NSSSCTPO0.864****SSCTPO0.791****
pHMAL−0.017NSpHMAL0.197**pHMAL−0.064NS
pHGLU−0.010NSpHGLU−0.188**pHGLU−0.209NS
pHCIT0.464*pHCIT0.600**pHCIT0.090NS
pHTAR0.607**pHTAR−0.644***pHTAR−0.239NS
pHTPO0.450*pHTPO0.628***pHTPO0.024NS
TACIT0.672****TACIT−0.102NSTACIT0.150NS
TATAR0.686****TATAR0.255NSTATAR0.718****
TATPO0.760****TATPO−0.329NSTATPO−0.253NS
MALGLU−0.021NSMALGLU−0.267NSMALGLU0.888****
MALCIT0.551**MALCIT−0.001NSMALCIT0.494*
MALTAR0.386NSMALTAR−0.030NSMALTAR−0.718****
MALTPO0.429NSMALTPO−0.301NSMALTPO0.572**
GLUCIT0.257NSGLUCIT0.432NSGLUCIT0.596**
GLUTAR0.374NSGLUTAR0.028NSGLUTAR−0.579**
GLUTPO0.561**GLUTPO0.391NSGLUTPO0.534**
CITTAR0.943****CITTAR−0.658***CITTAR−0.118NS
CITTPO0.946****CITTPO0.851****CITTPO0.741****
TARTPO0.942****TARTPO−0.582**TARTPO−0.338NS
1 NS,*, **, ***, ****: non-significant or significant at p ≤ 0.1, 0.05, 0.02, 0.01, respectively.
Publisher’s Note: MDPI stays neutral with regard to jurisdictional claims in published maps and institutional affiliations.

