Article

Whole-Canopy Photosynthetic Characterization of Apple Tree and the Effects Induced by Grafting on Rootstocks with Different Vigor

1
College of Horticulture, China Agricultural University, Beijing 100193, China
2
Key Laboratory of Stress Physiology and Molecular Biology for Fruit Trees in Beijing Municipality, China Agricultural University, Beijing 100193, China
*
Author to whom correspondence should be addressed.
These authors contributed equally to this work.
Horticulturae 2022, 8(9), 816; https://doi.org/10.3390/horticulturae8090816
Submission received: 23 July 2022 / Revised: 18 August 2022 / Accepted: 2 September 2022 / Published: 6 September 2022
(This article belongs to the Section Fruit Production Systems)

Abstract

:
Leaf photosynthesis is pivotal for the synthesis of carbohydrates; however, the growth and development of horticultural crops are more closely related to canopy photosynthetic capacity. Measurements of canopy photosynthesis allow a better evaluation of the fruit tree performance at the canopy scale. Therefore, an open chamber system to determine instantaneous canopy apparent photosynthesis (CAPi) was investigated. CAPi slightly overestimated the biomass accumulation by 5.9%, which revealed that the CAPi method is valuable for quantifying canopy photosynthesis. Further, many woody horticultural plants are usually grafted for propagation, such as apples, whereas the rootstocks always influence the canopy size and photosynthesis. In this study, the effect of dwarfing, semi-dwarfing, and vigorous apple rootstocks on canopy photosynthesis was studied. Compared to vigorous rootstock, dwarfing rootstock significantly reduced the leaf net photosynthetic rate and total leaf area by 20.8% and 53.1%, respectively, and resulted in a 59.7% reduction in CAPi. Throughout the study, CAPi was an effective method that should be considered for canopy photosynthesis measurement of horticultural crops in the future.

1. Introduction

Canopy photosynthesis highly depends on the photosynthetic capacity of leaves, which is affected by the interaction among various internal and external elements. A leaf serves as a specialized organ for photosynthesis [1], and the loosely stacked leaves compose the principal canopy volume [2]. The spatial distribution of leaves in the canopy has noticeable impacts on leaf age [3], physiology, and anatomical traits [4]. The structure of the canopy modifies its microenvironment conditions [5], such as photosynthetic photon flux density (PPFD) [6], temperature [7] and humidity [8]. Furthermore, in some woody plants, fruits [9], stems [10], and flowers [11] perform photosynthesis or respiration as well. Thus, the whole plant’s photosynthetic capacity is a comprehensive characteristic including the performance of various organs in different orientations [12].
Dwarfing and vigorous rootstocks have crucial effects on apple tree performance, as indicated by the modified canopy structure and photosynthesis. The application of dwarfing rootstock has a significant constraint on tree vigor and canopy size [13]. The growth of grafted trees is primarily dependent on photosynthesis, which may vary with the combinations of different scions and rootstocks [14]. It has been reported that apple scions which have been grafted on dwarfing rootstocks had lower leaf photosynthesis than those on vigorous rootstocks [15,16]. Physiological processes driven by leaf fluxes have been demonstrated to scale to the canopy [17]. Hence, the corresponding leaf-related patterns may be observed on the canopy level. Whole-canopy photosynthetic assimilations of apple trees grafted on various rootstocks were modeled before. Zhou et al. [18] elucidated that photosynthesis at the canopy and leaf level have similar variation tendencies among different grafted combinations. Given the significance of canopy photosynthesis and the limited research on rootstocks, accurate measurement based on gas exchange data appears to be particularly important.
Efforts aimed at measuring whole-canopy photosynthesis have been initiated, and improvements in measurement accuracy are underway. In earlier studies, closed chamber systems were used to calculate photosynthesis [19], whereas continuous photosynthesis may have generated a decrease in CO2, which deviated from the chamber background concentration and caused a bias error [20]. Subsequently, semi-closed chamber systems were proposed to be an alternative solution. CO2 was delivered or removed to maintain a relatively constant CO2 atmosphere within the semi-closed chamber. However, it also failed to amend the insensitivity of transient and short-term fluctuation, as existed in closed chamber systems [21]. Open chamber systems relatively coupled the external environment and the plants in chambers. Canopy photosynthesis was assessed by sampling the airflow rate through a chamber, and CO2 concentration differences between the inlet and outlet of the chamber. An open chamber system was applied to monitor canopy photosynthesis on annual wheat [22], and the subsequent calculation of canopy photosynthesis was based on the covered area of the growth chamber. This method is more suitable for the determination of small crops, and imposes restrictions on planting density. The gas exchange characteristics of a single plant would put forward a promising solution for the determination of canopy photosynthesis in perennial fruit trees. A gas exchange system has been gradually applied to explore the influence of plant and external factors on apple tree canopy carbon assimilation. The canopy net carbon exchange rate of ‘Empire’/M.9 has been explored in polyester plastic chambers [23]. Untiedt and Blanke measured canopy photosynthesis by putting the apple tree in transparent polyethylene film sacks [24]. Validation tests based on growth data are required to ensure the accuracy of canopy photosynthesis measurement systems, but there is a lack of apple tree whole-canopy measurements that were previously reported. Furthermore, in apple cultivation, rootstocks greatly affect plant growth, which is potentially induced by altered canopy level photosynthesis, but few reports mentioned this aspect. Hence, the objectives of the present study were to verify the accuracy of the open chamber system in the determination of canopy photosynthesis of apple plants; and then, to explore the influence of apple rootstocks of different vigor on apple-canopy-level photosynthesis.

2. Materials and Methods

2.1. Plant Materials and Culture Conditions

One-year-old M.9 rootstocks (Table 1) were grown in pots filled with a mixed substrate of peat and vermiculite (1:1, v/v), and were cultured in a greenhouse at China Agricultural University, Beijing, China (40°0′37″ N, 116°21′56″ E, elevation 44 m). A photoperiod of 14 h/10 h (day/night) was set with the fixed artificial PPFD of 1000 µmol photon m−2 s−1 at the canopy top during the day. The artificial radiation was supplied by light-emitting diode (LED) lights. The equipped fan-pad evaporative cooling system of the greenhouse was operated to simulate the mean air temperature (24–31 °C) and relative humidity (about 84%) throughout the day in the field. To fully accommodate the environment mentioned above for photosynthetic accumulation, the M.9 clones were prepared in May 2021 and were cultured in a controlled environment until an experiment that lasted for 30 days was conducted on 1 July 2021. Growth and photosynthetic parameters were measured on 16 well-grown apple clones with a completely randomized design.
Three-year-old apple trees (Malus domestica Borkh. cv. Red Fuji) grafted onto vigorous rootstock, Baleng; semi-dwarfing rootstock, Chistock-1 and M.26; and dwarfing rootstock, M.9 (Table 1) were transplanted into pots filled with a mixed substrate of vermiculite and peat soil (1:1, v/v), and were cultured under the same greenhouse management conditions mentioned above. The mean air temperature was maintained at 18–27 °C, and the relative humidity was about 66% throughout the day. Experimental parameters were determined from 17 May 2021 to 13 June 2021. A randomized block design was performed with four plots and at least two replicates for each grafted combination per plot. Hereafter, each scion–rootstock combination will be referred to by the rootstock names.

2.2. Growth Parameters

M.9 clones were grown in the controlled environment for 30 days, and the growth parameters were measured on Day 0 and Day 30 with three replications per measurement. M.9 clones were harvested and separated into leaves, stems, and roots, and, subsequently, were washed thoroughly with distilled water. The fresh mass of samples was separately weighed using an analytical balance (FA2204E, Xingyun, Changzhou, Jiangsu, China) after blotting excess moisture. The dry mass of samples was separately determined after drying at 80 °C to constant mass. The whole plant water content (%) was calculated as plant water content = (fresh mass − dry mass)/fresh mass, where the fresh mass and dry mass represent the weight (g) of the fresh and dry tissue sample, respectively. The images of leaves on a whole plant were separately scanned by a camera, and were subsequently analyzed by ImageJ software (1.51J8, Bethesda, MD, USA) to evaluate the leaf area [25]. The total leaf area was the sum of individual leaf areas.
Morphological parameters and the soil–plant analysis development (SPAD) value of each scion-rootstock combination were measured. The total leaf area was obtained as described above. The plant height and canopy width along east–west and north–south directions were determined using a tape measure. The average canopy width was the average canopy width measured along east–west and north–south directions. The SPAD values of scion leaves were determined by the SPAD chlorophyll meter (502, Minolta, Osaka, Japan).

2.3. Leaf Photosynthetic Characterizations

The photosynthetic characteristics of functional leaves on three M.9 clones were monitored throughout the day. The leaf net photosynthetic rate (PN) and dark respiration rate (RD) were measured and recorded by the LI-6400XT portable photosynthesis system (Li-Cor, Lincoln, NE, USA), interfaced with a 2 cm × 3 cm 6400-02 B leaf chamber which provided a 1000-µmol photon m−2 s−1 artificial red/blue mixed LED light source. During the measurements, the leaf chamber conditions were controlled at constant: the sample chamber CO2 level of 400 μmol m−2 s−1 supplied by the CO2 mixer, the leaf-to-air vapor pressure deficit was around 1.3 kPa, the block temperature was controlled between 19.8 °C and 28.2 °C, and the flow rate was set at 500 μmol s−1.
The PN, intracellular CO2 concentration (Ci), transpiration rate (E), and stomatal conductance (gs) of the fully expanded scion leaf of at least eight trees in each scion-rootstock combination were measured from 08:00 to 17:00. The water-use efficiency (WUE) and leaf carboxylation efficiency (CE) of four grafted combinations were expressed as WUE = PN/E and CE = PN/Ci [16]. The stomatal threshold (LS) was calculated following LS = 1 − Ci/Ca [26], where Ca is the ambient CO2 concentration. The photosynthetic light response curves of four grafted combinations were measured on the same leaves after the gas exchange parameters had been determined. The measurements were conducted by an automatic program in LI-6400XT with a PPFD gradient of 2000, 1500, 1200, 1000; 500, 200, 100, 50, 20, and 0 μmol photon m−2 s−1. The parameters of the photosynthetic light response curves were generated using a ‘Photosyn Assistant’ program (Dundee Scientific, Dundee, UK). The non-rectangular hyperbola and its general equation described by Thornley [27] in Formula (1) were fitted via IBM SPSS Statistics (Version 25, SPSS, Chicago, IL, USA):
P N = φ   ×   PPFD + P Nmax ( φ   ×   PPFD + P Nmax ) 2   4   ×   θ   ×   φ   ×   PPFD   ×   P Nmax 2   ×   θ   R D
where PN is the leaf net photosynthetic rate (μmol CO2 m−2 s−1), PPFD is the photosynthetic photon flux density (µmol photon m−2 s−1), φ is the apparent quantum yield, PNmax is the light-saturated net photosynthetic rate (μmol CO2 m−2 s−1), θ is the curvature of the curve, and RD is the respiration rate (μmol CO2 m−2 s−1).

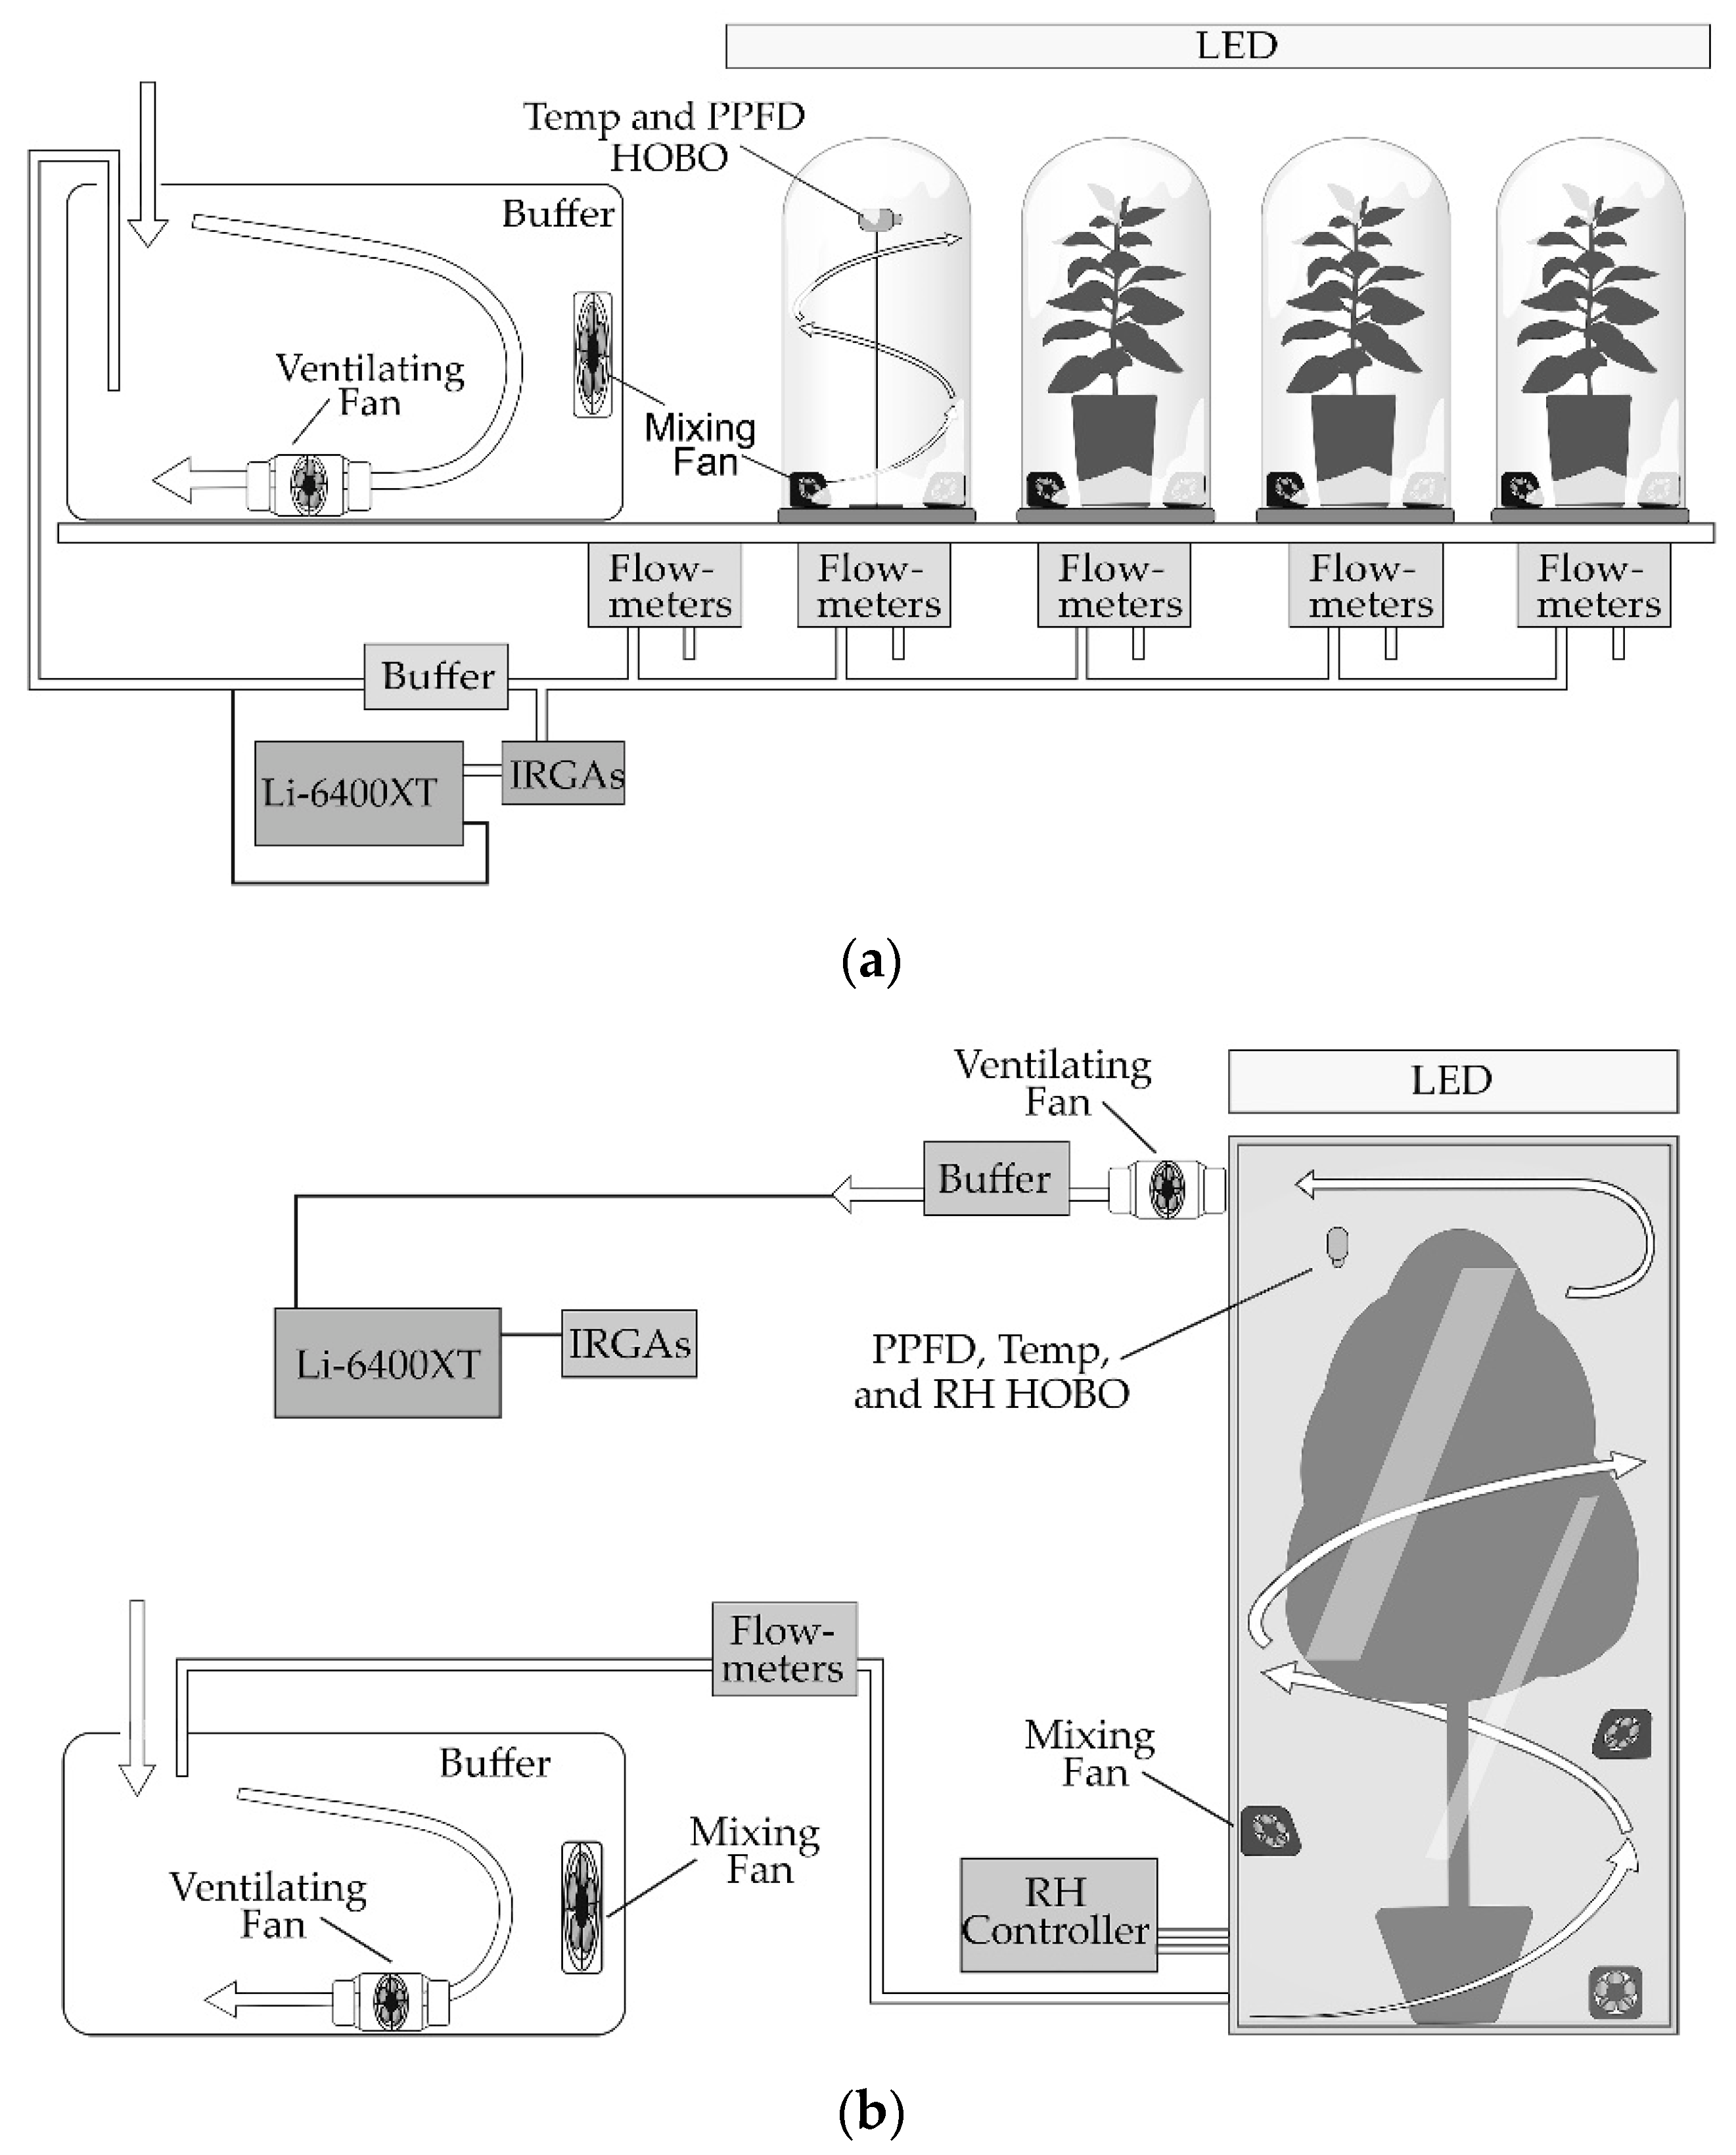
2.4. Canopy Photosynthetic Characterization

The instantaneous canopy apparent photosynthesis (CAPi) of M.9 clones was measured throughout the day in cylinder-shaped chambers (15.7 L) (Figure 1a). The ambient air was sucked into a gas-mixing device, and was fully blended by two fans installed reversely. The mixed air was shunted into transparent glass growth chambers. Adjustable fans were installed to provide appropriate wind speed around the canopy to eliminate boundary layer effects [26,28] and mix the gas sufficiently [22]. The water-sealed chamber bases ensured a gas tightness of chambers [29], and avoided potential CO2 contamination or leakage [30]. Artificial LED lighting sources were installed above chambers to provide 1000 µmol photon m−2 s−1 PPFD at the top of the canopy to avoid temperature rises in the chambers caused by the light source. One of the chambers was equipped with a HOBO data logger to monitor the photon flux density at the top of the canopy, and the other three chambers each contained a plant for measurement. The inlet flow rate of each chamber was controlled and recorded by a combination of a gas rotometer (LZB-3WB, Shuanghuan, Shiyan, Hubei, China) and electronic gas flowmeter (MF5706-25, Siargo, Santa Clara, CA, USA) to guarantee a decreased CO2 concentration of around 400 µmol mol−1 in each chamber. Parameters in formulas were recorded, and the values were then used to calculate CAPi. Based on the previous studies conducted on the open gas system [21,22], Formulas (3) and (4) were modified as follows:
PV = nRT
where P is the barometric pressure (Pa), V is the volume of gas (m3), n is the amount of substance of gas (mol), R is the universal gas constant (m3 Pa mol−1 K−l), and T is the absolute (K).
AIR flux = n   ×   AIR flow 60 V   × 10 3
where AIRflow is the flow rate (L min−1) measured by the flowmeter, and AIRflux is the flow rate (mol s−1) converted from AIRflow.
CAPi = (C0 − C1) × AIRflux
where CAPi is instantaneous canopy apparent photosynthesis (μmol s−1), C0 is the CO2 concentration (μmol mol−1) of air flow at the inlet of a chamber, and C1 is the CO2 concentration (μmol mol−1) of air flow at the outlet of the same chamber.
The daily accumulation of CAPi (μmol day−1) in M.9 clones is the integral of CAPi and time in a day. The daily accumulation of accumulated leaf photosynthesis (μmol CO2 day−1) was the integral of PN, total leaf area, and time in a day. The amount of substance of CO2 was converted to the amount of substance of C6H12O6, and then the corresponding mass was calculated.
For the scion-rootstock combinations, CAPi was measured as described above, in a chamber (1 × 1 × 2 m) (Figure 1b) from 08:00 to 17:00.

2.5. Statistical Analysis

Statistical analyses were performed using IBM SPSS Statistics (Version 25, SPSS, Chicago, IL, USA) and Origin software (2022, OriginLab, Northampton, MA, USA). The differences in growth parameters of M.9 on Day 0 and Day 30 were tested by the independent-samples t-test, and the ‘*’, ‘**’, and ‘ns’ indicated significance levels with p < 0.05, p < 0.01, and p ≥ 0.05, respectively. Photosynthesis variations among various time points of M.9 clones and the parameter differences among four apple scion-rootstock combinations were carried out using a one-way variance (ANOVA), and the significant difference was determined by the least significant difference (LSD) test with p < 0.05. Different letters after mean values ± standard error in the same column in Tables or above individual columns in Figures indicate the significant difference determined by the least significant difference (LSD) test with p < 0.05. The light response curves were analyzed via a non-rectangular hyperbola in IBM SPSS Statistics. The sssociations among the parameters of apple-scion–rootstock combinations were additionally assessed using Pearson’s two-tailed correlation. Principal component analysis (PCA) of grafted apple tree was conducted using Origin software. Figures were generated by Origin and Microsoft Excel (version 2020, Microsoft, Redmond, WA, USA).

3. Results

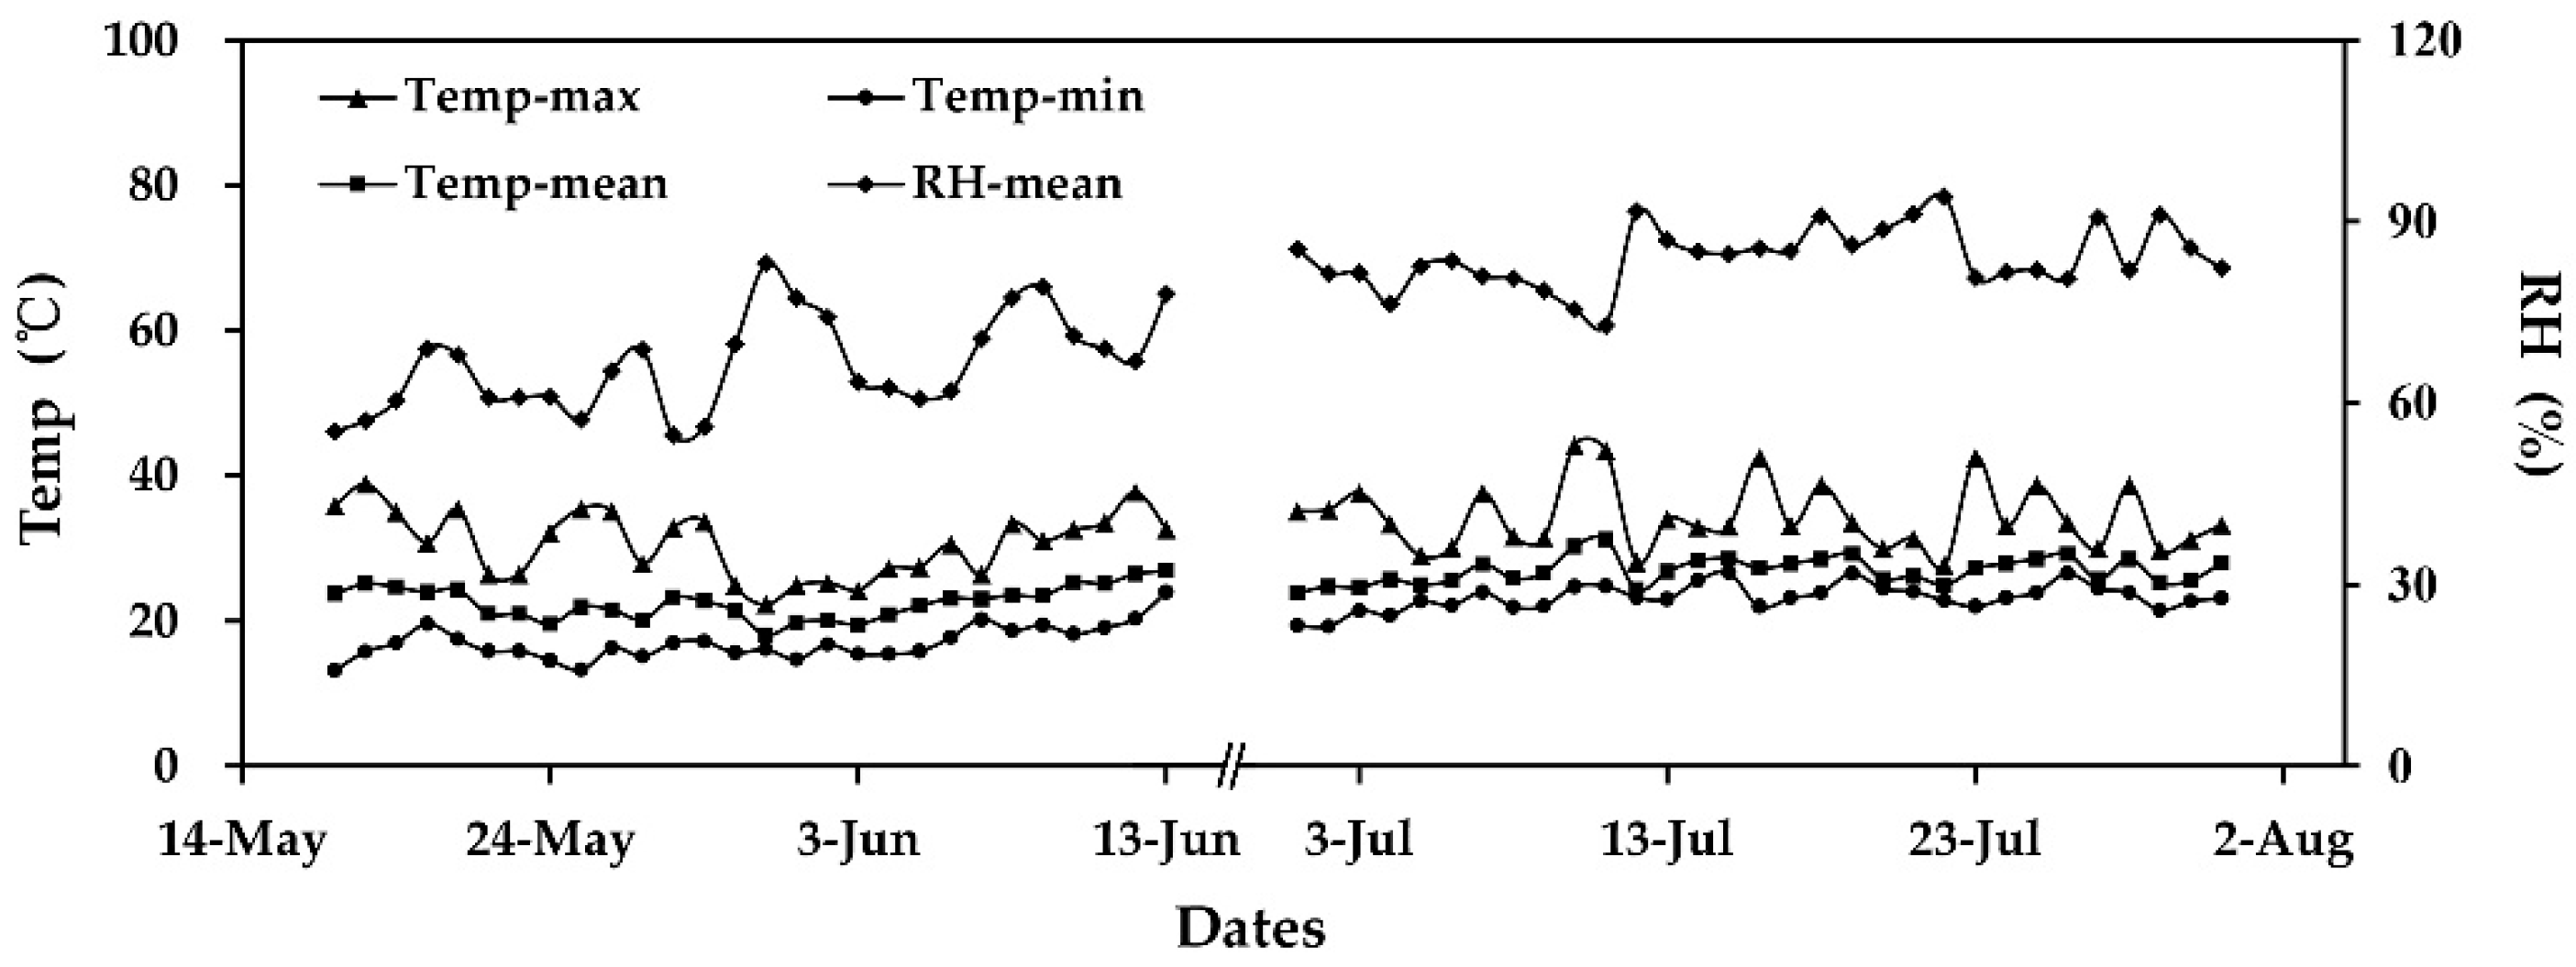
3.1. Environmental Condition

The air temperature and relative humidity were maintained at relatively stable levels during the measurements on scion-rootstock combinations and M.9 clones. The mean daily air temperatures were 22.5 °C and 26.9 °C. The mean daily air relative humidity during the measurement periods averaged 66.4% and 84.1% (Figure 2).

3.2. Photosynthate Accumulation of M.9 Clones Based on Leaf and Canopy Photosynthesis

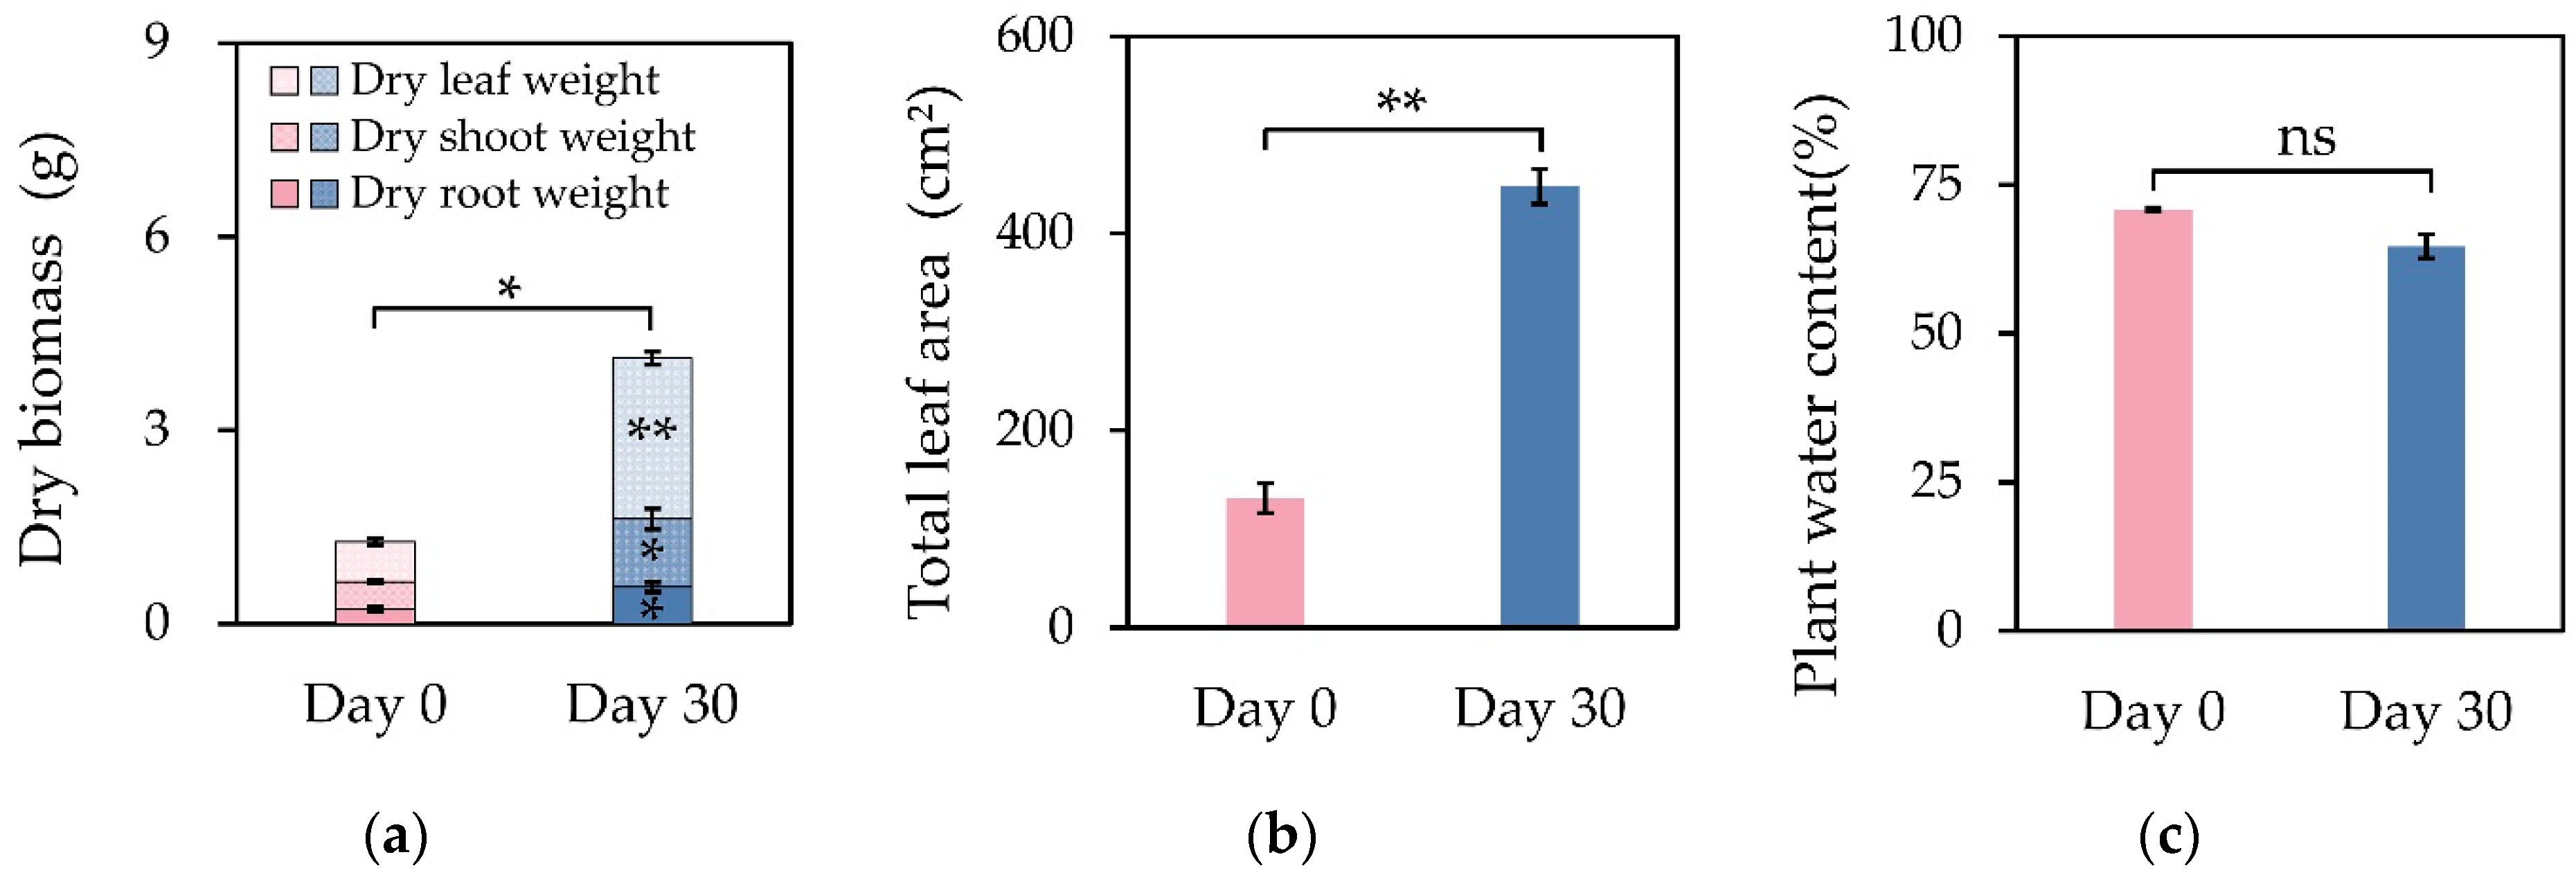
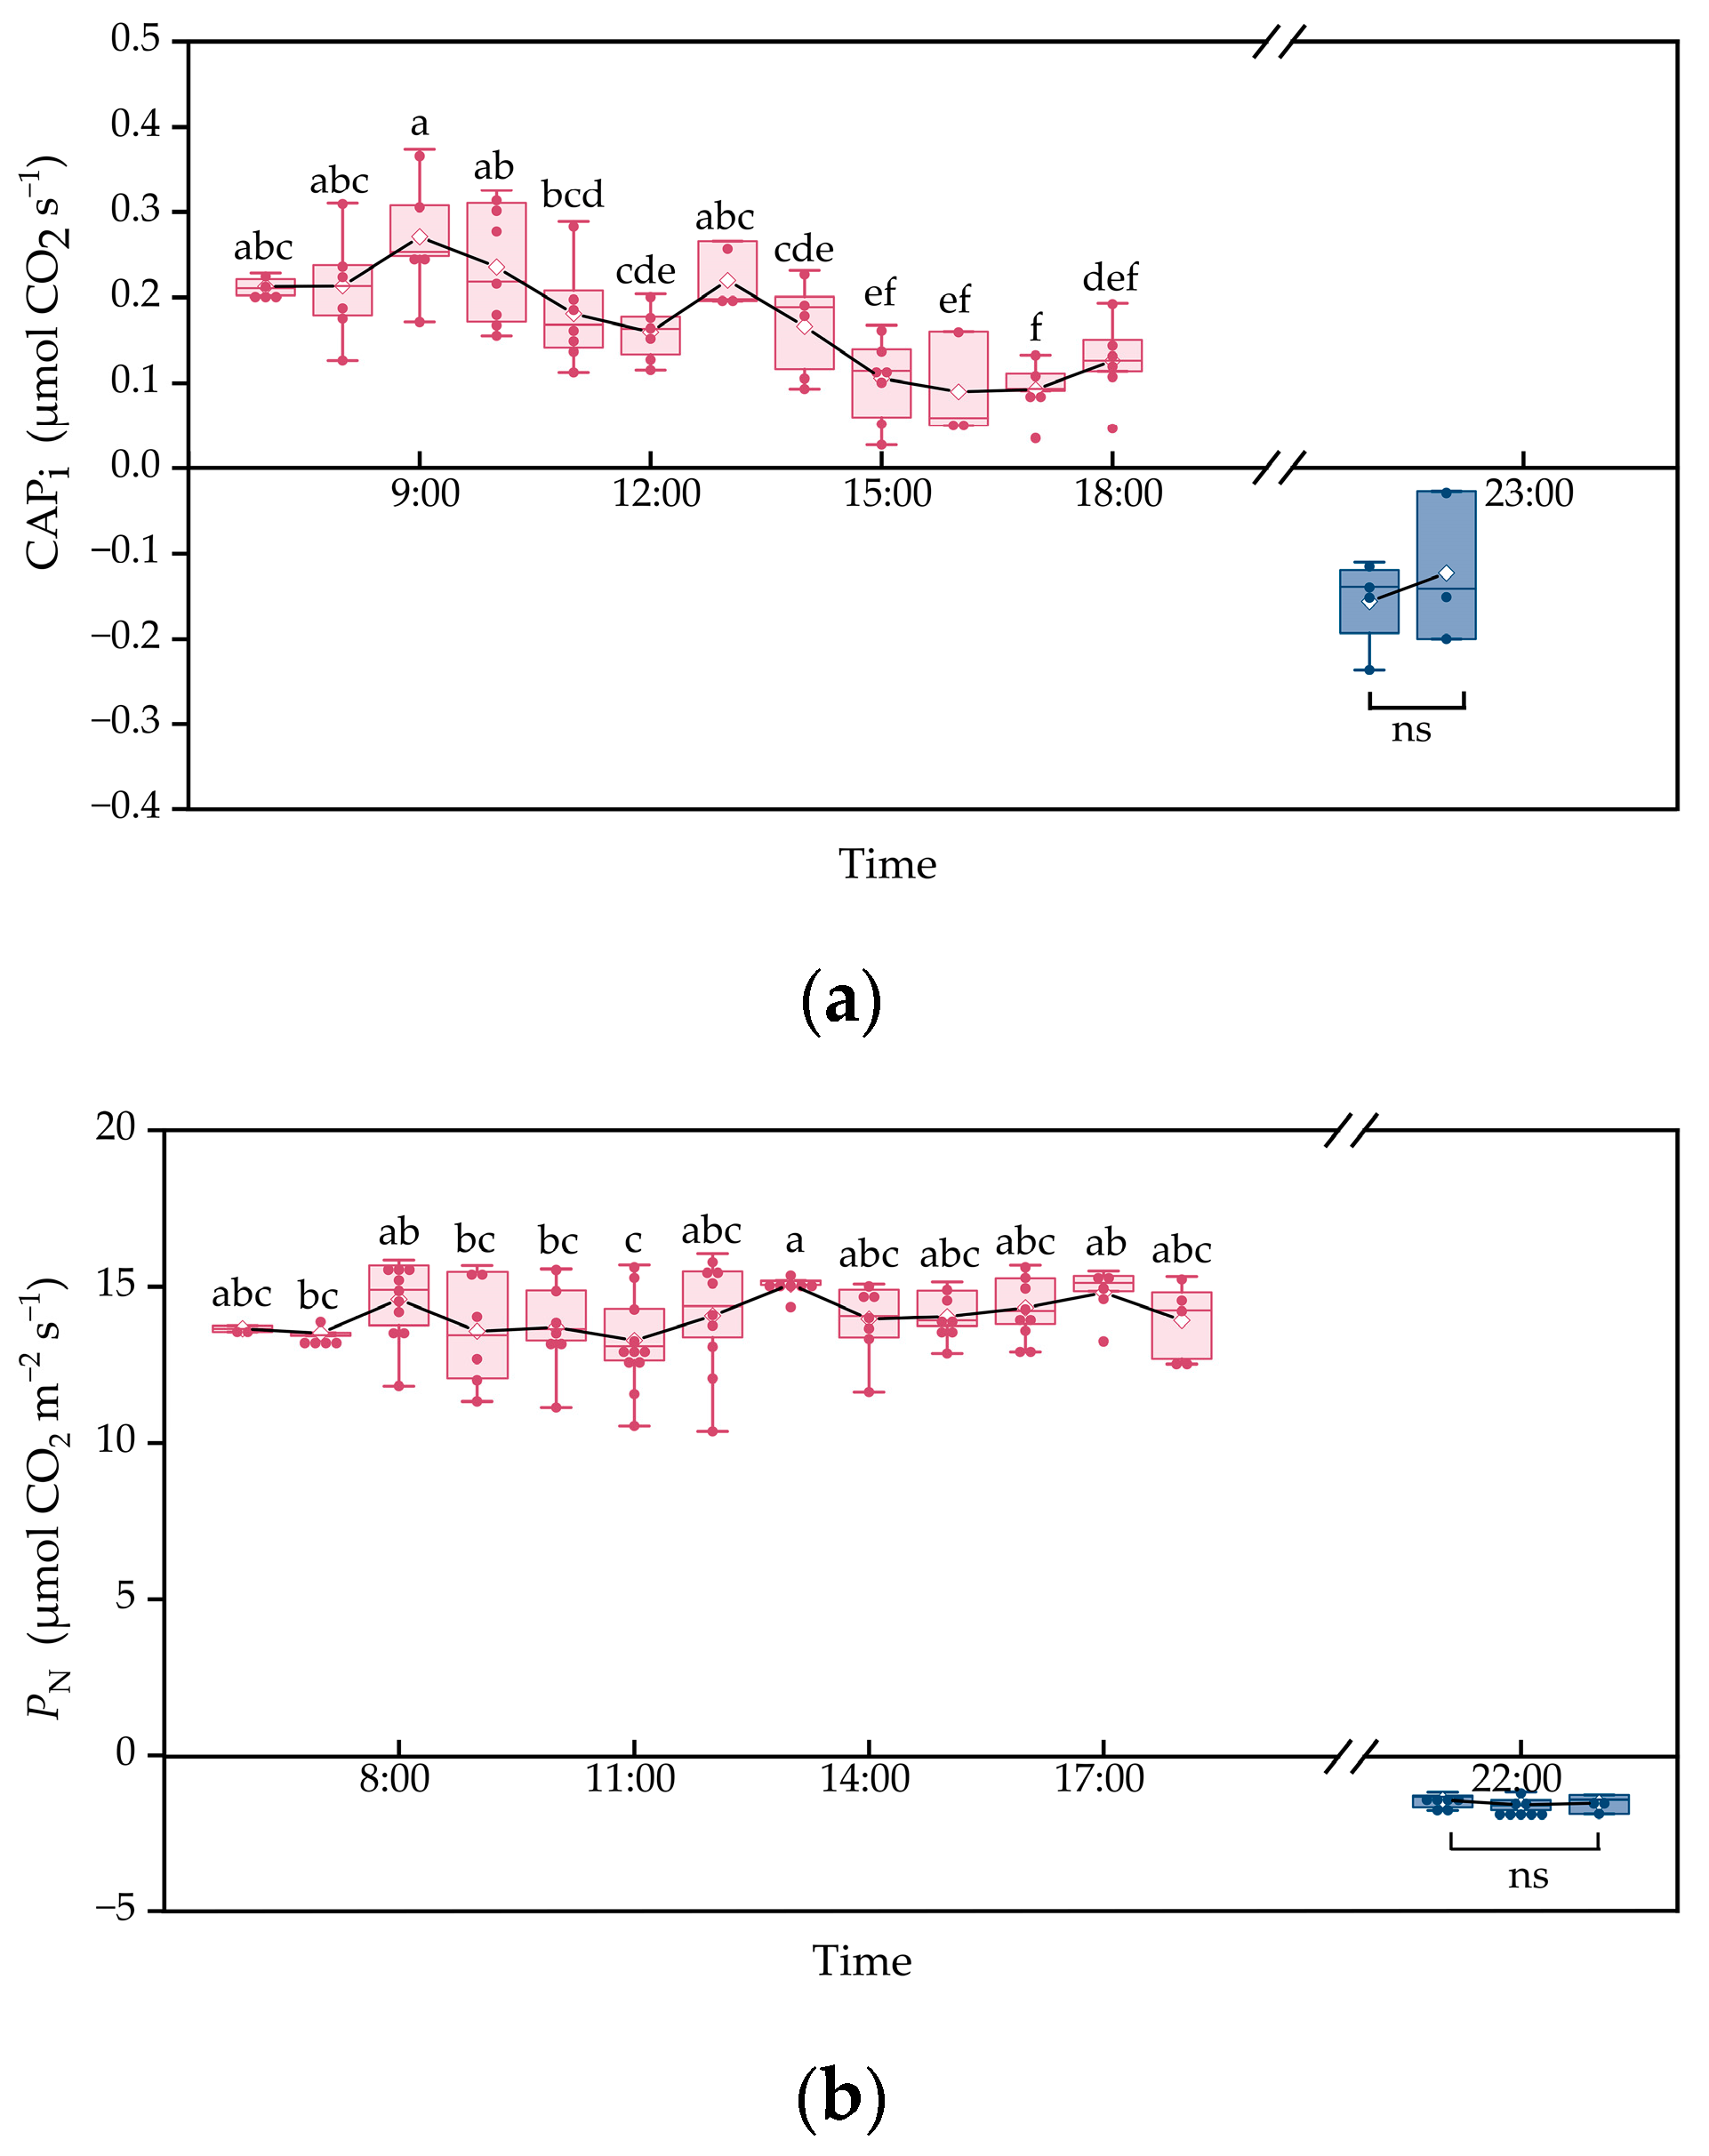
  • The dry mass and total leaf area of M.9 clones increased significantly within the 30 days, whereas the plant water content showed no evident change (Figure 3). The CAPi fluctuated over time throughout the day, with a variation of 201.8%, and peaked in the forenoon, with a value of 0.27 μmol CO2 s−1. During the night, the CAPi was maintained at around −0.14 μmol CO2 s−1 (Figure 4a). The PN of functional leaves varied 13.62 % throughout the day, and the respiration rates were about −1.47 μmol CO2 m−2 s−1 during the night (Figure 4b). Compared to the gained dry mass of 2.85 g per plant, the simulated photosynthate based on accumulated leaf photosynthesis was 20.39 g per plant, 231.7 times higher than that simulated by CAPi (3.02 g).

3.3. Leaf and Canopy Photosynthetic Parameters of Scions Influenced by Rootstocks

The cv. Red Fuji was grafted on Baleng rootstock, with a superior height and larger canopy size, which were 30.3% and 59.7% higher than that of M.9, respectively. The total leaf area and SPAD induced by Baleng were significantly higher than M.26 and M.9, but no significant difference was found between Baleng and Chistock-1 (Table 2). The application of dwarfing rootstock showed parallel decreases in CAPi and PN both in the morning and afternoon (Figure 5). In the morning, the CAPi on dwarfing rootstock, M.9, and semi-dwarfing rootstock, M.26, were significantly lower than those on vigorous rootstock Baleng, whereas no significant difference was observed on Baleng and Chistock-1. There was no significant difference in CAPi between Baleng and Chistock-1 both in the morning and the afternoon. In the afternoon, the PN (6.8–14.8%) and CAPi (30.7–44.5%) of four rootstocks were significantly reduced. In the afternoon, scion leaves on M.9 had significantly higher leaf WUE and LS than those on semi-dwarfing and vigorous rootstocks (Figure 6d,f). An analysis of photosynthetic light response curves, as indicated in Figure 7 and Table 3, illustrated that among scion–rootstock combinations, higher maximum net CO2 assimilation rate (PNmax) were recorded on Baleng than M.26 and M.9 with a value of 18.5 μmol photon m−2 s−1, whereas the difference of LSP was not significant. The results presented in Figure 6 indicated that scion leaves grafted on vigorous rootstock, Baleng, had higher gs, E, and CE than M.9. Additionally, higher WUE and LS were found in leaves grafted on the dwarfing rootstock M.9 in the afternoon.
  • Figure 8a visualized the correlation matrix of plant growth and photosynthetic parameters via a correlation heat map. CAPi was positively correlated with gs (r = 0.965, p = 0.044, two-tailed), PN (r = 0.988, p = 0.012, two-tailed), total leaf area (r = 0.972, p = 0.028, two-tailed), and canopy width (r = 0.999, p = 0.001, two-tailed). PN was positively correlated with gs (r = 0.962, p = 0.038, two-tailed), E (r = 0.960, p = 0.040, two-tailed), CE (r = 0.935, p = 0.047, two-tailed), CAPi (r = 0.988, p = 0.012, two-tailed), total leaf area (r = 0.966, p = 0.034, two-tailed), and canopy width (r = 0.986, p = 0.033, two-tailed). According to PCA in Figure 8b, two main comprehensive evaluation factors accounting for 85.3% variation were extracted, including PN, gs, E, total leaf area, and canopy width in PC1, which explained 69% of the total variation, and CAPi, CE, LS, Ci, WUE and plant height in PC2, which explained the 16.3% of the total variation.

4. Discussion

The accumulated photosynthate calculated by CAPi largely reflected the actual biomass accumulation. A significant increase in dry mass and total leaf area, as well as the stable leaf water content (Figure 3), indicated the steady growth of M.9 clones in this experiment. Plant photosynthetic capacity varies with daily fluctuation of environmental factors such as temperature, air vapor pressure deficit (VPD), and PPFD throughout the day [31,32,33]. It was measured that the diurnal fluctuation of CAPi (201.8%) was much wider than that of PN (13.62%) (Figure 3). In the case of the same total leaf area and uniform illumination, the difference may be explained by the different photosynthesis in leaves of various positions or leaf ages [34]. In actively growing plants, photosynthetic apparatus harvest solar energy incorporates CO2 into carbon, ultimately increasing the biomass production of plants [35]. To explore the authenticity of accumulated CAPi for simulated biomass gain, corresponding comparisons were processed. A growth chamber system for the measurements of gas exchange at the canopy scale was applied to soybeans in 2017, and overestimated total carbon uptake by 7.6% [30], whereas CAPi measured in the open chamber system well simulated canopy photosynthesis with only 5.9% overestimation. The above results emphasized the significance of canopy level photosynthesis in performing photosynthetic assessments. As the application of rootstocks altered the production and allocation of carbohydrates, more accurate verification based on carbon content is worth further exploration. Although the precision of CAPi is expected to be perfected by methods such as taking the photosynthesized carbon released into the soil via root and mycorrhizal fungi into account [36], it can still be regarded as a low-cost and promising modeling method.
The less developed canopy and limited leaf photosynthesis jointly accounted for the constrained canopy photosynthesis on dwarfing rootstock. As CAPi was significantly correlated with total leaf area (r = 0.972, p = 0.028, two-tailed) (Figure 8a), compared to scions on vigorous rootstocks, the limited leaf area of scions on dwarfing apple trees may produce less photoassimilate [37]. Hence, the plant height and canopy width of apple trees grafted on Baleng were 30.3% and 59.7% greater than that on M.9 (Table 2). The greater canopy on Baleng potentially induced a much lower temperature and light interception on shaded leaves, subsequently affecting the related biochemical processes and assimilate distribution [34]. Previous studies showed that scion leaf photosynthesis was affected by rootstocks [38]. As indicated by PCA (Figure 8b), the PC1, with an explained variation of 69%, mainly characterized the capacity for photosynthesis and vigorous growth. The sequence of M.9, M.26, Chistock-1, and Baleng, along the PC1 direction, also showed the increased photosynthetic capacity with the vigor of rootstocks. The SPAD values of Baleng and Chistock-1 were 1.13 and 1.24 times greater than M.9, indicating greater capacities to absorb, transmit, and utilize solar energy [18]. Our results were in agreement with the previous findings that scion leaves grafted on apple dwarfing rootstocks inhibited photosynthesis [15]. The reduced Ci caused by lower gs may explain the inhibited PN and elevated WUE in M.9 [32]. The lower CE relevant to Rubisco activity [39] potentially resulted from the lower chlorophyll content [40], and repressed PN in M.9 leaves. Compared with dwarfing trees, higher gs of scion leaves induced by grafting on Baleng promoted CO2 diffusion inside the leaf, and significantly increased Ci. Moreover, a more efficient leaf carboxylation rate of Baleng further up-regulated PN. The results above seemed to reveal the difference in PN induced by rootstocks, which may be explained by the integrative effects of light capture, gas exchange, and photosynthetic enzyme activity at the leaf level. Canopy photosynthesis constituted by the photosynthetic rate of single leaves furtherly affects productivity [41]. Grafting Baleng on apple trees increased total leaf area while enhancing PN, which, in turn, could collectively contribute to higher CAPi. Higher photosynthesis on Baleng is beneficial for the synthesis of carbohydrates and their subsequent allocation to roots. The promoted roots system development thereafter facilitated nutrient and water acquisition, which plays a key role for apple plants to face environmental stress. The smaller effective photosynthetic area potentially constrained by total area for light harvest and the lower photosynthetic capacity per unit leaf area (Figure 6b) may give an integrated interpretation of the reduced CAPi in dwarfing rootstock.
The canopy complexity and heterogeneity triggered by apple rootstocks gave priority to quantifying photosynthetic variation more accurately by CAPi rather than PN. Differing from cereal crops such as rice and corn, the apple tree has a more complex canopy, including leaves, branches, and fruits [42]. Compared to the morning, CAPi declines more severely than PN among four grafted combinations in the afternoon, which may be explained by the greater leaf physiological status switch of old leaves [43]. Compared to vigorous rootstock, dwarfing rootstock significantly reduced CAPi and PN by 59.7% and 20.8%. There were multiple aspects that induced these phenomena. On the one hand, the PN was determined only by functional leaves, which resulted in a portion of photosynthesis that cannot be reflected by PN, whereas CAPi compensated for this deficiency greatly. On the other hand, leaf photosynthetic characteristics were affected by leaf age [34], spatial position within the canopy [44], and environmental factors [12]. Canopy structure and spatial position of leaves influenced the leaf microenvironment and further induced variations in leaf physiological properties [44,45]. There also exists an underlying possibility of CO2 exchange in the non-leaf organs of some plants. The branches of some woody plants were evidenced to have photosynthetic capacities [10]. Additionally, several fruits, such as apple [46], peach [47], and citrus [9], could perform photosynthesis and respiration. A very limited study of CAPi was performed on rootstock-influenced apple trees, which emphasized the necessity of evaluating photosynthetic characterization at the canopy scale. Moreover, under abiotic or biological stresses, plants may exhibit symptoms of puckered, malformed, and even cracked leaves [48], which are impossible to perform leaf gas exchange measurements and photosynthetic evaluation from. Consequently, CAPi could serve as an effective tool, coupling with phenotypic analysis, for research on perennial fruit trees under various stresses.

5. Conclusions

Instantaneous canopy apparent photosynthesis (CAPi) was proven as a reliable methodology to determine photosynthesis at the canopy scale validation with biomass. In contrast to vigorous and semi-dwarfing rootstocks, the application of dwarfing rootstock generated a remarkable reduction in CAPi, which mainly results from the smaller canopy size and lower leaf photosynthesis capacity. Light capture, gas exchange, and photosynthetic enzyme activity resulted in constrained leaf photosynthesis comprehensively. The rootstock-induced canopy microenvironment and leaf physiological variation gave CAPi superiority over PN in the photosynthetic evaluation, especially for apple trees grafted on vigorous rootstock. CAPi proved to be promising in future research on whole-canopy photosynthetic phenotyping.

Author Contributions

Conceptualization, C.Q.; methodology, C.Q. and Z.H.; software, Z.Z.; validation, X.Z. (Xi Zhang) and Q.Q.; formal analysis, P.G.; investigation, G.J.; resources, X.Z. (Xinzhong Zhang); data curation, M.L. and Z.Z.; writing—original draft preparation, M.L.; writing—review and editing, M.L. and Z.Z.; visualization, P.G.; supervision, G.J.; project administration, X.X. and W.L.; funding acquisition, C.Q. and Z.H. All authors have read and agreed to the published version of the manuscript.

Funding

This research was funded by the National Key Research and Development Program of China (Grant No. 2019YFD1000103), the National Natural Science Foundation of China (Grant No. 31801810), the Modern Agricultural Industry Technology System (Grant No. CARS-27), the Key Laboratory of Biology and Genetic Improvement of Horticultural Crops (Nutrition and Physiology) Ministry of Agriculture, P.R. China and the 2115 Talent Development Program of China Agricultural University, and The Construction of Beijing Science and Technology Innovation and Service Capacity in Top Subjects (Grant No. PXM2019_014207_000032).

Data Availability Statement

Data is contained within the article.

Conflicts of Interest

The authors declare no conflict of interest.

References

  1. Brazel, A.J.; O’Maoileidigh, D.S. Photosynthetic activity of reproductive organs. J. Exp. Bot. 2019, 70, 1737–1754. [Google Scholar] [CrossRef] [PubMed]
  2. Sun, G.X.; Wang, X.C.; Ding, Y.Q.; Lu, W.; Sun, Y. Remote Measurement of Apple Orchard Canopy Information Using Unmanned Aerial Vehicle Photogrammetry. Agronomy 2019, 9, 774. [Google Scholar] [CrossRef]
  3. Matloobi, M.; Ebrahimzadeh, A.; Khaligi, A.; Hasandokht, M. Training system affects whole canopy photosynthesis of the greenhouse roses (Rosa hybrida ‘Habari’). J. Food Agric. Environ. 2009, 7, 114–117. [Google Scholar]
  4. Sellin, A.; Taneda, H.; Alber, M. Leaf structural and hydraulic adjustment with respect to air humidity and canopy position in silver birch (Betula pendula). J. Plant Res. 2019, 132, 369–381. [Google Scholar] [CrossRef] [PubMed]
  5. Campbell, G.S.; Norman, J.M. The description and measurement of plant canopy structure. In Plant Canopies: Their Growth, Form, and Function; Marshall, B., Jarvis, P.G., Eds.; Cambridge University Press: Cambridge, UK, 1989; pp. 1–20. [Google Scholar]
  6. Zhang, L.X.; Guo, Q.S.; Chang, Q.S.; Zhu, Z.B.; Liu, L.; Chen, Y.H. Chloroplast ultrastructure, photosynthesis and accumulation of secondary metabolites in Glechoma longituba in response to irradiance. Photosynthetica 2015, 53, 144–153. [Google Scholar] [CrossRef]
  7. Ge, Z.M.; Zhou, X.; Kellomäki, S.; Wang, K.Y.; Peltola, H.; Martikainen, P.J. Responses of leaf photosynthesis, pigments and chlorophyll fluorescence within canopy position in a boreal grass (Phalaris arundinacea L.) to elevated temperature and CO2 under varying water regimes. Photosynthetica 2011, 49, 172–184. [Google Scholar] [CrossRef]
  8. Inoue, T.; Sunaga, M.; Ito, M.; Yuchen, Q.; Matsushima, Y.; Sakoda, K.; Yamori, W. Minimizing VPD Fluctuations Maintains Higher Stomatal Conductance and Photosynthesis, Resulting in Improvement of Plant Growth in Lettuce. Front. Plant Sci. 2021, 12, 646144. [Google Scholar] [CrossRef]
  9. Hiratsuka, S.; Suzuki, M.; Nishimura, H.; Nada, K. Fruit photosynthesis in Satsuma mandarin. Plant Sci. 2015, 241, 65–69. [Google Scholar] [CrossRef] [PubMed]
  10. Wilson, B.F. Apical control of branch growth and angle in woody plants. Am. J. Bot. 2000, 87, 601–607. [Google Scholar] [CrossRef] [PubMed]
  11. Vemmos, S.; Goldwin, G. The Photosynthetic Activity of Cox’s Orange Pippin Apple Flowers in Relation to Fruit Setting. Ann. Bot. 1994, 73, 385–391. [Google Scholar] [CrossRef]
  12. Prieto, J.A.; Louarn, G.; Perez Pena, J.; Ojeda, H.; Simonneau, T.; Lebon, E. A functional-structural plant model that simulates whole- canopy gas exchange of grapevine plants (Vitis vinifera L.) under different training systems. Ann. Bot. 2020, 126, 647–660. [Google Scholar] [CrossRef] [PubMed] [Green Version]
  13. Hayat, F.; Iqbal, S.; Coulibaly, D.; Razzaq, M.K.; Nawaz, M.A.; Jiang, W.; Shi, T.; Gao, Z. An insight into dwarfing mechanism: Contribution of scion-rootstock interactions toward fruit crop improvement. Fruit Res. 2021, 1, 1–11. [Google Scholar] [CrossRef]
  14. Bai, Y.; Zhang, J.; Wu, Y.; Huang, R.; Chang, Y.; Lei, X.; Song, X.; Pei, D. Possibility of Increasing the Growth and Photosynthetic Properties of Precocious Walnut by Grafting. Sustainability 2020, 12, 5178. [Google Scholar] [CrossRef]
  15. Sotiropoulos, Τ.E. Performance of the apple (Malus domestica Borkh) cultivar Imperial Double Red Delicious grafted on five rootstocks. Hortic. Sci. 2008, 35, 7–11. [Google Scholar] [CrossRef]
  16. Zhang, Z.; Li, M.; Yao, J.; Zhou, Y.; Wang, Y.; Zhang, X.; Li, W.; Wu, T.; Han, Z.; Xu, X.; et al. Root architecture characteristics of differing size-controlling rootstocks and the influence on the growth of ‘Red Fuji’ apple trees. Sci. Hortic. 2021, 281, 109959. [Google Scholar] [CrossRef]
  17. Bagley, J.; Rosenthal, D.M.; Ruiz-Vera, U.M.; Siebers, M.H.; Kumar, P.; Ort, D.R.; Bernacchi, C.J. The influence of photosynthetic acclimation to rising CO2 and warmer temperatures on leaf and canopy photosynthesis models. Glob. Biogeochem. 2015, 29, 194–206. [Google Scholar] [CrossRef]
  18. Zhou, Y.; Tian, X.; Yao, J.; Zhang, Z.; Wang, Y.; Zhang, X.; Li, W.; Wu, T.; Han, Z.; Xu, X.; et al. Morphological and photosynthetic responses differ among eight apple scion-rootstock combinations. Sci. Hortic. 2020, 261, 108981. [Google Scholar] [CrossRef]
  19. Grau, A. A closed chamber technique for field measurement of gas exchange of forage canopies. N. Z. J. Agric. Res. 2010, 38, 71–77. [Google Scholar] [CrossRef]
  20. Sinoquet, H.; Le Roux, X.; Adam, B.; Ameglio, T.; Daudet, F.A. RATP: A model for simulating the spatial distribution of radiation absorption, transpiration and photosynthesis within canopies: Application to an isolated tree crown. Plant Cell Environ. 2001, 24, 395–406. [Google Scholar] [CrossRef]
  21. Takahashi, N.; Ling, P.P.; Frantz, J.M. Considerations for Accurate Whole Plant Photosynthesis Measurement. Environ. Control Biol. 2008, 46, 91–101. [Google Scholar] [CrossRef]
  22. Song, Q.; Xiao, H.; Xiao, X.; Zhu, X.-G. A new canopy photosynthesis and transpiration measurement system (CAPTS) for canopy gas exchange research. Agric. For. Meteorol. 2016, 217, 101–107. [Google Scholar] [CrossRef]
  23. Li, K.-T.; Lakso, A.N.; Piccioni, R.; Robinson, T. Summer pruning reduces whole-canopy carbon fixation and transpiration in apple trees. J. Hortic. Sci. Biotechnol. 2003, 78, 749–754. [Google Scholar] [CrossRef]
  24. Untiedt, R.; Blanke, M.M. Effects of fungicide and insecticide mixtures on apple tree canopy photosynthesis, dark respiration and carbon economy. Crop Prot. 2004, 23, 1001–1006. [Google Scholar] [CrossRef]
  25. Li, P.; Weng, J.; Zhang, Q.; Yu, L.; Yao, Q.; Chang, L.; Niu, Q. Physiological and Biochemical Responses of Cucumis melo L. Chloroplasts to Low-Phosphate Stress. Front. Plant Sci. 2018, 9, 1525. [Google Scholar] [CrossRef]
  26. Wang, W.; Wang, C.; Pan, D.; Zhang, Y.; Luo, B.; Ji, J. Effects of drought stress on photosynthesis and chlorophyll fluorescence images of soybean (Glycine max) seedlings. Int. J. Agric. Biol. Eng. 2018, 11, 196–201. [Google Scholar] [CrossRef]
  27. Thornley, J.H.M. Dynamic Model of Leaf Photosynthesis with Acclimation to Light and Nitrogen. Ann. Bot. 1998, 81, 421–430. [Google Scholar] [CrossRef]
  28. Burgess, A.J.; Gibbs, J.A.; Murchie, E.H. A canopy conundrum: Can wind-induced movement help to increase crop productivity by relieving photosynthetic limitations? J. Exp. Bot. 2019, 70, 2371–2380. [Google Scholar] [CrossRef]
  29. Tang, Y.; Rosewarne, G.M.; Li, C.; Wu, X.; Yang, W.; Wu, C. Physiological Factors Underpinning Grain Yield Improvements of Synthetic-Derived Wheat in Southwestern China. Crop Prot. 2015, 55, 98–112. [Google Scholar] [CrossRef]
  30. Salvatori, N.; Giorgio, A.; Muller, O.; Rascher, U.; Peressotti, A. A low-cost automated growth chamber system for continuous measurements of gas exchange at canopy scale in dynamic conditions. Plant Methods 2021, 17, 69. [Google Scholar] [CrossRef]
  31. Singsaas, E.L.; Ort, D.R.; DeLucia, E.H. Diurnal regulation of photosynthesis in understory saplings. New Phytol. 2000, 145, 39–49. [Google Scholar] [CrossRef]
  32. Ribeiro, R.V.; Machado, E.C.; Santos, M.G.; Oliveira, R.F. Photosynthesis and water relations of well-watered orange plants as affected by winter and summer conditions. Photosynthetica 2009, 47, 215–222. [Google Scholar] [CrossRef]
  33. Klages, K.; Donnison, H.; Wünsche, J.; Boldingh, H. Diurnal changes in non-structural carbohydrates in leaves, phloem exudate and fruit in ‘Braeburn’ apple. Funct. Plant Biol. 2001, 28, 131–139. [Google Scholar] [CrossRef]
  34. Boonman, A.; Prinsen, E.; Gilmer, F.; Schurr, U.; Peeters, A.J.; Voesenek, L.A.; Pons, T.L. Cytokinin import rate as a signal for photosynthetic acclimation to canopy light gradients. Plant Physiol. 2007, 143, 1841–1852. [Google Scholar] [CrossRef] [PubMed]
  35. Wilson, R.; Whitney, S. Photosynthesis: Getting it together for CO2 fixation. Nat. Plants 2015, 1, 15130. [Google Scholar] [CrossRef] [PubMed]
  36. Kaiser, C.; Kilburn, M.R.; Clode, P.L.; Fuchslueger, L.; Koranda, M.; Cliff, J.B.; Solaiman, Z.M.; Murphy, D.V. Exploring the transfer of recent plant photosynthates to soil microbes: Mycorrhizal pathway vs direct root exudation. New Phytol. 2015, 205, 1537–1551. [Google Scholar] [CrossRef] [PubMed]
  37. Atkinson, C.; Else, M. Understanding how rootstocks dwarf fruit trees. Compact Fruit Tree 2001, 34, 46–49. [Google Scholar]
  38. Goncalves, B.; Moutinho-Pereira, J.; Santos, A.; Silva, A.P.; Bacelar, E.; Correia, C.; Rosa, E. Scion-rootstock interaction affects the physiology and fruit quality of sweet cherry. Tree Physiol. 2006, 26, 93–104. [Google Scholar] [CrossRef]
  39. Yang, W.J.; Chen, H.F.; Zhu, F.Y.; Hu, M.Q.; Jiang, D.A. Low concentration of bisulfite enhances photosynthesis in tea tree by promoting carboxylation efficiency in leaves. Photosynthetica 2008, 46, 615–617. [Google Scholar] [CrossRef]
  40. Lu, Z.; Pan, Y.; Hu, W.; Cong, R.; Ren, T.; Guo, S.; Lu, J. The photosynthetic and structural differences between leaves and siliques of Brassica napus exposed to potassium deficiency. BMC Plant Biol. 2017, 17, 240. [Google Scholar] [CrossRef]
  41. Long, S.P.; Farage, P.K.; Garcia, R.L. Measurement of leaf and canopy photosynthetic CO2 exchange in the field. J. Exp. Bot. 1996, 47, 1629–1642. [Google Scholar] [CrossRef]
  42. Ma, X.; Feng, J.; Guan, H.; Liu, G. Prediction of Chlorophyll Content in Different Light Areas of Apple Tree Canopies based on the Color Characteristics of 3D Reconstruction. Remote Sens. 2018, 10, 429. [Google Scholar] [CrossRef]
  43. Vu, J.C.V.; Newman, Y.C.; Allen, L.H.; Gallo-Meagher, M.; Zhang, M.Q. Photosynthetic acclimation of young sweet orange trees to elevated growth CO2 and temperature. Tree Physiol. 2002, 159, 147–157. [Google Scholar] [CrossRef]
  44. Dai, Y.; Dickinson, R.E.; Wang, Y.P. A Two-Big-Leaf Model for Canopy Temperature, Photosynthesis, and Stomatal Conductance. J. Clim. 2004, 17, 2281–2299. [Google Scholar] [CrossRef]
  45. Talwara, S.; Grout, B.W.W.; Toldam-Andersen, T.B. Leaf Micro-Environment Influences the Altered Foliar Phenotype of Columnar Apple (Malus × Domestica Borkh.) Trees. Acta Hortic. 2015, 1099, 835–841. [Google Scholar] [CrossRef]
  46. Blanke, M.M.; Lenz, F. Fruit photosynthesis. Plant Cell Environ. 1989, 12, 31–46. [Google Scholar] [CrossRef]
  47. DeJong, T.M.; Walton, E.F. Carbohydrate requirements of peach fruit growth and respiration. Tree Physiol. 1989, 5, 329–335. [Google Scholar] [CrossRef]
  48. Dikilitas, M.; Guldur, M.E.; Deryaoglu, A.; Erel, O. Antioxidant and Oxidant Levels of Pepper (Capsicum annuum cv. ‘Charlee’) Infected with Pepper Mild Mottle Virus. Not. Bot. Horti Agrobot. Cluj-Napoca 2011, 39, 58–63. [Google Scholar] [CrossRef] [Green Version]
Figure 1. The schematic diagrams of open chamber systems for CAPi measurement of M.9 clones (a), and apple scion-rootstock combinations (b).
Horticulturae 08 00816 g001
Figure 2. The daily air temperature (Temp) and relative humidity (RH) during the measurements. The Temp and RH during the measurements on scion-rootstock combinations from 17 May 2021 to 13 June 2021, and on M.9 clones from 1 July 2021 to 30 July 2021 were recorded, respectively. Four types of points represent the maximum air temperature (Temp-max), the minimum air temperature (Temp-min), the mean air temperature (Temp-mean), and the mean relative humidity (RH-mean) in a day. Jun, Jul, and Aug are abbreviations for June, July, and August, respectively.
Horticulturae 08 00816 g002
Figure 3. The plant growth characteristics of M.9 clones on Day 0 and Day 30. (a) Root, shoot, leaf, and total dry mass; (b) total leaf area; (c) plant water content. Total leaf area was measured before drying. Columns are the means of data (n = 3) ± standard error (SE) bars. The ‘*’ and ‘**’ presented in a column in (a) represent the significance levels of the growth of different tissues measured on Day 0 and Day 30. The ‘ns’ indicated significance levels with p ≥ 0.05.
Horticulturae 08 00816 g003
Figure 4. The diurnal fluctuation of instantaneous photosynthesis parameters of M.9 clones. (a) Canopy apparent photosynthesis (CAPi); (b) leaf net photosynthetic rate (PN). The average value (n = 3) and median are indicated by a hollow point and transverse line in each box separately. The solid points represent data points. The upper and lower edges of a box are the 90th and 10th corresponding to percentiles respectively. Different letters after mean values ± standard error in the same column indicate the significant difference determined by the least significant difference (LSD) test with p < 0.05.
Horticulturae 08 00816 g004
Figure 5. Instantaneous photosynthesis parameters of ‘Red Fuji’ scion leaf influenced by rootstocks in the morning (AM) and afternoon (PM). (a) Canopy-apparent photosynthesis (CAPi); (b) leaf net photosynthetic rate (PN). Columns are means of data (at least eight replications) ± standard error (SE) bars. Different letters after mean values ± standard error in the same column indicate the significant difference determined by the least significant difference (LSD) test with p < 0.05.
Horticulturae 08 00816 g005
Figure 6. Parameters related to gas exchange of ‘Red Fuji’ scion leaf influenced by rootstocks in the morning (AM) and afternoon (PM). (a) Stomatal conductance (gs); (b) intracellular CO2 concentration (Ci); (c) transpiration rate (E); (d) water-use efficiency (WUE); (e) leaf carboxylation efficiency (CE); (f) stomatal threshold (LS). Parameters were measured on the same functional leaves. Columns are means of data (at least eight replications) ± standard error (SE) bars. Different letters after mean values ± standard error in the same column indicate the significant difference determined by the least significant difference (LSD) test with p < 0.05.
Horticulturae 08 00816 g006
Figure 7. ‘Red Fuji’ scion leaf light-response curves influenced by rootstocks. Parameters were measured on the same functional leaves. Different symbols indicate the leaf net photosynthetic rate (PN) of different grafted apple combinations (n = 3), measured under photosynthetic photon flux density (PPFD) gradients.
Horticulturae 08 00816 g007
Figure 8. Correlation analysis and principal component analysis (PCA) on the photosynthetic characterization of grafted apple combinations. Correlation heat map involving total leaf area, plant height, canopy width, instantaneous canopy apparent photosynthesis (CAPi), SPAD, leaf net photosynthetic rate (PN), stomatal conductance (gs), intracellular CO2 concentration (Ci), transpiration rate (E), water-use efficiency (WUE), leaf carboxylation efficiency (CE), and stomatal threshold (LS) (a); PCA-based biplot, involving PN, LS, gs, Ci, E, WUE, CE, CAPi; total leaf area; canopy width and plant height (b). The ellipses eccentricity in (a) denotes Pearson’s correlation among various parameters (at least three replications), and the ‘*’ and ‘**’ indicate significance level (p < 0.05 and p < 0.01). The upward slope ellipses in red showed positive correlations, and the downward ones in blue indicated negative correlations. The different symbols in (b) represent different apple-grafted combinations (at least four replications) and the arrows reflect the vectors of loadings.
Horticulturae 08 00816 g008
Table 1. Basic information of apple rootstocks in this study.
RootstockLatin NameDwarfing ClassOriginParentage
M.9Malus pumila Mill.DwarfingEast Malling Research Station, Kent, United KingdomNatural seedlings
M.26Malus pumila Mill.Semi-dwarfingEast Malling Research Station, Kent, United KingdomM.16 × M.9
Chistock-1Malus xiaojinensisSemi-dwarfingChina Agricultural University, Beijing, ChinaNatural seedlings
BalengMalus robusta Rehd.VigorousHuailai, Hebei, ChinaNatural seedlings
Table 2. Growth parameters and soil-plant analysis development (SPAD) values of scion-rootstock combinations.
RootstockPlant Height
(cm)
Canopy Width
(cm)
Total Leaf Area
(cm2)
SPAD
M.9137.4 ± 4.3c58.4 ± 10.2b1796.8 ± 72.1c45.7 ± 2.4c
M.26148.2 ± 7.6bc76.4 ± 10.4ab2790.0 ± 281.6b47.6 ± 0.6bc
Chistock-1157.3 ± 3.3b83.3 ± 4.6ab3580.0 ± 235.9ab51.5 ± 0.9ab
Baleng179.1 ± 2.5a93.3 ± 8.7a3829.9 ± 425.3a56.7 ± 0.5a
SPAD was measured on the same functional leaves. Data in the table are mean values (n = 3–4) ± standard error (SE). Different letters after mean values ± standard error in the same column indicate the significant difference determined by the least significant difference (LSD) test with p < 0.05.
Table 3. Parameters of photosynthetic light response curves on grafted apple combination, including light-saturated net photosynthetic rate (PNmax), dark respiration rate (RD), light compensation point (LCP), light saturation point (LSP), and apparent quantum yield (φ).
RootstockPNMAX
(μmol CO2 m−2 s−1)
RD
(μmol CO2 m−2 s−1)
LCP
(μmol m−2 s−1)
LSP
(μmol m−2 s−1)
φ
M.915.2 ± 0.5b0.62 ± 0.12c17.3 ± 2.7b1137.3 ± 59.6a0.037 ± 0.004b
M.2615.2 ± 0.2b0.95 ± 0.15bc25.3 ± 5.8ab1136.0 ± 56.0a0.037 ± 0.003b
Chistock-116.8 ± 0.8ab1.49 ± 0.05a30.7 ± 1.3a1088.0 ± 64.2a0.049 ± 0.003a
Baleng18.5 ± 0.9a1.11 ± 0.13ab25.3 ± 1.3ab1250.7 ± 97.8a0.043 ± 0.002ab
Parameters were measured on the same functional leaves. Data in the table are mean values (n = 3) ± standard error (SE). Different letters after mean values ± standard error in the same column indicate the significant difference determined by the least significant difference (LSD) test with p < 0.05.
Publisher’s Note: MDPI stays neutral with regard to jurisdictional claims in published maps and institutional affiliations.

