Article

Variation in Fruit Morphology and Seed Oil Fatty Acid Composition of Camellia oleifera Collected from Diverse Regions in Southern China

1
Key Laboratory of Cultivation and Protection for Non-Wood Forest Trees, Ministry of Education, Central South University of Forestry and Technology, Changsha 410004, China
2
Texas A & M Agri Life Research and Extension Center, 17360 Coit Rd, Dallas, TX 75252, USA
*
Authors to whom correspondence should be addressed.
Horticulturae 2022, 8(9), 818; https://doi.org/10.3390/horticulturae8090818
Submission received: 23 August 2022 / Revised: 2 September 2022 / Accepted: 4 September 2022 / Published: 7 September 2022

Abstract

:
Camellia oleifera is an important woody edible oil crop in China with high ecological and economical values. It is a traditional oilseed crop with high levels of desirable fatty acids. The fruits of C. oleifera were harvested from 18 geographic provenances in southern China. In this paper, we analyzed the key environmental factors of diverse geographic provenances that caused the variation in the fruit morphology and fatty acid composition (FAC). Our study indicated an average coefficient of variation of fruit width (FW) of 18.63%, and 15.81% for fruit length (FL). The most abundant fatty acids (FA) were oleic acid (C18:1; 70.21–85.23%), followed by palmitic acid (C16:0; 6.93–13.89%) and linoleic acid (C18:2; 5.02–14.26%). In addition, the fruit width had a negative correlation with the equivalent latitude (ELAT) and a positive correlation with the annual mean air temperature (MAT). The fruit length-to-width ratio and oleic acid level had a positive correlation with ELAT but a negative correlation with MAT, annual precipitation (AP), and precipitation of wettest quarter (PWQ). A positive correlation was observed between MAT, AP, and PWQ with palmitic acid. Meanwhile, a negative correlation was found between longitude (LON), maximum temperature of warmest month (MTW), and ELAT and palmitic acid. The cluster analysis indicated six groups for the selected 18 populations. Our results showed the most influential environmental factors for variation in fruit morphology and FAC are ELAT and MAT.

1. Introduction

Camellia oleifera belongs to the genus Camellia of the family Theaceae. It is mainly distributed in the subtropical mountains of East Asia, especially in China [1]. At present, the planting region of the camellia plant covers more than four million hectares, with a camellia oil production of over 300 million kilograms [2]. Camellia oil, the major product of C. oleifera seeds (nearly 50% of the dry kernel weight), is considered among the highest quality oils [3]. Camellia oil has been used extensively for cooking in China for over 1000 years [4]. In addition, the oil has a high medicinal value [5]. The low content of saturated fatty acids and high content of monounsaturated fatty acids and polyunsaturated fatty acids in the oil is beneficial to human health [6,7,8].
The maintenance of membrane fluidity and stability due to the increased proportion of unsaturated fatty acids may allow plants to adapt to environmental stresses [9]. The unsaturated fatty acids account for approximately 90% of all C. oleifera fatty acids, including monounsaturated oleic acid and polyunsaturated linoleic acid [10]. Research showed that fatty acid composition is affected by climate factors and can adapt to climate change [11,12]. When the climate changes, the probability of change in fatty acid composition increases, with temperature strongly affecting the biosynthesis of fatty acids, especially unsaturated fatty acids [13,14]. Previous studies have shown that soybean oil content is positively correlated with rainfall, sunshine hours, and diurnal temperature range, and negatively correlated with the average temperature [15,16]. In a field trial studying different rape varieties and environments, Aslam et al. [17] observed that low rainfall is related to an increase in polyunsaturated fatty acids and a decrease in saturated fatty acids. Singer et al. [18] showed that under the condition of insufficient rainfall, oil fruit species had an increase in oleic acid and a reduction in linoleic acid. In addition, fatty acid composition is also affected by geographical factors such as longitude, latitude, and altitude [19]. The fatty acid composition of fruits in different climatic regions is also very different [20,21].
The phenotypic variation of plants shows its adaptation to different environmental pressures [22]. The variation in fruit morphology has been used to determine the pattern of fruit geographic distribution and its response to climate change [23]. The variation of fruit size has adaptive and evolutionary significance [24,25]. Prior research has reported on the pattern of morphological variation of C. oleifera fruits. Peng et al. [26] divided the shape of C. oleifera fruit into four categories, including olive, egg, spherical, and orange shapes, and found a significant positive correlation between the fruit length and width. In addition, Qi et al. [27] revealed diverse differences in the fruit morphology of C. oleifera from different geographical regions. Zhong et al. [28] showed that the fruit width of C. oleifera was positively correlated with relative humidity and negatively correlated with temperature.
Studying the variation pattern of fruit morphology and fatty acid composition and its relevance with abiotic factors helps in studying plant phenotypic variation that is caused by geographical and climatic heterogeneity and reveals the genetic and variation laws of the populations [29]. In our research, we analyzed the fruit morphological traits of 18 different populations of C. oleifera to understand the morphological and fatty acid composition variation of C. oleifera fruits due to environmental influences. We put forward two questions: (1) What is the differentiation degree of quantitative characters among C. oleifera populations? (2) What are the leading factors affecting the variation of fruit traits of C. oleifera? Thus, the aim of this study was to elucidate any correlation between fatty acid composition or phenotypic traits of C. oleifera fruits with environmental factors.

2. Materials and Methods

2.1. Study Area

In the geographic range of C. oleifera in southern China [30], eighteen typical plantations of C. oleifera were selected from five Chinese provinces (Table 1 and Figure 1). The latitude in these selected populations ranged from 18.83° N (Wuzhishan City, Hainan) to 28.95° N (Jiujiang City, Jiangxi), and longitude from 108.35° E (Nanning City, Guangxi) to 115.82° E (Nanchang City, Jiangxi). The range of the precipitation of wettest quarter, annual precipitation, the highest monthly temperature, and the average temperature was shown in Table 1.

2.2. Sample Collection

Camellia oleifera fruits were collected in autumn 2020 from five provinces in southern China (Figure 1). The climate conditions are listed in Table 1. About 20 naturally mature trees were selected in each provenance, with at least 50 m separation between the trees [31]. All the plantations have similar cultivation practices and all trees belonged to C. oleifera species. A total of 100 fully mature fruits were randomly collected from the middle and upper part of the periphery of each tree crown [32]. First, the length and width of more than 30 fresh fruits per population were measured [33]. Next, the fruit samples were placed in separate nylon bags and air-dried, then the seeds were peeled from their dry capsules and sun-dried. The seed samples of at least 1000 g were harvested, and the dried samples were stored at −20 °C until subsequent laboratory analysis [10].

2.3. Environmental Factors

The climate data for 18 sites, including temperature and precipitation were provided by the WorldClim Database (http://www.worldclim.org) (accessed on 18 June 2022) and are presented in Table 1 [34,35]. Due to the great variation among the different latitudes, we converted all the latitudes into equivalent latitudes in order to accurately reflect the latitude effect and eliminate the influence of altitude factors [36]. The conversion equations are as follows:
Equivalent latitude = latitude + (altitude − 300)/N, when the altitude is greater than 300 m, N is 140; while the altitude is less than 300 m, N is 200.

2.4. Determination of Fatty Acid Content in Oil Tea

All of the sample seeds were ground to powder by a small plant grinder. The ground samples of 10 g of dry seeds were weighed. The automatic Soxhlet apparatus was filled with 120 mL petroleum ether (60–90 °C) and used as the solvent to extract the total oils of C. oleifera. The method of determining the fatty acid constituents followed the guidelines of the ‘Determination of Fatty Acids in Food of National Food Safety Standard in China’ [37]. The crushed seed samples (0.1 g) were placed in a test tube, and 4 mL isooctane and 100 μL methanol (5 g/L) were added to the seed oil sample and shaken well. Afterwards, 20 μL NaOH-CH3OH (2 mol/L) were added to the sample. The test tube was covered with a stopper, shaken vigorously for 3 min and heated at 50 °C for 2 min, and then left to settle. Then, 1 g sodium bisulfate was added, and the test tube was shaken vigorously. Finally, 100 μL of the upper layer solution was used for chromatographic analysis. Fatty acids were analyzed using gas chromatography (Shimadzu GC-2014, Shimadzu, Kyoto, Japan). The parameters were as follows: FID detector temperature, 300 °C; chromatographic column, 60 m × 0.25 mm × 0.2 μm (Agilent DB-WAX, Palo Alto, CA, USA); carrier gas, nitrogen; split ratio, 50:1; sample injection volume, 1 μL; heating process, 50 °C (stay for 2 min), 170 °C (at increment of 10 °C/min, stay for 10 min), 180 °C (2 °C/min, stay for 10 min), and 220 °C (4 °C/min, stay for 22 min). The composition of fatty acids was determined by comparison with the retention time of standards of the various fatty acids. The relative content of each fatty acid was calculated by the peak area normalization method. Each measurement was replicated three times.

2.5. Determination of Phenotypic Characteristic

Vernier calipers were used to measure the length and width of more than 30 fresh fruits per population with the accuracy of 0.01 mm [33]. The measurement was repeated three times, and the averages were obtained for the morphological characteristics. Then, the length-width ratio (FL/FW) of every fruit was calculated [38].

2.6. Statistical Analysis

First, Microsoft Office Excel 2016 was used to calculate the mean values and standard deviations. We created the plots by Origin 2019b software (Origin Lab company, Northampton, MA, USA) [39]. Significant differences among the means were assessed using Duncan’s multiple comparisons at p ≤ 0.05 and it was performed using SPSS 25.0 [13]. Cluster analysis was carried out using a groups linkage method and measured according to the squared Euclidean distance. Cluster analysis was performed using SPSS 25.0 [40]. Canoco5 (Microcomputer Power, New York, NY, USA) was used to perform the principal component analysis (PCA) of the morphological variables and fatty acid composition of C. oleifera fruits [41]. Pearson’s correlation coefficient between the environmental factors and C. oleifera characteristics was conducted using SPSS 25.0 [42]. The significance level was assessed after 9999 permutations, and the simple Mantel test was performed with the R package “Vegan” [43]. Heatmap analysis was performed in TBtools [44].

3. Result

3.1. Fruit Phenotypic Characters and Variation Characteristics

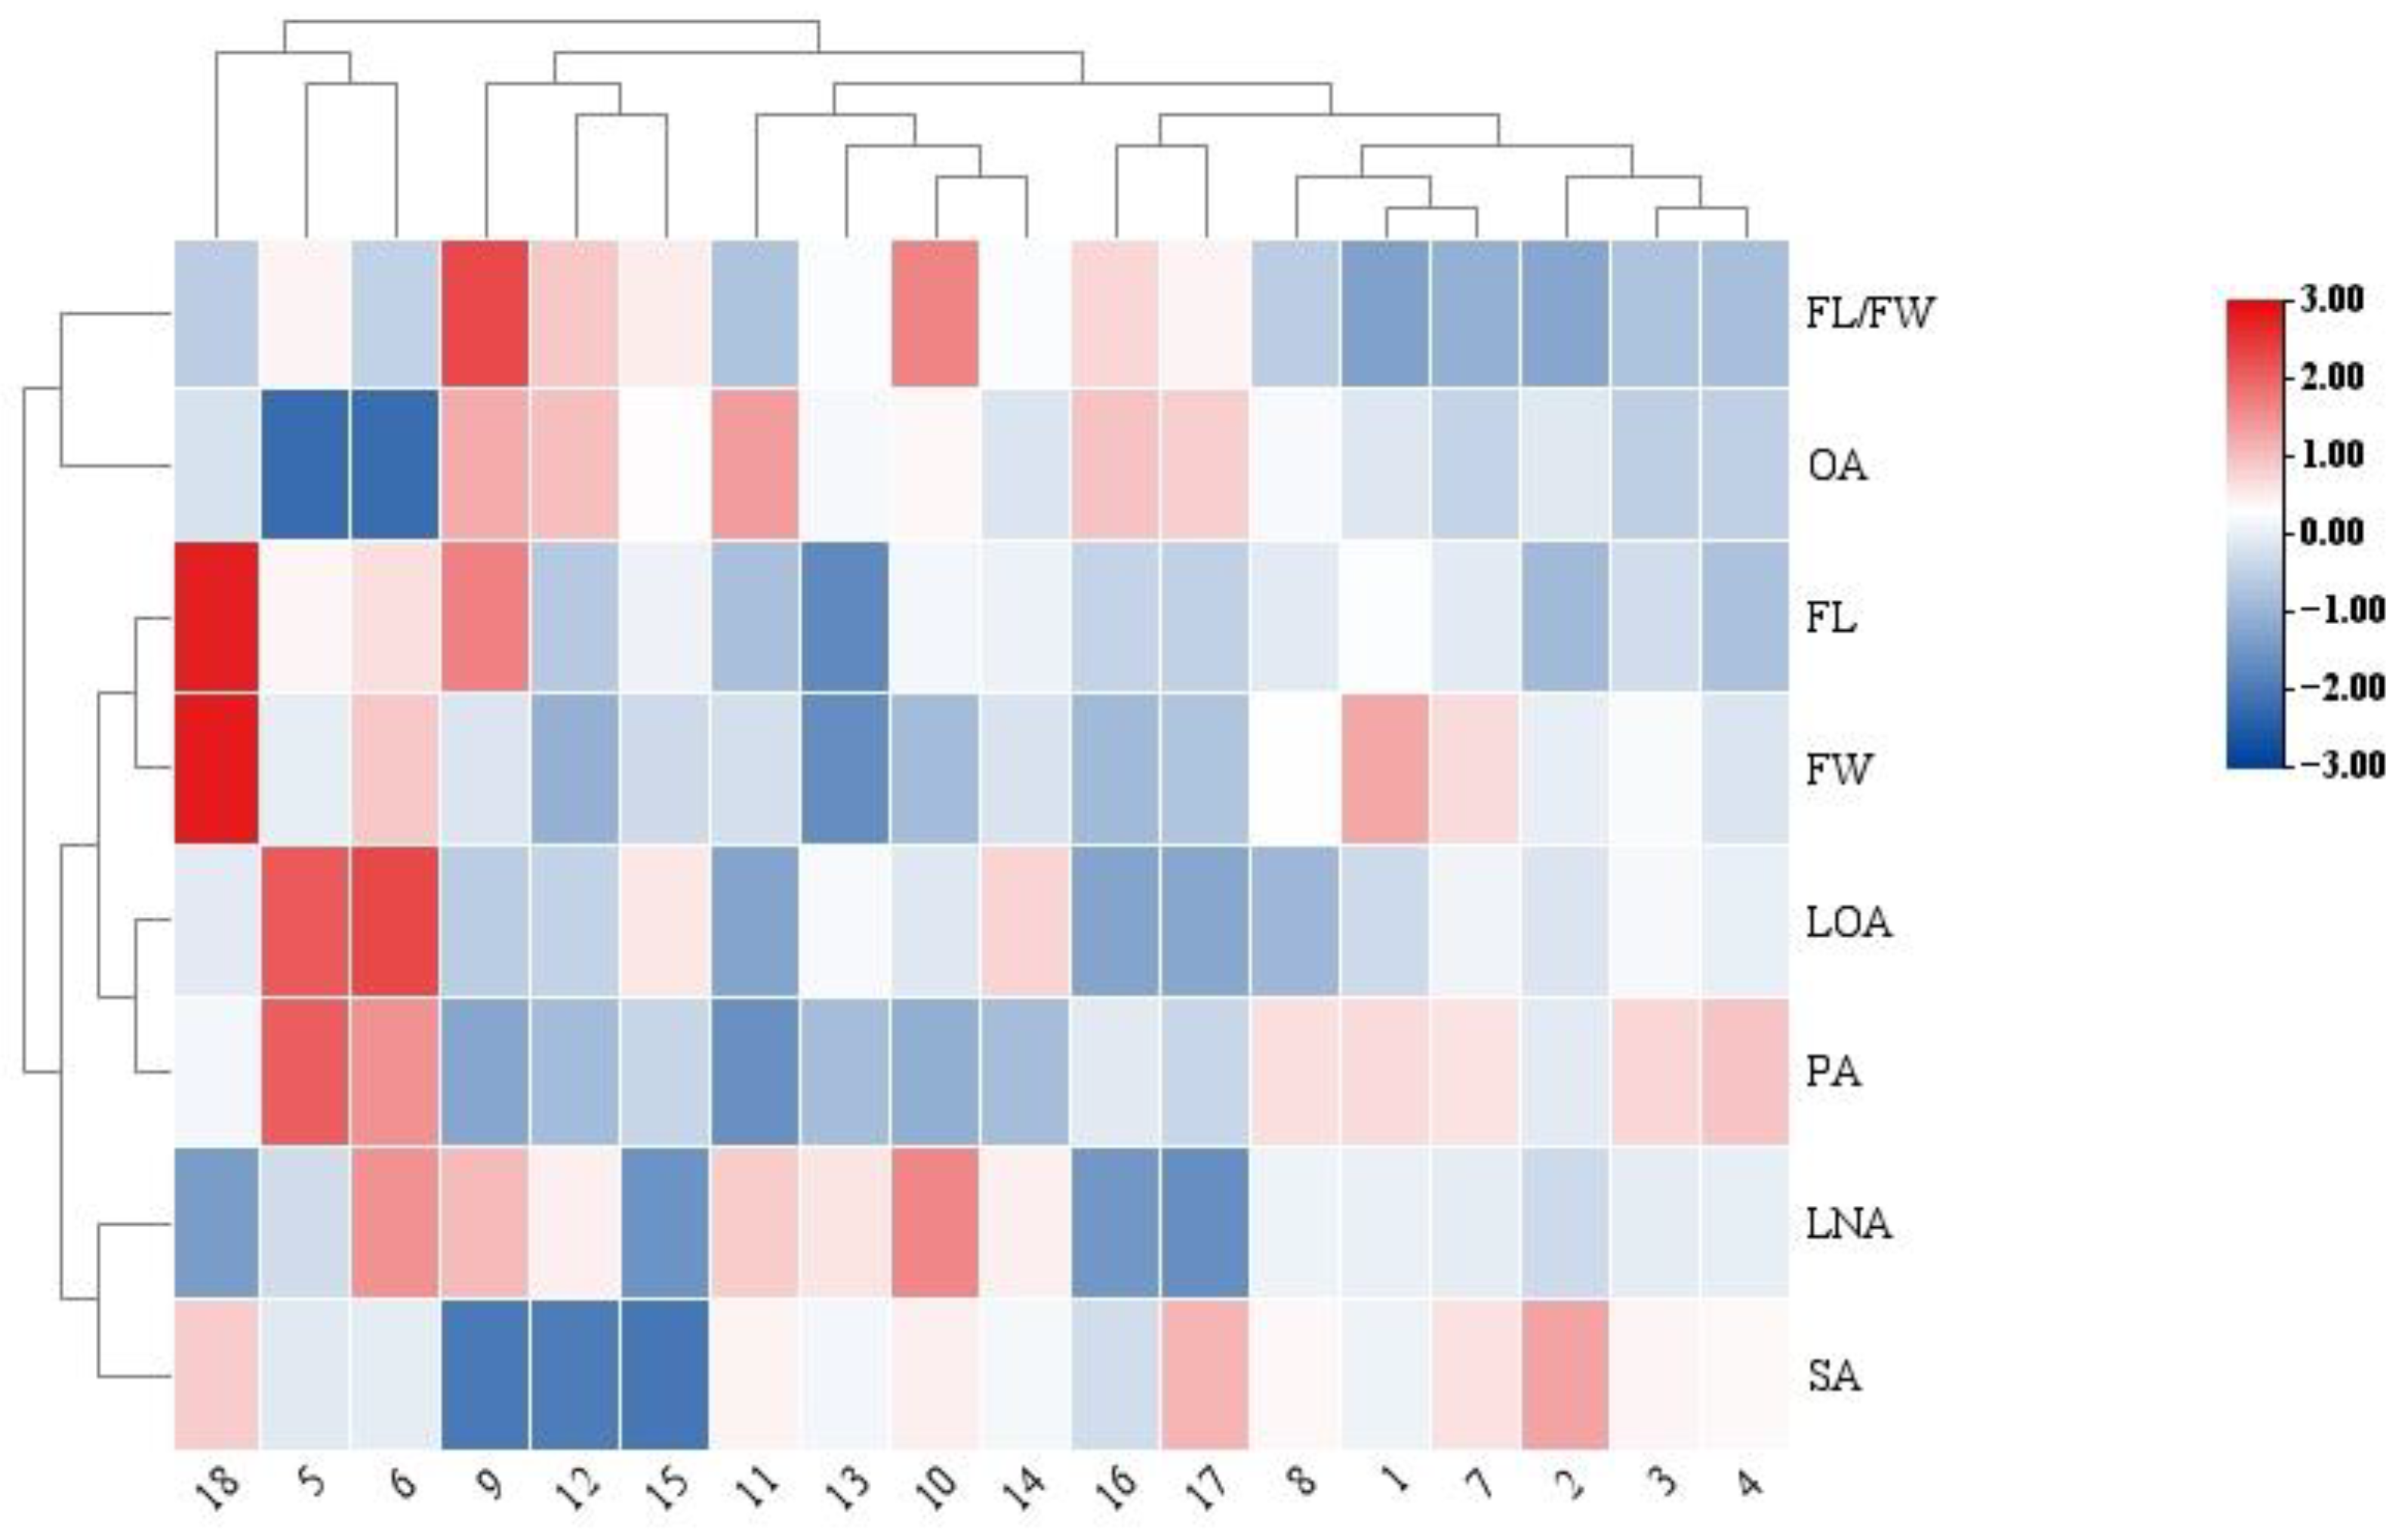
We observed a high degree of variation for most traits among the C. oleifera populations (Table 2 and Figure 2). The variation in fruit width ranged between 30.33 mm and 68.26 mm, with an average width of 44.30 mm. Fruits from the Jieyang site had the largest width, while the smallest fruit width was observed in fruits from the Jiujiang site. Fruit length ranged between 30.16 mm and 60.77 mm, with an average length of 41.95 mm. Fruit length was largest in the Changsha site, and fruits from the Jiujiang site were shortest. Fruit length-to-width ratio ranged between 0.80 and 1.24, with an average ratio of 0.96. The mean variation coefficient of FW, FL, FL/FW ratio among the different populations were 18.63%, 15.81%, and 12.51%, respectively (Table 2). Predominant FAs in tested samples were oleic acid (OA) (70.21~85.23%), linoleic acid (LOA) (5.02~14.26%), linolenic acid (LNA) (0.16~1.01%), palmitic acid (PA) (6.93~13.89%), and stearic acid (SA) (0.08~2.70%). Coefficients of variation (CV) for OA, LOA, LNA, PA, and SA content were 5.09%, 30.42%, 43.27%, 18.53%, and 45.24%, respectively (Table 2).

3.2. The Relationship between Fruit Characters and Environmental Factors

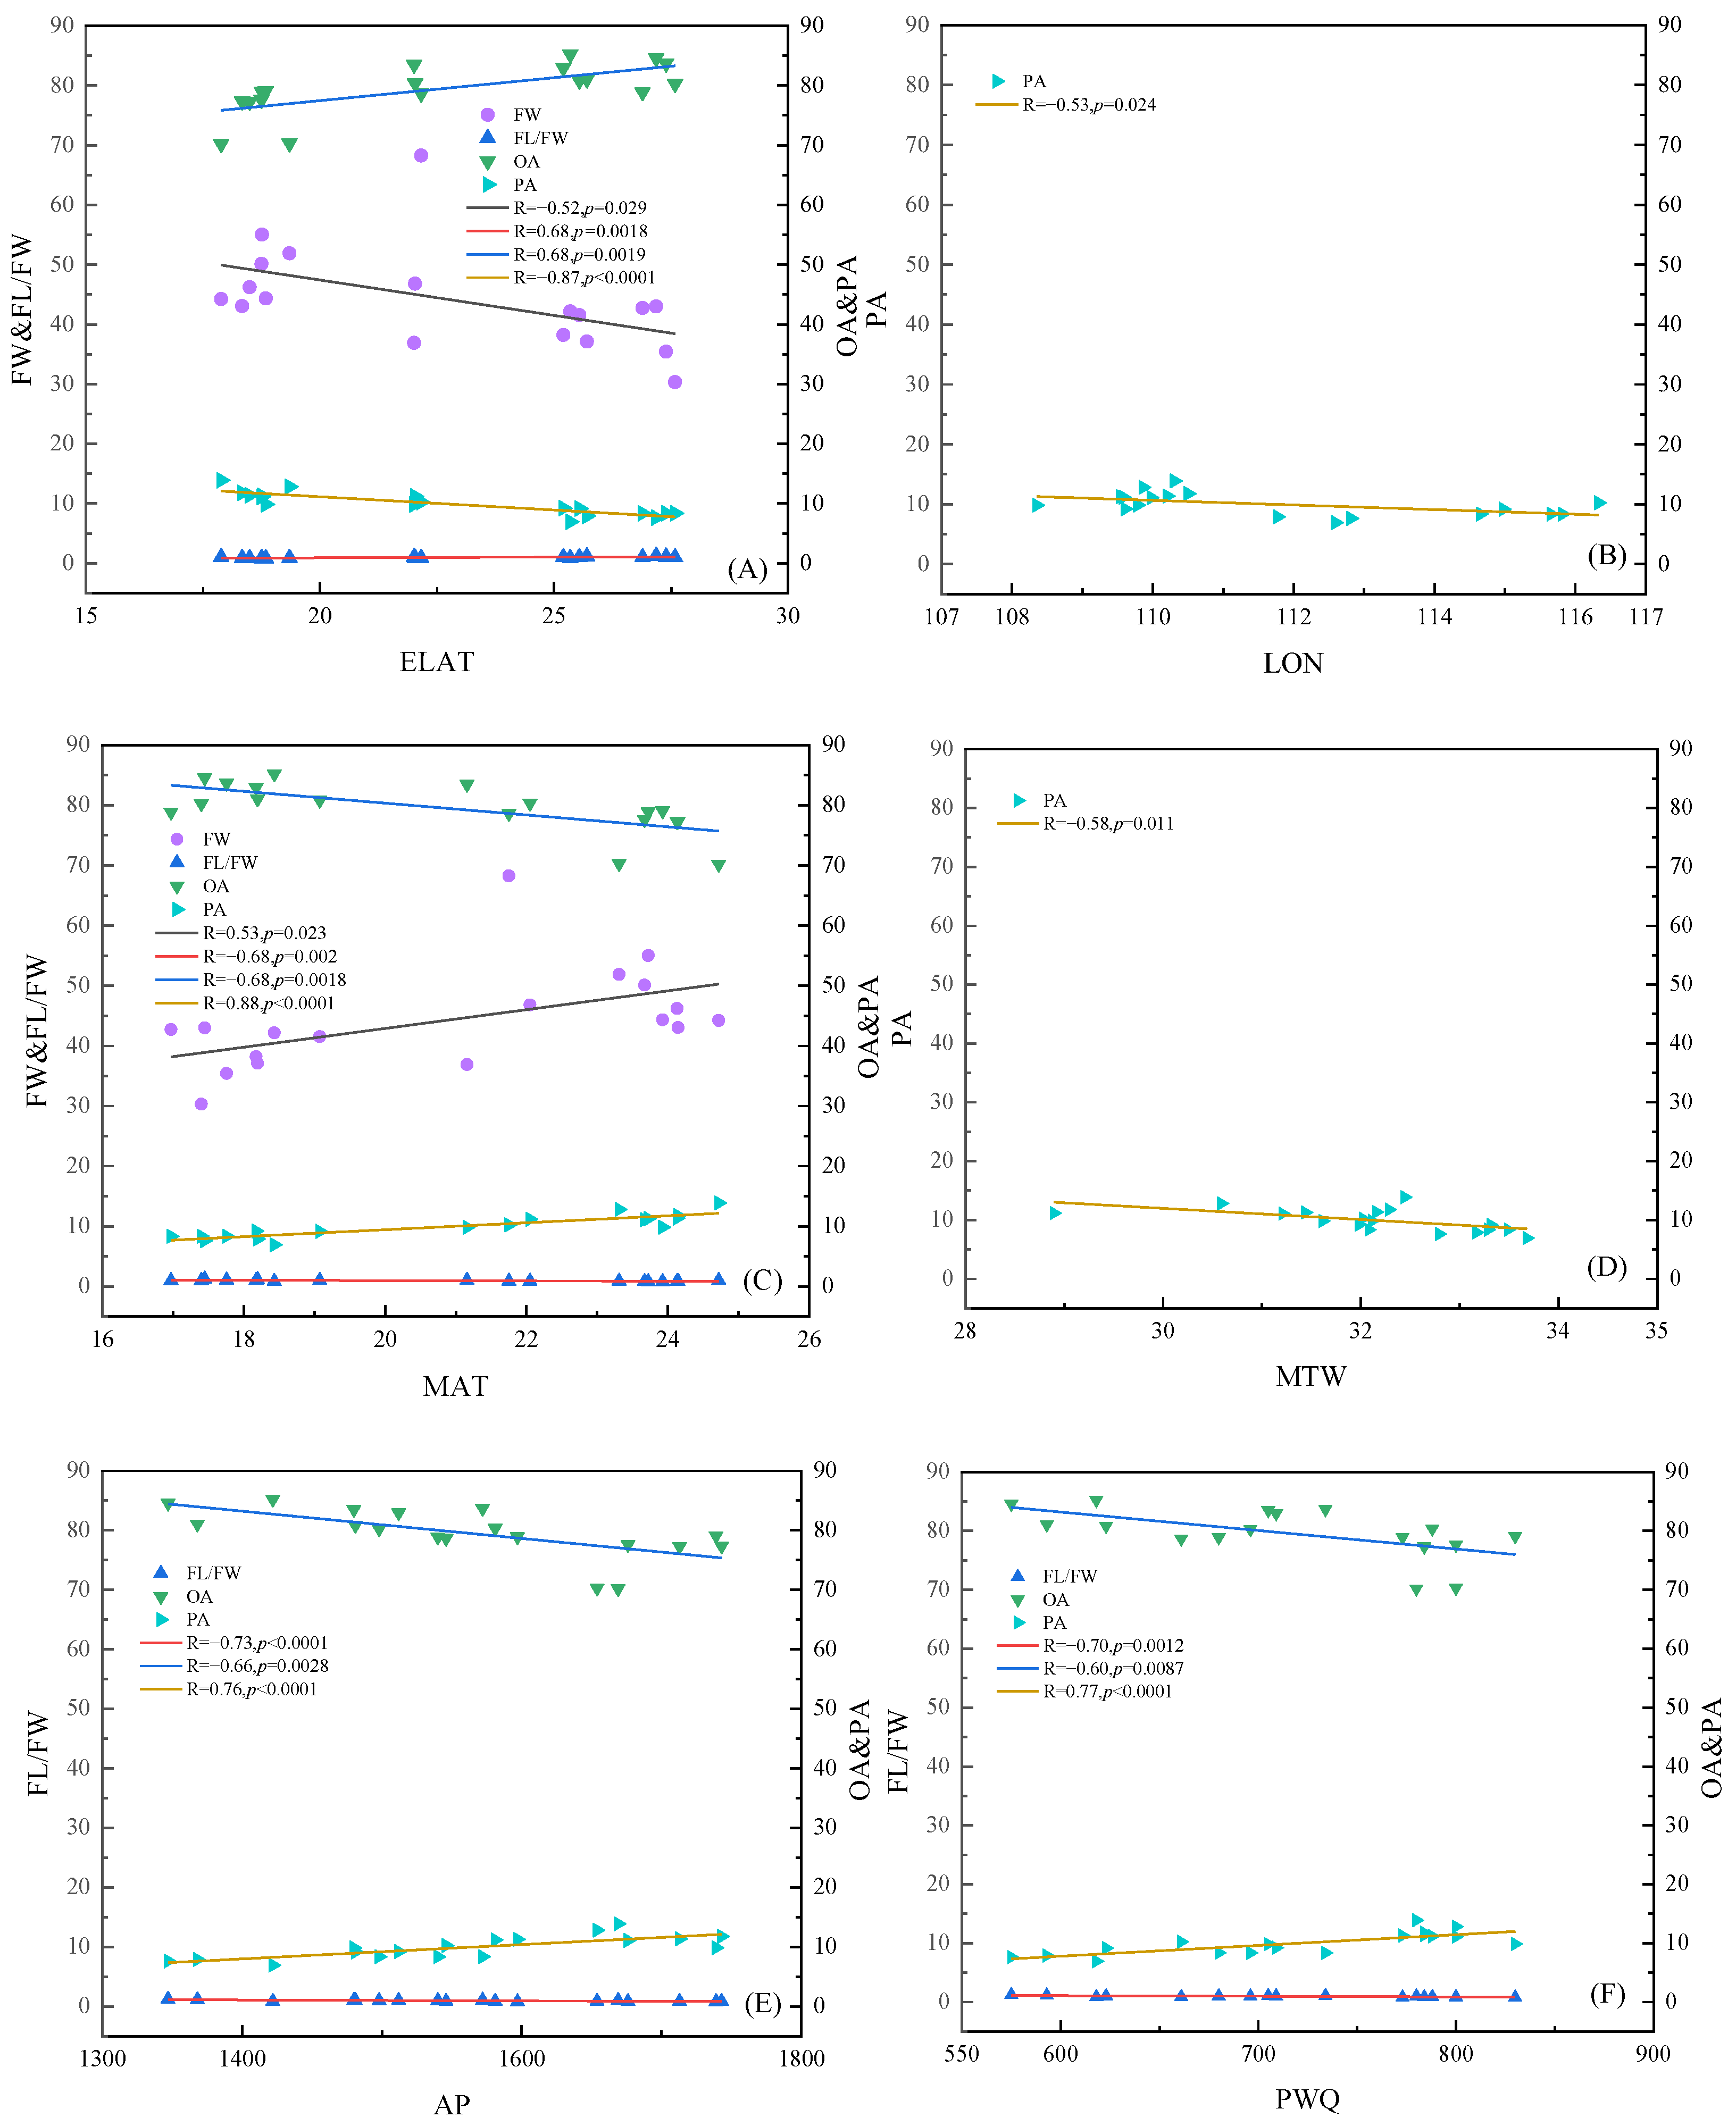
Results of the correlation analysis between the various morphological indicators and fatty acid composition of C. oleifera fruits and the geographical and ecological factors are presented in Figure 3.
ELAT had a negative correlation with fruit width (R = −0.52; p = 0.029; y = −1.19x + 68.59), and with palmitic acid (R = −0.87; p < 0.0001; y = −0.45x + 20.03) (Figure 3A). However, ELAT had a positive correlation with the fruit length-to-width ratio (R = 0.68; p = 0.0018; y = 0.02x + 0.44), and oleic acid (R = 0.68; p = 0.0019; y = 0.77x + 62.11). Palmitic acid with longitude had a negative correlation (R = −0.53; p = 0.024; y = −0.39x + 53.03) (Figure 3B).
The annual mean air temperature had a positive correlation with fruit width (R = 0.53; p = 0.023; y = 1.56x + 11.65), and palmitic acid (R = 0.88; p < 0.0001; y = 0.58x − 2.13) (Figure 3C). However, a negative correlation was observed with the fruit length-to-width ratio (R = 0.68; p = 0.002; y = −0.029x + 1.56), and with oleic acid (R = 0.68; p = 0.0018; y = −0.98x + 100.04). Palmitic acid and the maximum temperature of the warmest month had a negative correlation (R = −0.58; p = 0.011; y = −0.95x + 40.41) (Figure 3D).
The annual precipitation had a negative correlation with the fruit length-to-width ratio (R = −0.73; p < 0.0001; y = 0.0001x + 2.13) and with oleic acid (R = −0.66; p = 0.0028; y = −0.023x + 115.34), but a positive correlation with palmitic acid (R = 0.76; p < 0.0001; y = 0.012x − 8.87) (Figure 3E). A negative correlation was observed between precipitation in the wettest quarter and the fruit length-to-width ratio (R = −0.70; p = 0.0012; y = −0.001x + 1.74) and with oleic acid (R = −0.60; p = 0.0087; y = −0.031x + 102.04). However, palmitic acid and precipitation in the wettest quarter had a positive correlation (R = 0.77; p < 0.0001; y = 0.018x – 3.18) (Figure 3F).
Fruit length, fruit width, linoleic acid, palmitic acid, and stearic acid were positively correlated with the annual mean air temperature (MAT) (Table 3). However, the fruit length was negatively correlated with the precipitation of the wettest quarter (PWQ) and the annual precipitation (AP).
The Simple Mantel test identified significant correlations between the morphological and geographic distance matrices, fatty acid composition and geographic distance matrices, and fatty acid composition and climate distance matrices (Table 4). Correlations were the highest between the morphological and geographical matrices (r = 0.304, p = 0.0014).

3.3. Principal Component Analysis, and Cluster Analysis

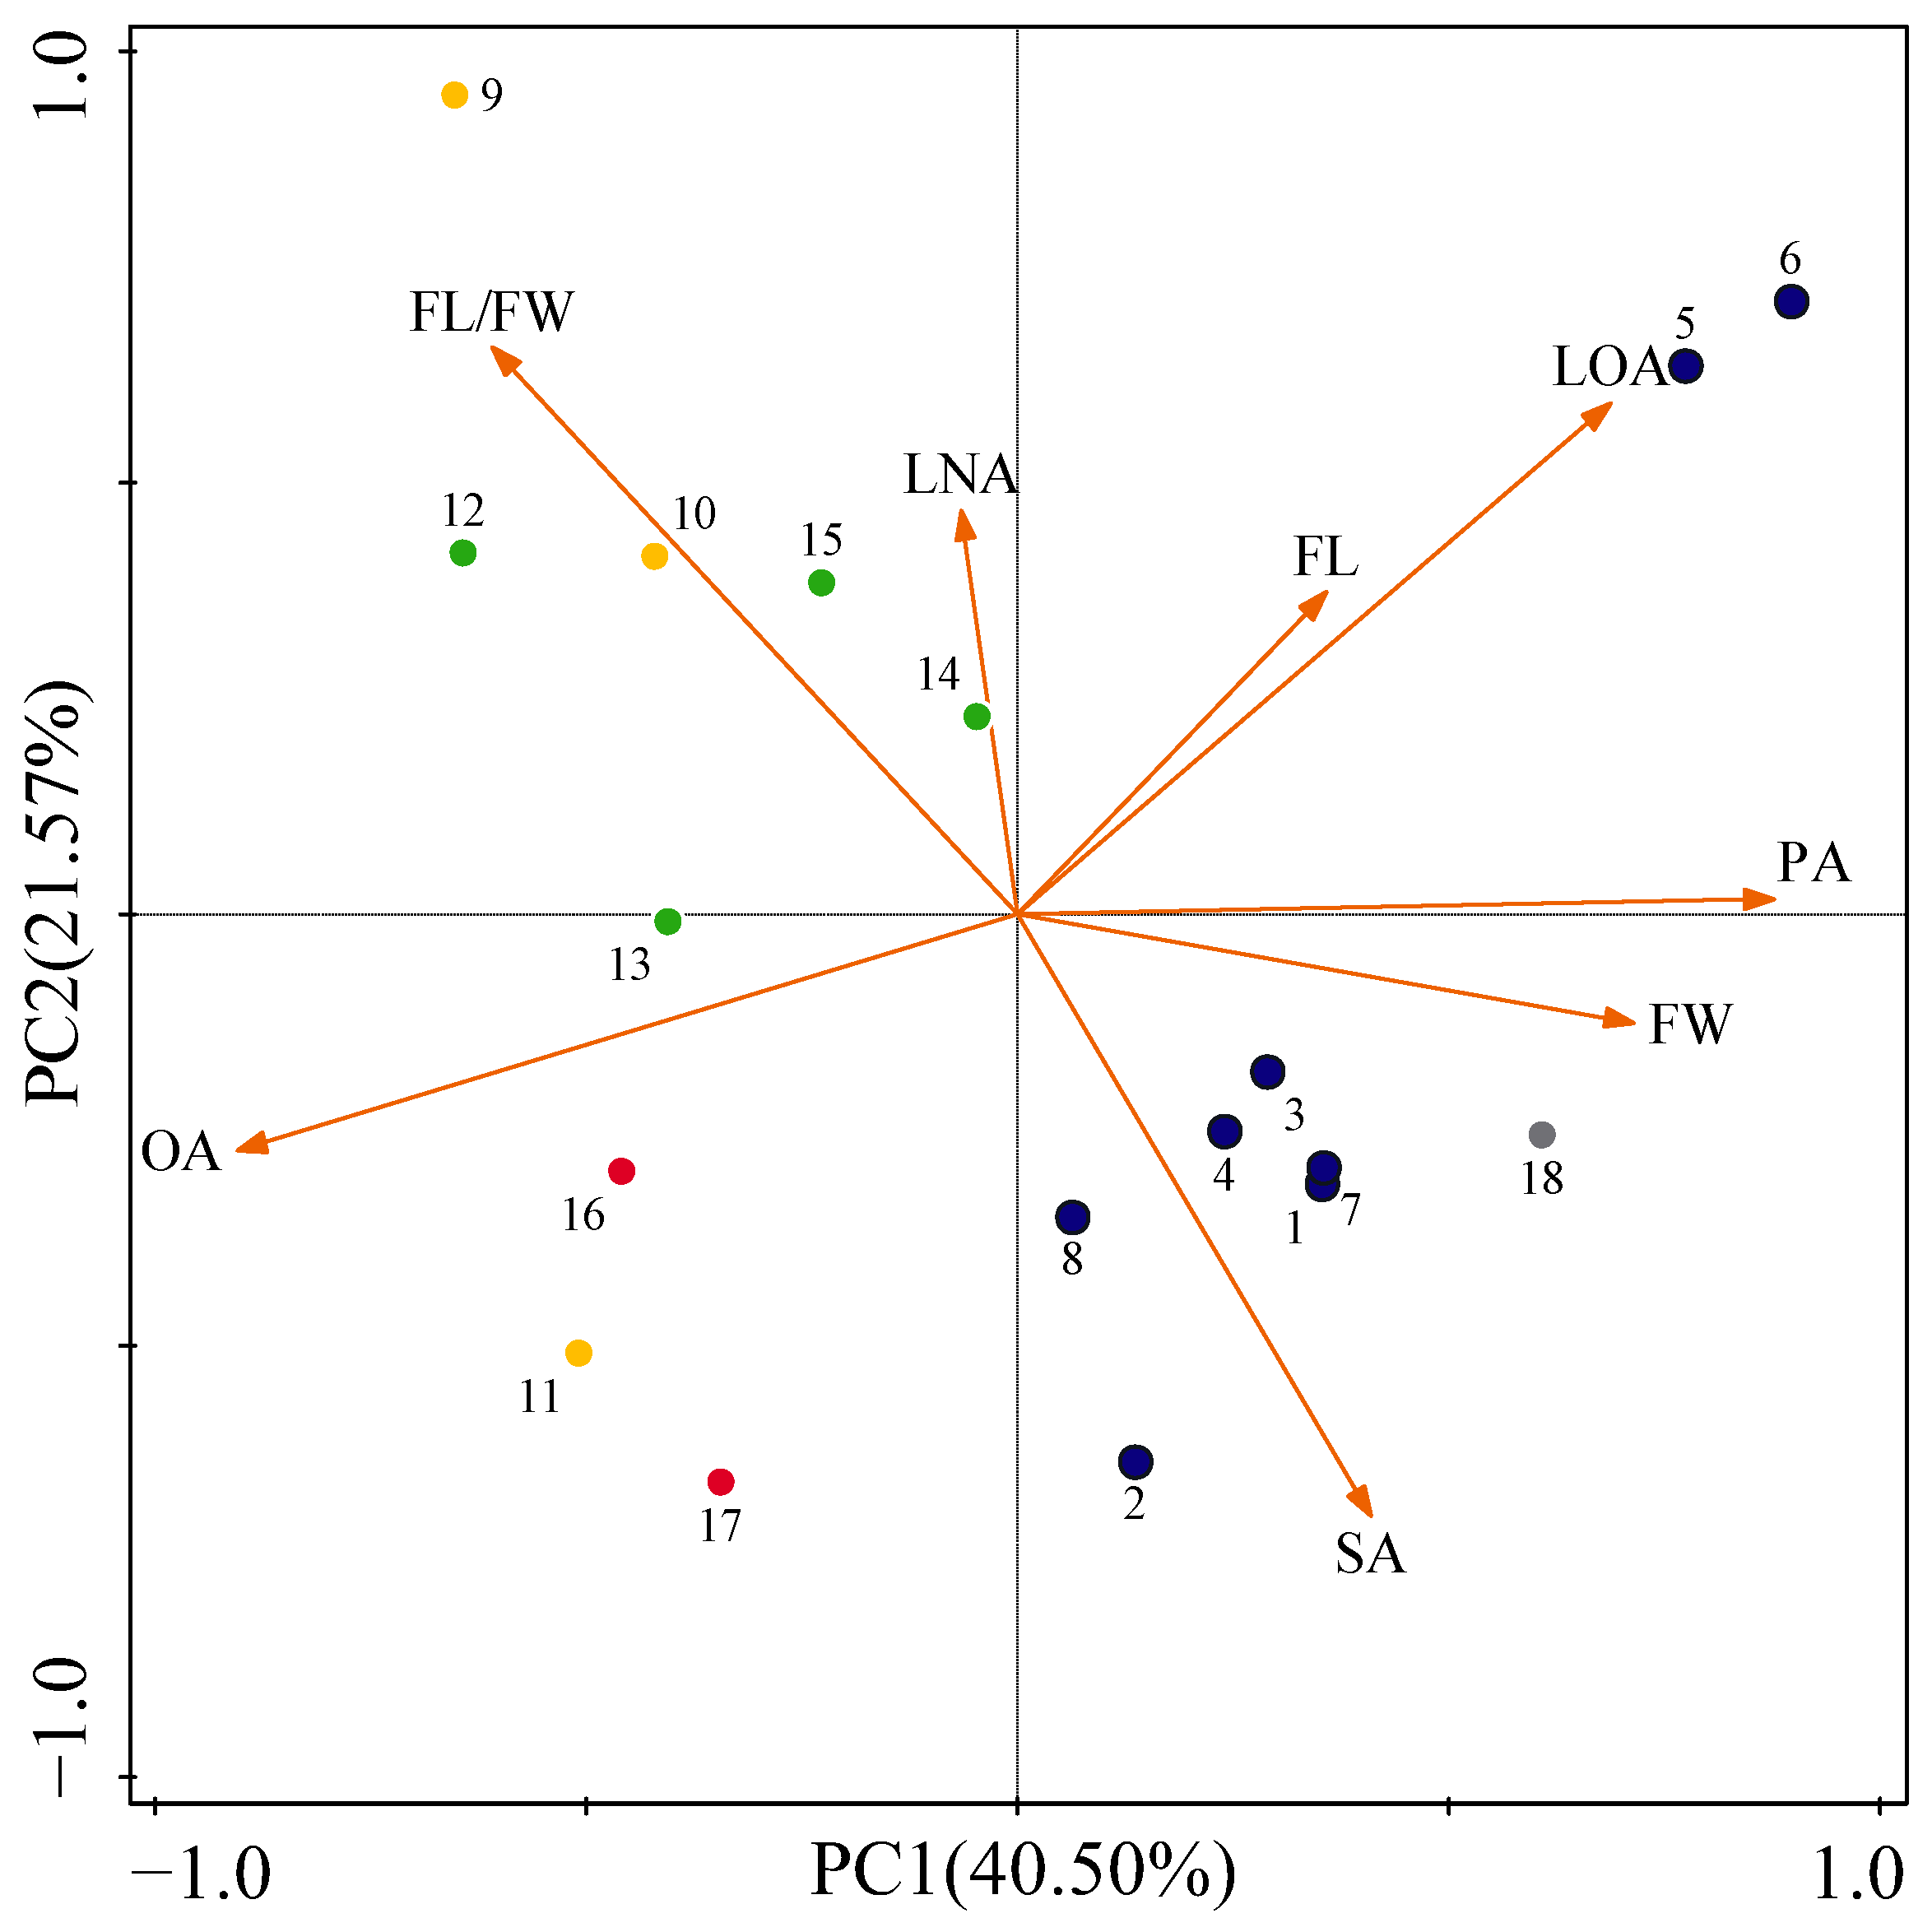
The results of the principal component analysis are presented in Figure 4 and Table 5. The first three principal components explained 80.87% of the total variation. The principal component score, that was associated to each variable on the three principal components, identifies the variables that mostly define them (Table 5). The PCA describes 40.50% and 21.57% of the total variation in PC1 and PC2, respectively (Figure 4). In PC1, the load value of PA and OA are higher than other factors. The PC2 was mainly contributed to by FL/FW and SA. The PC3 was mainly contributed to by FL.
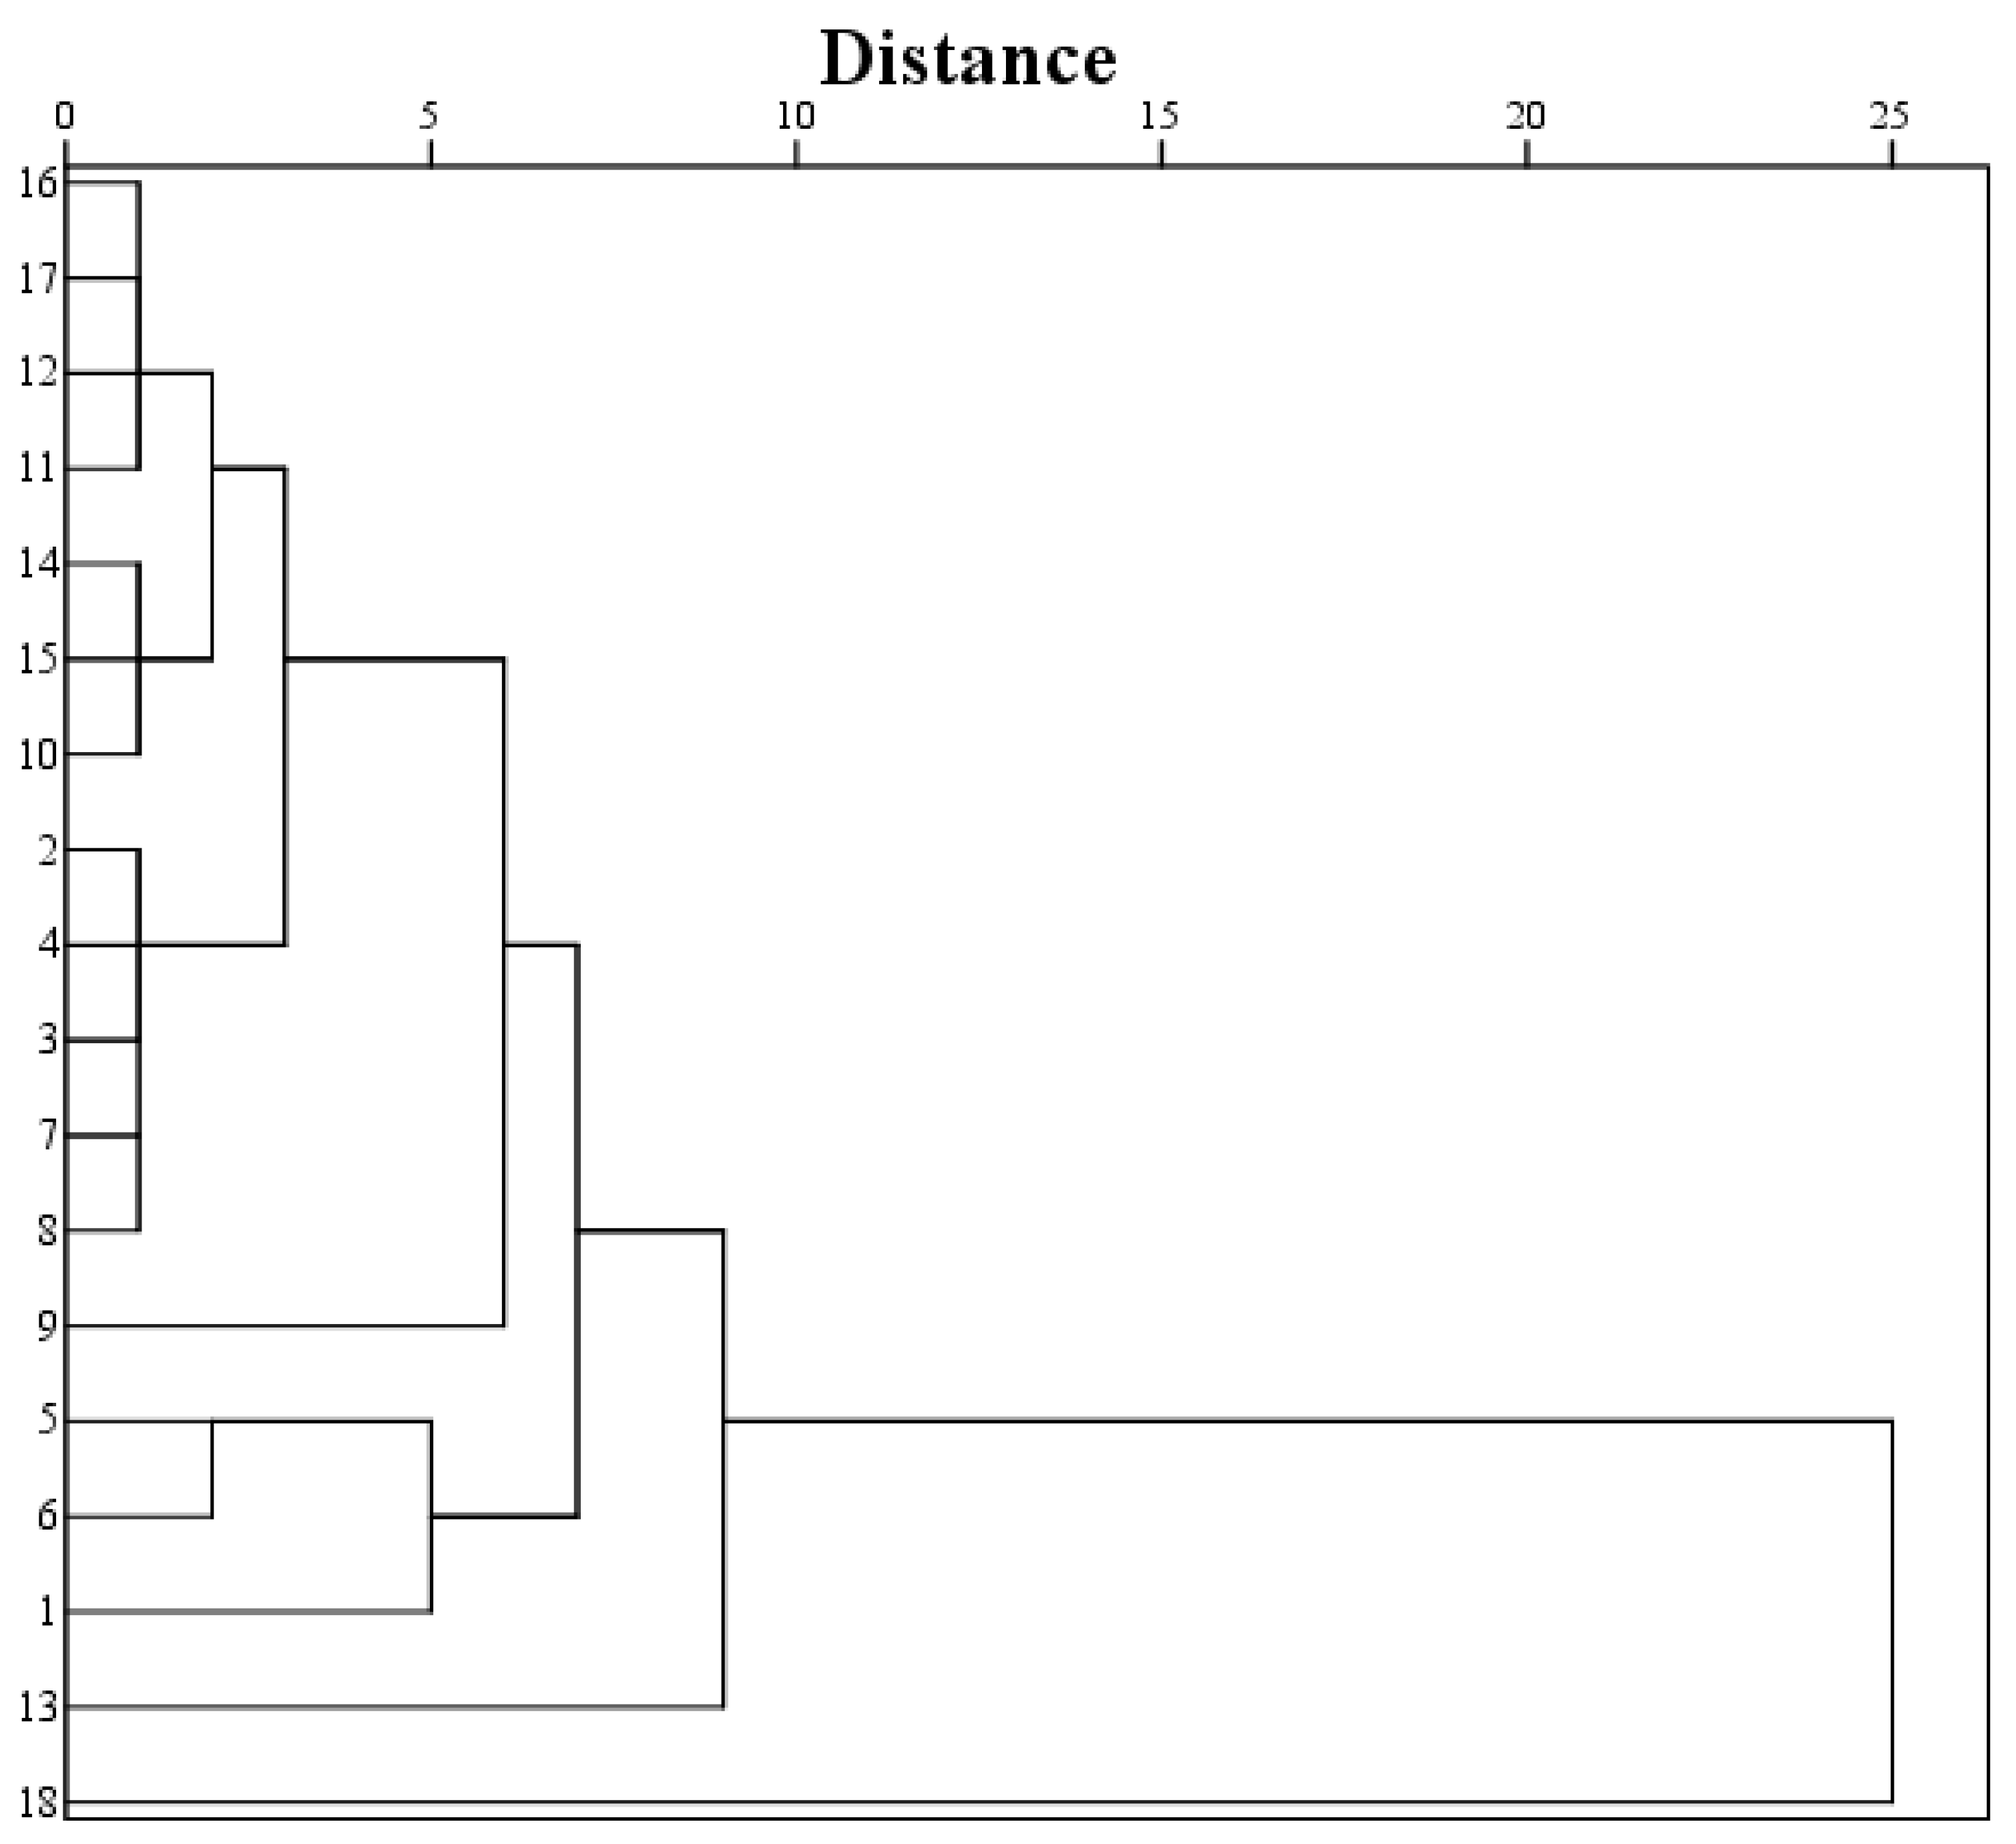
The cluster analysis revealed six principal groups of the 18 populations of C. oleifera with a Euclidean distance of five as the threshold (Figure 5). Population 16, 17, 11, 12, 14, 15, 10, 2, 3, 4, 7, and 8 were clustered into the first group, population 9 in the second, population 5 and 6 in the third, population 1 in the fourth, population 13 in the fifth, and population 18 in the sixth.

4. Discussion

In this study, we observed a high level of fruit morphological diversity in C. oleifera from the 18 populations that were collected from their natural habitat. For most morphological traits, the level of variation is comparable to prior research results. In this paper, the coefficients of variation of fruit length and fruit width were 15.81% and 18.63%, respectively. Similarly, Yang et al. [45] reported coefficients of variation of fruit length and fruit width of C. oleifera in Hainan province of 15.55% and 16.57%, respectively. Zhang et al. [46] obtained coefficients of variation of fruit length and fruit width of C. gauchowensis of 14.21% and 14.76%, respectively. Zhou et al. [47] calculated a coefficient of variation of fruit length of C. chekiangoleosa of 15.49% and 14.24% for the coefficient of variation of fruit width. These results of previous studies are generally consistent with our results. However, in our study, the coefficient of variation of the fruit length-to-width ratio was 12.51%, compared to 7.87% as observed by Yang et al. [45]. In 2022, Yang et al. [48] observed that the coefficient of variation of the fruit length-to-width ratio of C. oleifera was 7.6%. Thus, a higher level of variation may exist in specific C. oleifera populations.
The fruit phenotypic and quantitative traits varied between the geographical provinces [1,49]. Differences in geographical scale distribution of plants led to a variation of fruit characters [12,50]. Moreover, tree species with a wide geographical distribution exhibit considerable character variations as an adaptation to survive varying environmental conditions [11]. Zhang et al. [9] showed that the fatty acid composition of C. oleifera fruit varied along a geographical gradient. Comparable trends were indicated in our results. Fruit morphological and fatty acid composition traits of C. oleifera exhibited geographic patterns. Clustering analysis of the 18 populations of C. oleifera indicated that geographically close populations were clustered in the same group, such as the population 3, 7, and 8 and the 5 and 6 populations, this indicates a regional and continuous pattern of geographic variation. However, some populations with long geographic distances, such as the 12 and 2 populations were found to be clustered in the same group, demonstrating a random variation pattern. These results indicate that fruit phenotypic diversity of C. oleifera represent three geographical variation patterns: continuous variation, regional variation, and random variation.
The variation in fruit phenotypic diversity is closely associated with environmental conditions [51]. Sarikhani et al. [52] indicated that the improvement of plant fruit heritability is related to the interaction between environment and plant genes. Therefore, changes in the local environment would lead to obvious interactions with plant genes, which could further lead to the improvement of plant adaptability [53]. Significant correlations between environmental factors and phenotypic characteristics of C. oleifera were found in our research. Consistent with previous studies in Cyclocarya paliurus [54] and Sapindus mukorossi [51], fruit width was negatively correlated with ELAT (R = −0.52, p < 0.05) and positively correlated with MAT (R = 0.53, p < 0.05). In addition, the fruit length-to-width ratio was most significantly correlated with AP and PWQ (R = −0.73, p < 0.05 and R = −0.70, p < 0.05, respectively). This is consistent with the study on Acer ginnala by Wu et al. [55].
Complex quantitative traits are affected by several environmental factors, and different environmental factors have different effects on plants in the various stages of plant and fruit development [56]. Indeed, there are important differences in fatty acid composition due to environmental factors in different provenances [31]. In our study, we found various levels of association between the fatty acid content and environmental factors including the temperature, geographic location, and amount of rainfall. Oleic acid was positively correlated with ELAT (R = 0.68, p < 0.05) but negatively correlated with MAT (R = −0.68, p < 0.05). However, palmitic acid was negatively correlated with ELAT (R = −0.87, p < 0.05) and positively correlated with MAT (R = 0.88, p < 0.05). Similar results were obtained in studies of Juglans mandshurica [53] and Theobroma cacao L. [56]. Furthermore, the environmental factors exerted the greatest influence on the accumulation of OA and PA compared to other fatty acid components (LON, LNA, and SA), because only OA and PA had a significant correlation with environmental factors (p < 0.05). Similar results were obtained in Olea europaea [57] and Akebia trifoliata [29], where OA and PA dominate the fatty acid profile.
In our study, the Mantel test analysis showed that the fruit morphological variation was significantly correlated with geographical distance matrices, but weakly correlated with climatic distance matrices. Similarly, Sun et al. [40] suggested that the phenotypic variation of acorns was significantly correlated with geographical matrices but had very low correlation with climate matrices. However, Martínez-Díaz et al. [58] concluded that fatty acid composition of Jatropha curcas was mostly correlated with climatical differences and not with geographic differences. The percentage of unsaturated fatty acids of J. curcas variation among populations ranged from 74.95% to 77.68% [58], while the value of unsaturated fatty acids of C. oleifera was over 90% [2,48]. In terms of differences among species, it is likely that species with higher unsaturated fatty acids levels possess adaptability and high plasticity of traits [9,10]. Ghebretinsae et al. [59] observed that the combined effect of multiple abiotic factors had the most impact on the variation of fruit traits. Among these factors, soil conditions (soil nitrogen concentration and soil water content) can have a significant impact on the variation of fruit traits [60].

5. Conclusions

Our synthetical study of both phenotypic characters and fatty acid composition revealed extensive diversity among the 18 Camellia oleifera populations. We found that the variation pattern of Camellia oleifera along the various geographic areas could be subdivided into continuous, regional, and random variations. Further analysis of the influence of environmental factors on Camellia oleifera fruit morphology and fatty acid composition showed ELAT and MAT are the main environmental indicators. These results could help predict the adaptation strategy of Camellia oleifera to climate change. In order to achieve high yield efficiently, we can regulate the phenotypic characters and fatty acid composition of Camellia oleifera fruit by controlling the environmental factors. Future studies should further explore the effects of various environmental factors (climate, geography, and soil composition) and genotypes on fruit morphology and fatty acid composition of Camellia oleifera.

Author Contributions

Investigation, B.W., F.L., J.Z., J.Y., S.X., F.Z. and D.Y.; Methodology, S.G., J.Y. and S.X.; Writing—original draft, S.G.; Writing—review & editing, J.M., F.Z. and D.Y. All authors have read and agreed to the published version of the manuscript.

Funding

The project was partly supported by the Major Scientific and Technological Special Program in Changsha City (No. kq2102007-02) and the Natural Science Foundation of Hunan Province (No. 2021JJ31157).

Institutional Review Board Statement

Not applicable.

Informed Consent Statement

Not applicable.

Data Availability Statement

The data in this study are available in presented Tables.

Conflicts of Interest

The authors declare no conflict of interest.

References

  1. Zhang, W.; Zhao, Y.L.; Yang, G.Y.; Peng, J.; Chen, S.W.; Xu, Z.G. Determination of the evolutionary pressure on Camellia oleifera on Hainan Island using the complete chloroplast genome sequence. PeerJ 2019, 7, e7210. [Google Scholar] [CrossRef]
  2. Yuan, J.; Han, Z.Q.; He, S.Y.; Huang, L.Y.; Zhou, N.F. Investigation and cluster analysis of main morphological and economical characters for oil tea resource in Hainan province. J. Plant Genet. Resour. 2014, 15, 1380–1384. [Google Scholar]
  3. Lin, P.; Wang, K.L.; Zhou, C.F.; Xie, Y.H.; Yao, X.H.; Yin, H.F. Seed transcriptomics analysis in Camellia oleifera uncovers genes associated with oil content and fatty acid composition. Int. J. Mol. Sci. 2018, 19, 118. [Google Scholar] [CrossRef]
  4. Fang, X.Z.; Du, M.H.; Luo, F.; Jin, Y.F. Physicochemical properties and lipid composition of Camellia fruit oil (Camellia oleifera Abel.) extracted using different methods. Food Sci. Technol. Res. 2015, 21, 779–785. [Google Scholar] [CrossRef]
  5. Luan, F.; Zeng, J.S.; Yang, Y.; He, X.R.; Wang, B.J.; Gao, Y.B.; Zeng, N. Recent advances in Camellia oleifera Abel: A review of nutritional constituents, biofunctional properties, and potential industrial applications. J. Funct. Foods 2020, 75, 104242. [Google Scholar] [CrossRef]
  6. McKevith, B. Nutritional aspects of oilseeds. Nutr. Bull. 2005, 30, 13–26. [Google Scholar] [CrossRef]
  7. Sales-Campos, H.; Souza, P.R.; Peghini, B.C.; da Silva, J.S.; Cardoso, C.R. An overview of the modulatory effects of oleic acid in health and disease. Mini Rev. Med. Chem. 2013, 13, 201–210. [Google Scholar] [PubMed]
  8. Farvid, M.S.; Ding, M.; Pan, A.; Sun, Q.; Chiuve, S.E.; Steffen, L.M.; Willett, W.C.; Hu, F.B. Dietary linoleic acid and risk of coronary heart disease: A systematic review and meta-analysis of prospective cohort studies. Circulation 2014, 130, 1568–1578. [Google Scholar] [CrossRef]
  9. Zhang, J.L.; Zhang, S.B.; Zhang, Y.P.; Kitajima, K. Effects of phylogeny and climate on seed oil fatty acid composition across 747 plant species in China. Ind. Crops Prod. 2015, 63, 1–8. [Google Scholar] [CrossRef]
  10. Yang, C.Y.; Liu, X.M.; Chen, Z.Y.; Lin, Y.S.; Wang, S.Y. Comparison of oil content and fatty acid profile of ten new Camellia oleifera cultivars. J. Lipids 2016, 2016, 3982486. [Google Scholar] [CrossRef]
  11. Munasinghe, M.; Wansapala, J. Study on variation in seed morphology, oil content and fatty acid profile of Madhuca longifolia grown in different agro-climatic zones in Sri Lanka. Sci. Res. 2015, 3, 105–109. [Google Scholar] [CrossRef] [Green Version]
  12. Ruraż, K.; Piwowarczyk, R.; Gajdoš, P.; Krasylenko, Y.; Certík, M. Fatty acid composition in seeds of holoparasitic Orobanchaceae from the Caucasus region: Relation to species, climatic conditions and nutritional value. Phytochemistry 2020, 179, 112510. [Google Scholar] [CrossRef]
  13. Li, Y.; Li, S.; Lu, X.H.; Wang, Q.Q.; Han, H.Y.; Zhang, X.M.; Ma, Y.H.; Gan, X.H. Leaf phenotypic variation of endangered plant Tetracentron sinense Oliv. and influence of geographical and climatic factors. J. For. Res. 2021, 32, 623–636. [Google Scholar] [CrossRef]
  14. Abdelghany, A.M.; Zhang, S.; Azam, M.; Shaibu, A.S.; Feng, Y.; Li, Y.; Tian, Y.; Hong, H.; Li, B.; Sun, J. Profiling of fruit fatty acid composition in 1025 Chinese soybean accessions from diverse ecoregions. Crop J. 2022, 8, 635–644. [Google Scholar] [CrossRef]
  15. Kumar, V.; Rani, A.; Solanki, S.; Hussain, S.M. Influence of growing environment on the biochemical composition and physical characteristics of soybean fruit. J. Food Compos. Anal. 2006, 19, 188–195. [Google Scholar] [CrossRef]
  16. Song, W.W.; Yang, R.P.; Wu, T.T.; Wu, C.X.; Sun, S.; Zhang, S.W.; Jiang, B.J.; Tian, S.Y.; Liu, X.B.; Han, T.F. Analyzing the effects of climate factors on soybean protein, oil contents, and composition by extensive and high-density sampling in China. J. Agric. Food Chem. 2016, 64, 4121–4130. [Google Scholar] [CrossRef]
  17. Aslam, M.N.; Nelson, M.N.; Kailis, S.G.; Bayliss, K.L.; Speijers, J.; Cowling, W.A. Canola oil increases in polyunsaturated fatty acids and decreases in oleic acid in drought-stressed Mediterranean-type environments. Plant Breed. 2009, 128, 348–355. [Google Scholar] [CrossRef]
  18. Singer, S.D.; Zou, J.; Weselake, R.J. Abiotic factors influence plant storage lipid accumulation and composition. Plant Sci. 2016, 243, 1–9. [Google Scholar] [CrossRef] [PubMed]
  19. Mostafavi, S.; Asadi-Gharneh, H.A.; Miransari, M. The phytochemical variability of fatty acids in basil seeds (Ocimum basilicum L.) affected by genotype and geographical differences. Food Chem. 2019, 276, 700–706. [Google Scholar] [CrossRef]
  20. Yaklich, R.W.; Vinyard, B.; Camp, M.; Douglass, S. Analysis of fruit protein and oil from soybean northern and southern region uniform tests. Crop Sci. 2002, 42, 1504–1515. [Google Scholar] [CrossRef]
  21. Wu, T.T.; Yang, X.S.; Sun, S.; Wang, C.J.; Wang, Y.; Jia, H.C.; Man, W.Q.; Fu, L.S.; Song, W.W.; Wu, C.X.; et al. Temporal–spatial characterization of fruit proteins and oil in widely grown soybean cultivars across a century of breeding in China. Crop Sci. 2017, 57, 748–759. [Google Scholar] [CrossRef]
  22. Alcántara-Ayala, O.; Oyama, K.; Ríos-Muñoz, C.A.; Rivas, G.; Ramirez-Barahona, S.; Luna-Vega, I. Morphological variation of leaf traits in the Ternstroemia lineata species complex (Ericales: Penthaphylacaceae) in response to geographic and climatic variation. PeerJ 2020, 8, e8307. [Google Scholar] [CrossRef] [PubMed]
  23. Zhang, H.; Yang, X.Q.; Yu, M.K.; Han, Y.Z.; Wu, T.G. Variations in seed size and seed mass related to tree growth over 5 years for 23 provenances of Quercus acutissima from across China. J. For. Res. 2017, 28, 917–923. [Google Scholar] [CrossRef]
  24. Wirth, L.R.; Graf, R.; Gugerli, F.; Landergott, U.; Holderegger, R. Between-year variation in fruit weights across altitudes in the high-alpine plant Eritrichium nanum. Plant Ecol. 2010, 207, 227–231. [Google Scholar] [CrossRef]
  25. Yi, F.Y.; Wang, Z.R.; Baskin, C.C.; Baskin, J.M.; Ye, R.H.; Sun, H.L.; Zhang, Y.Y.; Ye, X.H.; Liu, G.F.; Yang, X.J.; et al. Seed germination responses to seasonal temperature and drought stress are species-specific but not related to fruit size in a desert steppe: Implications for effect of climate change on community structure. Ecol. Evol. 2019, 9, 2149–2159. [Google Scholar] [CrossRef] [PubMed]
  26. Peng, S.F.; Chen, Y.Z.; Zhang, R.Q.; Yang, X.H.; Wang, X.N.; Lu, J. Classification of Fruit Shape and Color and Analysis of the Economic Traits of Oil-tea Camellia. J. Cent. South Univ. For. Technol. 2018, 27, 33–39. [Google Scholar]
  27. Qi, J.M.; Zhang, P.; Xi, R.C.; Gao, L.; Lu, C. Genetic variation and correlation analysis of fruit characters of Camellia gauchowensis Chang. J. Cent. South Univ. For. Technol. 2018, 38, 108–113. [Google Scholar]
  28. Zhong, F.X.; Wang, R.H.; Liao, W.T.; Li, T.; Zhou, Y.J. Effects of environmental factors on fruit diameter growth in Camellia oleifera at high temperature and less rain period. Nonwood For. Res. 2015, 33, 50–55. [Google Scholar]
  29. Su, S.; Wu, J.; Peng, X.Y.; Li, B.; Li, Z.J.; Wang, W.; Ni, J.W.; Xu, X.Q. Genetic and agro-climatic variability in seed fatty acid profiles of Akebia trifoliata (Lardizabalaceae) in China. J. Food Compos. Anal. 2021, 102, 104064. [Google Scholar] [CrossRef]
  30. Fang, H.; Bai, H. Cultural distribution and site classification for Camellia oleifera. Sci. Silvae Sin. 2002, 38, 64–72. [Google Scholar]
  31. Ma, Y.X.; Wang, S.X.; Liu, X.J.; Yu, H.Y.; Dan, Y.; Li, G.T.; Wang, L.B. Oil content, fatty acid composition and biodiesel properties among natural provenances of Siberian apricot (Prunus sibirica L.) from China. GCB Bioenergy 2021, 13, 112–132. [Google Scholar] [CrossRef]
  32. Wang, B.F.; Zou, F.; Yuan, D.Y.; Yuan, J.; Xiao, S.X.; Gao, C.; Li, Z.; Peng, X.B. Comprehensive evaluation of fruit economic character and premium species selection of Camellia oleifera in Hainan. J. Fujian Agric. For. Univ. 2016, 45, 156–161. [Google Scholar]
  33. Liu, J.F.; Deng, Y.P.; Wang, X.F.; Ni, Y.Y.; Wang, Q.; Xiao, W.F.; Lei, J.P.; Jiang, Z.P.; Li, M.H. The concentration of non-structural carbohydrates, N, and P in Quercus variabilis does not decline toward its northernmost distribution range along a 1500 km transect in China. Front. Plant Sci. 2018, 9, 1444. [Google Scholar] [CrossRef]
  34. Hijmans, R.J.; Cameron, S.E.; Parra, J.L.; Jones, P.G.; Jarvis, A. Very high resolution interpolated climate surfaces for global land areas. Int. J. Climatol. 2005, 25, 1965–1978. [Google Scholar] [CrossRef]
  35. Slave, C. Using arcmap to create a cadastral database. Case study. J. Inf. Syst. Oper. Manag. 2018, 12, 180–190. [Google Scholar]
  36. Alena, J.; Gösta, E.; Ingegerd, D.; Jan, I. Studies on frost hardiness of Pinus contorta Dougl. seedlings grown in climate chambers. Studia For. Suec. 1981, 157, 4–47. [Google Scholar]
  37. Zhang, F.H.; Li, Z.; Zhou, J.Q.; Gu, Y.Y.; Tan, X.F. Comparative study on fruit development and oil synthesis in two cultivars of Camellia oleifera. BMC Plant Biol. 2021, 21, 348. [Google Scholar] [CrossRef] [PubMed]
  38. Liu, G.F.; Zang, R.G.; Liu, H.; Bai, Z.Q.; Guo, Z.J.; Ding, Y. Geographic variation of seed morphological traits of Picea schrenkiana var. tianschanica in Tianshan Mountains, Xinjiang of Northwest China. Chin. J. Appl. Ecol 2012, 23, 1455–1461. [Google Scholar]
  39. Smith, I.M.; Forbes, A.B. Algorithms and software for fitting polynomial functions constrained to pass through the origin. J. Phys. Conf. Ser. 2018, 1065, 212022. [Google Scholar] [CrossRef]
  40. Sun, J.C.; Shi, W.S.; Wu, Y.Y.; Ji, J.; Feng, J.; Zhao, J.B.; Shi, X.R.; Du, C.J.; Chen, W.; Liu, J.F.; et al. Variations in Acorn Traits in Two Oak Species: Quercus mongolica Fisch. ex Ledeb. and Quercus variabilis Blume. Forests 2021, 12, 1755. [Google Scholar] [CrossRef]
  41. Lepš, J.; Šmilauer, P. Multivariate Analysis of Ecological Data Using Canoco; Cambridge University Press: Cambridge, UK, 2003; p. 282. [Google Scholar]
  42. Li, H.C.; Gan, X.H.; Zhang, Z.P.; Zhang, C.; Song, L. Effects of altitudes and the DBH of seed trees on biological characteristics of Tetracentron sinense (Tetracentraceae) seeds. Plant Divers. Resour. 2015, 37, 177–183. [Google Scholar]
  43. Poljak, I.; Idžojti’c, M.; Šapi’c, I.; Korijan, P.; Vukeli’c, J. Diversity and structure of Croatian continental and Alpine-Dinaric populations of grey alder (Alnus incana L./Moench subsp. incana): Isolation by distance and environment explains phenotypic divergence. Sumar. List 2018, 142, 19–32. [Google Scholar]
  44. Chen, C.J.; Chen, H.; Zhang, Y.; Thomas, H.R.; Frank, M.H.; He, Y.H.; Xia, R. TBtools: An integrative toolkit developed for interactive analyses of big biological data. Mol. Plant 2020, 13, 1194–1202. [Google Scholar] [CrossRef]
  45. Yang, L.R.; Zhang, Z.L.; Chen, J.L.; Cheng, X.; Ji, Q.M.; Zhang, D.J. The quantitative characters and diversity of oil tea fruit in Hainan province. Nonwood For. Res. 2018, 36, 69–76. [Google Scholar]
  46. Zhang, Y.Z.; Li, Y.Q.; Lin, M.; Liu, Y.J.; Ding, X.G.; Cai, J. Variation analysis of fruit characteristics in Camellia gauchowensis. Nonwood For. Res. 2014, 32, 1–8. [Google Scholar]
  47. Zhou, W.C.; Wang, Z.W.; Dong, L.; Wen, Q.; Huang, W.Y.; Li, T.; Ye, J.S.; Xu, L.A. Analysis on the character diversity of fruit and seed of Camellia chekiangoleosa. J. Nanjing For. Univ. 2021, 45, 51–59. [Google Scholar]
  48. Yang, L.; Gao, C.; Xie, J.J.; Qiu, J.; Deng, Q.E.; Zhou, Y.C.; Liao, D.S.; Deng, C.Y. Fruit economic characteristics and yields of 40 superior Camellia oleifera Abel plants in the low-hot valley area of Guizhou Province, China. Sci. Rep. 2022, 12, 7068. [Google Scholar] [CrossRef] [PubMed]
  49. Zhang, L.J.; Lu, X.J.; Zhou, Q.; Deng, J.F. Morphological Variability between Geographical Provenances of Walnut Fruit (Juglans mandshurica) in the Eastern Liaoning Province, PR China. Pol. J. Environ. Stud. 2021, 30, 4353–4364. [Google Scholar] [CrossRef]
  50. Liang, S.; Rong, X.; Sai, L.; Chen, J.; Xu, C.Q.; Xie, C.X.; Liu, T.N. Phenotypic variation of seed traits of Haloxylon ammodendron and its affecting factors. Biochem. Syst. Ecol. 2015, 60, 81–87. [Google Scholar] [CrossRef]
  51. Sun, C.W.; Wang, J.W.; Duan, J.; Zhao, G.C.; Weng, X.H.; Jia, L.M. Association of fruit and seed traits of Sapindus mukorossi germplasm with environmental factors in Southern China. Forests 2017, 8, 491. [Google Scholar] [CrossRef]
  52. Sarikhani, S.; Arzani, K.; Roozban, M.R. Correlations of certain high heritability horticultural traits in Persian walnut (Juglans regia L.). Acta Hortic. 2014, 1050, 61–68. [Google Scholar] [CrossRef]
  53. Li, Z.X.; Wang, W.H.; Zhang, H.X.; Liu, J.H.; Shi, B.Y.; Dai, W.Z.; Liu, K.W.; Zhang, H.G. Diversity in Fruit Morphology and Nutritional Composition of Juglans mandshurica Maxim in Northeast China. Front. Plant Sci. 2022, 13, 820457. [Google Scholar] [CrossRef]
  54. She, C.Q.; Fang, S.Z.; Yang, W.X. Geographical variation of morphologic characteristics of Cyclocarya paliurus seeds. J. Nanjing For. Univ. 2008, 32, 63–66. [Google Scholar]
  55. Wu, Y.H.; Fan, Z.L.; Li, J.; Guo, J.H.; Guo, Y.K.; Wang, Y.L. Phenotypic diversity of seeds and fruits in natural populations of Acer ginnala in China. Guihaia 2018, 38, 795–803. [Google Scholar]
  56. Mustiga, G.M.; Morrissey, J.; Stack, J.C.; DuVal, A.; Royaert, S.; Jansen, J.; Bizzotto, C.; Villela-Dias, C.; Mei, L.; Cahoon, E.B.; et al. Identification of climate and genetic factors that control fat content and fatty acid composition of Theobroma cacao L. beans. Front. Plant Sci. 2019, 10, 1159. [Google Scholar] [CrossRef] [PubMed]
  57. Rouina, Y.B.; Zouari, M.; Zouari, N.; Rouina, B.B.; Bouaziz, M. Olive tree (Olea europaea L. cv. Zelmati) grown in hot desert climate: Physio-biochemical responses and olive oil quality. Sci. Hortic. 2020, 261, 108915. [Google Scholar] [CrossRef]
  58. Martínez-Díaz, Y.; González-Rodríguez, A.; Rico-Ponce, H.R.; Rocha-Ramírez, V.; Ovando-Medina, I.; Espinosa-García, F.J. Fatty acid diversity is not associated with neutral genetic diversity in native populations of the biodiesel plant Jatropha curcas L. Chem. Biodivers 2017, 14, e1600188. [Google Scholar] [CrossRef] [PubMed]
  59. Ghebretinsae, A.G.; Graham, S.A.; Camilo, G.R.; Barber, J.C. Natural infraspecific variation in fatty acid composition of Cuphea (Lythraceae) seed oils. Ind. Crops Prod. 2008, 27, 279–287. [Google Scholar] [CrossRef]
  60. Sun, C.W.; Jia, L.M.; Xi, B.Y.; Wang, L.C.; Weng, X.H. Natural variation in fatty acid composition of Sapindus spp. seed oils. Ind. Crops Prod. 2017, 102, 97–104. [Google Scholar] [CrossRef]
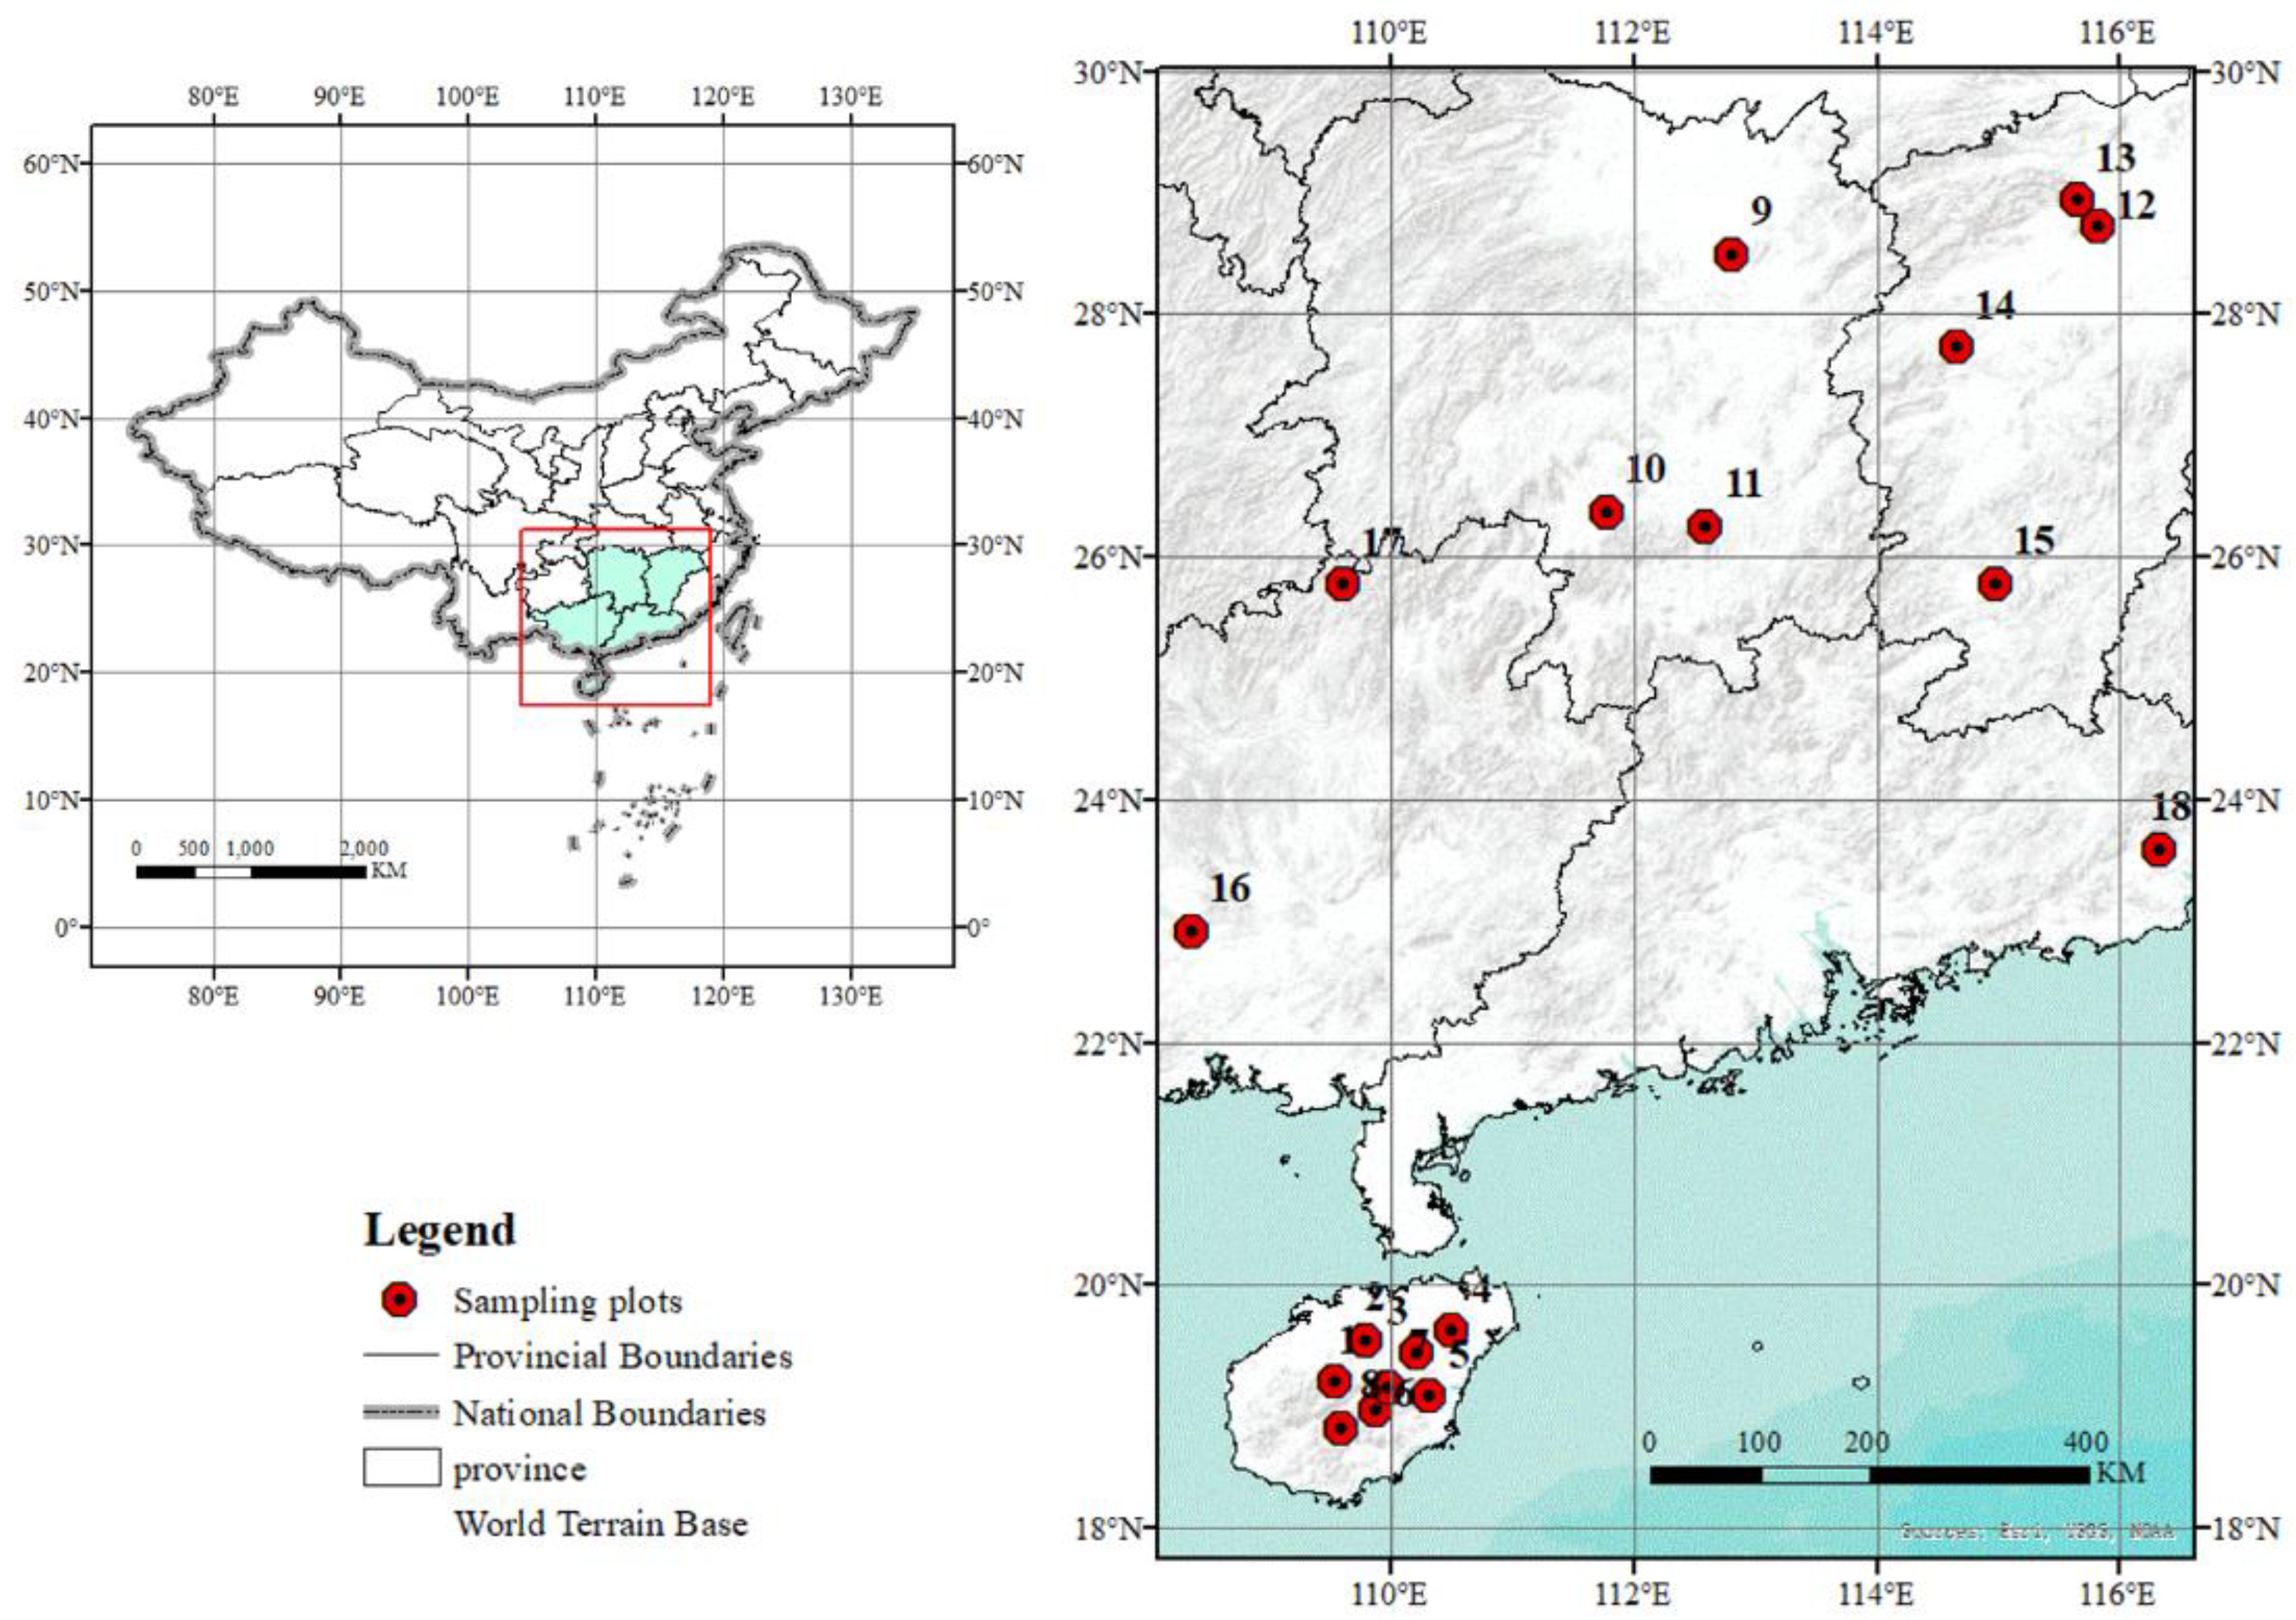
Figure 1. Location of the collected samples, covering the geographical distribution of Camellia oleifera in southern China.
Horticulturae 08 00818 g001
Figure 2. Heatmap of fruit morphology and fatty acid composition in Camellia oleifera. Fruit morphology and fatty acid data were scaled by subtracting the values from the mean. Thus, positive values (red) indicate above the mean, and negative values (blue) indicate below the mean. FL, fruit length; FW, fruit width; OA, oleic acid; LOA, linoleic acid; LNA, linolenic acid; PA, palmitic acid; SA, stearic acid. Different numbers represent different sites shown in Table 1.
Horticulturae 08 00818 g002
Figure 3. Relationship between fruit width (FW), fruit length (FL), FL/FW ratio, oleic acid (OA), linoleic acid (LOA), linolenic acid (LNA), palmitic acid (PA), and stearic acid (SA) with geographic and climatic factors in 18 populations of Camellia oleifera. AP, annual precipitation; ELAT, equivalent latitude; LON, longitude; MAT, annual mean air temperature; MTW, maximum temperature of warmest month; PWQ, precipitation of wettest quarter.
Horticulturae 08 00818 g003
Figure 4. Principal components analysis (PCA) ordination diagram based on the morphological variables and fatty acid composition of Camellia oleifera. FL, fruit length; FW, fruit width; OA, oleic acid; LOA, linoleic acid; LNA, linolenic acid; PA, palmitic acid; SA, stearic acid. Different numbers represent the different sites that are shown in Table 1.
Horticulturae 08 00818 g004
Figure 5. Hierarchical tree dendrogram of the 18 populations of Camellia oleifera based on fatty acid composition and fruit phenotypic characteristics.
Horticulturae 08 00818 g005
Table 1. The geographical and climatic variables of the 18 study sites of Camellia oleifera in south China.
SiteSite Location, ProvinceCodeLON
(° E)
LAT
(° N)
ALT
(m)
MAT
(°C)
MTW
(°C)
AP
(mm)
PWQ
(mm)
ELAT
(°)
1Baisha City, HainanBSH109.5419.2121023.7231.44159777318.76
2Chengmai City, HainanCMH109.7819.5615723.9332.11173983018.84
3Dingan City, HainanDAH110.2119.4511024.1332.16171378418.50
4Haikou City, HainanHKH110.5019.634124.1432.28174378418.34
5Qionghai City, HainanQHH110.3119.096024.7232.44166978017.89
6Qiongzhong City, HainanQZH109.8618.9835223.3130.59165480019.35
7Tunchang City, HainanTCH109.9819.1621723.6731.21167680018.75
8Wuzhishan City, HainanWZH109.5818.8374822.0528.90158178822.03
9Changsha City, HunanCSH112.8128.5134.517.4532.79134757527.18
10Yongzhou City, HunanYZH111.7726.38163.118.2033.17136859325.70
11Hengyang City, HunanHYH112.5926.27115.318.4333.68142261825.35
12Nanchang City, JiangxiNCJ115.8228.7429.317.7633.49157273427.39
13Jiujiang City, JiangxiJJJ115.6528.9525.917.4033.29149869627.58
14Xinyu City, JiangxiXYJ114.6527.74129.516.9732.08154068026.89
15Ganzhou City, JiangxiGZJ114.9825.79249.619.0833.32148162325.54
16Nanning City, GuangxiNNG108.3522.92117.221.1631.61148070522.01
17Liuzhou City, GuangxiLZG109.6025.79182.618.1831.98151270925.20
18Jieyang City, GuangdongJYG116.3323.601221.7532.02154666122.16
ELAT, equivalent latitude; LON, longitude; LAT, latitude; ALT, altitude; MAT, annual mean air temperature; MTW, maximum temperature of warmest month; AP, annual precipitation; and PWQ, precipitation of wettest quarter.
Table 2. Statistical data of fruit morphology and fatty acid composition of 18 populations of Camellia oleifera.
SiteFL (mm)FW (mm)FL/FWOA (%)LOA (%)LNA (%)PA (%)SA (%)
143.80 cd55.04 b0.80 d78.94 efg7.43 de0.60 efg11.28 bcd1.75 efgh
236.00 h44.34 ef0.81 d79.09 efg7.86 cd0.50 g9.85 cdef2.70 a
340.05 efg46.21 de0.87 cd77.31 g8.75 bcd0.58 fg11.37 bcd1.99 de
436.81 h43.04 fg0.86 cd77.36 g8.33 bcd0.59 fg11.76 bc1.96 def
544.67 cd 44.23 ef1.01 abcd70.21 h13.78 a0.51 g13.89 a1.62 gh
646.44 c51.88 c0.90 cd70.30 h14.26 a0.98 ab12.80 ab1.66 fgh
741.58 def50.11 c0.83 cd77.62 fg8.56 bcd0.58 fg11.09 bcd2.16 cd
841.62 def46.82 d0.89 cd80.37 defg5.87 ef0.61 efg11.18 bcd1.97 def
953.47 b43.00 fg1.24 a84.57 a6.83 def0.86 bc7.63 fg0.12 i
1042.95 de37.11 hi1.16 ab81.05 cde8.00 cd1.01 a7.89 fg2.04 de
1136.53 h42.16 fg0.87 cd85.23 ab5.03 f0.81 cd6.93 g2.01 de
1237.76 gh35.42 i1.07 abc83.7 bc7.09 de0.71 def8.34 efg0.16 i
1330.16 i30.33 j0.99 bcd80.28 defg8.81 bcd0.74 cde8.36 efg1.8 efg
1442.47 de42.74 g0.99 bcd78.87 efg10.24 b0.71 def8.35 efg1.82 efg
1542.55 de41.54 g1.02 abcd80.83 cdef9.75 bc0.18 h9.16 def0.08 i
1638.92 fgh36.9 hi1.05 abcd83.5 bc5.02 f0.20 h9.82 cdef1.46 h
1738.54 fgh38.22h1.01 abcd82.95 bcd5.13 f0.16 h9.21 def2.55 ab
1860.77 a68.26 a0.89 cd78.66 efg8.14 cd0.22 h10.24 cde2.35 bc
Max60.77 68.26 1.24 85.23 14.26 1.01 13.89 2.70
Min30.16 30.33 0.80 70.21 5.02 0.16 6.93 0.08
Mean41.95 44.30 0.96 79.49 8.27 0.59 9.95 1.68
SD6.63 8.25 0.12 4.05 2.52 0.25 1.84 0.76
CV/%15.81 18.63 12.51 5.09 30.42 43.27 18.53 45.24
FL, fruit length; FW, fruit width; OA, oleic acid; LOA, linoleic acid; LNA, linolenic acid; PA, palmitic acid; SA, stearic acid. Different letters in a column indicate significant differences at p ≤ 0.05.
Table 3. Correlation between the environmental factors and morphological characteristics of Camellia oleifera populations.
LON (° E)ELAT (°)ALT (m)MAT (°C)MTW (°C)AP (mm)PWQ (mm)
FL0.191−0.070−0.0290.092−0.185−0.193−0.289
FW−0.039−0.516 *0.1440.531 *−0.4380.3120.216
FL/FW0.3090.680 **−0.261−0.675 **0.418−0.728 **−0.697 **
OA0.2610.681 **−0.121−0.682 **0.361−0.661 **−0.598 **
LOA0.070−0.340−0.0400.349−0.0550.4050.294
LNA0.0570.1540.051−0.1660.082−0.149−0.093
PA−0.529 *−0.867 **0.2690.880 **−0.582 *0.763 **0.765 **
SA−0.411−0.4490.1310.392−0.3530.3880.411
AP, annual precipitation; ELAT, equivalent latitude; LON, longitude; MAT, annual mean air temperature; MTW, maximum temperature of warmest month; PWQ, precipitation of wettest quarter; ALT, altitude. ** p ≤ 0.01, * p ≤ 0.05.
Table 4. Correlations between the morphological parameters (FL, FW) and fatty acid composition (OA, LOA, LNA, PA, SA) of Camellia oleifera with climatic (MAT, MTW, AP, PWQ) and geographic (LON, LAT) distance matrices.
Comparisonrp-ValueSignificance
Morphological, Geographic0.3040.0014**
Morphological, Climate0.08260.192ns
Fatty acid composition, Geographic0.2430.0081**
Fatty acid composition, Climate0.2720.0029**
Significance: ns means no significant, ** p ≤ 0.01.
Table 5. Principal component analysis loadings of the morphological and chemical parameters of Camellia oleifera and the contributions of the principal components to the total variance.
Principal ComponentPC1PC2PC3
FL0.3590.3650.831
FW0.715−0.1310.621
FL/FW−0.6070.6590.159
OA−0.905−0.2770.295
LOA0.6870.596−0.293
LNA−0.0670.480−0.416
PA0.8760.021−0.145
SA0.409−0.692−0.192
Eigenvalue3.241.731.50
Variance (%)40.5021.5718.80
% Total Variance40.5062.0780.87
Publisher’s Note: MDPI stays neutral with regard to jurisdictional claims in published maps and institutional affiliations.