Article

Peroxidase Activity in Tomato Leaf Cells under Salt Stress Based on Micro-Hyperspectral Imaging Technique

1
School of Agriculture, Ningxia University, Yinchuan 750021, China
2
Ningxia Modern Facility Horticulture Engineering Technology Research Center, Yinchuan 750021, China
3
Ningxia Hui Autonomous Region Animal Husbandry Workstation, Yinchuan 750021, China
4
Key Laboratory of Quality and Safety of Wolfberry and Wine for State Administration for Market Regulation, Ningxia Food Testing and Research Institute, Yinchuan 750004, China
*
Author to whom correspondence should be addressed.
These authors contributed equally to this work.
Horticulturae 2022, 8(9), 813; https://doi.org/10.3390/horticulturae8090813
Submission received: 16 August 2022 / Revised: 28 August 2022 / Accepted: 29 August 2022 / Published: 5 September 2022
(This article belongs to the Section Biotic and Abiotic Stress)

Abstract

:
Salt stress has become a major problem in the tomato planting process, of which peroxidase (POD) activity is an important parameter reflecting the antioxidant capacity of plants. In order to explore the dynamic changes of catalase in leaves under different concentrations of NaCl stress, it is necessary to establish a rapid detection technology for changes of POD activity in micro-areas of leaves. In this study, a total of 139 microscopic images were obtained under different concentrations of salt stress (0 g/L, 1 g/L, 2 g/L, 3 g/L) in the spectral range of 400–1000 nm. Regions of interest were extracted according to the reflectance of the samples, and the model was established by combining POD activity. Various spectral pre-treatment combined with partial least-squares regression models was compared to original spectrum combined with partial least-squares regression model. The characteristic wavelength was extracted by four methods, and partial least-squares regression (PLSR) and principal component regression (PCR) were established according to the characteristic wavelength. The results show that multiple scattering correction (MSC) is optimized as the pre-treatment method. The partial least-squares regression model based on the interval variable iterative space contraction method is the best, and the coefficient of determination and root mean square error of prediction set (RMSEP) are 0.66 and 18.94 U/g·min, respectively. The results show that it is feasible to detect the peroxidase activity in tomato leaves by micro-hyperspectral imaging combined with stoichiometry.

1. Introduction

Peroxidase (POD) is an enzyme with high activity in plants and is one of the key enzymes in the enzymatic defense system of plants under stress conditions. It acts synergistically with superoxide dismutase (SOD) and catalase (CAT) [1,2,3]. It eliminates toxic elements in cells, removes excess free radicals in the plant, and produces some metabolites needed by cells, thus improving the stress resistance of plants [1]. POD is ubiquitous in plants and is closely related to various important physiological activities of plants. Therefore, the enzyme activity of POD can be used as an evaluation indicator of tomato plant growth [2,3]. POD is closely related to various important physiological activities of tomato plants. POD can convert toxic hydrogen peroxide (H2O2) into harmless H2O with a series of changes in activity, so it is widely used to evaluate the stress tolerance of plants [4,5].
Physical and chemical analysis is often used in traditional POD activity detection. The sample pretreatment and experimental methods are cumbersome, and the detection time is long [4]. Therefore, the spatial distribution of POD in cells and the POD activity cannot be obtained directly. Although transmission electron microscopy (TEM) can observe the cellular tissue of leaves, the sample preparation process is complicated and cannot be applied to the observation of active samples [6]. Cryo-electron microscopy [7,8] and three-dimensional reconstruction techniques [9] can observe and analyze protein morphology and composition, including various membrane structural proteins, protein localization, and qualitative studies, but there are few quantitative studies. In order to quickly determine the changes of catalase activity in subcells, a spectral analysis method was introduced [10], and the characteristic spectrum of catalase molecules was used for identification and quantitative analysis. At present, hyperspectral imaging technology has been widely used in the macroscopic qualitative and quantitative detection of crops due to its non-invasive, rapid, and chemical-free characteristics [11,12,13], but its research in the microscopic field of crop components is limited. The formation, concentration, and spatial distribution of POD enzymes in leaf cells could not be detected, and it was difficult to reveal the microscopic changes in cells.
The microscopic hyperspectral imaging technique (MHSI), as one of the international cutting-edge technologies in cell biology and metabolic process analysis of endogenous substances, combines microscopic imaging with hyperspectral imaging technology to concentrate light beams in micron areas. It has the characteristics of micro-trace detection and high sensitivity and can directly locate and scan the intracellular substances without chemical reagents and complex sample pretreatment. Compared with conventional spectral detection technology, the detection limit is 2–3 orders of magnitude higher, which can accurately analyze changes in cell tissue structure and composition. Therefore, micro-hyperspectral imaging technology can perform a non-invasive detection of catalase in subcellular micro-areas of fresh tissues [14,15].
In recent years, there have been many studies on plant enzyme activity and microscopic imaging techniques, but few studies on POD enzyme activity in plant samples by microscopic hyperspectral techniques. Microscopic hyperspectral imaging technology was used to detect tomato gray mold spores and provide a basis for the research on the real-time monitoring technology of tomato gray mold spores in the greenhouse [16]. Micro-hyperspectral imaging technology and neural network algorithms have been used to establish the visual distribution of matcha grain size, effectively verifying the technical feasibility of micro-hyperspectral imaging technology in cell analysis [17]. However, there are few reports on the detection of catalase activity in tomato leaves by using microhyperspectral imaging technology.
In this study, POD enzyme activity in tomato leaf cells was used as the research object, and microspectral images at 400–1000 nm were collected by using micro-hyperspectral imaging technology. The samples were divided into calibration set and prediction set according to a ratio of 3/1, and then the original spectrum was pretreated to select the best pretreatment method. Continuous projection algorithm (SPA), interval variable iterative space contraction (IVISSA), and variable combination cluster analysis (VCPA) were used to extract characteristic wavelengths. Finally, the regression models of partial least-squares regression and principal component regression under different characteristic wavelengths were compared and analyzed, and the best prediction model was selected to provide theoretical and technical reference for micro-hyperspectral imaging technology in the detection of tomatoes trace components in the future.

2. Materials and Methods

2.1. Materials

The experiment was carried out in the solar greenhouse of Ningxia Helan Horticulture Industrial Park, and the tested variety was “Aofen 1”, provided by Ningxia Helan Tianyuan Seed Company. Seedlings were transplanted at 4 pieces of cotyledon expansion, and substrate cultivation was adopted for planting. After the slow seedling stage was over, a concentration gradient of salt stress was carried out. Tomato plants were irrigated with NaCl solution prepared with 0 g/L (CK), 1 g/L (T1), 2 g/L (T2), and 3 g/L (T3). After two weeks of planting, the upper, middle, and lower leaves of tomato were picked and sliced to obtain micro-hyperspectral samples. The 139 samples were labeled to facilitate spectral collection.

2.2. Preparation of Slices

The preparation of slices was mainly divided into four steps, as follows [18]:
First, tissue fixation: the fresh tissue, transported and stored at low temperature, is fixed by fixation solution for more than 24 h.
Second, dehydration: the tissue is removed from the fixed solution and placed in a refrigerator at 4 °C (15%) sucrose solution for dehydration and sink, then transferred to a refrigerator at 4 °C (30%) sucrose solution for dehydration and sink.
Third, optimal cutting temperature (OCT) embedding: the dehydrated tissue is removed and the surface water is blotted slightly with filter paper. Then a scalpel is used to smooth the tissue of the target part, placing it on the sample tray with the section face upward. OCT embedding agent is dropped around the tissue, and the sample tray is placed on the frozen table of the frozen slicer. After the OCT becomes white and hard, sections can be carried out.
Finally, slicing: Fixing the sample holder on the slicer, the tissue surface is then roughly cut and then cut and pasted on the slide. Slides are labeled and stored at −20 °C for later use.

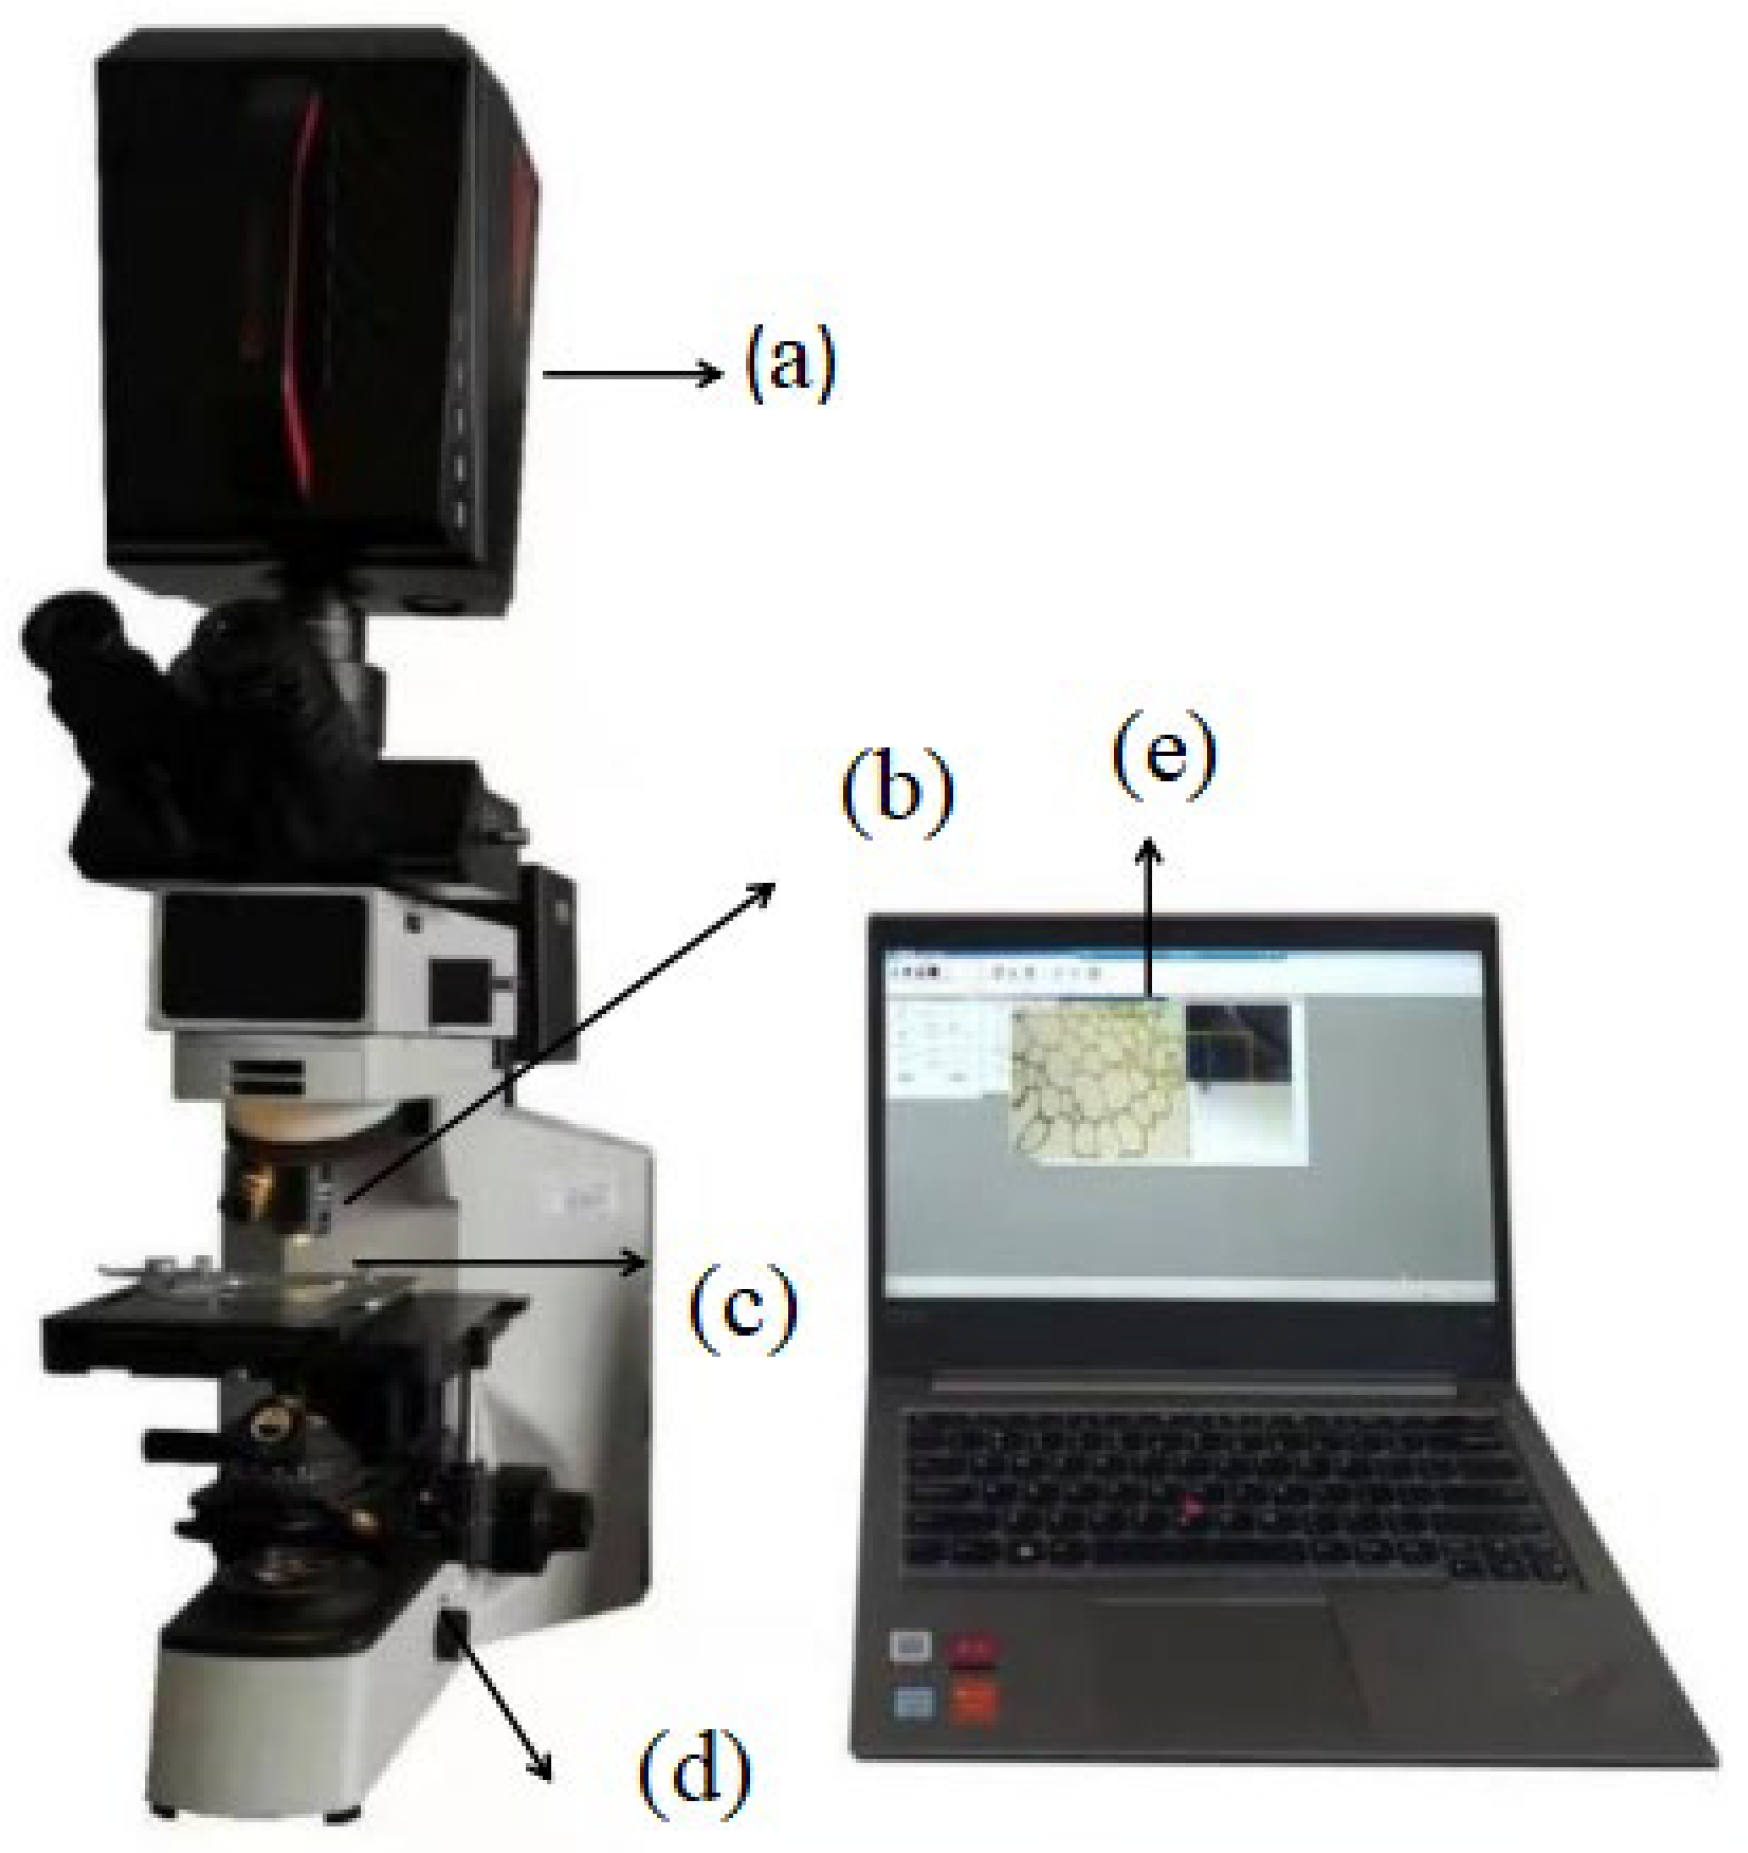
2.3. Acquisition and Correction of Microscopic Hyperspectral Images

Spectral images were obtained using a Gaia Field-Pro-V10 microscopic hyperspectral imaging system and SpecView 2.9.2.10 data acquisition software (Figure 1). In order to obtain clear images without distortion, black-and-white correction and scanning parameter settings were required before spectral image acquisition [19,20]. After several pre-experiment adjustments, the optimal scanning parameters were finally determined as follows: scanning forward speed of 0.1 cm/s, starting position of 0.6 cm, scanning distance of 0.5 cm, exposure time of 1.9 ms, gain of 1, black-and-white correction, as shown in Formula (1):
R = R 0 D W D
where R0 is the original image, D is the blackboard image, W is the white board image, and R is the calibrated hyperspectral image.

2.4. Method for Determination of Peroxidase

First, 0.5 g of clean leaves were weighed in a mortar, 5 mL phosphoric acid buffer was used to grind the tender leaves into pulp, and the slurry was centrifuged at 4000 r/min for 15 min at low temperature, and the upper liquid was taken as the crude enzyme reaction solution, keeping the volume to 25 mL.
The reaction system included 2.9 mL 0.05 mol/L phosphoric acid buffer, 1.0 mL 2% H2O2, 1.0 mL 0.05 mol/L guaiacol, and 0.1 mL enzyme solution. After adding enzyme solution to the reaction system, the absorbance was measured at a wavelength of 470 nm every minute, for a total of four minutes [21]. POD activity of samples was calculated according to Formula (2):
POD   activity = 470 × V T W × V S × 0.01 × t
where VT is the total volume of extract enzyme solution, W is fresh weight of sample, VS is enzyme liquid volume for determination, and t is reaction time.

2.5. Data Analysis

ENVI4.8 software was used to extract regions of interest and spectral data by manual selection. UnscramblerX10.4 software was used to develop the multivariate models, and Matlab2014a was used to realize the extraction and mapping of extracted characteristic wavelengths.
Exploring the relationship between microhyperspectral data and POD activity is the key to microhyperspectral image analysis. Partial least-squares regression (PLSR) and principal component regression (PCR) were used to study the relationship between spectral data and POD content. By comparing the continuous projection algorithm (SPA), variable combination cluster analysis (VCPA), and interval variable iterative space contraction (IVISSA), the characteristic wavelengths related to POD activity in tomato leaves were selected to establish a better model for the practical application of tomato growth safety monitoring.

2.6. Model Evaluation

The model performance was evaluated by correlation coefficient (R), root mean square error of prediction (RMSEP) and residual prediction deviation (RPD). For the fitting degree between the predicted sample value and the real value of the R-reaction model, the larger the R value is, the better the fitting degree and the model are. RMSEP reflects the dispersion degree of samples, and the smaller the RMSEP value is, the better the prediction ability of the reaction model is [22,23]. In general, a good model usually has larger correlation coefficient of calibration (Rc) values and smaller values of principal component number (PCS), correlation coefficient of prediction (Rp), root mean square error of calibration (RMSEC), and RMSEP [24,25]. RPD between 1.5 and 2.5 indicates that the established model can distinguish between high-value and low-value response variables. It is a rough indication that quantitative prediction is feasible, with an RPD above 2.5 corresponding to an outstanding deterministic accuracy. The calculation formula of RPD is shown in Formula (3):
RPD = SD RMSEP  

3. Results

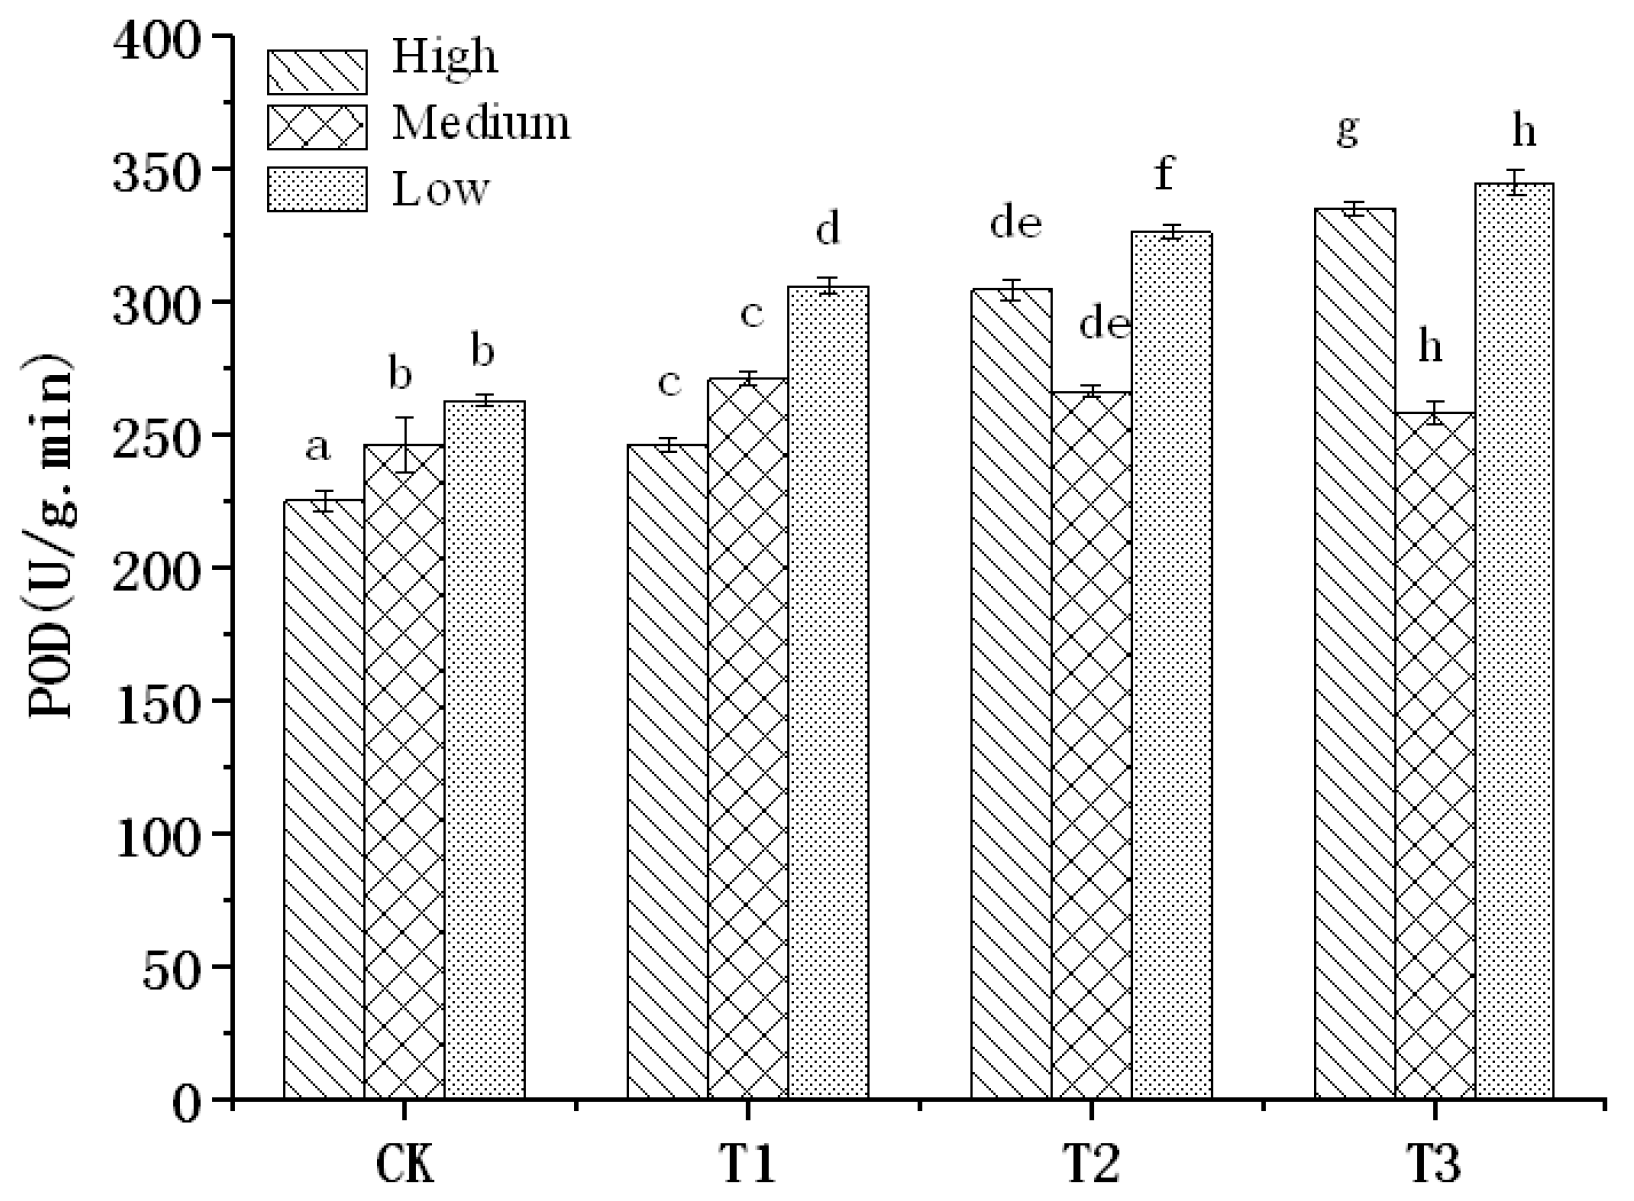
3.1. POD Activity of Tomato Leaves

According to the data in Table 1, it is feasible to use sample set partitioning based on a joint x-y distance (SPXY) method to divide the POD activity values in the samples. For 139 samples of POD activity value of tomato leaves, 2/3 samples were taken as the calibration set and 1/3 samples as the prediction set, and the index values of the prediction set were included in the range of the calibration set. The correction set and prediction set were reasonably divided, which indicated that the selected sample data set was representative. Modeling and analysis can be carried out in the next step. The POD activity of tomato leaves varied with salt stress concentration in Figure 2.
As shown in Figure 2, there was significant difference between each treatment (p < 0.05), but there was also significant difference between leaves in the upper, middle, and lower parts of the plant under each treatment (p < 0.05).
Compared to the CK group, the POD activity of high- and low-level leaves increased gradually with the increase of salt concentration, while the peroxidase activity of middle layer leaves decreased slowly with the increase of salt concentration. When the salt solution was 2 and 3 g/L, the changes of peroxidase activity of different layers leaves were different from those of 0 and 1 g/L, and the peroxidase activity values in descending order was high-, low-, and medium-layer leaves.

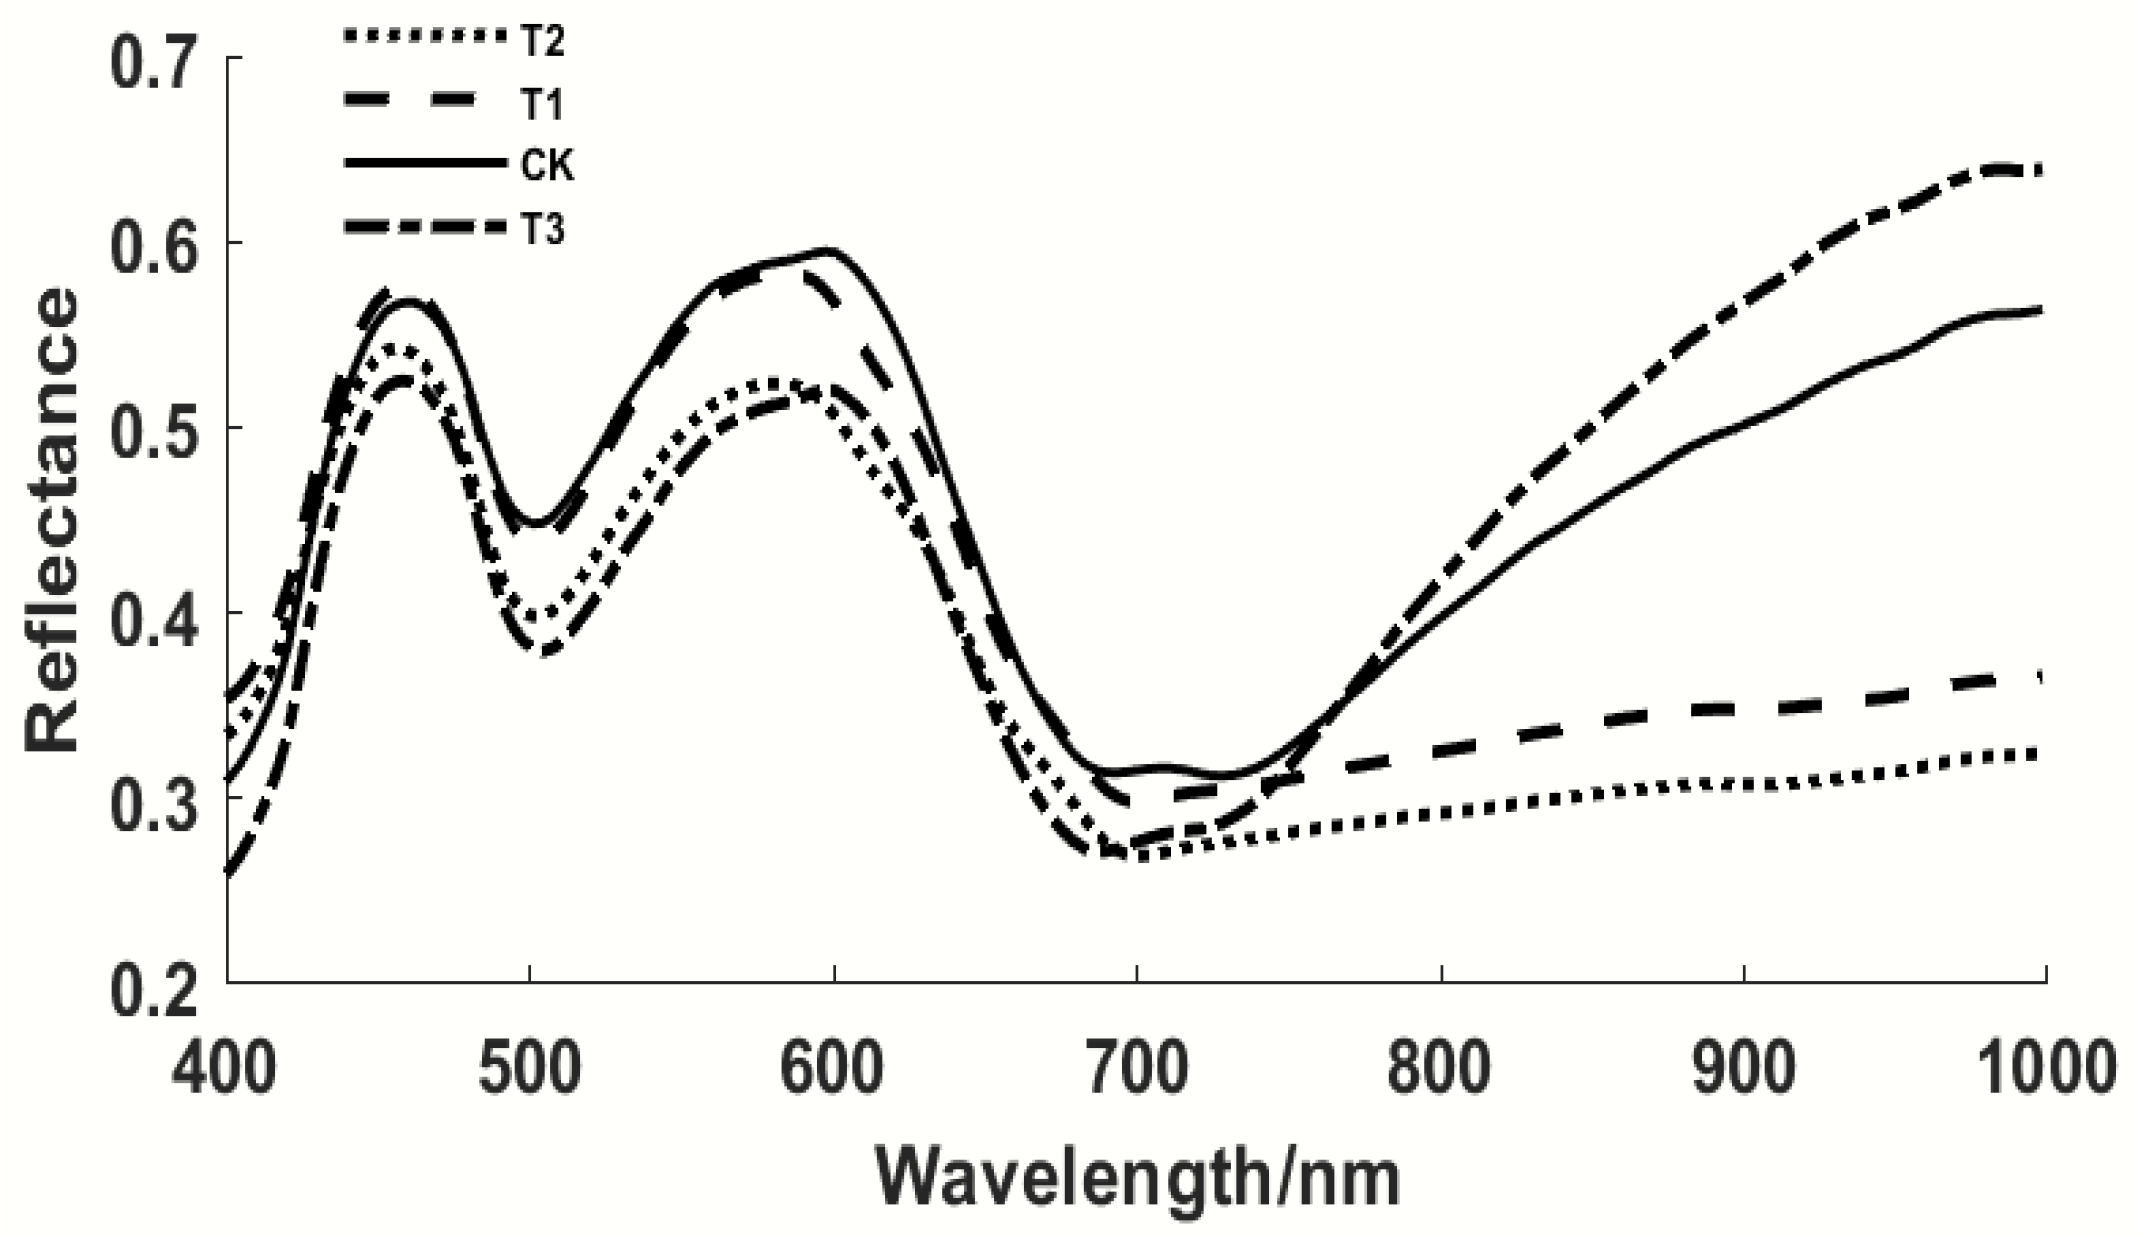
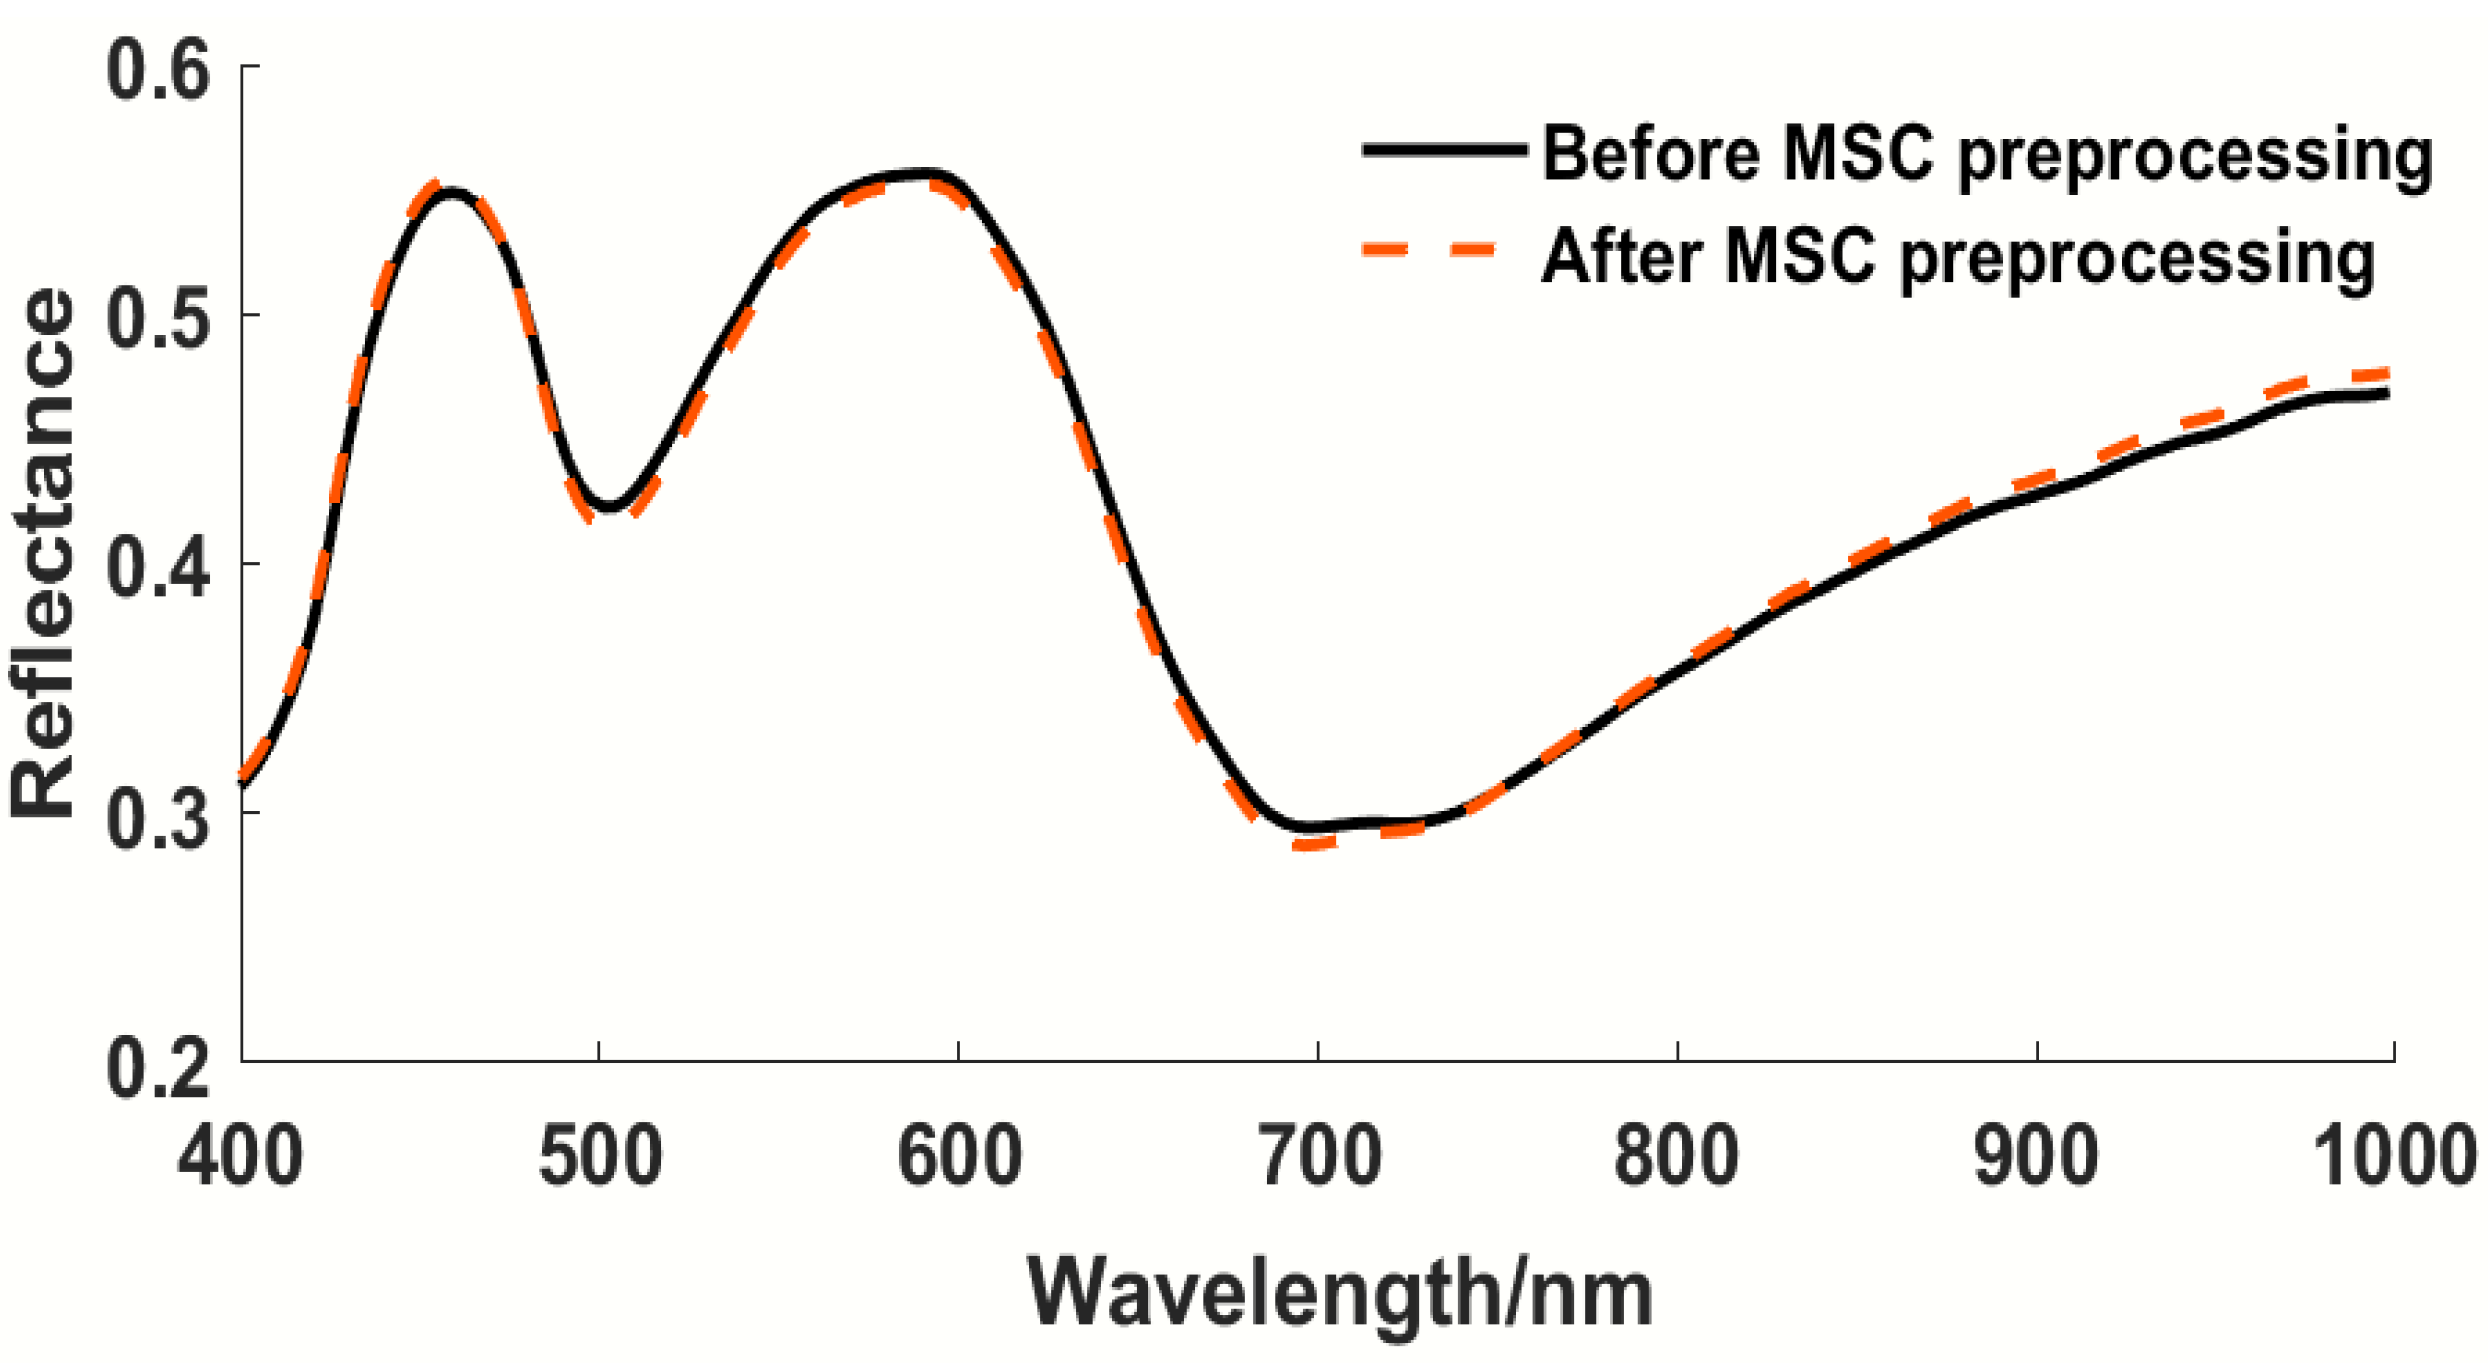
3.2. Spectral Characteristic

Average spectral curves of tomato leaves under four different salt stresses are shown in Figure 3.
As shown in Figure 3, four different spectral reflectance trends and the peaks are similar in the range of 400–1000 nm, but there are certain differences among the peaks. Absorption peaks appeared near 500 nm and 700 nm, which were mainly related to chlorophyll and carotenoid absorption [12].

3.3. Modeling Based on Full Spectrum

In the early stage, in order to obtain a clear image, black-and-white correction was carried out, which eliminated unfavorable factors such as uneven distribution of light source intensity and dark current in the process of image acquisition. However, the background color and stray light of the sample also produced certain errors in the test results. In order to improve the accuracy of the model, it was necessary to process the spectrum. In the comparative analysis, the influence of each variable needed to be fully considered, while the partial square method could comprehensively consider the relationship between variables and could carry out regression modeling under multicollinearity. Therefore, the PLSR model could be used to compare the results of spectral pretreatment. The results are shown in Table 2.
As shown in Table 2, for the POD enzyme activity index of tomato leaves, the PLSR model established after MSC pretreatment of sample values had better model parameters compared with the original data. Rc and Rp values were improved, while RMSEC and RESEP were decreased. Overall, MSC was the best tomato leaf sample pretreatment method (Figure 4).

3.4. Selection of Characteristic Variables

The effective optimal wavelength selection can delete the information irrelevant to the sample composition and extract the characteristic wavelength that best represents the basic information of tomato leaf samples. By extracting characteristic wavelengths with important information, the model can be simplified, and the operation efficiency can be improved. In this experiment, four methods including continuous projection algorithm (SPA), variable combination cluster analysis (VCPA), interval variable iterative space contraction (IVISSA), and combination algorithm were used to extract characteristic wavelengths.

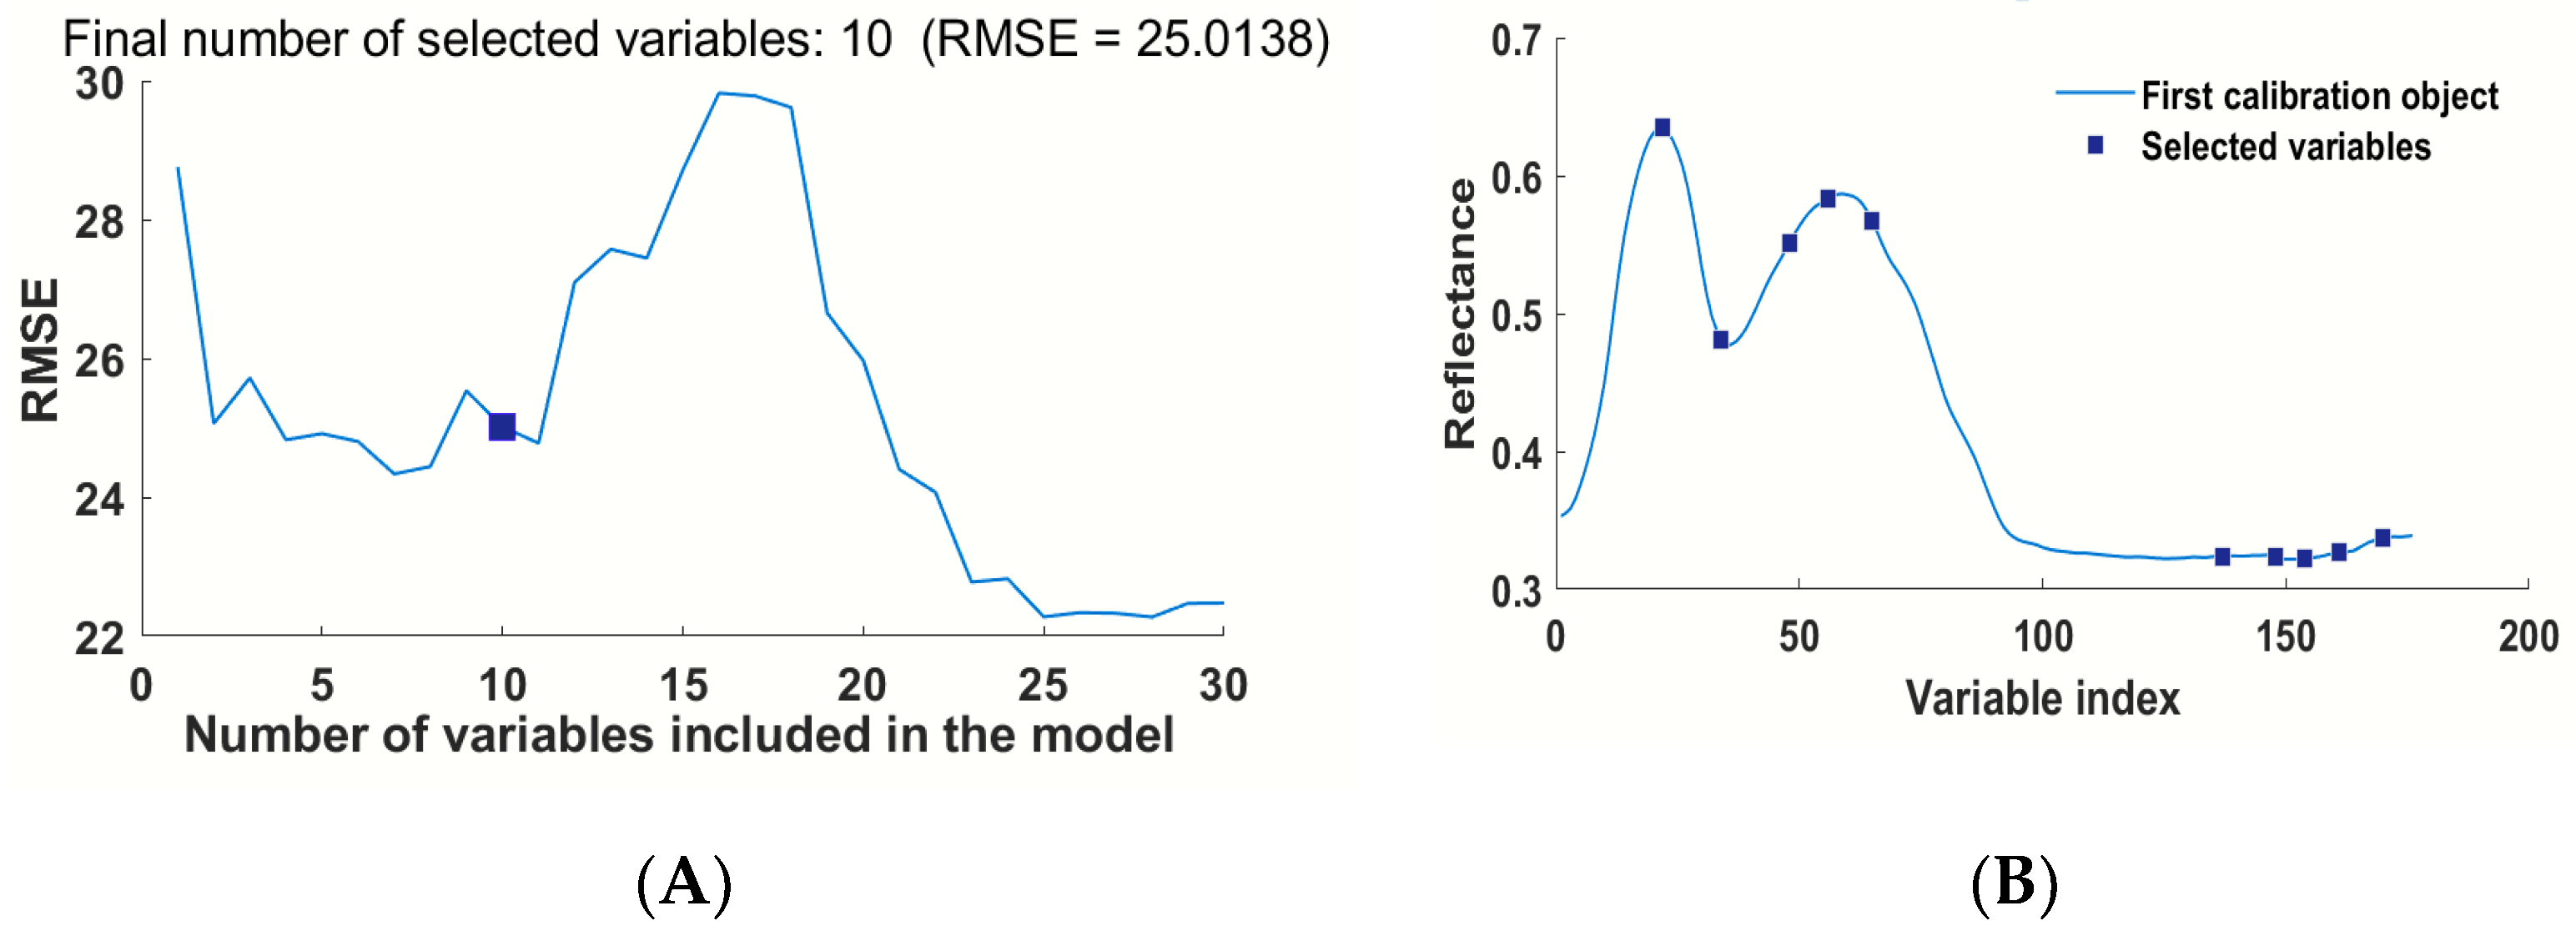
3.4.1. Modeling Based on The Variable Selected by SPA

As can be seen from Figure 5, m-min = 1, m-max = 30, and Figure 5A represent the curve of the RMSE value changing with the number of feature variables. According to the relationship between the minimum REMSE value and the number of feature variables, comprehensive analysis could determine that the number of extracted feature wavelengths is 10, and the RMSE value is 25.01. Figure 5B is the number of 10 bands selected by SPA algorithm.

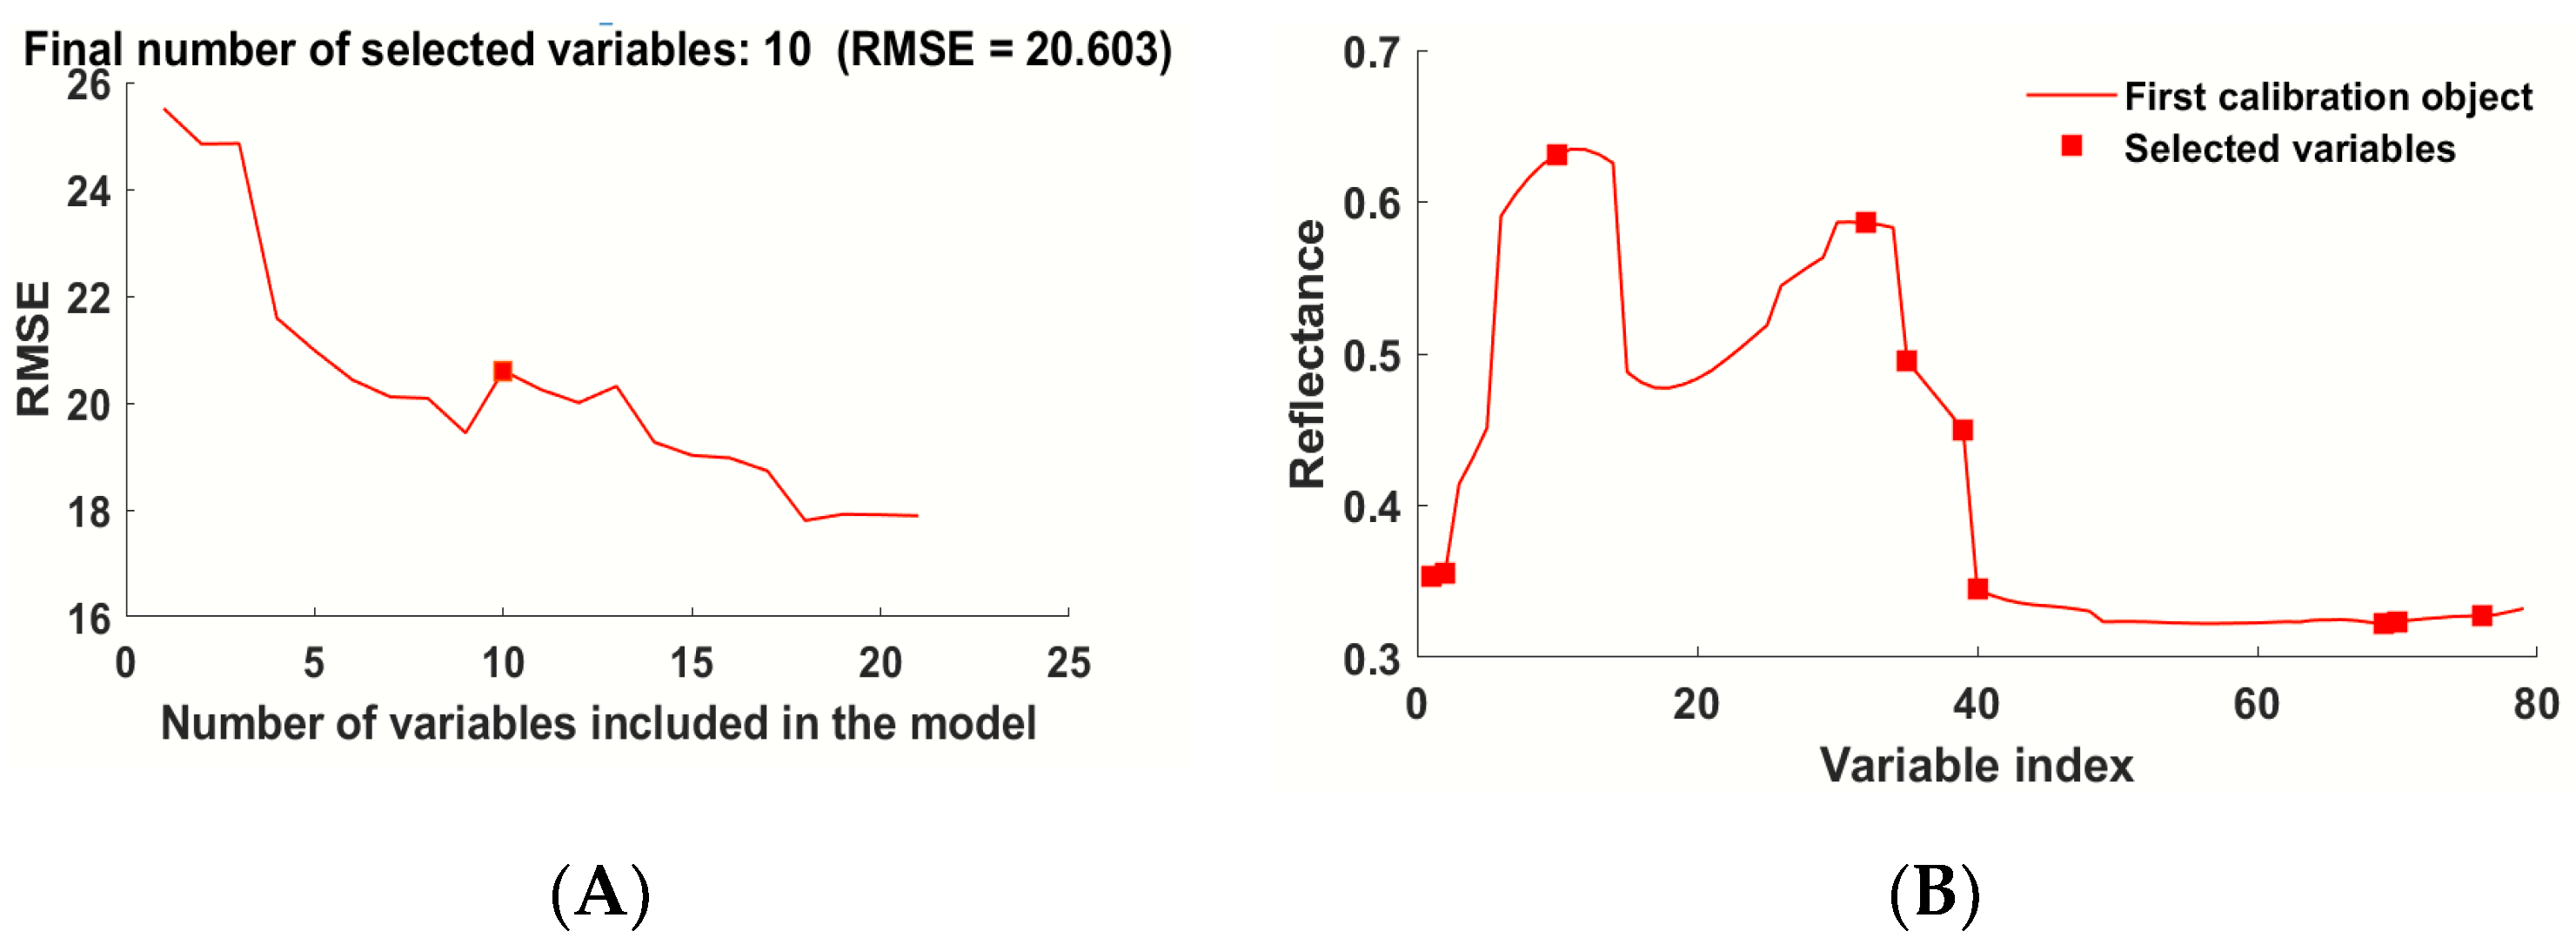
3.4.2. Modeling Based on the Variable Selected by VCPA and IVISSA

Ten characteristic wavelengths could be extracted by VCPA, accounting for 5.7% of the total wavelengths, which greatly reduced the number of bands compared with 125 wavelengths. However, for IVISSA, 79 characteristic wavelengths within the band range of 400–1000 nm were extracted by the IVISSA method, but the amount of data was still large compared with other methods. In order to reduce the dimension and reduce redundancy, further extraction and optimization of data was carried out. In this experiment, the IVISSA method and the SPA method were combined to extract characteristic wavelengths (Figure 6).
Figure 6 show that the method of SPA was further used to extract characteristic wavelengths at 400–1000 nm band. Compared with IVISSA method, IVISSA + SPA method reduced the data from 79 to 10, and the RMSEC value of chlorophyll was 20.60. Compared with IVISSA method, the data were greatly compressed, which was convenient for subsequent modeling and analysis.

3.4.3. Different Methods to Extract Characteristic Wavelengths and Comparative Analysis

In order to select the best characteristic bands for model building, the bands extracted from four characteristic wavelengths were analyzed; the results are shown in Table 3.

3.5. Subsection

As can be seen from Table 3, 10 feature wavelengths were extracted by SPA, accounting for 5.7% of the total wavelength; 79 feature wavelengths were extracted by IVISSA, accounting for 44.9% of the total wavelength. VCPA extracted 10, accounting for 5.7% of the total wavelengths.

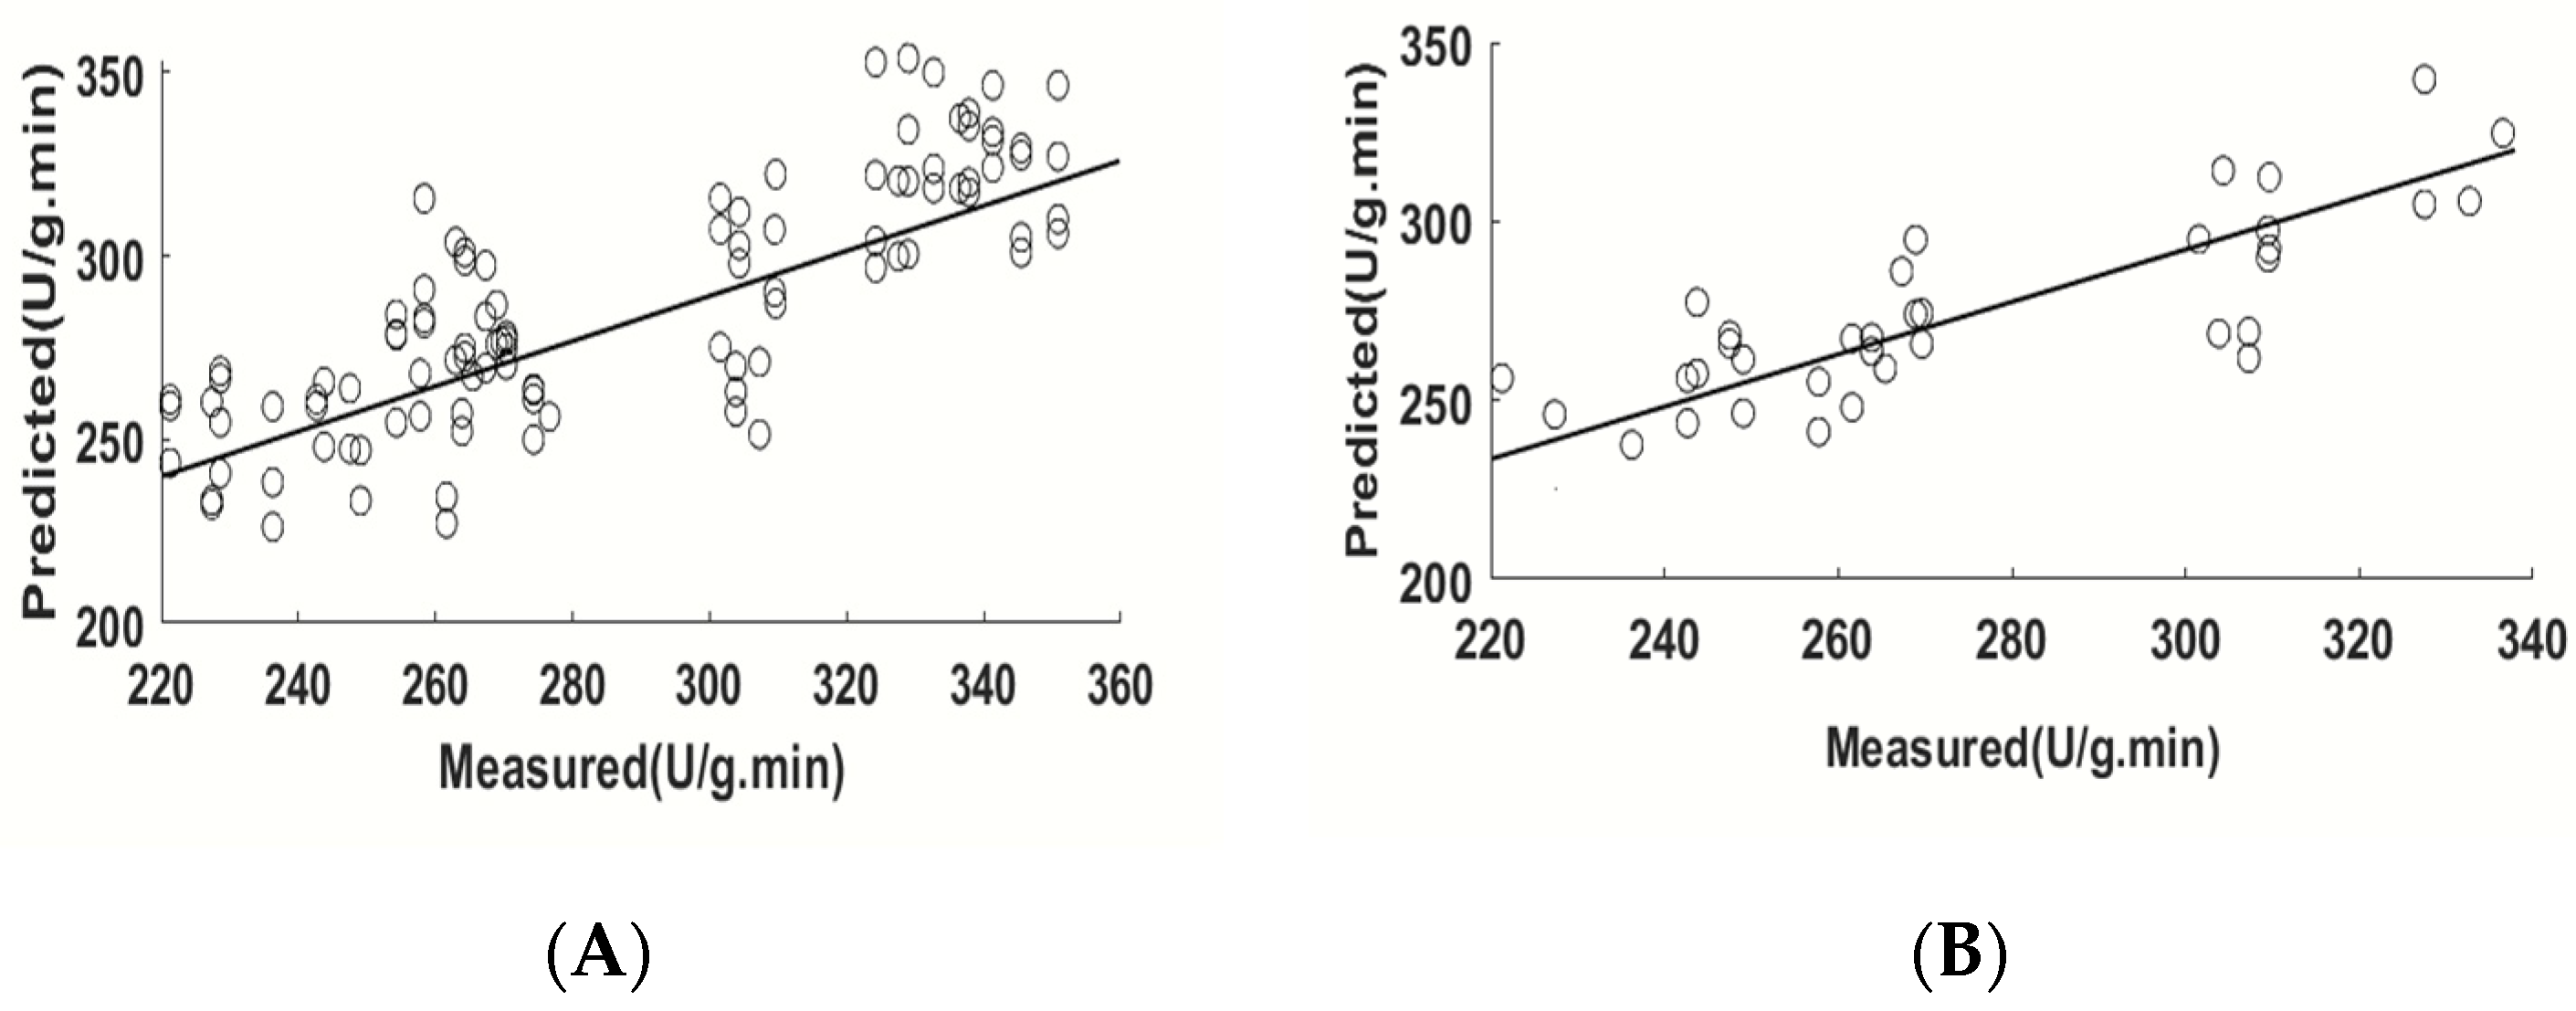
3.6. Comparison of Modeling Methods

In order to compare the modeling effects of different modeling methods on extracting characteristic wavelengths, multiple linear regression (MLR) and partial least-squares regression (PLSR) were used for model comparative analysis; the results are shown in Table 4.

3.7. Subsubs

As can be seen from Table 4, for PLSR models established by the four characteristic wavelength extraction methods, IVISSA + SPA − PLSR has a high Rp value of 0.81, low RMSEP value of 18.94, and the highest RPD value of 1.90, which is superior to SPA-PLSR, IVISSA − PLSR, and VCPA − PLSR. Therefore, the IVISSA + SPA − PLSR model is preferred. For PCR models, IVISSA + SPA − PCR has a high Rp value of 0.81, low RMSEP value of 19.04, and the highest RPD value of 1.90 among the PCR model species established by the four characteristic wavelength extraction methods. Therefore, the IVISSA + SPA − PCR model is preferred. Compared with the PCR model, IVISSA + SPA − PLSR model has a lower RMSEP, and the final preferred model is IVISSA + SPA − PLSR; results are shown in Figure 7.

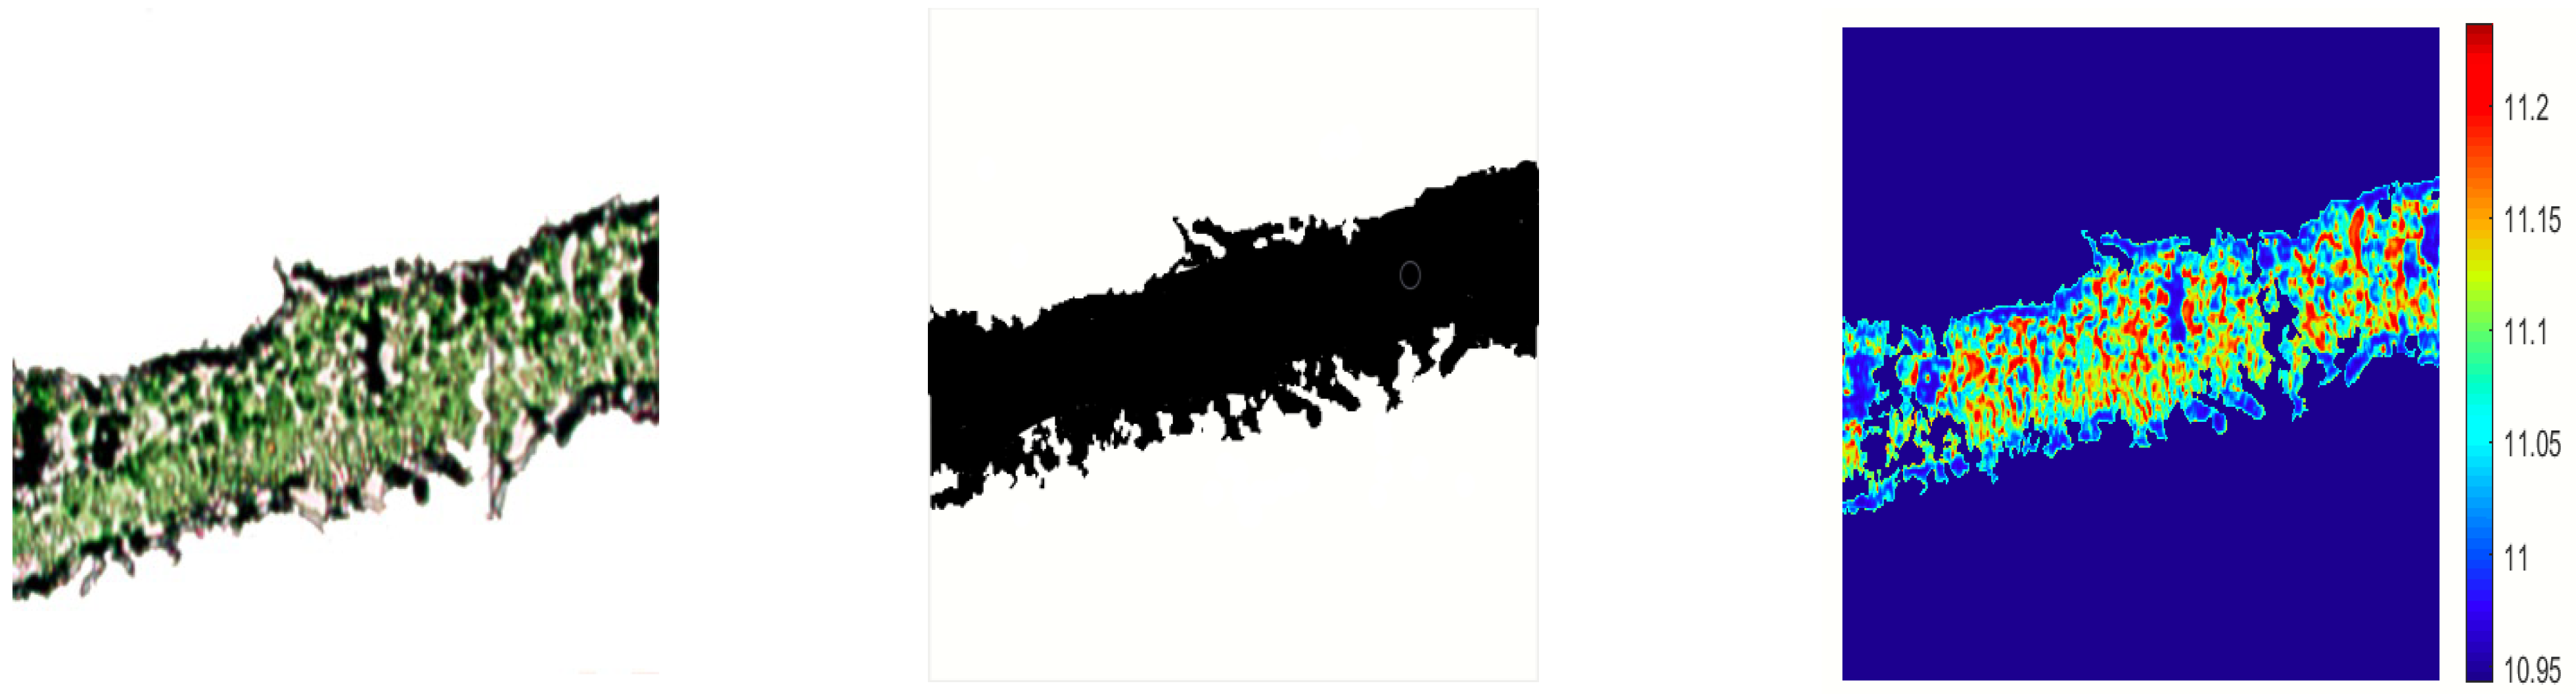
3.8. Visualization of Spatial Distribution of Peroxidase in Tomato Leaves

Visual processing results and process of tomato leaf samples are shown in Figure 8. According to the PLSR model based on the characteristic wavelength extracted by IVISSA + SPA method, the image was masked and processed with color rendering. The color range from blue to red indicates the change of POD activity value from low to high. The edge of the sample is blue, and there is more red and dark red in the middle. The spatial distribution of POD activity in tomato leaves can be intuitively seen in the visualization.

4. Discussion

In Figure 2, a particularly interesting phenomenon appears that the peroxidase activity value in the middle layer leaves shows a slow decreasing trend with the increase in salt concentration. The main reason for the phenomenon is that peroxidase mainly acts on free oxides, while H2O2 and O2 are mainly present in the middle layer leaves, which can be seen from POD activity values under different salt treatments. Along with the increase of salt solution, POD activity values in high and low leaves increased, which was consistent with the results of previous studies [26,27,28].
In Figure 3, three different spectral reflectance trends appear, and the peaks of spectral curves of the four are similar, but there are certain differences among the peaks. The spectral reflectance peaks at 450 nm and 550 nm increased with the increase of salt stress, which was because the leaf structure of tomato leaves was damaged with the increase of salt stress, leading to the decrease of chlorophyll content [12].
In Table 2, the final results showed that the sample set based on MSC preprocessing and the established PLSR model had the best performance (Rc = 0.89, Rp = 0.76, RMSEC = 17.72 U/g·min, RMSEP = 24.77 U/g·min). The spectral curve of the preprocessed spectral image is smoother, which makes the model more robust and reasonably reduces the influence of noise [11,12].
In Table 3, due to the large number of wavelengths selected by IVISSA method, it can be combined with SPA to reduce redundancy and dimension. Using these four methods to select characteristic wavelengths, each band is selected, and the number of bands is evenly distributed in the range of 400–1000 nm, which has a certain rationality. The most important core of the SPA algorithm is that it can search the variable value containing the least redundant information from the spectral matrix, so as to minimize the linear correlation between variables. The IVISSA algorithm, based on the idea of MPA, adopts the weight binary matrix method, and then conducts statistical analysis on multiple sub-models based on model cluster analysis. Model optimization is carried out in the process of different iterations, and finally reaches the optimal variable composition [29,30]. Hence, the IVISSA + SPA − PLSR model was selected. The visual renderings of leaf POD activity detected by spectrum were analyzed. The results showed that the distribution pattern of tomato leaf POD was consistent with its color change trend, which proved that the Jet color band had a good effect on the distribution of leaf POD.

5. Conclusions

In this study, a rapid detection of peroxidase activity in tomato leaves under salt stress was proposed based on micro-hyperspectral imaging.
  • The POD activity in tomato leaves increased with the increase of salt stress.
  • The optimal pretreatment method of enzyme activity in tomato leaves was established based on PLSR model by combining the micro-hyperspectral imaging technology and stoichiometry method.
  • PLSR and PCR models based on characteristic wavelength were established and analyzed, and their performance was evaluated. The Rp and RMSEP of IVISSA + SPA − PLSR were 0.81 and 18.94, respectively.
In this study, it was feasible to detect peroxidase activity in tomato leaves by micro-hyperspectral imaging. The study used microscopic highlights as a detection mechanism, which is a breakthrough and innovation for data processing algorithms on tomato leaf peroxidase response mechanism. This may provide technical support for other plant stress mechanisms and provide precise regulation approaches and has important research significance and application value. The results provide a basis for detecting the changes of the weak spectrum of POD in tomato leaves under salt stress and reference for the application of micro-hyperspectral imaging technology in the detection of peroxidase in tomato leaves in the future, and also promote the development of oxidative stress theory in plant science and help us to study the changes of plant microscopic matter and the occurrence regularity of diseases and pests.

Author Contributions

Conceptualization, L.W.; methodology, M.D.; software, Q.J.; validation, M.D., L.M. and Y.M.; formal analysis, L.W.; investigation, L.M.; resources, M.D.; data curation, Q.J.; writing—original draft preparation, Y.Z.; writing—review and editing, Q.J.; visualization, Y.M.; supervision, L.W.; project administration, L.W.; funding acquisition, L.W. All authors have read and agreed to the published version of the manuscript.

Funding

The research was financially supported by Research on the National Key Research and Development Program (2021YFD1600302), Key Research and Development Program of Ningxia (2021BBF02019, 2021BBF02024, 2021YCZX0016, 2021BEB04077, 2022BBF02024-2, 2022BBF03010), and the Fourth Batch of “Ningxia Youth Science and Technology Talents Supporting Project” (TJGC2019065).

Institutional Review Board Statement

Not applicable.

Informed Consent Statement

Not applicable.

Data Availability Statement

The raw data underlying these analyses are available from the corresponding author upon reasonable request.

Acknowledgments

We thank the tomato growers who allowed us to conduct the surveys and experiments reported here in their fields. And thank Jianshe Li and Yanming Gao for the funding support.

Conflicts of Interest

The authors declare that they have no known competing financial interest or personal relationships that could have appeared to influence the work reported in this paper.

References

  1. Sun, C.X.; Liu, Z.G.; Jing, Y.D. Effects of water stress on the activity and isoenzyme of key defense Enzymes in Maize leaves. J. Maize Sci. 2018, 11, 63–66. [Google Scholar]
  2. Yang, Y.; He, Y. Early prediction of antioxidant enzyme values of rice blast based on hyperspectral image. Trans. Chin. Soc. Agric. Eng. 2013, 29, 135–141. [Google Scholar]
  3. Zhang, Y.J.; Wang, L.; Bai, Y.L.; Yang, L.P.; Lu, Y.L.; Zhang, J.J.; Ge, L. Diagnosis of nitrogen nutrition in tomato leaves based on hyperspectral image technology. J. Jiangsu Univ. 2014, 35, 290–294. [Google Scholar]
  4. Sui, Y.H.; Wu, X.Y.; Hu, N.B.; Tang, J.B. Activity Analysis and POD Isoenzyme Patterns in Four Cultivars of Capsicum under NaCl Stress. Jiyinzuxue Yu Yingyong Shengwuxue Genom. Appl. Biol. 2018, 37, 5414–5420. [Google Scholar]
  5. Song, Y.; Cui, X.H.; Zhang, M.; Miao, C.L.; Cui, S.M.; Ye, L.H. Effects of salt stress on physiological characteristics and ion distribution of tomato seedlings. J. North. Agric. 2019, 47, 115–121. [Google Scholar]
  6. Miguel Juan, G.B.; Aurora Esther, R.H.; Guillermo, L.H. Structural and ultrastructural injuries in leaves of Baccharis conferta and Buddleja cordata broad-leaved species of a forest impacted with ozone. Flora 2022, 291, 152075. [Google Scholar] [CrossRef]
  7. Gong, Y.X.; Gu, T.H.; Ling, L.; Qiu, R.L.; Zhang, W.X. Visualizing hazardous solids with cryogenic electron microscopy (Cryo-EM). J. Hazard. Mater. 2022, 436, 129192. [Google Scholar] [CrossRef]
  8. Faylo, J.L.; Christianson, D.W. Visualizing transiently associated catalytic domains in assembly-line biosynthesis using cryo-electron microscopy. J. Struct. Biol. 2021, 213, 107802. [Google Scholar] [CrossRef]
  9. Thomson Raine, E.S.; Carrera-Pacheco, E.S.; Gillam Elizabeth, M.J. Engineering functional thermostable proteins using ancestral sequence reconstruction. J. Biol. Chem. 2022, 102435. [Google Scholar] [CrossRef]
  10. Duan, D.D.; Zhao, C.J.; Li, Z.H.; Yang, G.J.; Zhao, Y.; Qiao, X.J.; Zhang, Y.H.; Zhang, L.X.; Yang, W.D. Estimating total leaf nitrogen concentration in winter wheat by canopy hyperspectral data and nitrogen vertical distribution. J. Integr. Agric. 2019, 18, 1562–1570. [Google Scholar] [CrossRef]
  11. Shao, Y.Y.; Shi, Y.K.; Qin, Y.D.; Xuan, G.T.; Li, J.; Li, Q.K.; Yang, F.J.; Hu, Z.C. A new quantitative index for the assessment of tomato quality using Vis-NIR hyperspectral imaging. Food Chem. 2022, 386, 132864. [Google Scholar] [CrossRef] [PubMed]
  12. Sun, J.; Zhou, X.; Wu, X.H.; Lu, B.; Dai, C.X.; Shen, J.F. Research and analysis of cadmium residue in tomato leaves based on WT-LSSVR and Vis-NIR hyperspectral imaging. Spectrochim. Acta A 2019, 212, 215–221. [Google Scholar]
  13. Gu, Q.; Sheng, L.; Zhang, T.H.; Lu, Y.W.; Zhang, Z.J.; Zheng, K.F.; Hu, H.; Zhou, H.K. Early detection of tomato spotted wilt virus infection in tobacco using the hyperspectral imaging technique and machine learning algorithms. Comput. Electron. Agric. 2019, 167, 105066. [Google Scholar] [CrossRef]
  14. Zhu, Y.D.; Zhang, J.Y.; Li, M.Y.; Zhao, L.J.; Ren, H.R.; Yan, L.G.; Zhao, G.M.; Zhu, C.Z. Rapid determination of spore germinability of Clostridium perfringens based on microscopic hyperspectral imaging technology and chemometrics. J. Food Eng. 2020, 280, 1–11. [Google Scholar] [CrossRef]
  15. Gao, L.; Smith, R.T. Optical hyperspectral imaging in microscopy and spectroscopy—A review of data acquisition. J. Biophotonics 2015, 8, 441–456. [Google Scholar] [CrossRef]
  16. Wang, Y.F.; Mao, H.P.; Zhang, X.D.; Liu, Y.; Du, X.X. A Rapid Detection Method for Tomato Gray Mold Spores in Greenhouse Based on Microfluidic Chip Enrichment and Lens-Less Diffraction Image Processing. Foods 2021, 10, 3011. [Google Scholar] [CrossRef]
  17. Qin, O.Y.; Yang, Y.C.; Park, B.; Kang, R.; Wu, J.Z.; Chen, Q.S.; Guo, Z.M.; Li, H.H. A novel hyperspectral microscope imaging technology for rapid evaluation of particle size distribution in matcha. J. Food Eng. 2020, 272, 109782. [Google Scholar]
  18. Huang, Y.; Zhang, R.; Wu, D.J.; Lu, H.L. The preparation of frozen sections. Mod. Med. Health 2017, 33, 3358–3359. [Google Scholar]
  19. Giovenzana, V.; Beghi, R.; Civelli, R.; Guidetti, R. Optical techniques for rapid quality monitoring along minimally processed fruit and vegetable chain. Trends Food Sci. Technol. 2015, 46, 331–338. [Google Scholar] [CrossRef]
  20. Li, J.B.; Chen, L.P.; Huang, W.Q.; Wang, Q.Y.; Zhang, B.H.; Tian, X.; Fan, S.X.; Li, B. Multispectral detection of skin defects of bi -colored peaches based on Vis-VIR hyperspectral imaging. Postharvest Biol. Technol. 2016, 112, 121–133. [Google Scholar] [CrossRef]
  21. Li, H.S. Principles and Techniques of Plant Physiological and Biochemical Experiments; Higher Education Press: Beijing, China, 2000; pp. 182–197. [Google Scholar]
  22. Duan, M.; Yang, W.C.; Mao, X.M. Effects of water deficit on photosynthetic Characteristics and light response models of spring wheat under film mulching conditions. Trans. Chin. Soc. Agric. Mach. 2019, 49, 219–227. [Google Scholar]
  23. Fan, S.X.; Li, J.B.; Xia, Y.; Tian, X.; Guo, Z.M.; Huang, W.Q. Long-term evaluation of soluble solids content of apples with biological variability by using near-infrared spectroscopy and calibration transfer method. Postharvest Biol. Technol. 2019, 151, 79–87. [Google Scholar] [CrossRef]
  24. Jie, D.F.; Xie, L.J.; Fu, X.P.; Rao, X.Q.; Ying, Y.B. Variable selection for partial least squares analysis of soluble solids content in watermelon using near-infrared diffuse transmission technique. J. Food Eng. 2013, 118, 387–392. [Google Scholar] [CrossRef]
  25. Shi, J.Y.; Zhang, F.; Wu, S.B.; Guo, Z.M.; Huang, X.W.; Hu, X.T.; Holmes, M.; Zou, X.B. Noise-free microbial colony counting method based on hyperspectral features of agar plates. Food Chem. 2019, 274, 925–932. [Google Scholar] [CrossRef] [PubMed]
  26. Emam, P.A. Modulation of oxidative damage due to salt stress using salicylic acid in Hordeum vulgare. Arch. Agron. Soil Sci. 2018, 64, 1268–1277. [Google Scholar]
  27. Abdelaziz, M.E.; Abdelsattar, M.; Abdeldaym, E.A.; Omar, M.A. Piriformospora indicaalters Na+/K+ homeostasis, antioxidant enzymes and LeNHX1expression of greenhouse tomato grown under salt stress. Sci. Hortic. 2019, 256, 108532. [Google Scholar] [CrossRef]
  28. Insaf, B.; Noomene, S.; Vicente, V.P.; Aurelio, G.C.; Rosa, M.C. Identification and expression of the Cucurbita WRKY transcription factors in response to water deficit and salt stress. Sci. Hortic. 2019, 256, 108562. [Google Scholar]
  29. Shi, C.; Qian, J.; Zhu, W.; Liu, H.; Han, S.; Yang, X. Nondestructive determination of freshness indicators for tilapia fillets stored at various temperatures by hyperspectral imaging coupled with RBF neural networks. Food Chem. 2019, 275, 497–503. [Google Scholar] [CrossRef]
  30. Hao, J.; Dong, F.J.; Li, Y.L.; Wang, S.L.; Cui, J.R.; Zhang, Z.F.; Wu, K.N. Investigation of the data fusion of spectral and textural data from hyperspectral imaging for the near geographical origin discrimination of wolfberries using 2D-CNN algorithms. Infrared Phys. Technol. 2022, 125, 104286. [Google Scholar] [CrossRef]
Figure 1. Microscopic hyperspectral imaging system, hyperspectral imaging system (a), microscopic objective (b), loading platform (c), light source control (d), computer acquisition software (e).
Horticulturae 08 00813 g001
Figure 2. Changes of POD activity under salt stress. The a–h indicates significant differences by analysis of variance.
Horticulturae 08 00813 g002
Figure 3. Average spectral curves of different salt concentrations.
Horticulturae 08 00813 g003
Figure 4. Mean spectra of MSC pretreatment.
Horticulturae 08 00813 g004
Figure 5. Characteristic wavelength of SPA extraction; RMSE plots obtained by SPA (A), the bands selected by SPA algorithm (B).
Horticulturae 08 00813 g005
Figure 6. Feature wavelength of IVISSA + SPA extraction; characteristic wavelength of SPA extraction, RMSE plots obtained by IVISSA + SPA (A), the bands selected by IVISSA + SPA algorithm (B).
Horticulturae 08 00813 g006
Figure 7. IVISSA + SPA − PLSR modeling results; the PLSR model of the calibration set (A), the PLSR model prediction of the calibration set (B). The circle is a intersection of measured and predicted values for POD activity.
Horticulturae 08 00813 g007
Figure 8. Spatial distribution visualization of POD activity in tomato leaves based on PLSR model.
Horticulturae 08 00813 g008
Table 1. Statistical table of POD enzyme activities in tomato leaves.
SetNumber of SamplesMin
(U/g·min)
Max
(U/g·min)
Average
(U/g·min)
SD
(U/g·min)
Total139221.28350.82283.4638.29
Calibration set103221.28350.82283.4538.58
Prediction set36221.28341.29270.9236.00
Table 2. Comparative analysis of PLSR models with different pretreatments.
Spectra TypesPCSRcRMSECRpRMSEPRPD
Raw70.8619.700.7623.961.50
Average smoothing100.8420.470.7625.391.42
Gaussian Filter70.8520.060.7624.431.47
Normalize60.8619.150.7723.841.51
Baseline70.8619.370.7525.771.40
SNV70.8718.810.7624.051.50
Detrending60.8718.780.7226.911.34
MSC80.8917.720.7624.771.45
Table 3. Statistical table of characteristic wavelength selection.
Methods.NumbersWavelengths/nm
SPA10456, 495, 541, 567, 597, 850, 890, 912, 938, 972
IVISSA79392, 395, 414, 417, 420, 440, 443, 446, 449, 452, 456, 459, 462, 465, 495, 498, 501, 504, 508, 511, 514, 517, 521, 524, 527, 541, 544, 547, 551, 577, 581, 584, 587, 591, 635, 638, 642, 645, 648, 693, 697, 700, 704, 707, 711, 714, 718, 721, 785, 789, 792, 796, 799, 803, 806, 810, 814, 817, 821, 824, 828, 832, 835, 879, 883, 886, 890, 894, 897, 927, 931, 934, 938, 942, 946, 949, 953, 957, 961
IVISSA + SPA10392, 417, 488, 498, 511, 514, 611, 614, 635, 728
VCPA10392, 401, 544, 551, 564, 567, 571, 635, 679, 897
Table 4. Comparison of modeling effects of different feature extraction methods.
ModelMethodBand NumRcRMSECRpRMSEPRPD
PLSRSPA100.7824.940.7821.241.70
IVISSA790.8322.970.8119.451.85
IVISSA + SPA100.7924.410.8118.941.90
VCPA100.8222.100.8020.261.78
PCRSPA100.7824.940.7821.351.69
IVISSA790.8123.300.7920.351.77
IVISSA + SPA100.7924.410.8119.041.90
VCPA100.8222.740.8119.451.86
Publisher’s Note: MDPI stays neutral with regard to jurisdictional claims in published maps and institutional affiliations.

