Abstract
This study presents the results of the water retention characteristics of six groups (0.25 mm to 8.35 mm) of expanded perlite (EP) produced from two crushed raw perlite rocks of Turkey (A) and China (B). The particle size proportions of EPs showed that the particle size less than 1.68 mm was higher in B than that of A and the particle size distribution curves (PSDC) of three samples of EP A and B were similar, while the percent finer value (DN) of B was higher than that of A in all corresponding particle sizes. Volumetric water content (θv) for EPs of A and B were obtained at 11 levels of matric potentials between 0 to −50 kPa (sandbox with kaolin-plate) and −50 to −1500 kPa (pressure chamber), respectively, after fully saturating the uniformly packed EP in open-ended metal round rings. The results showed that the shapes of measured WRCs and particle size distribution curves of EP A and B were similar, while the percent values of PSDC were higher than those values of θv corresponding to each water potential greater than 0.1 kPa. The WRCs of respective EP showed that a substantial decline started at about −1 kPa and approached the residual water content (θr) observed at −500 kPa for all measurements. θv for all particle sizes of the EP A and B was not only decreased with the increasing matric potential but also distinctive with increasing particle size greater than 2.36 mm. θr was increased with decreasing particle size. For these results, we assumed that θv of the different particle sizes of EP A and B could be determined by actual pore volume excluding occluded pore volume depending on size and surface area in the EP particles.
1. Introduction
Most growth media in soilless culture systems (SCS) are chosen and formulated from various inorganic and organic substrates that provide suitable physical and chemical properties as required by the crop species and growing conditions. The best growing medium in SCS should fulfill the physical, chemical, and biological properties for good plant growth and production, although there are few universal substrates that are available for all plant species and in all SCSs [1,2,3]. Up to 50% peat or coir as the major organic substrates can be used as a component of a growing medium, while rockwool and perlite as the major inorganic substrates are used as inorganic substrates in SCS [4,5]. However, peat is a limited resource with a great demand. Avoiding or reducing the use of peat as a growth media substrate can not only substantially reduce the carbon footprint of SCS but also improve irreversible damage to the ecology and negative impacts on the environment that can be caused by peat extraction [5]. Therefore, inorganic substrates which can fully replace organic substrates such as peat or coir, that can be gradually decomposed with increased reuse, and be associated with reduction of crop yield and/or product quality may decrease the C footprint in SCS [5].
In SCS, the growth substrate is reused for successive growth cycles. When choosing a growth substrate with respect to plant growth and production cost, absence of pests and pathogens is essential; biostability and biological inertia are other parameters to be taken into consideration, particularly when long cycles are carried out or the growing medium is reused during successive growing cycles [1]. Considering the essential requirements for the standalone growth substrate in SCS, one criterion is the quantity of available water that can be delivered to the plant roots, because not all the water in the growth media is available to the plant at different water potential levels [6].
Various inorganic substrates such as perlite, tuff, expanded clay granules, and vermiculite, as well as synthetic materials, have been used as growing media [7,8]. Among these inorganic substrates, perlite, which has various physical properties including surface area, bulk density, and external and internal porosity, is mostly used in its expanded form and offers both excellent water retention and proper aeration for root growth in plants [7,9]. However, the grades and their proportions of EP used as growth media in SCS are significantly variable depending on the mineralogical property and expansion process of crude perlite rocks throughout the processing stages at the expansion plants, although all processed products are graded for specific uses and plants. The most common particle sizes of EPs, which are produced in various grades with different physical characteristics, are 0–2 and 1.5–3.0 mm in diameter [8]. The various particle sizes of perlite can significantly influence the water retention capacity of EP. Finer particle sizes have increased surface area and pack together closely which, taken together, retain more moisture. Coarser particle sizes with less surface area per volume retain less moisture, but release it more readily. By varying the particle size range, the level of retained moisture can be tailored to meet a variety of needs.
Generally, horticultural grades of perlite retain between 20–50% water by volume depending on size and gradation [2]. Burés et al. [10,11] reported that the available and unavailable volumetric water contents in perlite of 0–4 mm diameter were 13.6% and 36.5%, respectively, and water retained at −10 kPa is much higher for the coarse fraction (0.5–1.0 mm diameter) than for the fine fraction (0.25–0.50 mm diameter) of EP. The perlite particle sizes determine the water contents, which may vary with different matric potentials. However, the effects of particle sizes at specific matric potentials on water retention characteristics have not—to the authors’ knowledge—been so far systematically studied. Therefore, it is necessary to verify the water content retained on the specific sizes of EP at each matric potential to be used to formulate the particle sizes of the standalone growth media.
Water retention curves (WRC) that show data about water properties in growth substrates have great practical and theoretical significance [12]. Therefore, these curves give the opportunity to determine when and what amount of water the plant needs. The plant-available water, which is the difference between the soil water content at field capacity minus the soil water content at the permanent wilting point [13], can be used to express the water content of the growth media as a function of the total available water [14]. The WRC of EP as growth media, the behavior of which is influenced by several physical properties of EP [15], is needed to calculate plant-available water. A correct measurement or estimation of the field capacity and wilting point is therefore critical for obtaining reliable estimates of the growth media-related parameters [14]. The measurement of the water retention curve of horticultural substrates is generally executed with the sand box and the pressure plate extractor [16,17]. Low plate and soil conductance, lack of plate–soil contact, and soil dispersion, however, make this method often unreliable at low water potentials [18] because the soil water content at the permanent wilting point was not only overestimated but also underestimated when pressure plate data were used. Generally, the hydraulic property is directly measured in the laboratory by measuring the water content of the sample at a given matric potential h for a given growing medium when equilibrium was reached. At this time, particle size and distribution dictate the air-holding and water-holding capacity of a medium. In particular, container height also impacts the relative amount of water versus air in a medium. The taller the container, the less evenly water is distributed throughout the container, regardless of the media, although matric potential, which is a medium’s ability to hold water through adhesion and cohesion, remains constant throughout the container. However, the experimental determinations of WRC based on soil basis are time consuming and labor intensive [19,20]. Empirical relationships based on the particle size distribution and other compositional factors, known as pedotransfer functions (PTFs), are the most common method to estimate the WRC [21]. These PTFs need at least experimental data (i.e., volumetric water content versus matric potential) in order to fit the WRC [21].
For profound understanding of how the mixing ratio influences the hydraulic performance of EP used as standalone growth media regardless of container type, the water retention characteristics for EP are necessary to set up for proper formulation methods of various sizes of EP, in terms of the levels of available water content during the growth period of vegetable crops in SCS. This investigation aimed to investigate the water retention characteristics of EPs grouped into six grades of particle size, and the corresponding absolute value of matric potential from permanent wilting point to saturation including air entry point, to develop PTF as a simple, intuitive, and quick formulation method of various particle sizes of EP as standalone inorganic growth media for specific plants in SCS.
2. Materials and Methods
2.1. Materials
For EP samples produced from two different crushed raw perlite rocks, which were imported from Turkey (A) and China (B), we collected a total of twelve 100 Lbags of EP three times from two different perlite manufacturers that processed the crushed raw perlite rocks with various temperatures from 800 to 1000 °C after pretreatment to grow up to 15–20 times its original volume. For the analysis of particle size distribution of A and B, a total of six bags of EP which were collected three times from each manufacturer were thoroughly mixed and dried for at least 48 h at 105 °C in a hot-air oven. Three 1 kg oven-dried samples of EP for both A and B were used for the particle size distribution using a set stack of six ASTM standard sieves (0–0.50, 0.50–1.0, 1.0–2.36, 2.36–4.75, and 4.75–6.7, 6.7–10.0 mm). The whole nest of sieves was shaken for 40 min in a vibratory sieve shaker (Analysette 3Pro, Fritsch, Idar-Oberstein, Germany) till the sample retained in each reached a constant value. Portions retained in each sieve were collected separately and oven dried before the mass retained in each sieve was measured. The mass of fragments remaining in each sieve were then expressed in terms of the percentage of the total weight of EP that passed through different sieves (Table 1). Mean particle size for each particle range was assumed to be the average of the width of the sieve aperture that captured the particle and the adjacent (larger) sieve aperture. For example, particles passing a 2.36 mm sieve and retained in a 1.0-mm sieve were assumed to have a mean diameter of 1.68 mm.

Table 1.
Proportion of particle size classified into six different ranges for two EPs of A and B produced from two different crushed raw perlite rocks.
The uniformity coefficient and the coefficient of gradation are given by the relation in Equations (1) and (2).
where, Cu is the uniformity coefficient and D60 is the diameter corresponding to 60% finer in the particle-size distribution. Cc is the coefficient of gradation and D30 diameter corresponding to 30% finer.
The particle size distribution curve (PSD) that illustrates the amount of EP that is retained on each sieve was obtained by plotting each sieve percentage on the graph. The equation of the best-fit curve to calculate the percent finer (DN) corresponding to particle size, the proportion of particle size at which N% of the particles are finer and 100-N % of the particles are coarser than DN size, was obtained by Nonlinear Regression-Dynamic Fitting of SigmaPlot 14.5 (SYSTAT software, Palo Alto, CA, USA).
2.2. Measurement of Soil Water Retention Curves
The WRCs were determined with six different grades of EPs of A and B prepared by the mechanical sieve method. Before measuring water retention characteristics of six different grades of A and B, the particle density of each grade of EP was measured by Gas pycnometry [22]. The porosity (Pm) was measured by the saturation method described in the NCSU Porometer Method [23]. EP particles were packed into an aluminum base plate fitted together as one unit and aligned in the open position to allow drainage through the plates in the funnel. Next the funnels were filled with distilled water in a step-wise fashion to prevent air entrapment. After removing the core covered with the aluminum lid, the sample was weighed and wet weight recorded. Porosity was determined by summing all of the water in the sample. For air-filled porosity (AFP), the drainage volume was divided by the total volume for each porometer to determine a percent air-filled porosity [24].
Bulk density (BD) was also calculated by EP samples used in measurement of porosity above. The calculated porosity (Pc) was obtained using P = 1 − (BD/PD). According to the method described by [25], the volumetric water content (θv) was measured at 11 matric potentials (0, −1, −5, −10, −30, −50, −100, −300, −500, −1000, −1500 kPa. The water retention characteristics between 0 and −50 kPa and between −50 and −1500 kPa were measured by the sandbox with kaolin-plate (Eijkelkamp, Giesbeek, The Netherlands) and the pressure chamber (Soil Moisture Equipment Corp., Santa Barbara, CA, USA), respectively. Five replicates were measured for each grade EP of A and B at each matric potential. The water contents were then measured volumetrically by drying the samples at 105 °C for 24 h.
2.3. Statistical Analysis
The mean values of fine, medium, coarse, and BD, along with their standard deviations (SD) and standard error (SE), were calculated for A and B using Microsoft Office Excel 2021 (Microsoft, Washington, DC, USA) and Sigmaplot 14.5 to analyze the experimental data and for graphing purposes (regression equations). Pearson product moment correlation coefficients were calculated by choosing bivariate with two-tailed option using SPSS 12 (IBM SPSS Statistics, Chicago, IL, USA) to show the relationship between the slurry parameters. The SE was calculated as a measure of the precision of the sample mean.
3. Results and Discussion
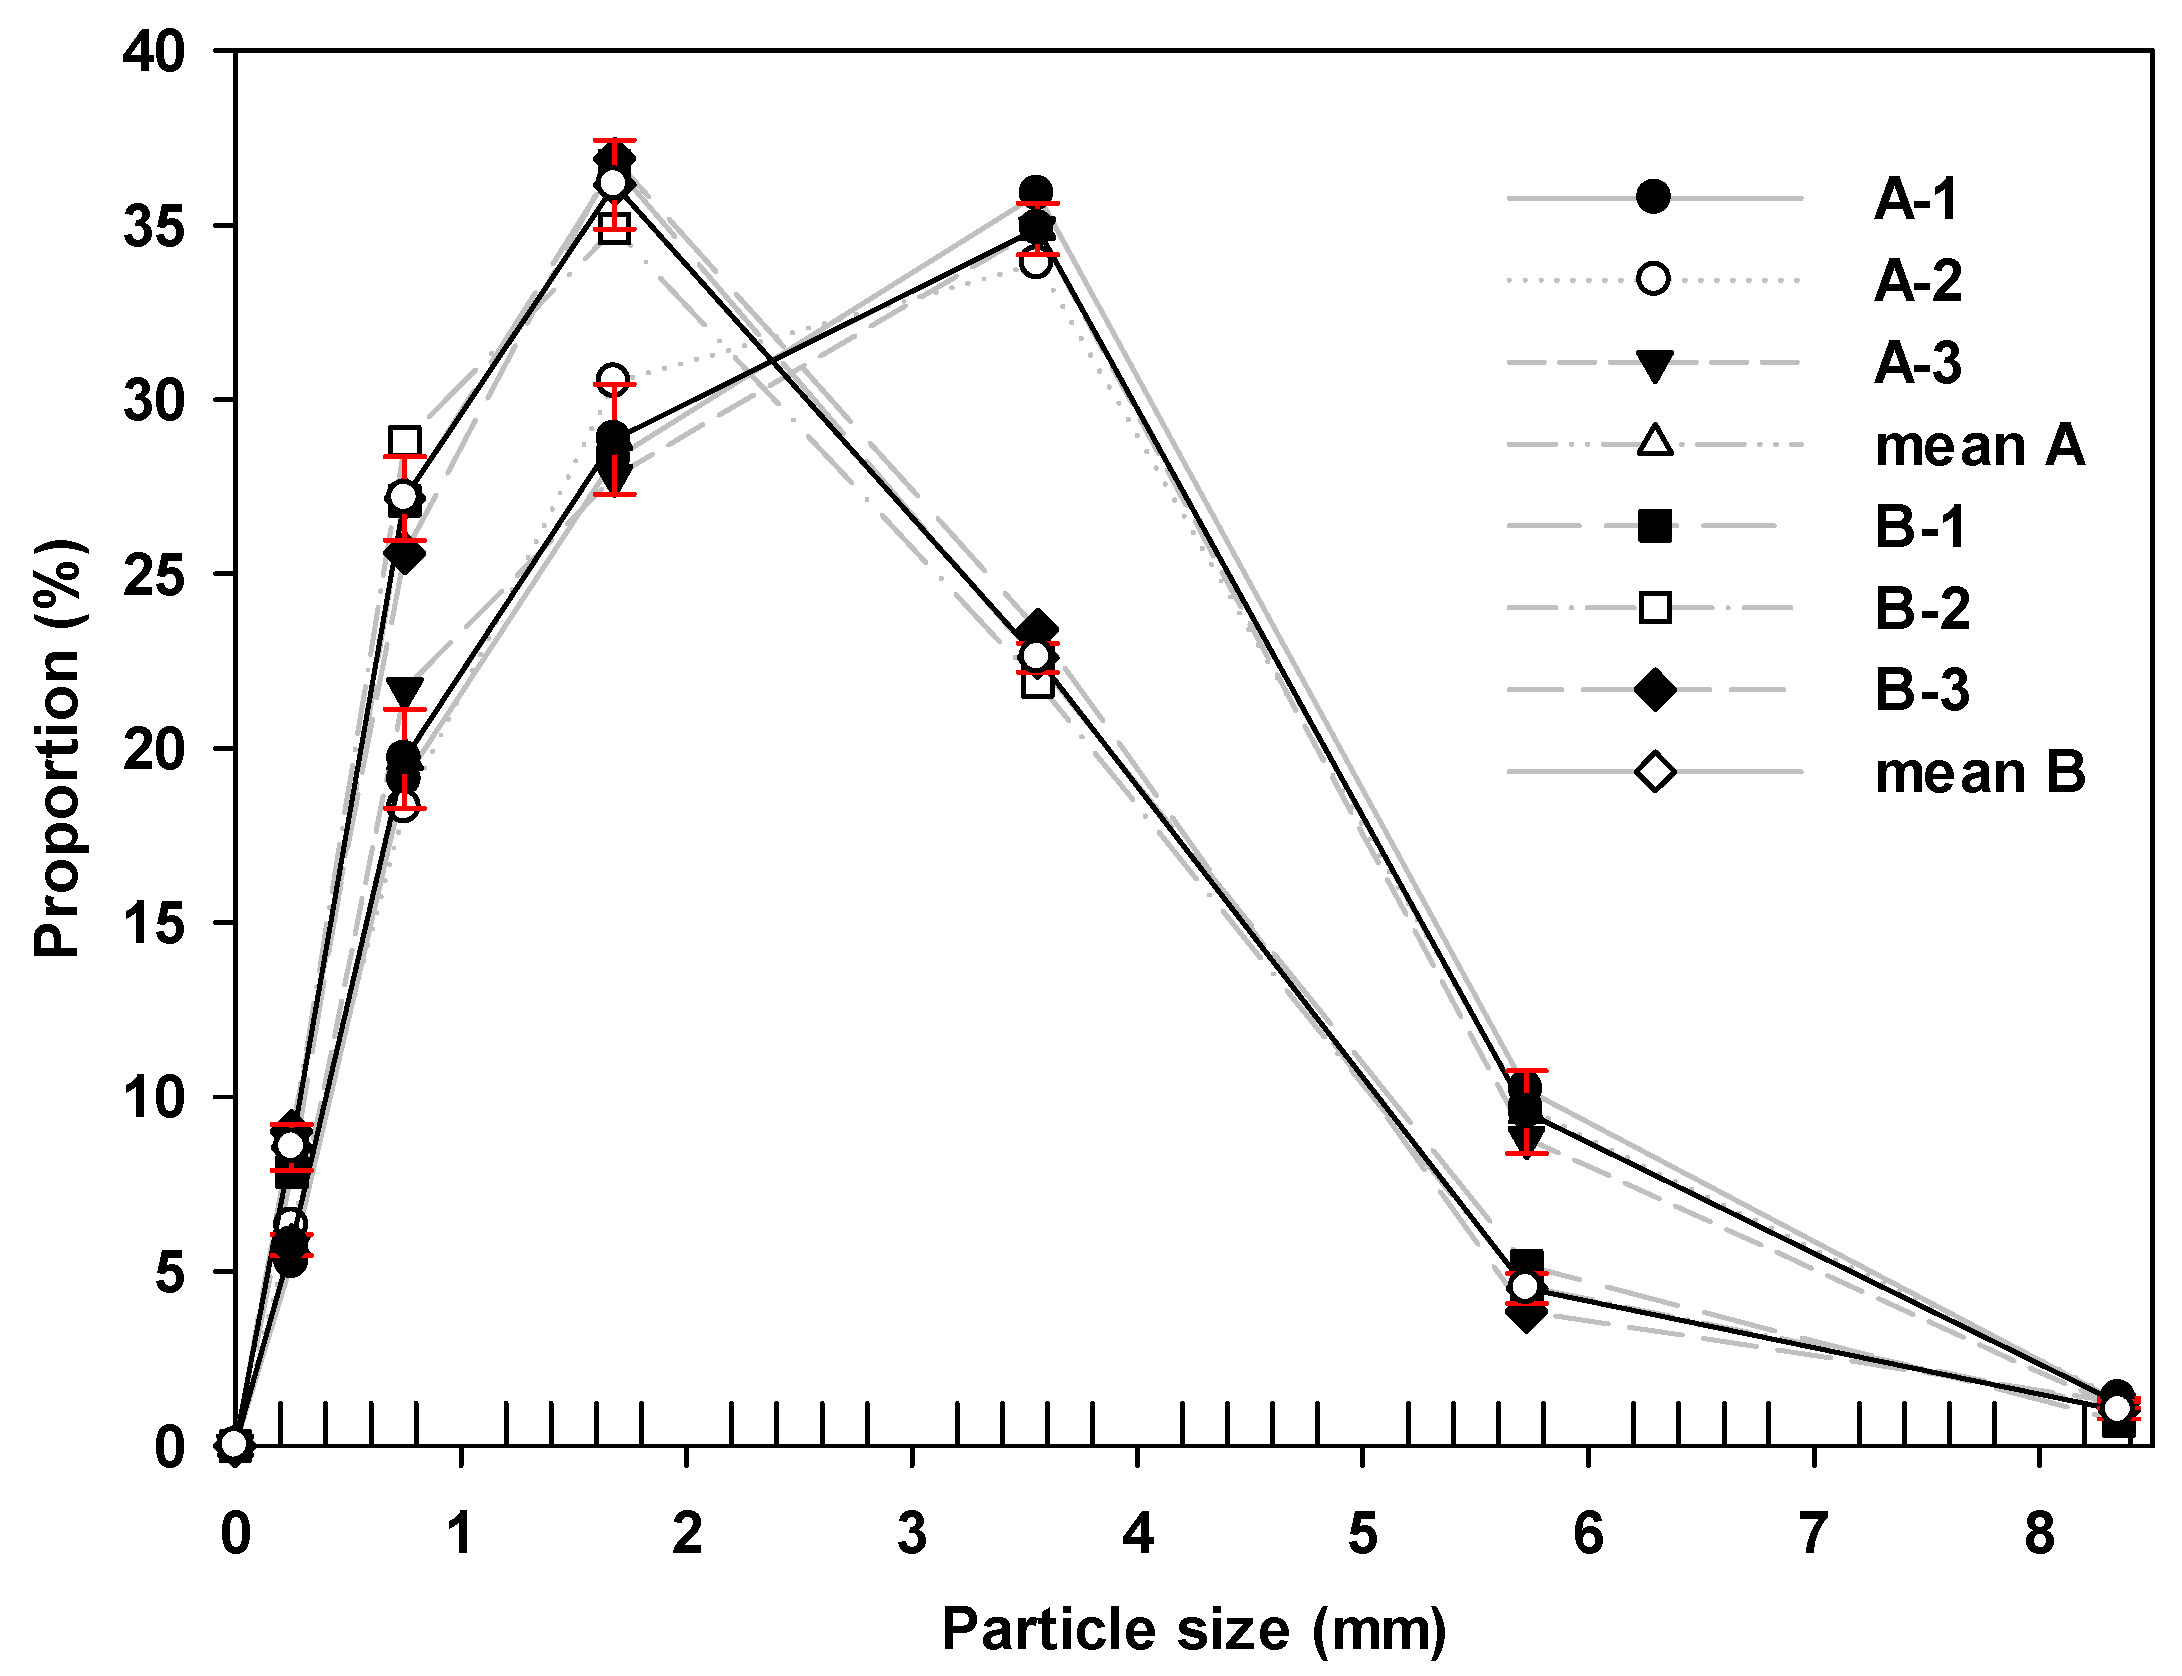
The proportions of six grades of EP A and B showed that the dominant proportions of the average perlite size were 33.1% (2.36–4.75 mm) followed by 28.9% (1.0–2.36 mm) and 35.1% (1.0–2.36 mm) followed by 28.4% (0.5–1.0 mm) for A and B, respectively (Table 1). The largest SD (SE) values of EP A and B were observed by 1.58 (0.41) and 1.27 (0.33), respectively.
The individual proportion of the particle size showed that the particle size less than 1.68 mm was higher in B than that of A (Figure 1). Smaller particles could occupy the pores larger than the smaller particles’ size in a particle matrix, resulting in a decrease of porosity and volume of larger pores along with increase in bulk density. Therefore, it can be interpreted that the lower porosity might be observed in B due to higher proportion of larger particles in B.
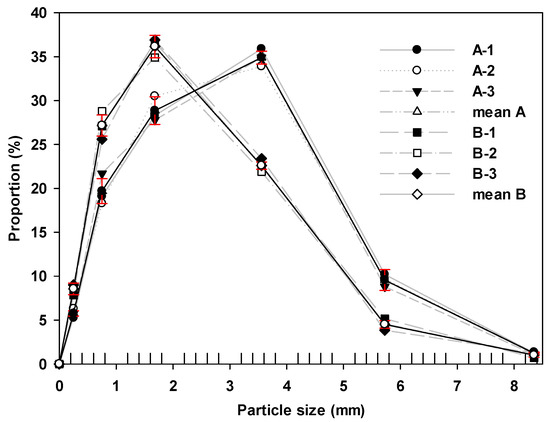
Figure 1.
Proportion of perlite particle size measured at six particle grades for A and B. A: Turkey; B: China.
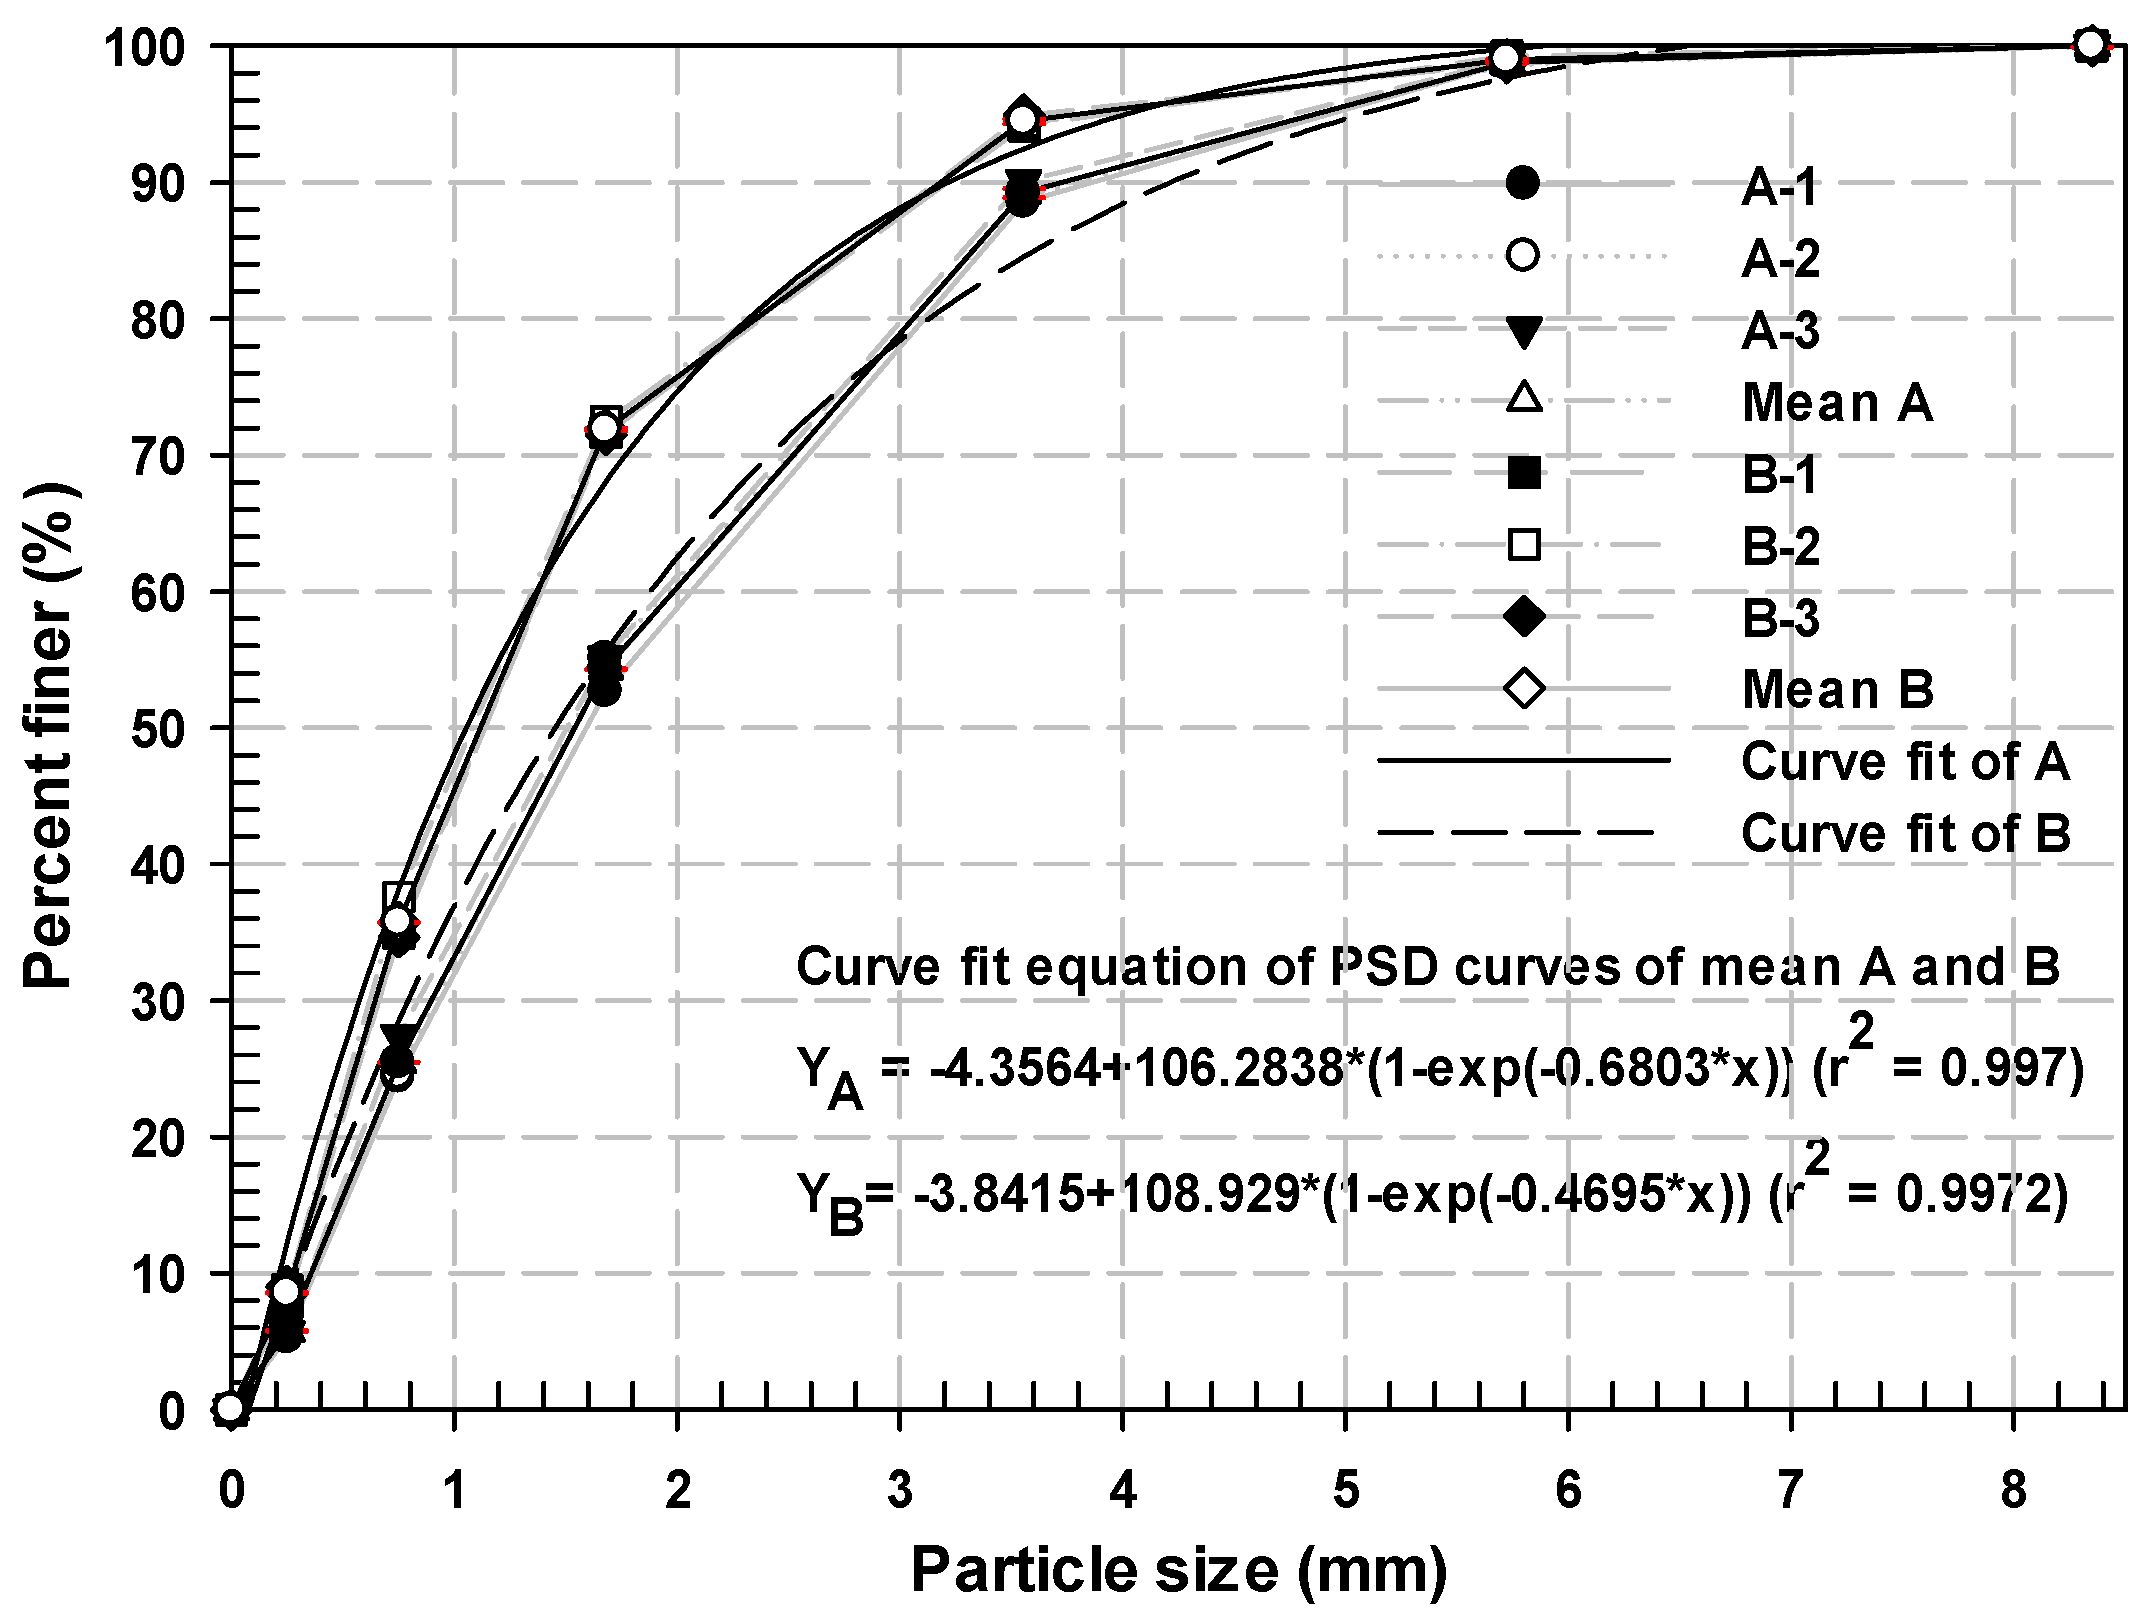
The particle distribution curves and curve fits for A and B are represented in Figure 2. The particle distribution curves of three samples of each EP were similar, while the percent finer value (DN) of B was higher than that of A in all corresponding particle sizes, which could be attributed to the total proportion of the particle size less than 1.68 mm. The proportions of particle size less than 1.68 mm as median value in A and B were 58.8% and 71.9%, respectively, showing that the proportions of B were higher by 17.1% than that of A.
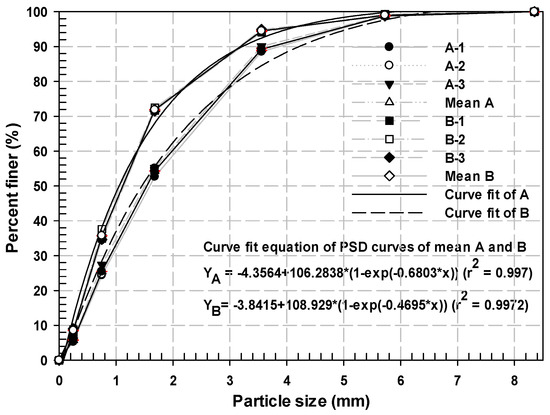
Figure 2.
Particle size distribution curves and equations of the best curve fit of A and B. A: Turkey; B: China.
The mathematical fit of the particle-size distribution led to the development of an algorithm capable of predicting the soil–water characteristic curve; a good curve fit of the particle-size curve is also essential for the prediction of a reasonable soil-water characteristic curve [26]. The overall best-fit curves expressed as nonlinear regression equations for the mean particle distributions of A and B showed that r2 of A and B were 0.997 with standard errors of estimate of 2.16 and 2.27, respectively. The equation to calculate DN corresponding to the actual perlite particle size can be expressed as Equation (3) for A and B. DN and x in Equation (3) are the designated and initial diameter of the particle corresponding to the uniformity coefficient (Cu) for a given proportion.
where x is the particle size corresponding to DN, and Y and Yo are DN and D0. a and b are parameters related to the shape and slope of the curve.
The equations for the best-fit curves of A and B can be expressed as Equations (4) and (5).
DNA = −4.3564 + 106.2838[−exp(−0.6803x)]
DNB = −3.8415 + 108.9290[1 − exp(−0.4695x)]
The particle-size distribution, which can influence the configuration of the pore space, has considerable effects on the water flow path and water retention capacity. The coefficient of curvature is an essential parameter that represents the continuity of the particles. For a given porosity, characteristic particle size and coefficient of curvature conditions are the governing variable affecting the particle composition [27]. Table 2 shows the particle sizes corresponding to DN, uniformity coefficient (Cu), and curvature coefficient (Cc) which were calculated by Equations (4) and (5) for A and B. Comparing the particle sizes of A and B for each corresponding DN, the particle sizes of A corresponding to D60, D30, and D10 were larger than those of B, and the mean spans of the particle size for A and B were similar between D30 and D60 while the mean span between D10 and D30 of B was smaller by 0.15 mm than that of A. However, the calculated particle sizes of D60 of A and B were 1.88 mm and 1.37 mm, showing that the pore size of B could be larger than that of A. Therefore, we could assume that the difference and proportion of particle size distribution could influence the water retention capacity in A and B. Using these DN values, the calculated means Cu and Cc for A and B were 6.71 and 1.16 and 6.68 and 1.14, respectively, revealing that both A and B are densely graded particle with a considerable range of particle size. Yang et al. [27] reported that the difference between the control particle size and the average particle size increases with increasing Cc. Therefore, the average particle size of B can be larger than that of A.
Table 2.
Particle size corresponding to DN, uniformity coefficient (Cu), and curvature coefficient (Cc) for A and B.
The physical properties which influence the air content and water retention capacity of EP to be used as the growth media can be varied by the expansion capacity and the presence and amount of crystalline phase of the crushed raw perlite rock particles during heat treatment. The mean particle density of B produced by the crushed raw perlite rock particles imported from China was greater by approximately 0.06 g cm−3 than that of A, imported from Turkey. The difference between the particle densities for A and B can be interpreted as substantial amounts of occluded intra-particle pore spaces in addition to the presence and amount of crystalline phase of the crushed raw perlite rock particles. Smaller EP particles would have fewer occluded pores than larger diameter particles. If occluded pores were present in an expanded perlite, the resulting particle density in a whole, unchanged state would be lower than when the material is ground. Bartley et al. [22] reported that the particle density values for perlite decreased as particle size increased from <0.5 to <4.75 mm but showed a slight increase for particles >4.75 mm. As seen in Table 3, the proportion of the EP particles smaller than 1.68 mm was higher in B, resulting in higher particle density of B than that of A. Bulk densities of A and B ranged between 0.119 and 0.125 g cm−3 and between 0.125 and 0.129 g cm−3, respectively, showing the mean BD of A was slightly lower than that of B. This could be attributed to the higher proportion of smaller EP particles, less than 1.68 mm, in EP B. The measured porosities of A and B were approximately 94.9% and 96.6% of the calculated porosities. The higher proportion of EP particles greater than 1.68 mm in A could be caused by including more occluded pores. Bartley et al. [28] reported that smaller expanded perlite particles less than 5 mm would have fewer occluded pores than larger-diameter particles. The mean air-filled porosities of EP A and B were 56.8% and 54.4%, representing EP B having a higher proportion of smaller EP particles which could retain more water by 2.4%. The content difference between various sizes of EP particles becomes more significant, resulting in the pore volume of the porous media not being equal to the total volume of fine filling particles. For a given porosity, the quantity of pores in a medium consisting of coarse particles is generally less than that in a medium consisting of fine particles [27]. This can have an impact on the estimated porosity of the material. Therefore, the EP consisted of various sizes of particles, as standalone growth media needs to be taken into consideration in SCS with varying demands for water and oxygen in the root zone of plants or crops. The calculated mean AFPs for EP A and B were 3.96 and 3.75%, indicating that AFP of EP A with slightly higher BD was relatively higher than that of EP B with lower BD.
Table 3.
Particle density, bulk density, calculated and measured porosity, and air-filled porosity for A and B.
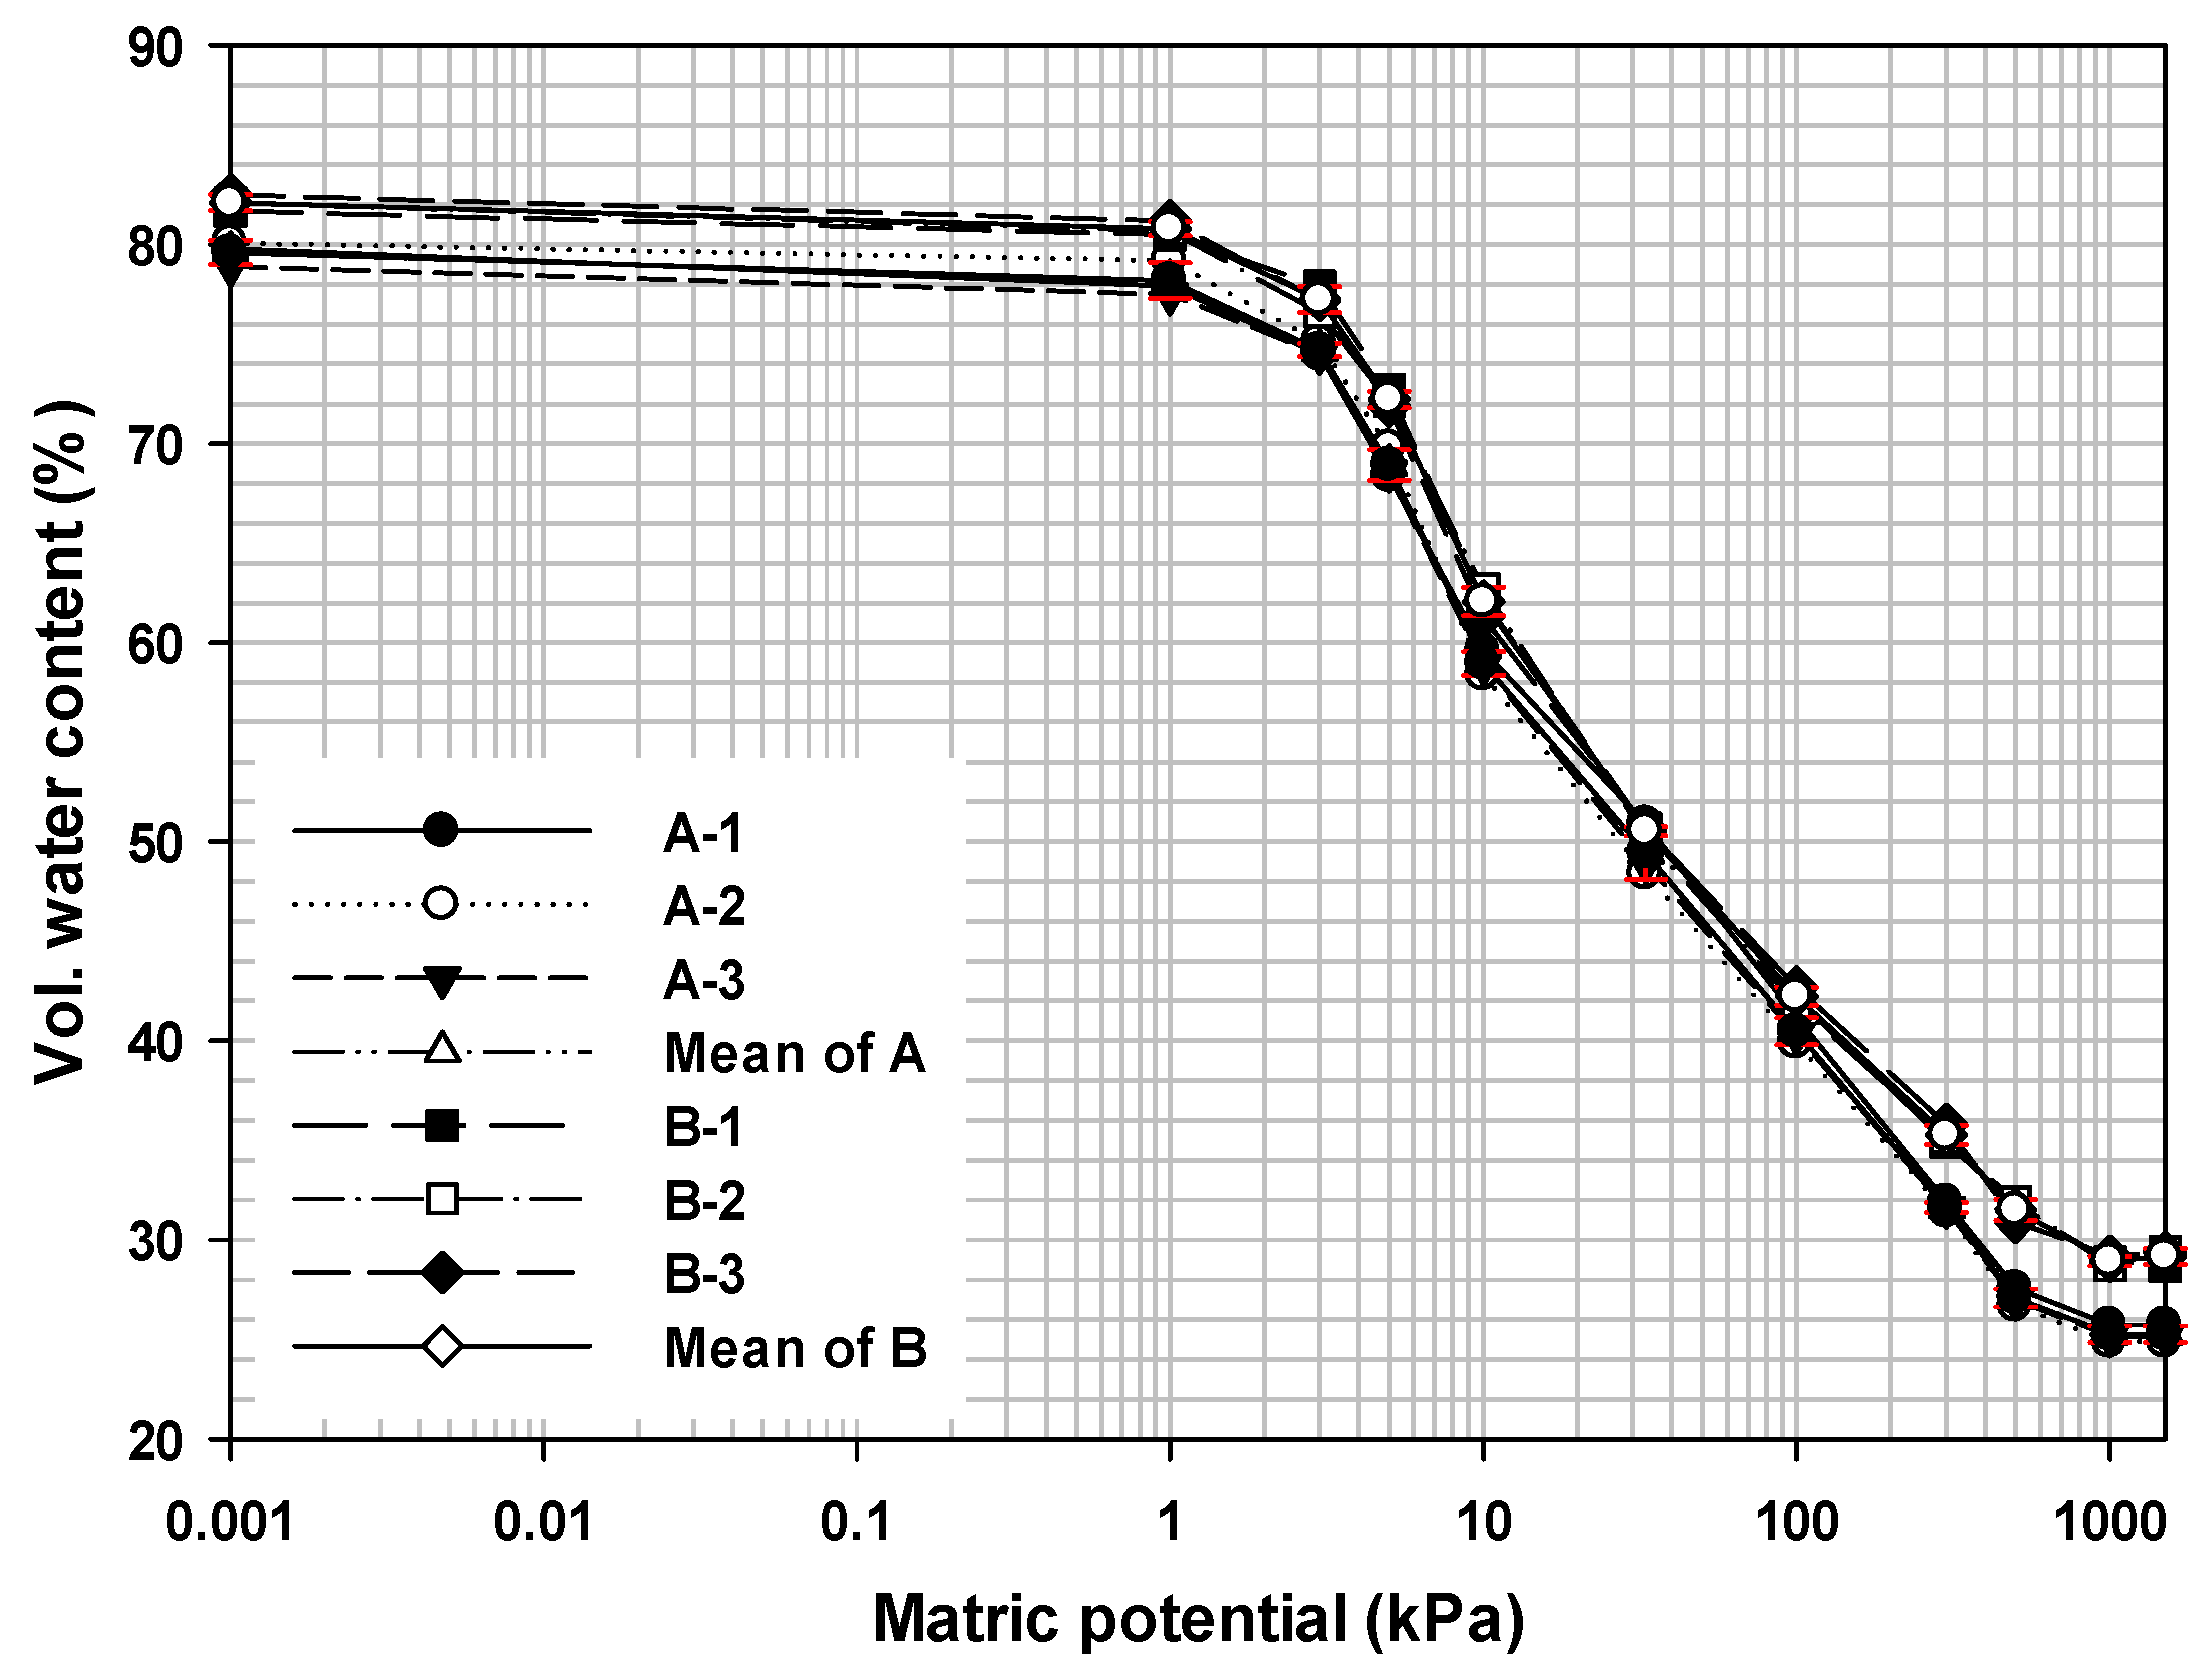
The water retention curve that gives us important information on differential water capacity, which represents changes in the water content per potential unit, included the relations between the matrix potential and the water content. EP holds water in one of three ways: in between individual grains, in channels leading to the cores of the particles, and on the highly irregular surfaces of each particle, with the result that the amount of water taken up by particles of perlite is largely determined by the particle size distribution [2]. Figure 3 shows that the shapes of measured WRCs for EP A and B at water potentials ranging from 0 to −1500 kPa were similar. The matrix potential of the saturated volumetric water content, θs, was selected at a water potential close to zero. θv, corresponding to each matric potential, decreased to the residual water content, θr, as the matric potential increased from 0 to −1500 kPa for all EP samples. The WRCs of three samples of each EP were similar, while the WRCs of three samples of EP B was higher than those of EP A in all corresponding water potentials. The WRCs of respective EP samples showed a fairly consistent slope with a more substantial decline between −1 and −500 kPa, although the decrease in θv was very small as the matric potential increased from zero (corresponding to the saturation state) to −1 KPa. A significant water content drop at water potentials larger than 5 kPa is observed for all EPs, which could be interpreted as the air entry value of the macroporosity. At water potentials higher than 5 MPa, all the curves tend to converge to a common residual state governed by the hygroscopicity of all EPs (adsorption mechanism).
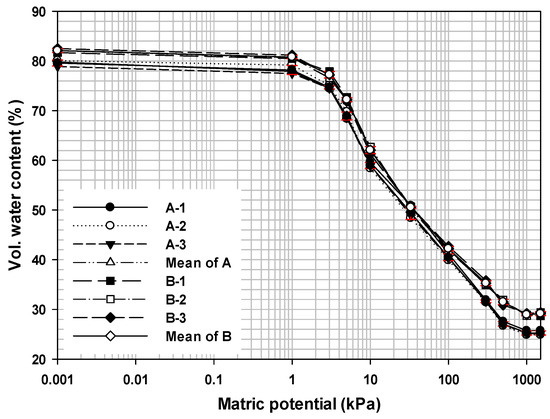
Figure 3.
Water retention curves corresponding to the water potential ranging from 0 to –1500 kPa for EP A and B. A: Turkey; B: China.
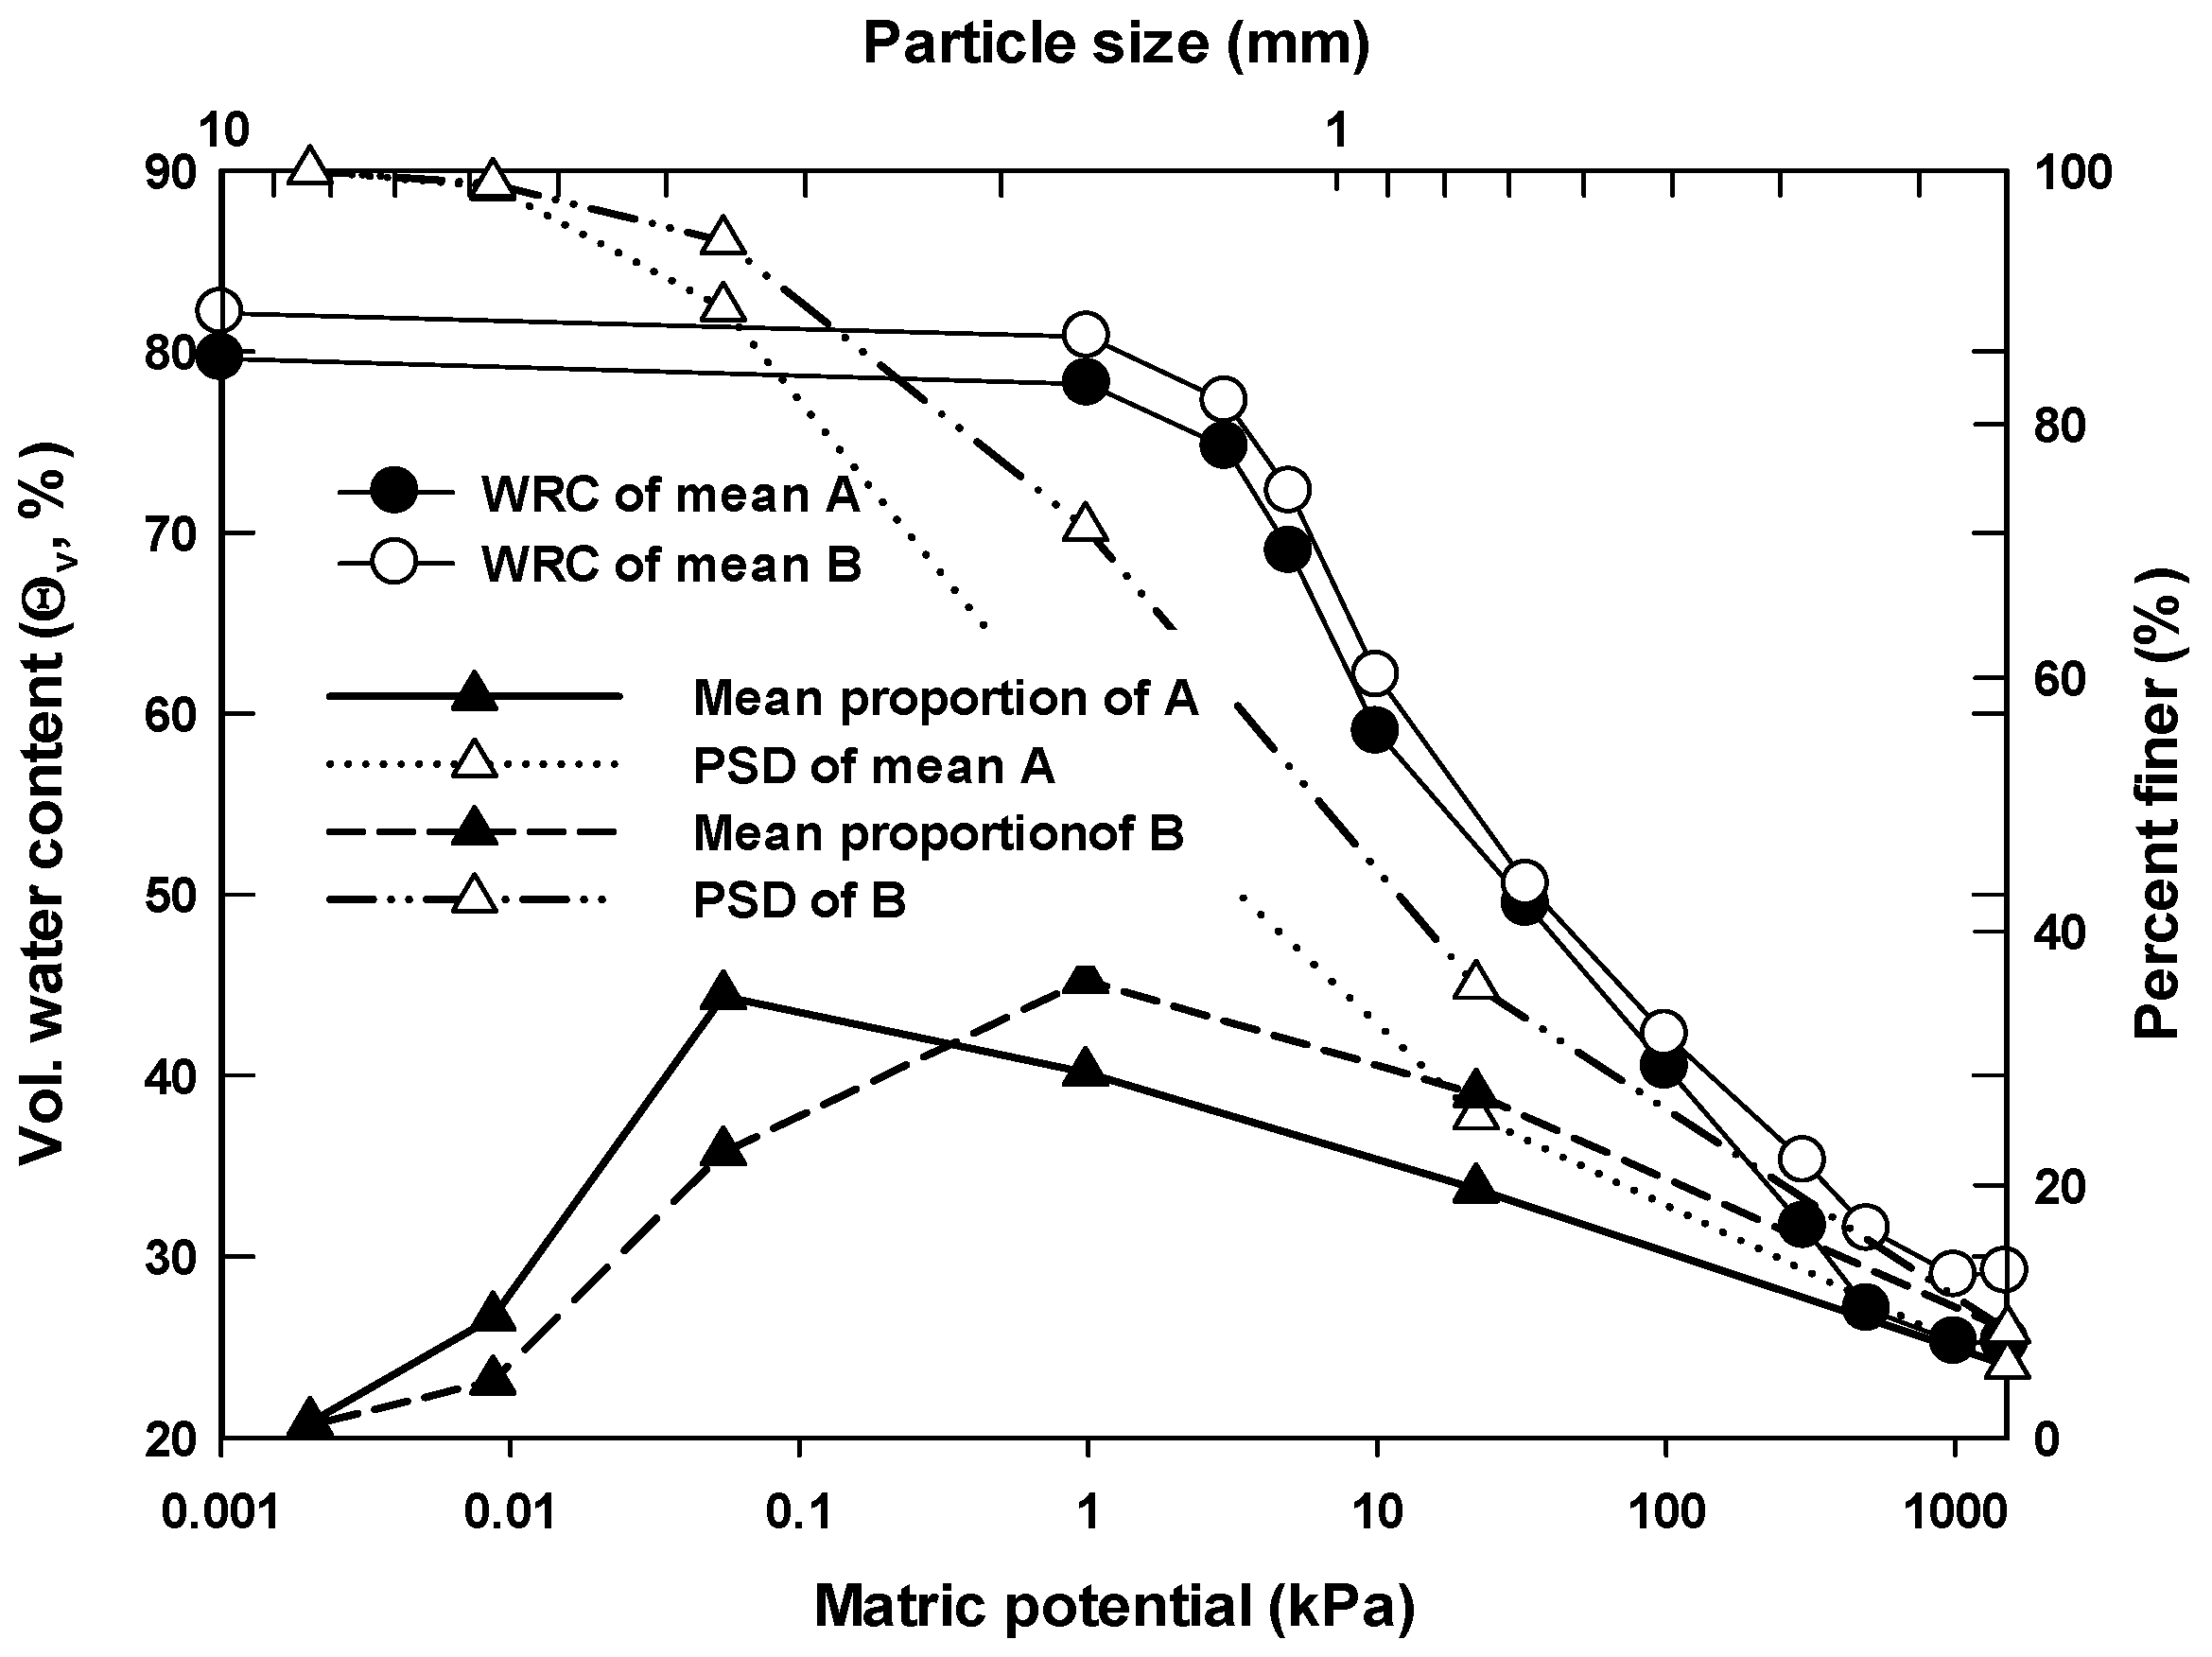
Due to the similarity between the shape of the particle size distribution and the shape of the water retention curve, the mathematical fit of the particle size distribution can be used to develop an algorithm capable of predicting the WRCs of soils, although the inclusion of PSD using precise methodologies has not been studied so far. However, traditional models predicting the WRC from the PSD always underestimate the water content in the dry range of the WRC [29]. Figure 4 shows the relationships among particle-size distribution (PSD) with proportion of particle size and water retention curve (WRC) between EP-A and B. The shapes of measured WRCs at each water potential ranging from 0 to −1500 kPa and PSDC for EP A and B were similar, while the percent values of PSDC were higher than those values of θv corresponding to each water potential greater than 0.1 kPa. As seen in Figure 4, the differences of θv between EP A and B corresponding to water potentials between 0.1 and 300 kPa decreased with increasing differences of PSDC between EP A and B. From these results, we could assume that the larger and the smaller particle sizes of EP A and B influenced θv of EP A and B.
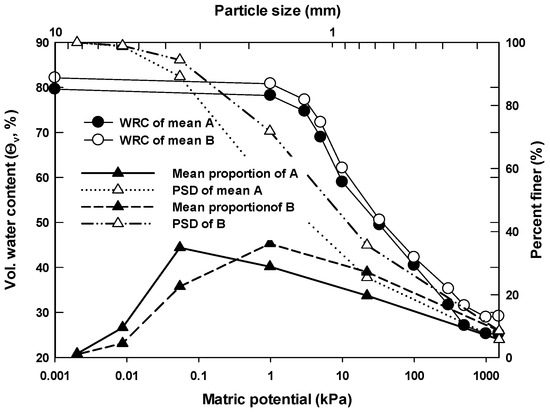
Figure 4.
Relationships among particle-size distribution (PSD) with proportion of particle size and water retention curve (WRC) between EP-A and B. A: Turkey; B: China.
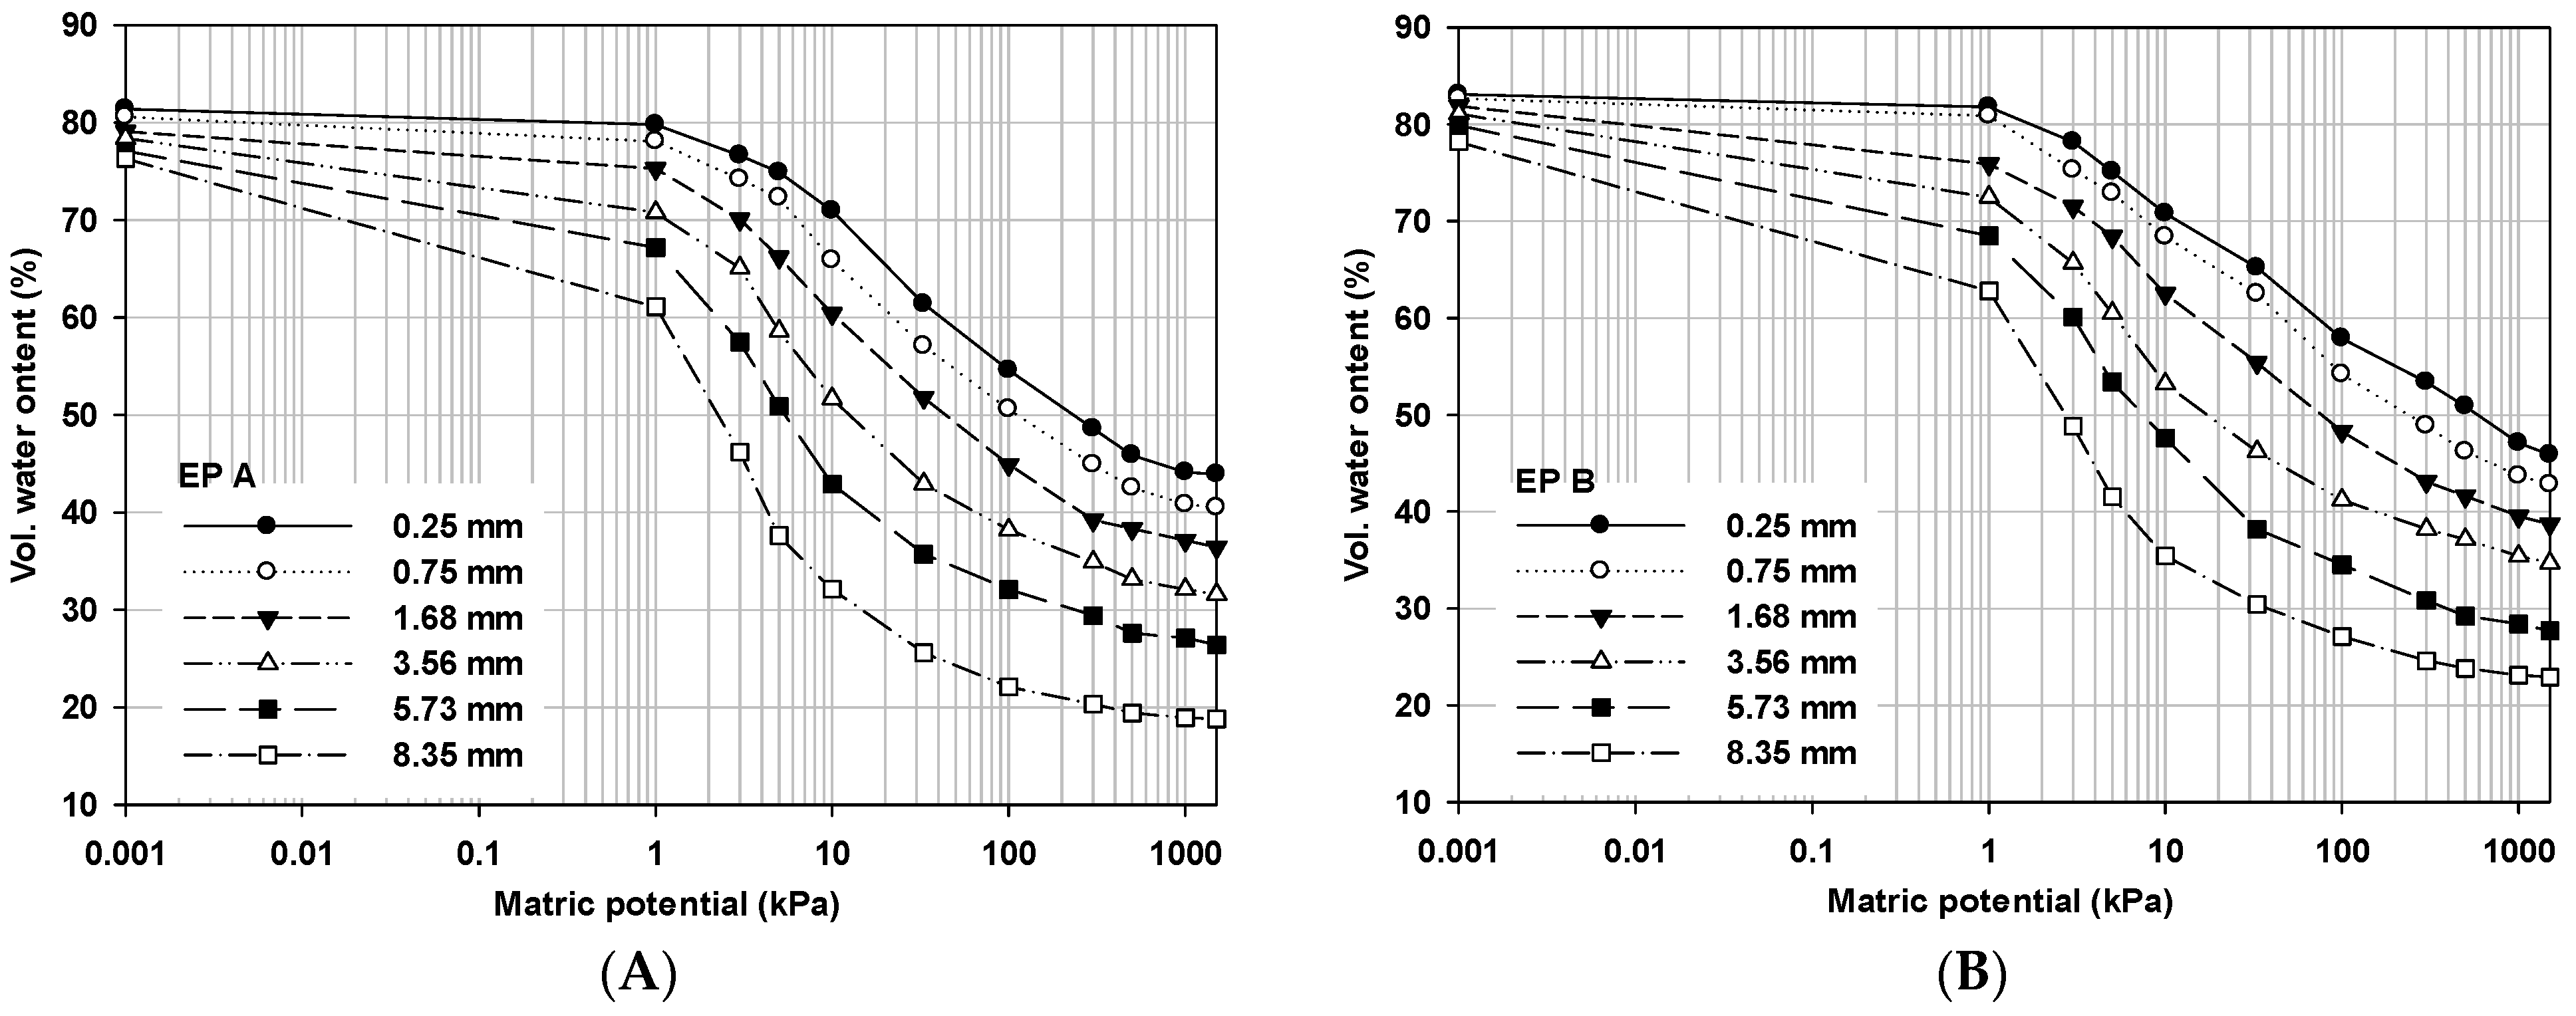
We observed water retention curves corresponding to the water potential ranging from 0 to −1500 kPa for six particle size ranges of respective EP A and B (Figure 5). For all sizes of the perlite particle, θv was decreased with the increasing matric potential, and the decrease in θv corresponding to each matric potential was distinctive with increasing particle size, especially with the particle size greater than 3.56 mm in diameter, while the θr regarded as residual water content was increased with decreasing particle size. For the changes of water content with the increasing average particle size from 0.25 mm to 8.35 mm for EP A and B, the saturated water contents, θv measured at 0 matric potential, were decreased from 81.4% to 76.3% and from 83.1% to 78.2%, respectively, and the residual water contents, θv measured at −1500 matric potential, were also decreased from 43.9% to 18.8% and from 45.9% to 22.9%, respectively. The differences of θv between the saturated and the residual ranged from 37.5% to 57.5% and from 39.9% to 55.3% with increasing average particle size from 0.25 mm to 8.35 mm for EP A and B, respectively. In addition, the differences of θv corresponding to each matric potential between 0.25 mm (the smallest) and 8.35 mm (the largest) were increased to 38.9% and 35.4% at the matric potential of −10 kPa and then decreased to 25.1% and 23.0% for EP A and B, respectively.
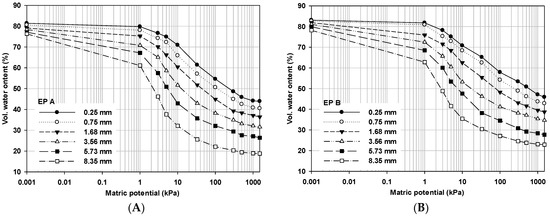
Figure 5.
Water retention curves corresponding to the water potential ranging from 0 to −1500 kPa for six different median particle size ranges for EP A and B, respectively. (A): Turkey; (B): China.
Generally, growth substrate may start to desaturate, and the amount of water in growth substrate decreases significantly with increasing matric potential in the transition stage when the matric potential is larger than the air-entry value, as the point at the largest pores which air starts to displace water in a porous medium. As seen in Figure 5, matric potential corresponding to rapid drop of water content in EP A and B increased with increasing average particle size. From these results, we could assume that water content retained by the different sizes of EP could be attributed by pore volume that could be changed by external and internal pores depending on size and surface area in the perlite particle.
4. Conclusions
In this study, we obtained the measured WRCs of various sizes of EP needed for development of pedotransfer functions (PTFs) to select the proper formulation method of various sizes of EP based on the available and unavailable water contents of EP as a standalone growth medium in SCS because the experimental determination of WRC of EP is time consuming and labor intensive. Therefore, it is imperative to develop a simple, intuitive, and quick method to predict the available and unavailable water contents of respectively formulated EP consisting of the various proportions of different particle sizes. Considering prediction of accurate plant-available water content in each respective formulation of EP, we need to verify air-entry value and residual water content corresponding to respective water potential. However, the estimated water content of the formulated EP that have occluded different pore volumes included in the various sizes of EP may not represent the actual water content that can be delivered to the plant roots at different water potential levels, although the quantity of available water of EP can be determined by the grades and the proportions of variable particle sizes of EP. Conclusively, the measured water content for each range of EP particles should determine the amounts of available and unavailable water for respective formulation of EP.
Author Contributions
Conceptualization, D.-Y.C.; methodology, K.-S.L., D.-S.L. and C.-S.L.; software, K.-S.L. and S.-P.L.; validation, K.-S.L., D.-S.L. and S.-P.L.; writing—original draft, K.-S.L. and C.-S.L.; writing—review and editing, J.-E.Y. and D.-Y.C. All authors have read and agreed to the published version of the manuscript.
Funding
This subject is supported by Korean Ministry of Environment as “The SS (Surface Soil conservation and management) projects; 2019002820004”.
Institutional Review Board Statement
Not applicable.
Informed Consent Statement
Not applicable.
Data Availability Statement
Not applicable.
Conflicts of Interest
The authors declare that they have no conflict of interest. The funder had no role in the design of the study; in the collection, analyses, or interpretation of data; in the writing of the manuscript, or in the decision to publish the results.
References
- Savvas, D.; Gianquinto, G.; Tüzel, Y.; Gruda, N. Soilless culture. In Good Agricultural Practices for Greenhouse Vegetable Crops–Principles for Mediterranean Climate Areas; Plant Production and Protection Paper, 217th ed.; Baudoin, W., Ed.; FAO: Rome, Italy, 2013; pp. 303–354. [Google Scholar]
- Perlite Institute. Water-Holding Capacity of Perlite. 2019. Available online: https://hessperlite.com/PDFs/Perlite-Water-Holding-Capacity.pdf (accessed on 11 April 2022).
- Papadopoulos, A.P. Inorganic and Synthetic Organic Components of Soilless Culture and Potting Mixes. In Soilless Culture: Theory and Practice; Michael, R., Heinrich Lieth, J., Eds.; Academic Press: San Diego, CA, USA, 2008; pp. 505–544. [Google Scholar]
- Lorenzo, D.R.; Pisciotta, A.; Santamaria, P.; Scariot, V. From soil to soil-less in horticulture: Quality and typicity. J. Agron. 2013, 8, 30. [Google Scholar] [CrossRef]
- Gruda, N. Current and future perspective of growing media in Europe. Acta Hortic. 2012, 960, 37–43. [Google Scholar] [CrossRef]
- Gruda, N.S. Increasing Sustainability of Growing Media Constituents and Stand-Alone Substrates in Soilless Culture Systems. Agronomy 2019, 9, 298. [Google Scholar] [CrossRef]
- Gruda, N.; Bisbis, M.B.; Tanny, J. Impacts of protected vegetable cultivation on climate change and adaptation strategies for cleaner production—A review. J. Clean. Prod. 2019, 225, 324–339. [Google Scholar] [CrossRef]
- Raviv, M.J.; Lieth, H. Soilless Culture: Theory and Practice, 1st ed.; Elsevier Science: San Diego, CA, USA, 2007; pp. 523–532. [Google Scholar]
- Martínez-Blanco, J.; Lazcano, C.; Christensen, T.H.; Muñoz, P.; Rieradevall, J.; Møller, J.; Antón, A.; Boldrin, A. Compost benefits for agriculture evaluated by life cycle assessment. A review. Agron. Sustain. Dev. 2013, 33, 721–732. [Google Scholar] [CrossRef]
- Burés, S.; Gago, M.C.; Martinez, F.X. Water characterization in granular materials. Acta Hortic. 1997, 450, 389–396. [Google Scholar] [CrossRef]
- Burés, S.; Marfa, O.; Perez, T.; Tebar, J.A.; Lloret, A. Measure of substrates unsaturated hydraulic conductivity. Acta Hortic. 1997, 450, 297–304. [Google Scholar] [CrossRef]
- Romero, E.; Vaunat, J. Retention curves of deformable clays. In Experimental Evidence and Theoretical Approaches in Unsaturated Soils; Tarantino, A., Mancuso, C., Eds.; Balkema: Rotterdam, The Netherlands, 2000; pp. 91–106. [Google Scholar]
- Hillel, D. Environmental Soil Physics; Academic Press: San Diego, CA, USA, 1998. [Google Scholar]
- Driessen, P.M.; Konijn, N.T. Land-Use Systems Analysis; Department of Soil Science and Geology, Wageningen Agricultural University: Wageningen, The Netherlands, 1992. [Google Scholar]
- Simms, P.H.; Yanful, E.K. Predicting soil–water characteristic curves of compacted plastic soils from measured pore-size distributions. Geotechnique 2002, 52, 269–278. [Google Scholar] [CrossRef]
- Milks, R.R.; Fonteno, W.C.; Larson, R.A. Hydrology of horticultural substrates: III. Predicting air and water content in limited-volume plug cells. J. Am. Soc. Hortic. Sci. 1989, 114, 57–61. [Google Scholar] [CrossRef]
- Al Naddafa, O.; Livieratos, I.; Stamatakisa, A.; Tsirogiannisb, I.; Gizasb, G.; Savvasc, D. Hydraulic characteristics of composted pig manure, perlite, and mixtures of them, and their impact on cucumber grown on bags. Sci. Hortic. 2011, 129, 135–141. [Google Scholar] [CrossRef]
- Marco, B.; Markus, F. Errors in Water Retention Curves Determined with Pressure Plates. Soil Sci. Soc. Am. J. 2008, 73, 1453–1460. [Google Scholar]
- Olivella, S.; Gens, A. Vapour transport in low permeability unsaturated soils with capillary effects. Trasp. Porous Media 2000, 40, 219–241. [Google Scholar] [CrossRef]
- Vanapalli, S.K.; Fredlund, D.G.; Pufahl, D.E. The influence of Soil Structure and Stress History on the Soil-Water Characteristics of a Compacted Till. Geotechnique 1999, 49, 143–159. [Google Scholar] [CrossRef]
- van Genuchten, M.T.; Leij, F.; Lund, L. Indirect Methods for Estimating the Hydraulic Properties of Unsaturated Soils; University of California: Riverside, CA, USA; US Department of Agriculture Salinity Laboratory: Riverside, CA, USA, 1992; p. 718.
- Bartley, P.C.; Amoozegar, A.; Fonteno, W.C.; Jackson, B.E. Particle density of substrate components measured by gas pyc nometer. Acta Hortic. 2020, 1273, 17–22. [Google Scholar] [CrossRef]
- Fonteno, W.C.; Harden, C.T. Procedures for Determining Physical Properties of Horticultural Substrates Using the NCSU Porometer; Horticultural Substrates Laboratory, North Carolina State University: Raleigh, NC, USA, 2003. [Google Scholar]
- Bragg, N.C.; Chambers, B.J. Interpretation and advisory applications of compost air-filled porosity (AFP) measurements. Acta Hortic. 1988, 221, 35–44. [Google Scholar] [CrossRef]
- Smith, K.S.; Mullins, C.E. (Eds.) Soil Analysis: Physical Methods; Marcel Dekker: New York, NY, USA, 1991. [Google Scholar]
- Fredlund, M.D.; Fredlund, D.G.; Wilson, G.W. Prediction of the Soil-Water Characteristic Curve from Grain-Size Distribution and Volume-Mass Properties. In Proceedings of the 3rd Brazilian Symposium on Unsaturated Soils, Rio de Janeiro, Brazil, 22–25 April 1997. [Google Scholar]
- Yang, B.; Yang, T.; Xu, Z.; Liu, H.; Yang, X.; Shi, W. Impact of Particle-Size Distribution on Flow Properties of a Packed Column. J. Hydrol. Eng. 2019, 24, 04018070. [Google Scholar] [CrossRef]
- Bartley, P.C.; Amoozegar, A.; Fonteno, W.C.; Jackson, B.E. Particle Densities of Horticultural Substrates. Am. Soc. Hortic. Sci. 2022, 57, 5. [Google Scholar] [CrossRef]
- Chang, C.C.; Cheng, D.H. Predicting the soil water retention curve from the particle size distribution based on a pore space geometry containing slit-shaped spaces, Hydrol. Earth Syst. Sci. 2018, 22, 4621–4632. [Google Scholar] [CrossRef] [Green Version]
Publisher’s Note: MDPI stays neutral with regard to jurisdictional claims in published maps and institutional affiliations. |
© 2022 by the authors. Licensee MDPI, Basel, Switzerland. This article is an open access article distributed under the terms and conditions of the Creative Commons Attribution (CC BY) license (https://creativecommons.org/licenses/by/4.0/).