Abstract
Some plants are susceptible to iron (Fe) toxicity, resulting in excess leaf Fe, followed by photo-oxidative damage and necrosis. Avoidance of Fe toxicity should relate to root Fe-uptake properties, including the concentration of Fe-uptake proteins, which are rarely measured. Therefore, we compared responses to Fe toxicity in marigold (Tagetes erecta), a species prone to Fe toxicity, with tomato (Solanum lycopersicum) to determine which root responses were related to Fe-toxicity sensitivity. Plants were grown at 5, 50, and 500 µM Fe. Biomass decreased at 50 and/or 500 vs. 5 µM Fe in both species, with leaf necrosis occurring in marigold. Fe uptake per g root increased with increasing Fe in both species. Root and shoot Fe increased with Fe availability, with Fe much higher in roots than in shoots. Root Fe was higher in tomato, but shoot Fe was higher in marigold. Root protein levels of IRT, the main Fe transporter, decreased from 5 to 50 µM Fe in both species, but further decreased at 500 µM Fe only in tomato. In contrast, responses of secondary Fe-uptake proteins, FRO and H+-ATPase, were similar in the two species. Marigold was likely more susceptible to Fe toxicity because it could not prevent Fe transport to, and accumulation in, leaves; and its sensitivity to high Fe corresponded to a limited capacity to down-regulate IRT as available Fe increased.
1. Introduction
Iron (Fe) is an essential micronutrient for plants, used in the production of chlorophyll and as a component of many electron-transport and redox proteins [1,2]. Plants require only a small amount of available Fe (e.g., 10–100 µM in liquid fertilizer) to satisfy tissue Fe requirements (ca. 50–150 μg·g−1, or ppm, on a dry mass basis, depending on species) [2,3]. In most soils, the concentration of bioavailable Fe in soil solution is typically very low (<10−15 M) [2], where it exists mostly in ferrous (Fe II or Fe2+) or ferric (Fe III or Fe3+) forms. The ferrous form is soluble at all pH levels, but the ferric form precipitates at pH > 3, so in most soils, much of the Fe is in the insoluble ferric form and of limited availability to plants [2]. Importantly, Fe toxicity is common, with approximately 20–30% of global soils having potentially toxic levels of Fe, either because of high Fe solubility at low pH or high levels of total Fe [3,4].
Depending on species and environmental conditions, plant tissue Fe concentrations above ca. 300-to-400 μg·g−1 (on a dry mass basis) result in Fe toxicity [2,3]. Plants respond to Fe toxicity with a range of morphological and physiological changes to slow uptake at high Fe or safely sequester Fe (e.g., as in ferritin or in vacuoles) [3,4]. As excess Fe in leaves primarily causes oxidative damage in the chloroplast, adaptations to high Fe include up-regulation of leaf antioxidants and safe compartmentalization of Fe [3,4].
Plants procure most of their Fe from the soil via root uptake, using Fe-uptake proteins located in cellular membranes, and these proteins are also often involved in Fe transport throughout the plant [1,3,5]. Soil Fe is taken up by root Fe-uptake proteins in one of two ways: Strategy I (reducing) or Strategy II (chelating) [1]. In Strategy-I plants (many eudicots), Fe3+ is reduced to Fe2+ at the root cell membrane by Ferric Reduction Oxidase (FRO1 or 2, depending on species) before transport into root cells by Iron Regulated Transporter 1 (IRT1) [1]. Strategy-I plants also lower the pH of the rhizosphere in order to solubilize Fe, by excreting H+ ions from their roots (or “proton pumping”), using the plasma-membrane H+-ATPase. Strategy-II plants (most grasses) secrete phytosiderophores, small molecules with a high affinity for Fe (or chelators), and these Fe-chelator complexes are then taken up by roots (e.g., by YSL transporters) [1,6]).
At low Fe, Strategy-I plants will often increase IRT gene expression, increase the rate of root proton pumping into the rhizosphere to lower pH and increase bioavailable Fe, or increase ferric reductase activity, presumably by increasing FRO levels [1,3,7]. Though many studies have measured IRT, FRO, or H+-ATPase mRNA levels in response to variability in available Fe, relatively few studies have examined protein expression of IRT, FRO, or H+-ATPase, especially at normal vs. high Fe [1,3,4,7]. We do not know if FRO, IRT, and H+-ATPase protein levels in roots respond similarly to variation in soil Fe across a range from low to high, or if protein levels directly scale with root Fe-uptake rate or Fe levels in plant tissue. It is also not yet clear if an inability to down-regulate the main Fe-uptake proteins under high-Fe conditions plays a role in plant susceptibility to Fe toxicity. So, two goals of this research were to determine: (1) if the levels of key Fe-uptake proteins in roots respond in coordination to Fe toxicity, and (2) if Fe toxicity in plants is correlated with the inability to down-regulate any of the main Fe-uptake proteins at high Fe.
These objectives were addressed by comparing responses in marigold and tomato, two eudicots exhibiting Fe-uptake Strategy I. Marigold and tomato are important horticultural plants in the United States (U.S.) and globally [8]. Tomato alone generated ca. one billion dollars of sales in the U.S. in fiscal year 2021 [9]. Tomato has been a model Strategy-I species for Fe deficiency research [10], as it is prone to Fe deficiency (especially at pH > 6), and marigold is prone to Fe toxicity (especially at pH < 6) [11,12]; however, the reasons why these two species are prone to Fe stress are not fully understood. As such, another goal of this study was to investigate causes of Fe toxicity in marigold, by comparing its responses to that of tomato.
2. Materials and Methods
2.1. Materials and Growth Conditions
Marigold (Tagetes erecta, cultivar unknown) and tomato (Solanum lycopersicum cv Roma) were grown hydroponically and provided 5, 50, or 500 µM Fe, with the latter treatment meant to ensure Fe toxicity (n = 5–6 per treatment per species). Plants were harvested after they began to exhibit visual symptoms of Fe stress, at which time root and shoot biomass, Fe concentration in plant tissue, levels of key Fe-uptake proteins in roots (IRT, FRO, and H+-ATPase), and Fe uptake per g root (=total plant Fe per g root) were determined. The marigold experiment was conducted from 22 July to 5 August 2021 (14 days), and the tomato experiment was conducted from 1 October to 14 October 2021 (13 days). Young marigold plants (<12 cm tall) in flats were purchased from a local greenhouse, rinsed clean of peat moss, directly transferred to a hydroponics setup, and grown in a greenhouse at the University of Toledo (Toledo, OH, USA) for ca. one week to allow for acclimation. Tomato plants were grown from seed in peat moss (Promix with Biofungicide, Premier Tech Horticulture, PA, USA) until vegetative (young adult) leaves appeared. Once the plants produced their first set of adult leaves, they were fertilized thrice weekly with a complete nutrient solution (see below) containing 50 µM Fe and grown until they reached ca. 20 cm tall (young pre-reproductive plants with 3–5 opened adult leaves). Peat moss was washed from the roots of these plants before transferring them to hydroponics. All experiments were conducted in the greenhouse, at ambient photoperiod and light levels (maximum of ca. 80% full sun) and with air temperatures of ca. 28–32 °C during the day and 22–24 °C during the night; greenhouse humidity was not controlled and was ca. ambient, as greenhouses were vented.
2.2. Hydroponics and Nutrient Solutions
Plants were grown hydroponically in 2.5-L opaque plastic buckets with opaque lids (each lid had a 2.5 cm hole in the center for the plant and a second 0.5 cm hole towards the outside for an aeration tube). Each bucket contained a single plant suspended through the lid’s hole at the shoot-root interface and 2.2 L of nutrient solution. Buckets were continuously aerated using aquarium tubing, air stones, and aquarium-grade air pumps (one air stone per bucket and two to three buckets per pump, depending on experiment). After transferring plants to hydroponics, they were grown in a medium Fe (50 µM) solution for 5 days, to allow for acclimation. Plants were then randomly divided into the experimental treatments and arranged in a randomized block design (with Fe treatments as blocks), and with blocks rotated spatially once per week.
The nutrient solution (excluding Fe) supplied to all treatments contained 6 mM KNO3, 0.5 mM NH4Cl, 1 mM KH2PO4, 1 mM MgSO4, 2 mM CaCl2, 50 µM H3BO3, 10 µM MnCl2, 2.0 µM CuSO4, 2.0 µM ZnSO4, and 0.1 µM NaMoO4 (pH 6.0 ± 0.1). Iron was provided in equal parts as FeSO4 and FeCl3, to ensure that both Fe3+ and Fe2+ were available to plants. Nutrient solution was completely replaced every third day for marigold and every other day for tomato (due to the faster rate at which tomato plants grew). In between solution changes, water levels in buckets were replenished daily with deionized (DI) water, to maintain water volume. Regular monitoring of hydroponic solution pH was conducted with a pH probe and meter (UP-10, Denver Instruments, NY, USA), which indicated that pH was relatively stable between solution changes.
2.3. Harvesting and Fe Analysis
At harvest, plants were separated into shoots and roots. Root systems of each plant were divided longitudinally, patted dry, and weighed to determine fresh mass. Half of each root system was immediately frozen (−70 °C) for use in determining levels of Fe-uptake proteins. The other half of the root system and the entire shoot were individually dried to constant mass at 70 °C for use in determining the concentration of Fe in plant tissues. After plants were dried, all dry root and shoot tissue was ground to a fine powder and homogenized. The ratio of fresh-to-dry mass did not differ significantly among treatments for either species, but did differ between species (mean = 12.1 for marigold and 8.4 for tomato).
The concentration of Fe in plant tissue was measured using ICP-OES (inductively coupled plasma, optical emission spectroscopy (model iCAP 6300 duo, Thermo Electron Corp., Waltham, MA, USA), following digestion of the sample in a microwave digester (MARS6; CEM Corp., Matthews, NC, USA). A 0.25 g sub-sample of shoot tissue was digested using a modified Environmental Protection Agency (EPA) method (EPA method 3051 with an additional peroxide step). Since root mass available for digestion was <0.25 g, the procedure was modified (decreased sample mass and decreased volume of HNO3, H2O2, and H2O) to maintain equivalent ratios of solid to liquid components. A peach standard (NIST reference material 1547) of equivalent mass (0.25 g for shoots and 0.10 g for roots) was digested and included every 40 samples; mean percent error during ICP analysis was <4% from the stated value. During ICP-OES analysis, a quality control was run every 10 samples, and if any element was determined to be more than 10% higher or lower than the standard value, the instrument was recalibrated.
2.4. Protein Analysis
To extract total protein from roots, frozen roots were rapidly homogenized, and then root sub-samples (0.5 g) were ground in liquid nitrogen to a fine powder in a mortar and pestle. While tissue was still cold, it was then ground in 2 mL of extraction buffer containing 0.1 M Tris (tris(hydroxymethyl) aminomethane) pH 8.0, 2% sodium dodecyl sulfate (SDS), 1% sucrose (w/v), 5 mM ethylene-diamine-tetra-acetic acid (EDTA), 1 mM phenyl-methyl-sulfonyl fluoride, 10 µM leupeptin, 10 mM ascorbate, and 10 mM dithiothreitol. Protein extractions were then centrifuged at 16,000× g for two minutes, and supernatants were collected and frozen at −80°C before further quantification. The concentration of total protein in root extracts was determined using a modification of the Lowry assay (RCDC Protein Assay, Bio-Rad, Hercules, CA, USA), using bovine-serum-albumin (BSA) standards (Quick Start Bovine Serum Albumin (BSA) Standard Set, Bio-Rad) to generate a calibration curve.
Relative levels of H+-ATPase, FRO, and IRT per unit total root protein were determined by the immuno slot-blot (or dot-blot) technique. Samples containing 9 µg of root protein were vacuumed onto nitrocellulose membrane (0.45-micron pore size, Bio-Rad), and then membranes were blocked for at least 2 h with 5% (w/v) powdered milk in TBST (20 mM Tris pH 8.0, 50 mM NaCl, 0.05% Tween). Membranes were rinsed three times with TBST, incubated for 2 h with primary rabbit antibodies in TBST plus 1% milk, washed three times with TBST, incubated for 1 h in secondary antibodies (goat-anti-rabbit antibody conjugated to alkaline phosphatase (product 170-6518, Bio-Rad), and washed three times with TBST. Secondary antibodies were detected by reaction of alkaline phosphatase with nitroblue tetrazolium and 5-bromo-4-chloro-3-indolyl phosphate (NBT/BCIP Tablets, Roche, Germany), producing a blue deposit. Color density was quantified after digitizing the blots, using ImageJ software (version 1.53t, created by Wayne Rasband and the National Institutes for Health, USA, https://imagej.nih.gov/ij/ (accessed on 19 July 2022)). Antiserum to H+-ATPase and IRT1 (hereafter IRT) was obtained commercially (products AS11 1780 and AS07 260, respectively; Agrisera, Sweden); both are approved for use in Western blotting and enzyme-linked immunosorbent assay (ELISA). Antiserum to FRO1 (hereafter FRO) was generated to a conserved peptide (VTRGSSVLPLFGLTSEGSIK) and tested for specificity by SDS-polyacrylamide-gel electrophoresis (SDS-PAGE), as described in Bista et al. (2018) [13]. For FRO, replicate samples on each blot were probed with pre-immune serum, and non-specific background was subtracted from the immune-serum signal. The specificity of FRO antiserum was checked by SDS-PAGE and Western blotting, to confirm that the antiserum detected only one major band of the appropriate molecular weight under the working dilutions above (not shown).
2.5. Statistical Analyses
Results were analyzed separately for each species (as each was an independent experiment), using one-way analysis of variance (ANOVA; with Fe level as the main factor). Tukey’s post hoc test was then used if results from ANOVA were significant (p ≤ 0.05). Results were checked for normality and equal variances, and if either check failed, then results were also analyzed with non-parametric ANOVA (this only occurred twice: Fe uptake per g root and IRT concentration, both failing the equal-variance check). Since parametric and non-parametric ANOVAs yielded similar conclusions, only results from parametric ANOVAs are shown, and all results presented are untransformed means (n = 5–6 per treatment per species) and standard errors of means. All analyses were conducted using Sigmaplot software (version 14.2, Systat Software Inc., Chicago, IL, USA).
3. Results
In marigold, visible symptoms of Fe toxicity were evident in leaves at high Fe (necrotic spotting), but no such damage was evident at medium (not shown) or low Fe (Figure 1). In contrast, no visible symptoms of Fe toxicity were evident in leaves of tomato.
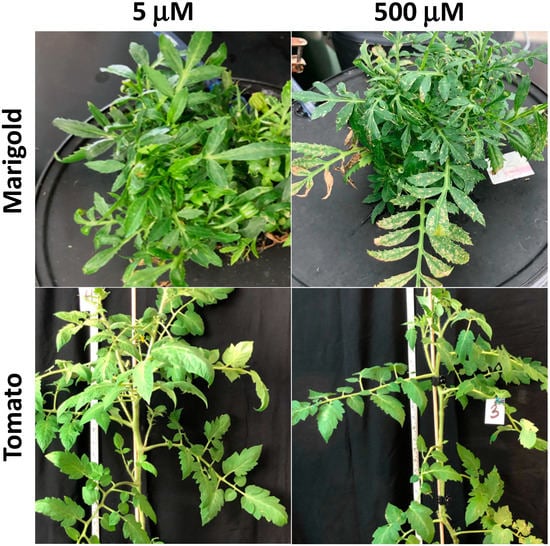
Figure 1.
Effects of variation in Fe availability in marigold and tomato on leaf appearance. Note leaf damage from high Fe in marigold, visible as brown spots, while no damage is apparent in tomato.
In marigold, both total plant mass and root-to-shoot mass ratio decreased as Fe availability increased from 5 to 50 µM and from 50 to 500 µM Fe (note: although total mass did not differ among treatments with ANOVA, a t-test indicated that 5 and 500 μM Fe were different from each other at p = 0.04) (Figure 2). Shoot Fe concentration did not increase from 5 to 50 µM Fe, but increased 2.4-fold from 50 to 500 µM Fe. Root Fe concentration, meanwhile, increased 2.5-fold from 5 to 50 µM Fe, but did not increase further from 50 to 500 µM Fe (500 μM was 1.8-fold higher than 5 μM). Fe uptake per g root increased 2.6-fold from 5 to 50 µM Fe, but did not increase further from 50 to 500 µM Fe. In contrast, the concentration of total protein in roots was unaffected by Fe availability.

Figure 2.
Effects of variation in Fe availability in marigold on total plant fresh mass (FW), root-to-shoot fresh-mass ratio, shoot and root Fe concentration (dry mass basis, DW), Fe uptake per g root; (= total plant Fe per g root, dry mass basis), and root protein concentration (fresh mass basis). Results are means + 1 SE; letters above bars indicate comparisons among treatments (different letters indicate significant differences at p < 0.05).
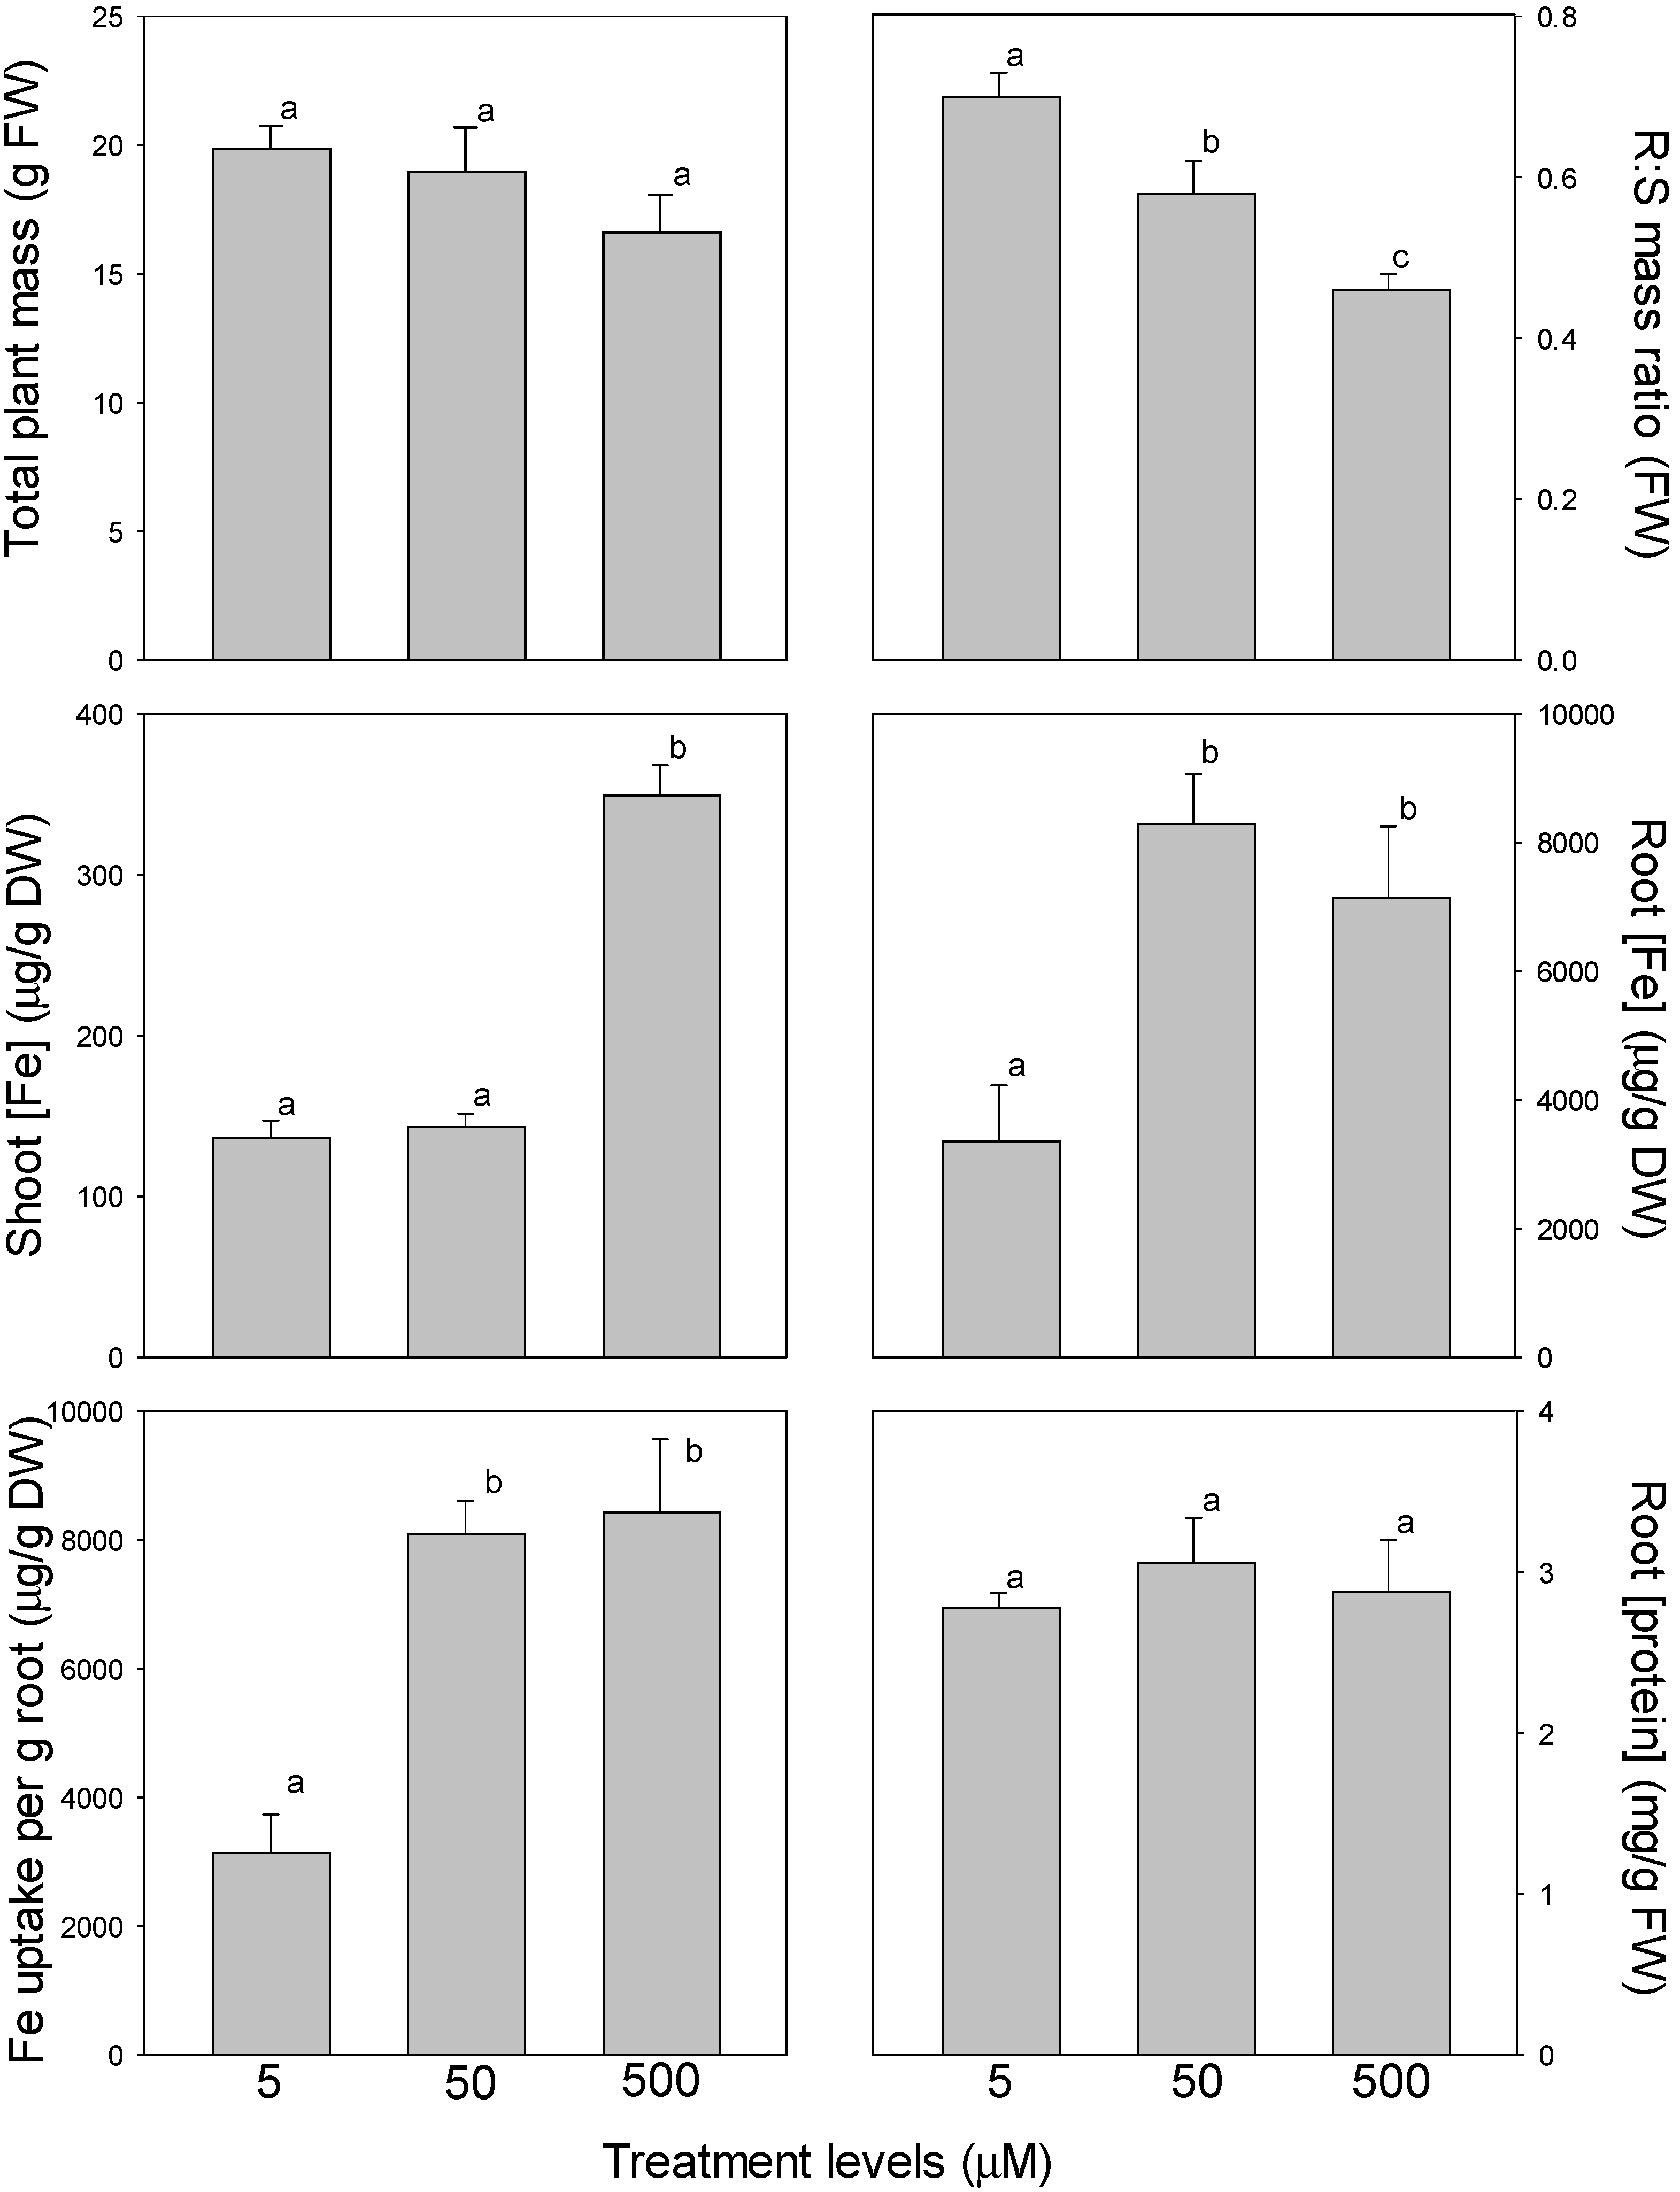
In tomato, total plant mass decreased significantly between 5 and 50 µM Fe, but did not decrease further between 50 and 500 µM Fe (Figure 3). Root-to-shoot mass ratio did not differ significantly among Fe levels. Both roots and shoots exhibited an increasing trend in Fe concentration as Fe availability increased. In shoots, Fe concentration increased 1.8-fold from 5 to 500 µM Fe, while in roots, Fe concentration increased more than 14-fold from 5 to 500 µM Fe. As with root Fe concentration, Fe uptake per g root also increased dramatically from 5 to 500 µM Fe (increasing 13.6 fold). Again, as in marigold, there were no differences in root protein concentrations among Fe levels.
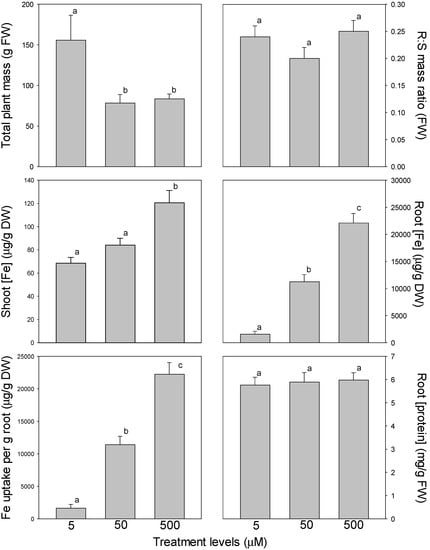
Figure 3.
Effects of variation in Fe availability in tomato on total plant fresh mass (FW), root-to-shoot fresh-mass ratio, shoot and root Fe concentration (dry mass basis, DW), Fe uptake per g root; (= total plant Fe per g root, dry mass basis), and root protein concentration (fresh mass basis). Results are means + 1 SE; letters above bars indicate comparisons among treatments (different letters indicate significant differences at p < 0.05).
In both marigold and tomato roots, the relative concentration of IRT decreased from 5 to 50 µM Fe (albeit non-significantly in marigold) (Figure 4). It remained similar between 50 and 500 µM Fe in marigold, while it continued to decrease (albeit non-significantly) from 50 to 500 µM Fe in tomato (Figure 3). The relative concentration of FRO did not differ between 5 and 50 µM Fe in either species, but decreased non-significantly from 50 to 500 µM Fe in both species. In contrast, the relative concentration of H+-ATPase increased from 5 to 50 µM Fe, but did not differ between 50 and 500 µM Fe in both species.
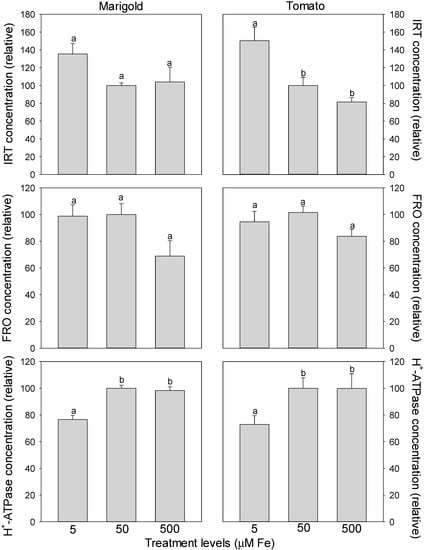
Figure 4.
Effects of variation in Fe availability in marigold and tomato on the relative concentration in roots of the Fe-uptake proteins, IRT, FRO, and H+-ATPase. Results are relativized to 50 µM Fe and are means + 1 SE; letters above bars indicate comparisons among treatments (different letters indicate significant differences at p < 0.05).
4. Discussion
This study aimed to determine how levels of the major Fe-uptake proteins in roots changed in response to supra-optimal Fe availability, and if Fe-toxicity symptoms in plants were associated with an inability to down-regulate these proteins at high Fe. In plants exhibiting Fe-uptake Strategy I, such as marigold and tomato used in this study, the major Fe-uptake protein is IRT, with FRO and H+-ATPase playing secondary roles in Fe uptake. By comparing plant responses to variation in Fe availability in marigold and tomato, we hoped to provide insight as to why marigold is relatively susceptible to Fe toxicity.
In both marigold and tomato, biomass was lower at high compared to low Fe (500 vs. 5 μM). However, leaf damage was evident at high Fe only in marigold. Additionally, in the case of marigold, the root-to-shoot mass ratio (R/S) decreased with increasing Fe, suggesting that either Fe toxicity in roots or down-regulation of root growth to limit Fe uptake was occurring. As expected, plant Fe concentration increased with Fe availability in both species, rising to 350 µg·g−1 (dry mass basis) in leaves and ca. 6000–8300 µg·g−1 in roots in marigold. Tomato leaves had a lower Fe concentration than marigold, only 120 µg·g−1, but a much higher root Fe concentration, >20,000 µg·g−1, at 500 µM Fe. In many species, Fe toxicity in leaves occurs at Fe concentrations above ca. 300–500 µg·g−1 [2,3]. Hence, this study indicates that the sensitivity of marigold (vs. tomato) to leaf damage at high Fe is a result of an inability to limit Fe transport from roots to shoots, leading to toxic Fe levels in leaves. Iron toxicity in both roots and leaves is typically associated with oxidative damage (the latter associated with photoinhibition) [3,4,14,15]. As total protein concentration in the roots of both species was unaffected by Fe availability, root Fe toxicity, if it occurred, did not affect general protein or nitrogen (N) metabolism in roots.
The responses of the main Fe-uptake proteins in roots to excess Fe varied among proteins, and to a lesser degree between species. In tomato roots, the concentration of IRT, the main Fe-uptake protein, decreased as Fe availability and Fe concentration in plant tissue increased, decreasing 33% from 5 to 50 μM Fe and 19% from 50 to 500 μM Fe. In contrast, in marigold, root IRT levels decreased 26% from 5 to 50 μM Fe, but did not decrease any further from 50 to 500 μM Fe, suggesting that an inability to down-regulate IRT at high Fe may contribute to a sensitivity to Fe toxicity in marigold. In both marigold and tomato, FRO levels were similar at 5 and 50 μM Fe, but decreased at 500 μM Fe; hence, FRO levels scaled well with shoot Fe concentration in both species, but less well with root Fe concentration and Fe availability. Unexpectedly, H+-ATPase levels in both marigold and tomato increased from 5 to 50 µM Fe, but did not change from 50 to 500 μM Fe. This H+-ATPase response is counterintuitive, since at low Fe, one might expect that plants would attempt to lower rhizosphere pH to increase Fe solubility and subsequent uptake. Perhaps this unexpected response of H+-ATPase occurred because plants were provided both Fe2+ and Fe3+ via a hydroponic nutrient solution maintained at a near-neutral pH.
Though many previous studies have examined gene expression in plants in response low or high Fe availability [3,4], as well as transcriptional and post-transcriptional regulation of Fe-related genes [5,7], surprisingly few studies have quantified protein levels of major Fe-uptake proteins in response to low or high Fe. For example, root mRNA levels for IRT, FRO, and/or H+-ATPase often increase at low Fe in rice (Oryza sativa; a Strategy-II species) [4]. At the protein level, the concentration of IRT in roots of Arabidopsis thaliana (a Strategy-I species) [16,17] and YSL in roots of maize (Zea mays; a Strategy-II species) [6] have been shown to increase in response to Fe deficiency. In the case of excess Fe, several studies have observed decreased mRNA levels of IRT, FRO, or YSL in rice roots [4,18,19,20], but associated data on protein levels is lacking.
Importantly, changes in expression of IRT and FRO proteins were not sufficient to prevent Fe toxicity in this study (i.e., decreases in biomass), so other adaptations are required for plants to achieve tolerance to excess Fe. For example, one main adaptation of plants to excess Fe in the soil is to retain Fe in the roots and not allow it to be translocated to the shoot, where in excess it can cause photo-oxidative damage [4]. Translocation of Fe from roots to shoots involves the transport of Fe as Fe-citrate complexes [5] and the activity of citrate-efflux-transport proteins (e.g., [21]). Alternatively, plants can store Fe safely, so as to avoid cytotoxicity or oxidative damage. Plants have three main mechanisms to safely store excess Fe: (1) Fe is converted into ferritin, a non-toxic Fe-storage protein found mostly in plastids [4]; (2) Fe can be safely chelated, especially to nicotianamine [4,18]; or (3) Fe is stored in vacuoles via the activity of the Vacuolar Iron Transporter (VIT) [1,4,22]. In species such as marigold, which is especially prone to Fe toxicity at low pH, screening genotypes to identify ones that can exclude Fe from roots or limit translocation of root Fe to shoots is likely an efficient strategy to select for Fe-tolerant cultivars in the future.
Author Contributions
Conceptualization, S.H., J.B.; Methodology, S.H., J.B., E.K.; Investigation, E.K., A.B., S.H., J.T.F.; Data Analysis, E.K., S.H.; Writing—Original Draft Preparation, E.K., S.H.; Writing—Review and Editing, S.H., J.B.; Supervision and Project Administration, S.H.; Funding Acquisition, S.H. and J.B. All authors have read and agreed to the published version of the manuscript.
Funding
This research was funded partially by U.S. Department of Agriculture non-assistance cooperative agreement 58-5082-8-011. Mention of trade names or commercial products in this publication is solely for the purpose of providing specific information and does not imply recommendation or endorsement by the U.S. Department of Agriculture. USDA is an equal opportunity provider and employer.
Data Availability Statement
Not applicable.
Acknowledgments
We thank Heidi Appel for comments on an early draft of this manuscript, Samantha Bigioni for help in sample processing, and reviewers for helpful comments on the manuscript.
Conflicts of Interest
The authors declare no conflict of interest.
References
- Connorton, J.M.; Balk, J.; Rodriguez-Celma, J. Iron homeostasis in plants—A brief overview. Metallomics 2017, 9, 813–823. [Google Scholar] [CrossRef] [PubMed]
- Marschner, H. Mineral Nutrition of Higher Plants; Academic Press: New York, NY, USA, 1995; pp. 313–323. [Google Scholar]
- Mahender, A.; Swamy, B.P.M.; Anandan, A.; Ali, J. Tolerance of iron-deficient and -toxic soil conditions in rice. Plants 2019, 8, 31. [Google Scholar] [CrossRef] [PubMed]
- Aung, M.S.; Masuda, H. How does rice defend against excess iron?: Physiological and molecular mechanisms. Front. Plant Sci. 2020, 11, 1102. [Google Scholar] [CrossRef] [PubMed]
- Kim, S.A.; Guerinot, M.L. Mining iron: Iron uptake and transport in plants. FEBS Lett. 2007, 581, 2273–2280. [Google Scholar] [CrossRef] [PubMed]
- Roberts, L.A.; Pierson, A.J.; Panaviene, Z.; Walker, E.L. Yellow stripe1. Expanded roles for the maize iron-phytosiderophore transporter. Plant Physiol. 2004, 135, 112–120. [Google Scholar] [CrossRef] [PubMed]
- Zhang, X.; Zhang, D.; Sun, W.; Wang, T. The adaptive mechanism of plants to iron deficiency via iron uptake, transport, and homeostasis. Int. J. Mol. Sci. 2019, 20, 2424. [Google Scholar] [CrossRef] [PubMed]
- United States Department of Agriculture, National Agricultural Statistics. AG and Food Sectors and the Economy. 2019. Available online: https://www.ers.usda.gov/data-products/ag-and-food-statistics-charting-the-essentials/ag-and-food-sectors-and-the-economy/ (accessed on 5 May 2022).
- United States Department of Agriculture, National Agricultural Statistics Service. Vegetables-2021 Summary. Available online: https://downloads.usda.library.cornell.edu/usda-esmis/files/02870v86p/zs25zc490/9593vz15q/vegean22.pdf (accessed on 5 May 2022).
- Ivanov, R.; Brumbarova, T.; Bauer, P. Fitting into the harsh reality: Regulation of iron-deficiency responses in dicotyledonous plants. Mol. Plant 2009, 5, 27–42. [Google Scholar] [CrossRef] [PubMed]
- Albano, J.P.; Miller, W.B. Marigold cultivars vary in susceptibility to iron toxicity. HortScience 1998, 33, 1180–1182. [Google Scholar] [CrossRef]
- Dickson, R.; Fisher, P. Understanding pH Personality. 2017. Available online: https://www.growertalks.com/Article/?articleid=23212 (accessed on 28 March 2022).
- Bista, D.R.; Heckathorn, S.A.; Jayawardena, D.M.; Mishra, S.; Boldt, J.K. Effects of drought on nutrient uptake and the levels of the nutrient-uptake proteins in roots of drought-sensitive and -tolerant grasses. Plants 2018, 7, 28. [Google Scholar] [CrossRef] [PubMed]
- Imam, M.U.; Zhang, S.; Ma, J.; Wang, H.; Wang, F. Antioxidants mediate both iron homeostasis and oxidative stress. Nutrients 2017, 9, 671. [Google Scholar] [CrossRef] [Green Version]
- Li, B.; Sun, L.; Huang, J.; Gösch, C.; Shi, W.; Chory, J.; Busch, W. GSNOR provides plant tolerance to iron toxicity via preventing iron-dependent nitrosative and oxidative cytotoxicity. Nat. Commun. 2019, 10, 3896. [Google Scholar] [CrossRef] [PubMed]
- Connolly, E.L.; Fett, J.; Guerinot, M.L. Expression of the IRT1 metal transporter is controlled by metals at the levels of transcript and protein accumulation. Plant Cell 2002, 14, 1347–1357. [Google Scholar] [CrossRef] [PubMed]
- Vert, G.; Grotz, N.; Dedaldechamp, F.; Gaymard, F.; Guerinot, M.L.; Briat, J.F.; Curie, C. IRT1, an arabidopsis transporter essential for iron uptake from the soil and for plant growth. Plant Cell 2002, 14, 1223–1233. [Google Scholar] [CrossRef] [PubMed]
- Aung, M.S.; Masuda, H.; Kobayashi, T.; Nishizawa, N.K. Physiological and transcriptomic analysis of responses to different levels of iron excess stress in various rice tissues. Soil Sci. Plant Nutr. 2018, 64, 370–385. [Google Scholar] [CrossRef]
- Bashir, K.; Hanada, K.; Shimizu, M.; Seki, M.; Nakanishi, H.; Nishizawa, N.K. Transcriptomic analysis in rice in response to iron deficiency and excess. Rice 2014, 7, 18. [Google Scholar] [CrossRef] [PubMed]
- Quinet, M.; Vromman, D.; Clippe, A.; Bertin, P.; Lequeux, H.; Dufey, I.; Lutts, S.; Lefevre, I. Combined transcriptomic and physiological approaches reveal strong differences between short- and long-term response of rice (Oryza sativa) to iron toxicity. Plant Cell Environ. 2012, 35, 1837–1859. [Google Scholar] [CrossRef] [PubMed]
- Yokosho, K.; Yamaji, N.; Ma, J.F. OsFRDL1 expressed in nodes is required for distribution of iron to grains in rice. J. Exp. Bot. 2016, 67, 5485–5494. [Google Scholar] [CrossRef] [PubMed]
- Kim, S.A.; Punshon, T.; Lanzirotti, A.; Liangtao, L.; Alonso, J.M.; Ecker, J.R.; Kaplan, J.; Guerinot, M.L. Localization of iron in Arabidopsis seed requires the vacuolar membrane transporter VIT1. Science 2006, 314, 1295–1298. [Google Scholar] [CrossRef] [PubMed]


Publisher’s Note: MDPI stays neutral with regard to jurisdictional claims in published maps and institutional affiliations. |
© 2022 by the authors. Licensee MDPI, Basel, Switzerland. This article is an open access article distributed under the terms and conditions of the Creative Commons Attribution (CC BY) license (https://creativecommons.org/licenses/by/4.0/).