Article

Salinity-Induced Changes in the Antioxidant Status of Common Basil Plants (Ocimum basilicum L.) Grown under Controlled Conditions

1
Department of Horticulture, Faculty of Environmental Management and Agriculture, West Pomeranian University of Technology in Szczecin, 17 J. Słowackiego Street, 71-434 Szczecin, Poland
2
Department of Plant Physiology, Biochemistry and Genetics, Faculty of Agronomy, Agricultural University Plovdiv, 12 Mendeleev Street, 4000 Plovdiv, Bulgaria
*
Authors to whom correspondence should be addressed.
Horticulturae 2022, 8(9), 775; https://doi.org/10.3390/horticulturae8090775
Submission received: 29 July 2022 / Revised: 24 August 2022 / Accepted: 25 August 2022 / Published: 26 August 2022
(This article belongs to the Special Issue New Advances in Green Leafy Vegetables)

Abstract

:
Studies were performed to determine the influence of salinity on the antioxidant status of basil plants, var. Sweet Green. The experiments were conducted in a growth chamber under controlled conditions (photoperiod—14/10 h, photosynthetic photon density (PPFD)—250–300 µmol m−2 s−1, temperature—24 ± 1 °C/16 ± 1 °C, humidity—65–70%). The plants were grown on ½ Hoagland’s nutrient solution, with the addition of elevated concentrations of sodium chloride (0, 80, 160 mM). In addition, increased content of macro- and micronutrients in the solution was applied (4/2 Hoagland’s nutrient solution and 0 mM NaCl). The activity of the antioxidant enzyme guaiacol peroxidase, content of malondialdehyde and total polyphenolic compounds, concentration of free proline, and antiradical activity were characterized. The results demonstrate that the salinity of Hoagland’s solution with 160 mM NaCl induced considerable changes concerning enzymatic and non-enzymatic elements of the plant defense and antioxidant systems. Enhancing the concentration of macro- and microelements in the nutrient solution (4/2 of Hoagland and 0 mM NaCl) in terms of biochemical parameters presented a similar trend to the variant with an additional lower concentration of sodium chloride (80 mM).

1. Introduction

Basil (Ocimum basilicum L.) is one of the most popular spice herbs of the family of Lamiaceae [1,2,3]. The genus Ocimum contains between 30 and 160 species and numerous cultivars [4,5]. It can be grown in the greenhouse and field conditions [6]. Its leaves, flowers, and seeds can be used in the medicinal industry and for culinary purposes and can also be grown as an ornamental plant [5]. The herbal raw material of basil is an herb (Basilici herba), containing essential oils (0.5–2.5%), flavonoids, tannins, phenolic, saponin, anthocyanins, vitamins C and E, and minerals. This set of biological components allows basil to be used as a repellent against insects and nematodes and an antifungal, antibacterial, and antioxidant agent [7,8]. The share of these compounds is clearly influenced by environmental factors [9]. According to Nowak [10], the success of basil cultivation depends on maintaining a good water and plant nutrition regime.
Many studies have shown that more and more arable land in the world and about half of all irrigated lands are susceptible to salt-related stress, which can be harmful to plants [8,11,12,13]. According to estimates, the total area of saline soil in the world is over 952 million hectares [14].
These soils enclose almost 7% of the total land area or about 33% of the potential agricultural land area of the globe [11,14].
In most cases, salinity is triggered by an exuberance of sodium chloride (NaCl) or sodium sulfate (Na2SO4) in the water used for plant irrigation [11,15,16]. This problem is particularly important for most species responsive to salinity or cultivated in arid and semi-arid regions [8,16,17,18].
With the upsurge of salt such as NaCl in the water, the vapor pressure of the water decreases. It indicates that fewer water molecules can remove the solution from its surface [19]. Therefore, the more elevated the concentration of salt present, the smaller the evaporation. Saltwater is a solution in a liquid condition and with its vapor tension and temperature, the saltwater loses its molecules in the form of vapors [20].
Increased salt levels in the soil reduce plant water availability, as water is retained in the soil solution by enhanced osmotic interactions. Short-term salt stress inhibits plant growth due to osmotic effects and reduces cell expansion. Long-term effects of this stress involve excessive salt absorption by plants (especially Na+ and Cl), which can disturb the ionic balance and lead to premature leaf aging [21].
Recently, herb cultivation in containers under cover, which ensures continuous supply of fresh plants throughout the year, irrespective of weather conditions, has gained popularity [22,23,24]. An increasing number of studies have also focused on the volume of the substrate on the yield quantity and quality of pot plants. Another important aspect is urban gardening, where basil is produced in very small pots and containers, concomitantly being exposed to fertilizers abundant in salts [23].
A study by Tarchoune et al. [8] showed a link between plant antioxidant activity and tolerance to salt stress. This stress can cause secondary oxidative stress, which ensues when there is an imbalance between the production of reactive oxygen species (ROS) and antioxidant defenses [8]. This leads to oxidative impairment of macromolecules and disruption of cell structure [8,25]. Therefore, reactive oxygen species have been deemed dangerous molecules whose concentrations should be kept as low as possible. Plant cells can abide ROS to diverse degrees by improving endogenous protective mechanisms implicating antioxidant molecules and enzymes [8]. Mittova et al. [26] also indicated that plant tolerance to salt stress is mainly due to the increased activity of antioxidant enzymes (glutathione reductase, peroxidase, ascorbate peroxidase), which were tested in tomatoes resistant to high sodium chloride levels.
Plants exposed to salt stress accumulate various molecules in organic matter, such as proline, glucose, betaine, etc. [27,28]. Proline content is an important indicator of plant physiological response to stress, including salt stress [15,27,28,29].
Lipid peroxidation, caused by free radicals, is also an important indicator of cell membrane degradation [28,29,30,31]. It occurs when unsaturated fatty acids are oxidized in the membrane, resulting in an accumulation of ROS. As they are the most common symptom denoting oxidative damage, they indicate increased damage and constitute plant response to abiotic stress [30,31,32,33,34]. In the research by some authors, basil was demonstrated to tolerate low concentrations of hydrochloric acid, i.e., lower than 100 mM NaCl [18,27,35].
This study aimed to analyze some biochemical markers of basil plants’ enzymatic and non-enzymatic safeguard during stress caused by an increased concentration of sodium chloride (80, 160 mM) and macro- and microelements in the substrate [11]. This will provide information about the extent of this stress, which is particularly important when growing basil plants in containers, where maintaining optimal conditions in the substrate determines the success of the cultivation [11].

2. Materials and Methods

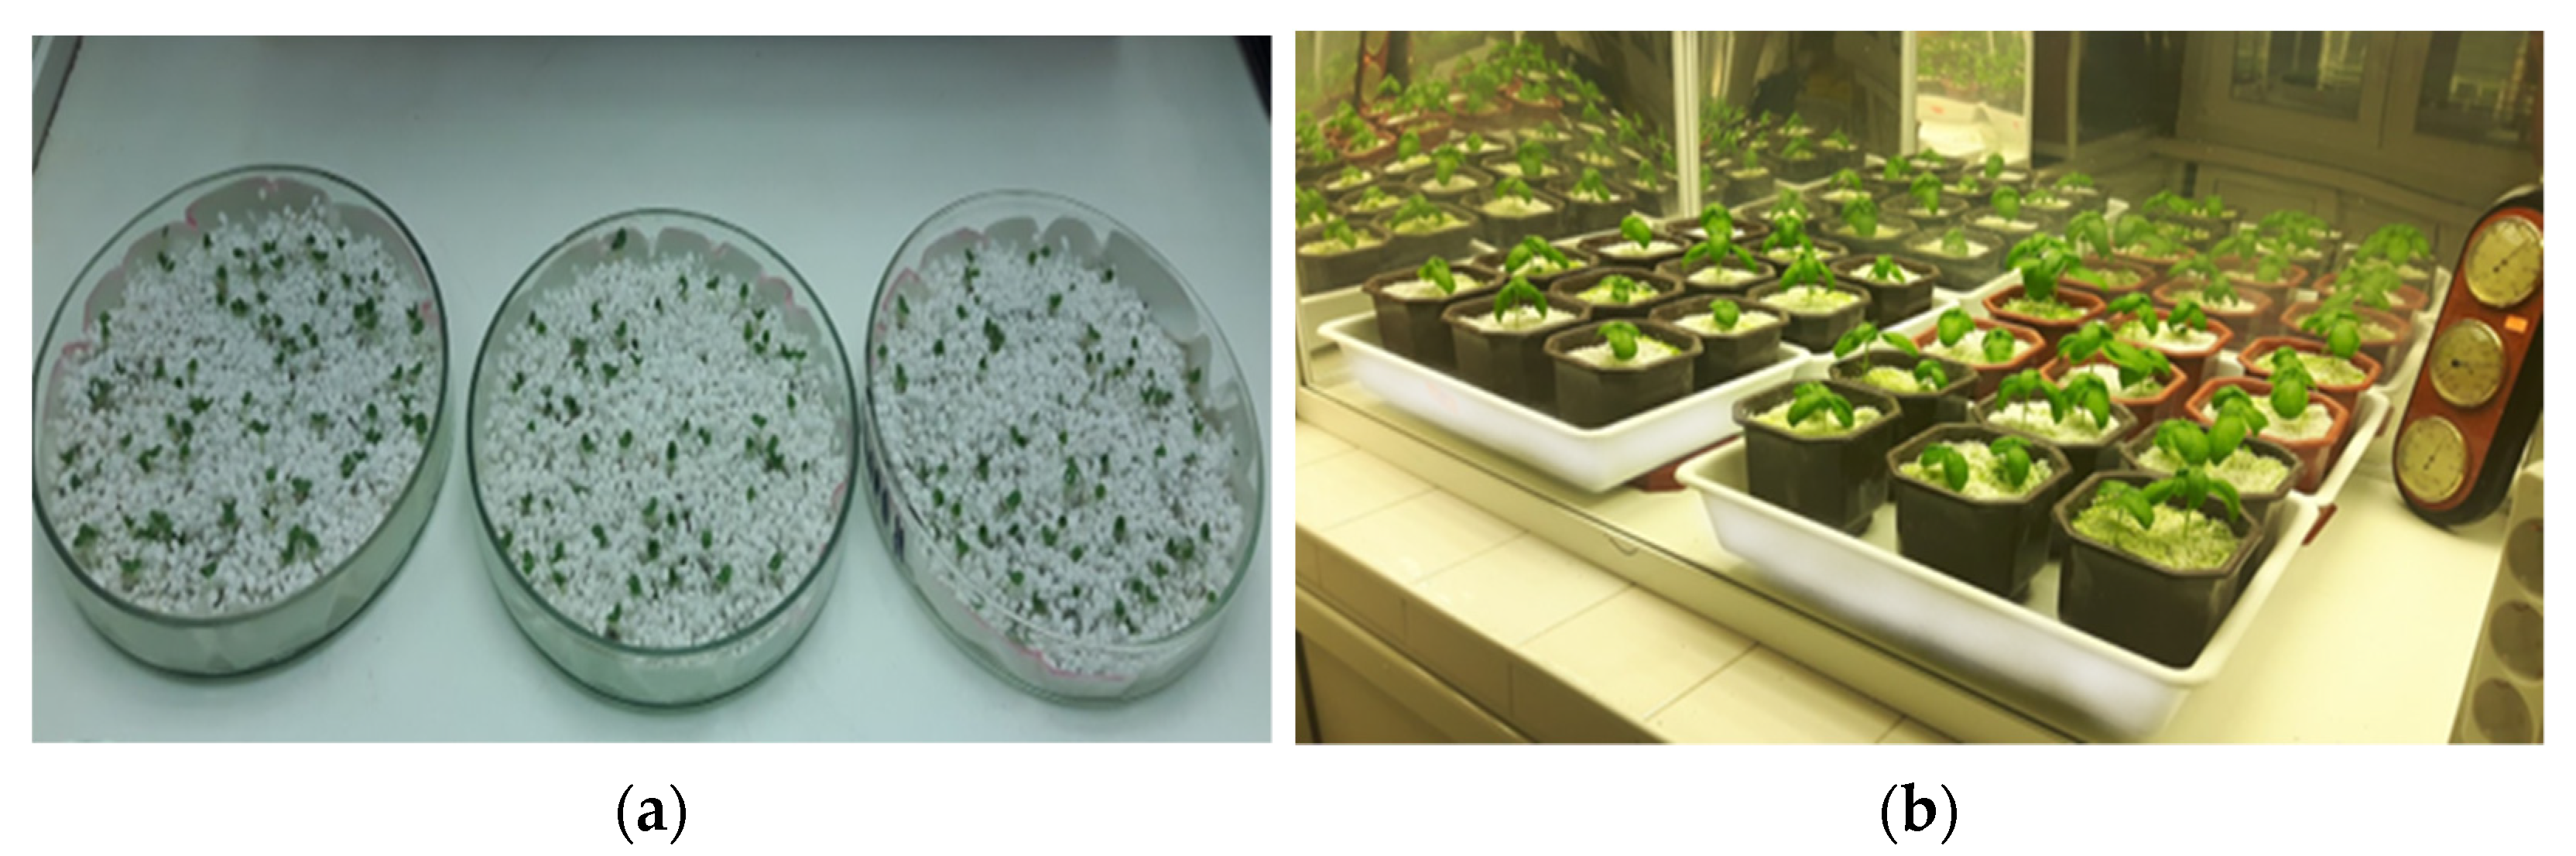
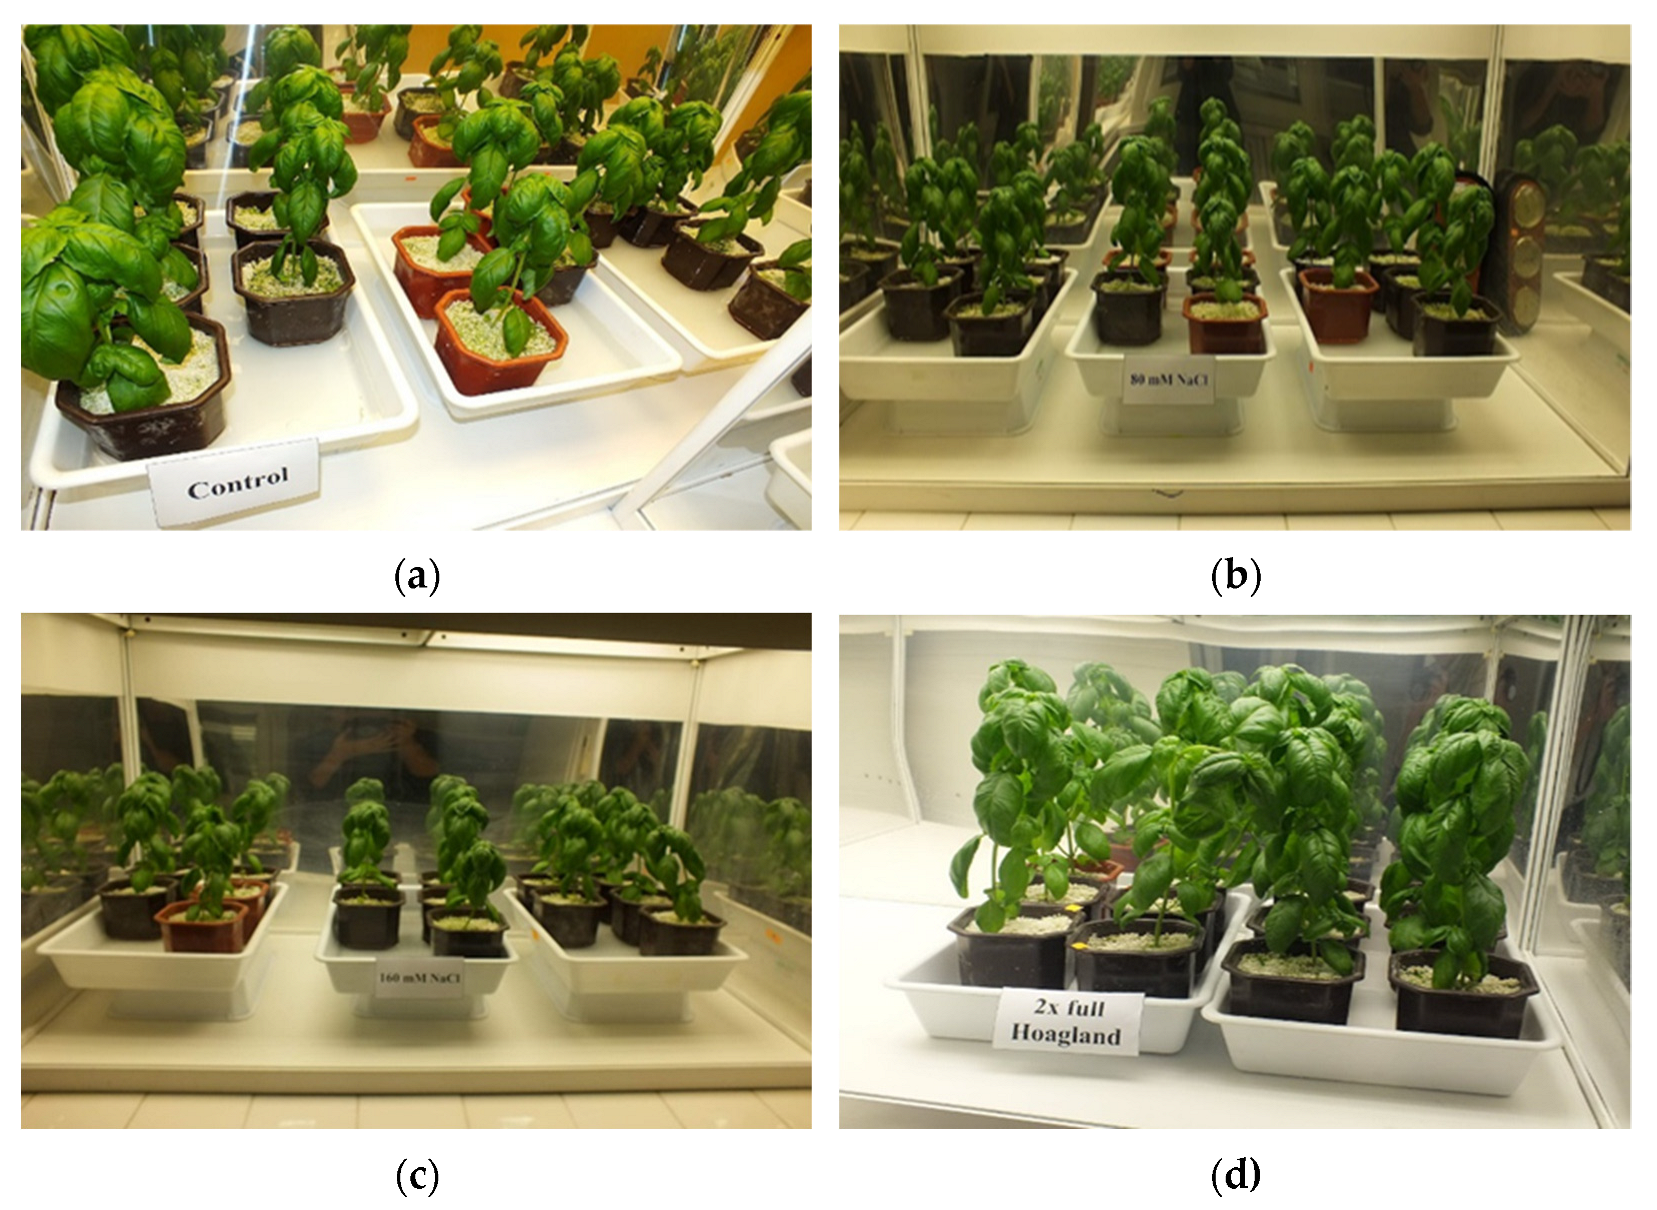
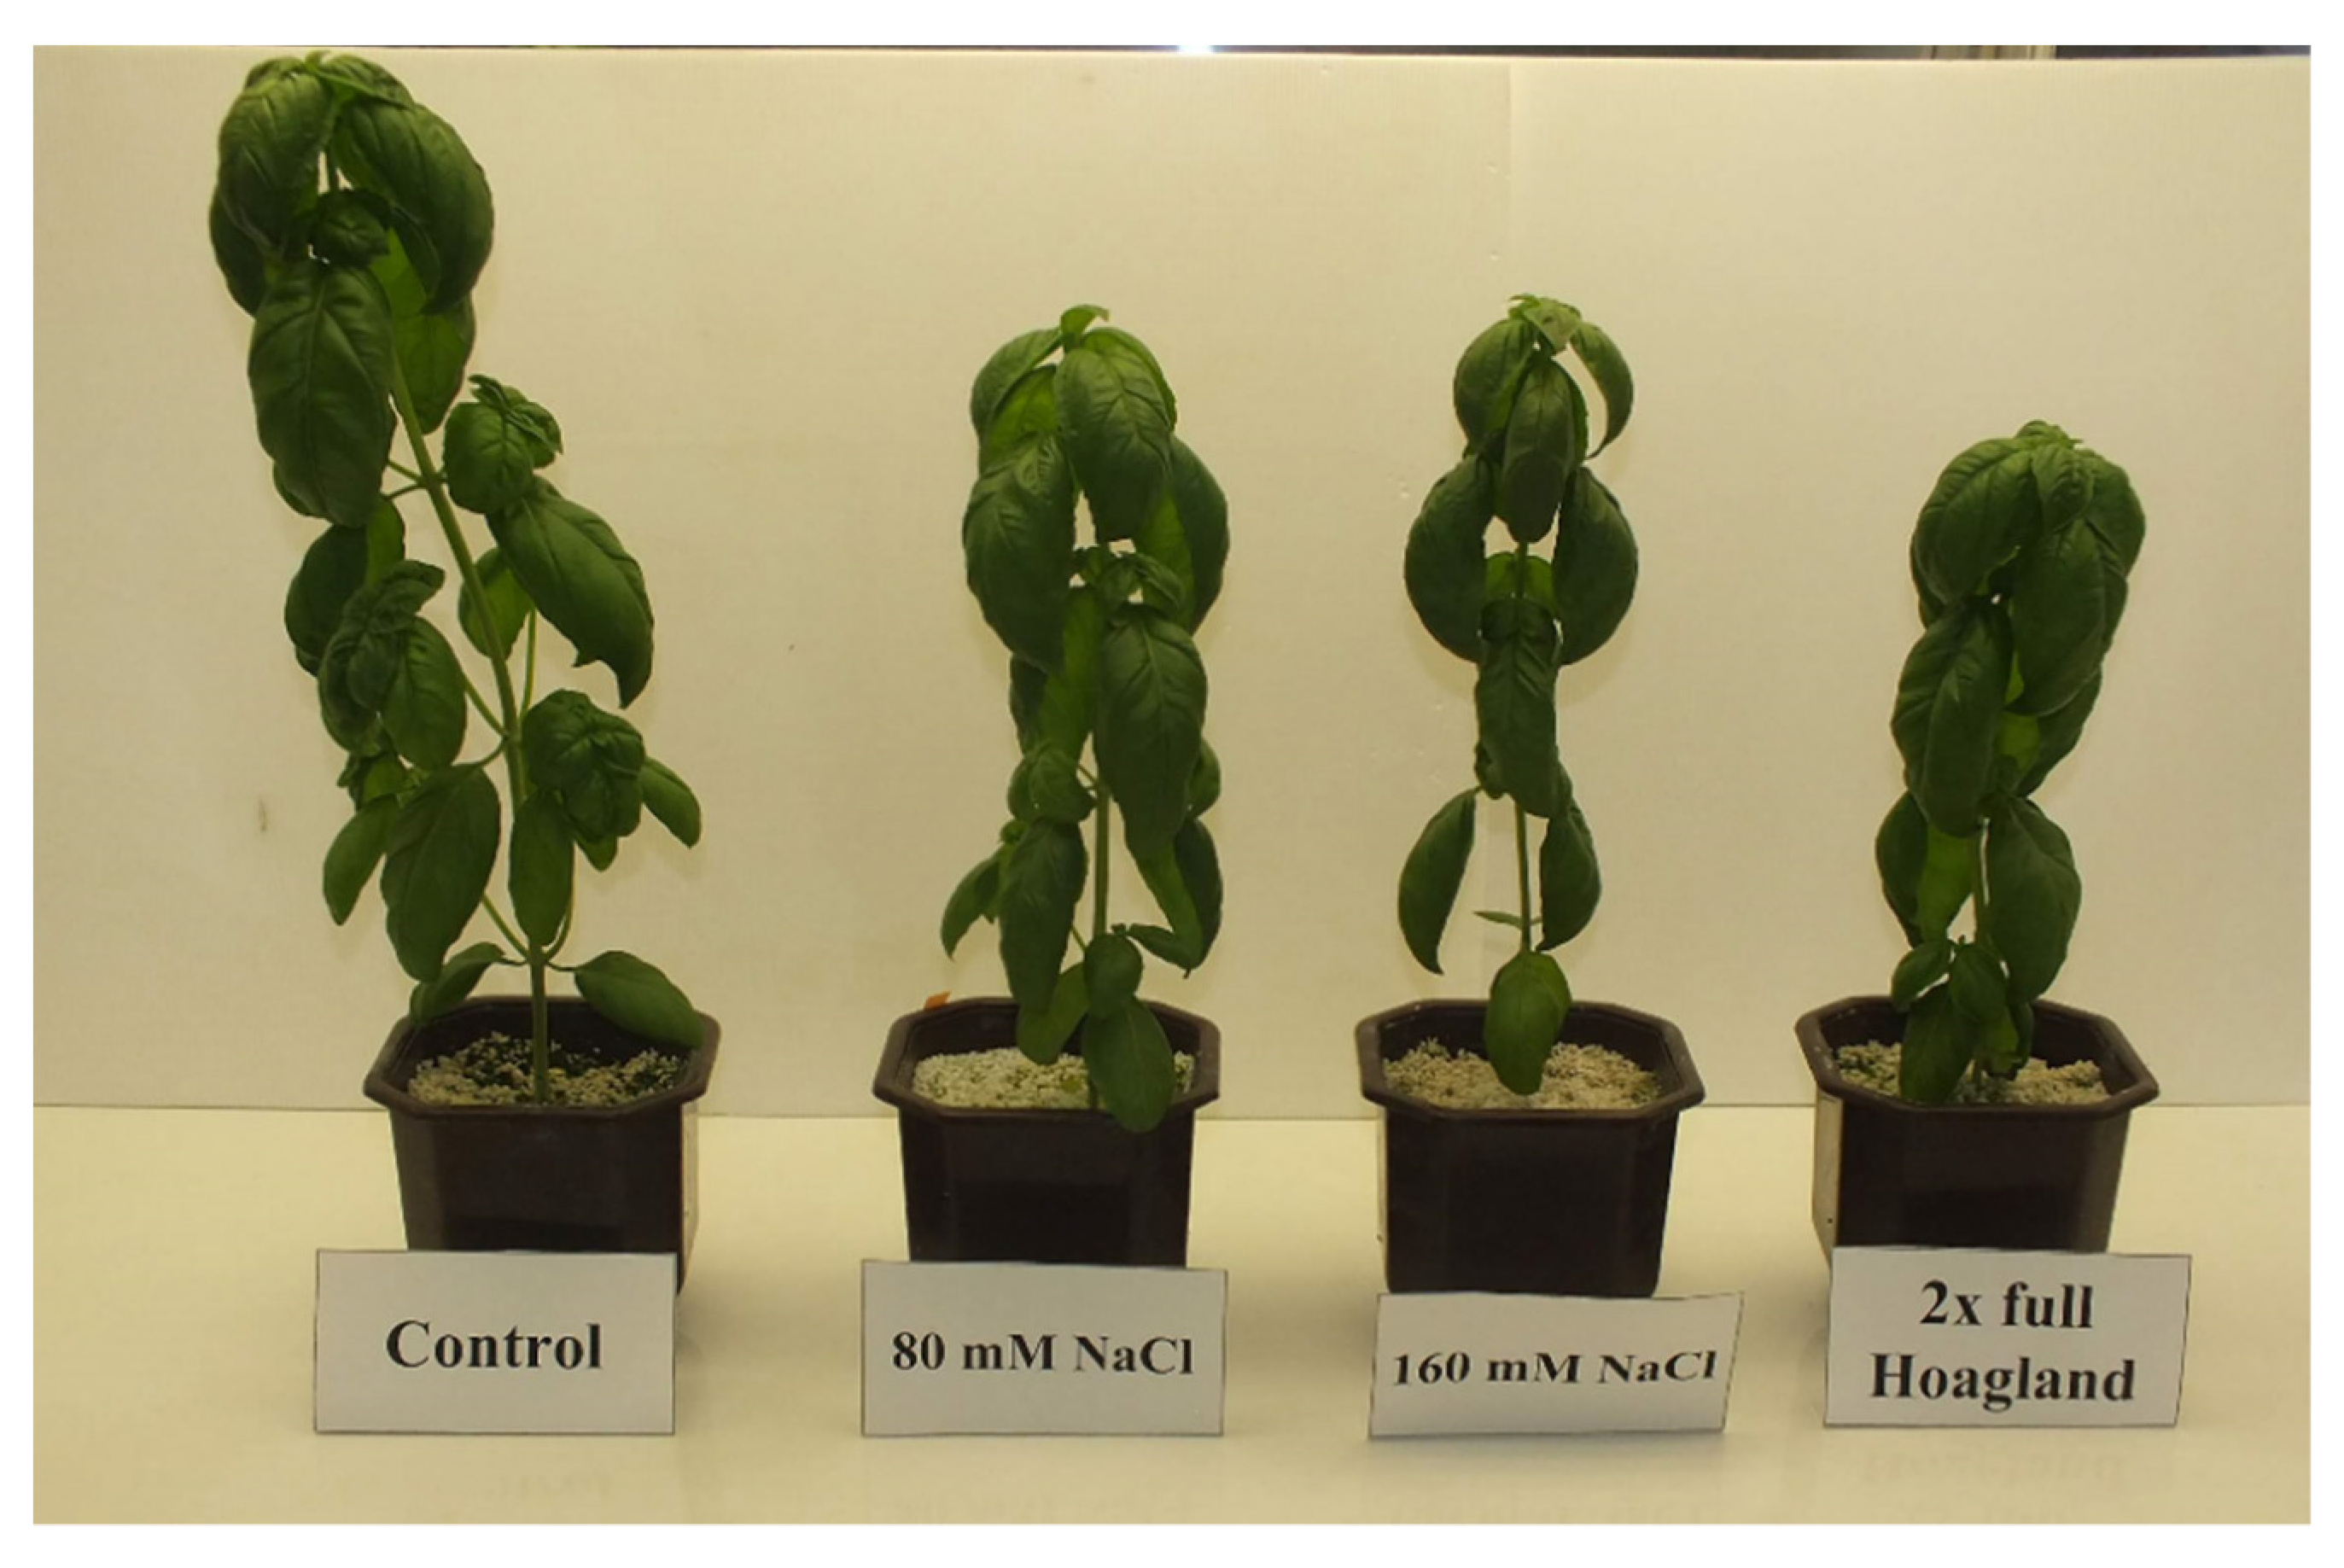
2.1. Experimental Design

The experiment was carried out with basil plants cv. “Sweet Green”, in a growth chamber under the following controlled conditions: photoperiod—14/10 h (light/dark), photosynthetic photon density (PPFD)—250–300 µmol m−2 s−1, temperature—24 ± 1 °C/16 ± 1 °C (day/night), relative air humidity—65–70%. In the phase of two pairs of true leaves, the seedlings were transplanted into pots (0.72 L) filled with substrate perlite and ½ Hoagland’s solution [11,36] (Figure 1).
In the second week of cultivation, they were split into the experimental variants: ½ Hoagland’s solution with added sodium chloride (0, 80, and 160 mM) and 4/2 Hoagland’s solution with 0 mM NaCl (Figure 2). Each variant was set in three replications [11].

2.2. Analyses

2.2.1. Lipid Peroxidation

TBA test for lipid peroxidation indicated malondialdehyde (MDA) as the final product of the process (MDA-TBA complex) [37]. Specific absorbance at 532 nm and nonspecific at 600 nm were recorded at molar extinction coefficient E = 155 mM−1 cm−1. The results were presented as malondialdehyde (MDA) content in a unit of fresh weight (nmol MDA g−1 FW).

2.2.2. Enzyme Extraction

The fresh plant sample (1.0 g) was ground with 5 mL ice-cold 0.1 M Tris-HCl (pH 7.8) extraction buffer containing 1 mM DTT and 1mM EDTA. Samples were centrifuged at 13,500× g rpm at 4 °C for 10 min. The resulting clear supernatant was used for determining the enzymatic activity spectrophotometrically (UV/Vis spectrophotometer Pharo 300), according to the methodology of Mocquot et al. [38].

2.2.3. Guaiacol Peroxidase (GPOD)

Total peroxidase activity (EC 1.11.1.7) was determined with guaiacol substrate (GPOD), and for GPOD activity, the Bergmeyer method was used [39]. The mixture of 2.3 mL of 0.1 M phosphate buffer (pH 7.0), 300 μL of 5 mM H2O2 solution, 300 μL of 8 mM guaiacol solution, and 100 μL of enzyme extract was placed in the cuvette. The absorbance was measured at 436 nm against a blank containing the same components without enzyme extract (E = 26.6 mM−1 cm−1). The values obtained were expressed as U mg g−1 FW.

2.2.4. Free Proline Concentration

Proline content was indicated spectrophotometrically using a method described by Bates et al. [40] after extraction from 0.5 g of each leaf sample by grinding in 10 mL 3% sulfosalicylic acid. The mixture was then centrifuged at 10,000× g rpm for 10 min. To 2 mL of the supernatant was added 2 mL of acid solution and ninhydrin. The tubes were incubated in a water bath at 90 °C for 30 min and the reaction terminated in an ice bath. Each reaction mixture was extracted with 5 mL of toluene and vortex-mixed for 15 s. The tubes were allowed to stand for 20 min in the dark at room temperature to allow separation of the toluene and aqueous phases. Each toluene phase was then carefully collected in a test tube and its absorbance was read at 520 nm. The free proline content of the sample was determined from a standard curve prepared using an analytical proline.

2.2.5. Total Polyphenols Content

The total polyphenols content in the plant extracts was determined using the Folin–Ciocalteu reagent [41] according to the methodology of Singleton et al. [42]. The samplings (1 g of fresh leaf material) were crushed with quartz sand and 10 mL 60% acidic methanol and immersed in an ultrasound bath for 15 min. The homogenized material was repositioned to proper tubes, carefully filled, and left for 15 h in the dark at room temperature for extraction. During the incubation period, the tubes were periodically mixed. After, the tubes were centrifuged and the supernatant, which was used for gauging total phenolic content and antiradical activity, was carefully collected in new clean tubes. For the determination of total polyphenols content, 40 µL of extract, 3160 µL of double-distilled water, 200 µL Folin–Ciocalteu reagent, and 600 µL 20% NaCO3 was mixed. The test tubes were left for 2 h at room temperature for the reaction to occur. After that, the extinction at 765 nm wavelength. Total polyphenols content was calculated as gallic acid equivalents (GAE) using a standard curve and is presented as mg g−1 fresh weight. The standard curve was devised with gallic acid (Sigma-Aldrich, St. Louis, MO, USA) in the range of 0–500 mg L−1.

2.2.6. Antiradical Activity

Antiradical activity, 2,2-diphenyl-1-picrylhydrazyl (DPPH), was measured in the extracts obtained for total phenolic content [43]. The incubation mixture contained 100 µL extract and 3.9 mL 6 × 10⁻⁵ mol L−1 DPPH (0.06 µmol L−1). The extract absorption was determined at 515 nm at min 0 and 30 from the initial mixture of the components. A parallel blank sample was tested, which contained double-distilled water instead of extract. The antiradical activity was expressed as % decoloration and was equal to [44]:
(1 − (A30min/A0min) × 100).

2.2.7. Reducing Sugars

Reducing sugars were determined by the Hagedorn–Jensen method, modified by Popov and Koleva [45]. The method involves reducing potassium ferrocyanide (K3Fe(CN)6) in an alkaline medium using sugars. To 10 mL 0.05 n of potassium ferrocyanide was added 5 mL of the sugar solution to be tested. The tubes were placed in a boiling water bath for 20 min and then cooled in cold running water. The contents of the tubes were transferred to 100–150 mL flasks. Then, 25 mL of acetic reagent was measured and the tubes were rinsed several times; the rinsing solution was poured into the flask containing the sugar solution and 0.5 g of KJ and 1 mL of fresh starch solution were added. After 1 to 2 min, it was titrated with 0.05 n sodium thiosulphate solution until it turned from blue to white. In parallel, a blank was performed (5 mL of distilled water was placed in the tube instead of the sugar solution). The difference between the mL of sodium thiosulphate used for the titration of the blank and the sample proper corresponds to the mL of reduced potassium ferrocyanide from the sugars. The final value was read off the glucose table. The percentage of reducing sugars in the plant material, expressed as glucose, was calculated according to the formula:
%   C R = A · V · 100 b · g · 1000   ,  
where:
  • A—reducing sugars in the glucose solution taken for the test, taken as glucose, in mg;
  • V—volume of extract obtained, in mL (100);
  • b—a volume of sugar solution taken for the test in mL;
  • g—a mass of the sample taken in g;
  • 100—conversion factor in %.

2.3. Analysis of Data

ANOVA was conducted to assess the significance of distinctions between means using Tukey’s test for randomized blocks in a single-factor investigation. Half confidence intervals at the significance level α = 0.05 were estimated. Statistical calculations were assembled by exploiting Statistica 13 software (StatSoft Polska Sp.o.o., Kraków, Poland).

3. Results

After 20 days of growth in increased salt concentrations, the entire plants were reaped, and biochemical analyses were conducted (Figure 3).
The highest malondialdehyde content was found in the plants grown at ½ Hoagland’s solution and 160 mM NaCl (0.32 nmol MDA·g−1 FW) (Table 1). The lack of significant differences in MDA content between control plants and other variants indicates that the integrity and stability of plasma membranes in these plants were maintained. No statistical differences were found in the malondialdehyde content between the leaves and the root system of plants.
The analysis of the results showed that the use of Hoagland’s solution and 160 mM NaCl resulted in a significant increase in the guaiacol content in basil plants (1.93 U g−1 FW), with its significantly higher levels in the root system (3.76 U g−1 FW). In the other variants, roots were characterized by higher guaiacol levels than leaves. No significant differences were found in guaiacol peroxidase activity between control plants and other variants.
The highest proline level was found in basil plants grown in the presence of ½ Hoagland’s solution and 160 mM NaCl (92.06 mg·g−1 FW), and the lowest in the control plants (28.74 mg·g−1 FW). A significantly higher level of proline in the root system was found in control (32.50 mg·g−1 FW), a variant with Hoagland’s solution and 80 mM NaCl (68.04 mg·g−1 FW) and a variant with 4/2 Hoagland’s solution and 0 mM NaCl (72.68 mg·g−1 FW). In contrast, plants grown at higher sodium chloride concentration (160 mM) contained more proline in the leaves (110.81 mg·g−1 FW).
A correlation was found between the levels of proline and reducing sugars content in the studied plants (Table 2). In the basil plants exposed to ½Hoagland’s solution with 160 mM NaCl, the increased free proline levels corresponded with those of reducing sugars. The highest reducing sugars level was found in basil plants grown in the presence of 4/2 Hoagland’s solution and 0 mM NaCl (0.59% FW) and ½ Hoagland’s solution and 160 mM NaCl (0.58% FW), and the lowest in the control plants (0.50% FW). In the other variants, leaves were characterized by higher reducing sugar levels (0.58% FW) than the roots system (0.53% FW). A significantly higher level of reducing sugar in the leaves was found in a variant with 4/2 Hoagland’s solution and 0 mM NaCl (0.70% FW) and lower in the control roots system (0.46% FW).
Plants cultivated at ½ Hoagland’s solution and NaCl, as well as those at 4/2 Hoagland’s solution and 0 mM NaCl, had reduced amounts of polyphenolic compounds, which was more noticeable in the higher salt concentration variant (436.25 mg GAE g−1 FW compared to the control—496.28 mg GAE g−1 FW). These results are related to those obtained for peroxidase activity. The lowest concentration of total polyphenols was found in the plants with the highest peroxidase activity. No significant differences in total polyphenols content were found between basil leaves and the root system.
The antiradical activity was also altered in plants grown at ½ Hoagland’s solution and NaCl and those at 4/2 Hoagland’s solution and 0 mM NaCl. It was significantly reduced, especially in the variant with higher NaCl concentration (21.8% compared to the control), where the lowest amounts of polyphenols were detected.

4. Discussion

The degree of lipid peroxidation in basil plants was determined by changing the malondialdehyde content. MDA is a breakdown product of polyunsaturated fatty acids in protein–lipid membranes, mainly linoleic acid. Therefore, MDA content is routinely determined and used as a good indicator for measuring oxidative cell damage [46,47].
Our study showed the highest malondialdehyde content in the plants grown at ½ Hoagland’s solution and 160 mM NaCl (0.32 nmol MDA·g−1 FW). The results indicate a decrease in lipid membrane integrity and lipid peroxidation activation under the higher salt concentration. The lack of significant differences in MDA content between control plants and other variants indicates that the integrity and stability of plasma membranes in these plants were maintained. No statistical differences in malondialdehyde content were found between the leaves and root systems of the plants.
In a study, Ning et al. [48] demonstrated that those glandular trichomes have an impact on the detoxification of toxic chemicals (e.g., heavy metals and salts) and in reply to various other stress conditions [49,50]. Authors demonstrated that basil plants can exclude Na+ ions via leaf glands, staying intact. In addition, basil leaf glands contain various inorganic ions and organic substances which may have an impact on salt tolerance [47].
Similar results were obtained by Attia et al. [51], who showed that salinity induced an increase in malondialdehyde in the leaves of the basil genotypes they studied. Delavari et al. [27] reported a malondialdehyde (MDA) level of 0.5 μg g−1 FW in the control plants, 1.2 μg g−1 FW in the presence of 100 mM NaCl and 1.0 μg g−1 FW following treatment with the highest salt concentration of 200 mM NaCl.
The study by Bączek-Kwinta et al. [52] showed that antioxidant activity was strongly differentiated in basil cultivars. The analysis of the results of own research showed that using Hoagland’s solution and 160 mM NaCl resulted in a significant increase in the guaiacol content in basil plants (1.93 U g−1 FW), with significantly higher levels in leaves (3.76 U g−1 FW). In the other treatments, roots were characterized by higher guaiacol levels compared to leaves. The increase in the activity of the enzyme guaiacol peroxidase suggests its involvement in the defense system of the basil plants against salinity stress. No significant differences were found in guaiacol peroxidase activity between the control plants and the other variants.
The results obtained correspond with those of Tarchoune et al. [8]. According to the authors, the stability of cell membranes manifested by the unchanged level of general peroxidation is characteristic of plants coping with salinity. Tolerance to salinity is correlated with the stimulation of antioxidant enzymes and their enhanced ability to remove active oxygen compounds.
To reduce the negative effects of excess salt, plants synthesize and accumulate so-called cytoplasmic osmolytes, including endogenous amino acids. The proline accumulation in response to adverse environmental factors allows plants to acclimate to stressful conditions, including salinity [53,54].
Our study demonstrated the highest proline level in basil plants grown in the presence of ½ Hoagland’s solution and 160 mM NaCl and the lowest in the control plants. A significantly higher level of proline in the root system was found in control in Hoagland’s solution and 80 mM NaCl (and a variant with 4/2 Hoagland solution and 0 mM NaCl). In contrast, plants grown at higher sodium chloride concentration (160 mM) contained more proline in the leaves. This corresponds with the results obtained by Delavari et al. [27], who indicated 2 and 4 mg g−1 FW in roots and leaves of control basil plants (deionized water and 0 mM NaCl) and 11 and 12 mg g−1 FW, respectively, at 200 mM NaCl.
A correlation was observed between the levels of proline and reducing sugars content in the studied plants (Table 2). In the basil plants exposed to 1/2 Hoagland’s solution with 160 mM NaCl, the increased free proline levels corresponded with those of reducing sugars. According to some authors [55,56], these osmoprotectors play an important role in alleviating the effects of stress in basil plants.
Plants grown at ½ Hoagland’s solution and NaCl, as well as those at 4/2 Hoagland’s solution and 0 mM NaCl, had reduced amounts of polyphenolic compounds, which was more noticeable in the variant with the higher salt concentration (436.25 mg GAE g−1 FW compared to the control—496.28 mg GAE g−1 FW). These results are related to those obtained for peroxidase activity. The lowest concentration of total polyphenols was found in the plants with the highest peroxidase activity. The reduction of total polyphenols in cell walls weakens them and makes them more susceptible to the effects of stress. No significant differences in total polyphenols content were found between basil leaves and the root system.
The antiradical activity was also altered in plants grown at ½ Hoagland’s solution and NaCl and those at 4/2 Hoagland’s solution and 0 mM NaCl. It was significantly reduced, especially in the variant with higher NaCl concentration (21.8% compared to the control), where the lowest amounts of polyphenols were detected. The high value of DPPH-radical scavenging activity is considered an important mechanism by antioxidants to inhibit lipid peroxidation [57,58]. Our results confirm this fact.

5. Conclusions

The present study demonstrated that the 160 mM NaCl in Hoagland’s solution induced changes in the biochemical status of young basil plants. These changes included increased activity of the antioxidant enzyme guaiacol peroxidase; reduced polyphenols content; and changes in antiradical activity, MDA, and free proline concentrations. These results indicate that the plant was placed in a state of alertness by inducing its defense systems. At the same time, increasing the concentration of macro- and microelements in the nutrient solution (4/2 of Hoagland’s and 0 mM NaCl) in terms of biochemical parameters showed a similar trend to the variant with an additional lower concentration of sodium chloride (80 mM).
In conclusion, it can be stated that basil plants (cv. Sweet Green) were characterized by tolerance to a lower level of salinity, as was applied in the current study.

Author Contributions

Conceptualization, D.J., M.B. and M.K.; methodology, M.B. and M.K.; software, M.K. and K.B.; validation, D.J. and M.B.; formal analysis, M.B., M.K. and K.B.; investigation, K.B. and M.K.; resources, M.B. and M.K.; data curation, D.J. and M.B.; writing—original draft preparation, K.B.; writing—review and editing, D.J. and M.B.; visualization, K.B. and M.K.; supervision, D.J. and M.B.; project administration, D.J.; funding acquisition, M.B. All authors have read and agreed to the published version of the manuscript.

Funding

This research received no external funding.

Institutional Review Board Statement

Not applicable.

Informed Consent Statement

Not applicable.

Data Availability Statement

The datasets generated for this study are available on request to the corresponding author.

Acknowledgments

We would like to thank Lyubka Koleva-Valkova for her support in laboratory work.

Conflicts of Interest

The authors declare no conflict of interest.

References

  1. Nurzyńska-Wierdak, R.; Rożek, E.; Borowski, B. Response of different basil cultivars to nitrogen and potassium fertilization: Total and mineral nitrogen content in herb. Acta Sci. Pol. Hortorum Cultus 2011, 10, 217–232. [Google Scholar]
  2. Bojko, K.; Czajka, J.; Meller, E.; Szymańska, J. The influence of substrate type and the method of cultivation on the yielding of sweet basil (Ocimum basilicum L.). Ann. Univ. Mariae Curie-Skłodowska. Sec. EEE Hortic. 2016, 26, 33–41. [Google Scholar]
  3. Majkowska-Gadomska, J.; Kulczycka, A.; Dobrowolski, A.; Mikulewicz, E. Yield and nutritional value of basil grown in a greenhouse. Acta Agroph. 2017, 24, 455–464. [Google Scholar]
  4. Carovic, K.; Liber, Z.; Javornik, B.; Kolak, I.; Satovic, Z. Genetic relationship within basil (Ocimum) as revealed by RAPD and AFLP markers. Acta Hortic. 2007, 760, 171–177. [Google Scholar] [CrossRef]
  5. Kalisz, A.; Jezdinsky, A.; Pokluda, R.; Sękara, A.; Grabowska, A.; Gil, J. Impacts of chilling on photosynthesis and chlorophyll pigment content in Juvenile basil cultivars. Hortic. Environ. Biotechnol. 2016, 57, 330–339. [Google Scholar] [CrossRef]
  6. Ziombra, M.; Sas-Golak, I. Influence of cultivation method and date on the yield and content of essential oils in basil herb. Rocz. AR Poznań 2000, 31, 579–583. [Google Scholar]
  7. Lee, S.J.; Umano, K.; Shibamoto, T.; Lee, K.G. Identification of volatile components in basil (Ocimum basilicum L.) and thyme leaves (Thymus vulgaris L.) and their antioxidant properties. Food Chem. 2005, 91, 131–137. [Google Scholar] [CrossRef]
  8. Tarchoune, I.; Sgherri, C.; Izzo, R.; Lachaal, M.; Ouerghi, Z.; Navari-Izzo, F. Antioxidative responses of Ocimum basilicum to sodium chloride or sodium sulphate salinization. Plant Physiol. Biochem. 2010, 48, 772–777. [Google Scholar] [CrossRef]
  9. Nurzyńska-Wierdak, R.; Bogucka-Kocka, A.; Kowalski, R.; Borowski, B. Changes in the chemical composition of the essential oil of sweet basil (Ocimum basilicum L.) depending on the plant growth stage. Chemia 2012, 23, 216–222. [Google Scholar]
  10. Nowak, J.S. Air-water properties of horticultural substrates. Zesz. Probl. Post. Nauk Rol. 2005, 504, 175–184. [Google Scholar]
  11. Jadczak, D.; Bojko, K.; Berova, M.; Kaymakanova, M. Effect of salinity stress on growth and photosynthetic activity of common basil plants (Ocimum basilicum L.). J. Cent. Eur. Agric. 2021, 22, 546–556. [Google Scholar] [CrossRef]
  12. Stępień, P.; Kłbus, G. Water relations and photosynthesis in Cucumis sativus L. leaves under salt stress. Biol. Plant. 2006, 50, 610–616. [Google Scholar] [CrossRef]
  13. Ahl, S.A.; Meawad, A.A.; Abou-Zeid, E.N.; Ali, M.S. Response of different basil varieties to soil salinity. Int. Agrophys. 2010, 24, 183–188. [Google Scholar]
  14. Artiola, J.F.; Walworth, J.L.; Musil, S.A.; Crimmins, M.A. Soil and land pollution. In Environmental and Pollution Science, 3rd ed.; Academic Press: London, UK, 2019; pp. 219–235. [Google Scholar]
  15. Kaymakanova, M.; Stoeva, N. Physiological reaction of bean plants (Phaseolus vulg. L.) to salt stress. Gen. Appl. Plant Physiol. Spec. 2008, 34, 3–4. [Google Scholar]
  16. Tarchoune, I.; Degl’Innocenti, E.; Kaddour, R.; Guidi, L.; Lachaâl, M.; Navari-Izzo, F.; Ouerghi, Z. Effects of NaCl or Na2SO4 salinity on plant growth, ion content and photosynthetic activity in Ocimum basilicum L. Acta Physiol. Plant. 2012, 34, 607–615. [Google Scholar] [CrossRef]
  17. Shannon, M.C. Whole-plant response to salinity. In Plant Environment Interactions; Wilkinson, R.E., Ed.; Marcel Dekker: New York, NY, USA, 1994; pp. 199–244. [Google Scholar]
  18. Bernstein, N.; Kravchik, M.; Dudai, N. Salinity-induced changes in essential oil, pigments and salts accumulation in sweet basil (Ocimum basilicum) in relation to alterations of morphological development. Ann. Appl. Biol. 2010, 156, 167–177. [Google Scholar] [CrossRef]
  19. Does Alcohol Make Water Evaporate Faster? Alcoholic Drinks Notes. Available online: www.magicsnewbiewines.com (accessed on 22 July 2022).
  20. Does Salt Water Evaporate? Techiescientist. Available online: https://www.techiescientist.com/does-salt-water-evaporate (accessed on 22 July 2022).
  21. Munns, R. Comparative physiology of salt and water stress. Plant Cell Environ. 2002, 25, 239–250. [Google Scholar] [CrossRef]
  22. Jadczak, D.; Błaszczuk, A.; Rekowska, E. Effect of covering on the content of macroelements in yield of (Ociumum basilicum L.) cultivated for bunch harvest. J. Elem. 2006, 11, 135–141. [Google Scholar]
  23. Majkowska-Gadomska, J.; Kulczycka, A.; Mikulewicz, E.; Dobrowolski, A. Phytometric features of basil grown in pot with fifferent subsoil volume. Acta Agrophys. 2017, 24, 279–288. [Google Scholar]
  24. Menezes, R.V.; Azevedo Neto, A.D.; Gheyi, H.G.; Cova, A.M.W.; Silva, H.H.B. Tolerance of basil genotypes to salinity. J. Agric. Sci. 2017, 9, 283–295. [Google Scholar] [CrossRef] [Green Version]
  25. Meneguzzo, S.; Navam-Izzo, F.; Izzo, R. Antioxidative responses of shoots and roots of wheat to increasing NaCI concentrations. J. Plant Physiol. 1999, 155, 274–280. [Google Scholar] [CrossRef]
  26. Mittova, V.; Volokita, M.; Guy, M.; Tal, M. Activities of SOD and the ascorbate-glutathione cycle enzymes in subcellular compartments in leaves and roots of the cultivated tomato and its wild salt-tolerant relative Lycopersicon pennellii. Physiol. Plant. 2000, 110, 42–51. [Google Scholar] [CrossRef]
  27. Delavari, P.M.; Baghizadeh, A.; Enteshari, S.H.; Kalantari, K.M.; Yazdanpanah, A.; Mousavi, E.A. The effects of salicylic acid on some of the biochemical and morphological characteristic of Ocimum basilicum under salinity stress. Aust. J. Basic Appl. Sci. 2010, 4, 4832–4845. [Google Scholar]
  28. Golpayegani, A.; Tilebeni, H.G. Effect of biological fertilizers on biochemical and physiological parameters of basil (Ocimum basilicum L.) medicine plant. Am.-Eurasian J. Agric. Environ. Sci. 2011, 11, 445–450. [Google Scholar]
  29. Amuthavalli, P.; Sivasankaramoorthy, S. Effect of salt stress on the growth and photosynthetic pigments of pigeon pea (Cajanus cajan). J. Appl. Pharm. Sci. 2012, 2, 131–133. [Google Scholar] [CrossRef]
  30. Hernandez, J.A.; Jiménez, A.; Mullineaux, P.; Sevilia, F. Tolerance of pea (Pisum sativum L.) to long-term salt stress is associated with induction of antioxidant defences. Plant Cell Environ. 2000, 23, 853–862. [Google Scholar] [CrossRef]
  31. Demiral, T.; Türkan, I. Comparative lipid peroxidation, antioxidant defense systems and proline content in roots of two rice cultivars differing in salt tolerance. Environ. Exp. Bot. 2005, 53, 247–257. [Google Scholar] [CrossRef]
  32. Mandhania, S.; Madan, S.; Sawhney, V. Antioxidant defense mechanism under salt stress in wheat seedlings. Biol. Plant. 2006, 50, 227–231. [Google Scholar] [CrossRef]
  33. Khan, M.H.; Panda, S.K. Alterations in root lipid peroxidation and antioxidative responses in two rice cultivars under NaCl-salinity stress. Acta Physiol. Plant. 2008, 30, 81–89. [Google Scholar] [CrossRef]
  34. Kalisz, A.; Pokluda, R.; Jezdinsky, A.; Sękara, A.; Grabowska, A.; Gil, J.; Neugebauerová, J. Chilling-induced changes in the antioxidant status of basil plants. Acta Physiol. Plant. 2016, 38, 196. [Google Scholar] [CrossRef]
  35. Khaliq, S.; Ullah, Z.; Rehman, A.; Khaliq, R. Physiological and biochemical basis of salt tolerance in Ocimun basilicum L. J. Med. Plants Stud. 2014, 2, 18–27. [Google Scholar]
  36. Hoagland, D.R.; Arnon, D.I. The water-culture method for growing plants without soil. In Circular. California Agricultural Experiment Station, 2nd ed.; University of Michigan Library: Ann Arbor, MI, USA, 1950; Volume 347, pp. 1–32. [Google Scholar]
  37. De Vos, C.R.; Schat, H.; Vooijs, R.; Ernst, W.H. Copper-induced damage to the permeability barrier in roots of Silene cucubalus. J. Plant Physiol. 1989, 135, 164–169. [Google Scholar] [CrossRef]
  38. Mocquot, B.; Vangronsveld, J.; Clijsters, H.; Mench, M. Copper toxicity in young maize (Zea mays L.) plants: Effects on growth, mineral and chlorophyll contents, and enzyme activities. Plant Soil 1996, 182, 287–300. [Google Scholar] [CrossRef]
  39. Bergmeyer, H.U. Methods of Enzymatic Analysis; Verlag Chemie: Weinheim, Germany, 1974; Volume 2. [Google Scholar]
  40. Bates, L.S.; Waldren, R.P.; Teare, I.D. Rapid determination of free proline for water-stress studies. Plant Soil 1973, 39, 205–207. [Google Scholar] [CrossRef]
  41. Waterman, P.G.; Mole, S. Analysis of Phenolic Plant Metabolites; Blackwell Scientific Publications: Oxford, UK, 1994; pp. 73–99. [Google Scholar]
  42. Singleton, V.L.; Orthofer, R.; Lamuela-Raventos, R.M. Analysis of total phenols and other oxidation substrates and antioxidants by means of Folin-Ciocalteu reagent. Methods Enzymol. 1999, 299, 152–178. [Google Scholar]
  43. Beta, T.; Naing, S.K.; Nam, S.; Mpofu, A.; Therrien, M. Antioxidant activity in relationship to phenolic content of diverse food barley genotypes. In Antioxidant Measurement and Applications; Shahidi, F., Ho, C., Eds.; American Chemical Society: Washington DC, USA, 2007; pp. 242–254. [Google Scholar]
  44. Nacheva, L.; Dimitrova, N.; Koleva-Valkova, L.; Tarakanov, I.; Vassilev, A. Effect of led light on the growth of raspberry (Rubus idaeus L.) plant in vitro. Agric. Sci. 2021, 13, 126–140. [Google Scholar]
  45. Koleva, L.; Petrov, V.; Zlatev, Z. Guide for Exercises in Plant Biochemistry; Academic Publishing House of the Agricultural University: Plovdiv, Bulgaria, 2016; p. 135. [Google Scholar]
  46. Eyidogan, F.; Tufan, O. Effect of salinity on antioxidant responses of chickpea seedlings. Acta Physiol. Plant. 2007, 29, 485–493. [Google Scholar] [CrossRef]
  47. Rachoski, M.; Gazquez, A.; Calzadilla, P.; Bezus, R.; Rodriguez, A.; Ruiz, O.; Menendez Santiago Maiale, A. Chlorophyll fluorescence and lipid peroxidation changes in rice somaclonal lines subjected to salt stress. Acta Physiol. Plant. 2015, 37, 37–117. [Google Scholar] [CrossRef]
  48. Ning, J.F.; Cui, L.H.; Yang, S.H.; Ai, S.Y.; Li, M.J.; Sun, L.L.; Chen, Z.; Wang, R.H.; Zeng, Z.B. Basil ionic responses to seawater stress and the identification of gland salt secretion. J. Anim. Plant Sci. 2015, 25, 131–138. [Google Scholar]
  49. McCaskill, D.; Croteau, R. Strategies for bioengineering the development and metabolism of glandular tissues in plants. Nat. Biotechnol. 1999, 17, 31–36. [Google Scholar] [CrossRef]
  50. Choi, Y.E.; Harada, E.; Kim, G.H.; Yoon, E.S.; Sano, H. Distribution of elements on tobacco trichomes and leaves under cadmium and sodium stresses. J. Plant Biol. 2004, 47, 75–82. [Google Scholar] [CrossRef]
  51. Attia, H.; Ouhibi, C.; Ellili, A.; Msilini, N.; Bouzaïen, G.; Karray, N.; Lachaâl, M. Analysis of salinity effects on basil leaf surface area, photosynthetic activity, and growth. Acta Physiol. Plant. 2011, 33, 823–833. [Google Scholar] [CrossRef]
  52. Bączek-Kwinta, R.; Serek, B.; Wator, A.; Hura, K. Porównanie aktywności antyoksydacyjnej odmian bazylii mierzonej różnymi metodami. Zesz. Probl. Postępów Nauk. Rol. 2009, 1, 539. Available online: https://www.infona.pl/resource/bwmeta1.element.dl-catalog-66fd27ab-6534-4c25-b0d4-bb11997ec8a3 (accessed on 22 July 2022).
  53. Mansour, M.M.F. Nitrogen containing compounds and adaptation of plants to salinity stress. Biol. Plant. 2000, 43, 491–500. [Google Scholar] [CrossRef]
  54. Hayat, S.; Hayat, Q.; Alyemeni, M.N.; Wani, A.S.; Pitchel, J.; Ahmad, A. Role of proline under changing environments: A review. Plant Signal. Behav. 2012, 7, 1456–1466. [Google Scholar] [CrossRef]
  55. Sairam, R.K.; Tyagi, A. Physiology and molecular biology of salinity stress tolerance in plants. Curr. Sci. 2004, 86, 407–421. [Google Scholar]
  56. Hassanein, R.A.; Bassuony, F.M.; Baraka, D.M.; Khalil, R.R. Physiological effects of nicotinamide and ascorbic acid on Zea mays plant grown under salinity stress. 1-changes in growth, some relevant metabolic activities and oxidative defense systems. Res. J. Agric. Biol. Sci. 2009, 5, 72–81. [Google Scholar]
  57. Hatano, T.; Ediamatsu, R.; Mori, A.; Fujita, Y.; Yasuhara, T.; Yoshida, T.; Okuda, T. Effects of the interaction of tannins with co-existing substances. VI. Effects of tannins and related polyphenols on superoxide anion radical, and on 1,1-diphenylpierylhydrazyl radical. Chem. Pharm. Bull. 1989, 37, 2016–2021. [Google Scholar] [CrossRef]
  58. Silva, J.C.; Rodrigues, S.; Feas, X.; Estevinho, L.M. Antimicrobial activity, phenolic profile and role in the inflammation of propolis. Food Chem. Toxicol. 2012, 50, 1790–1795. [Google Scholar] [CrossRef]
Figure 1. Setting up the experiment. (a) Eight days seedlings filled with substrate perlite; (b) Seedlings transplanted into the pots filled with substrate perlite.
Horticulturae 08 00775 g001
Figure 2. Design of the experiment: (a) Control (½ Hoagland’s solution); (b) ½ Hoagland’s solution with added NaCl (80 mM); (c) ½ Hoagland’s solution with added NaCl (160 mM); (d) 4/2 Hoagland’s solution.
Horticulturae 08 00775 g002
Figure 3. Basil plants at the end of the experiment.
Horticulturae 08 00775 g003
Table 1. The content of malondialdehyde (MDA (nmol MDA g−1 FW)), guaiacol (GPOD (U g−1 FW)), and proline (mg g−1 FW) in leaves and roots of sweet basil exposed to salinity.
Salt Concentration (A)The Morphological Part of the Plant (B)MalondialdehydeGPODProline
Control
(½ Hoagland’s solution with 0 mM NaCl)
Leaves0.13 ± 0.010.03 ± 0.0124.97 ± 0.10
Roots0.23 ± 0.011.32 ± 0.3432.50 ± 5.54
Average for Control0.18 ± 0.000.67 ± 0.1828.74 ± 2.82
½ Hoagland’s solution with NaCl (80 mM)Leaves0.17 ± 0.050.11 ± 0.0138.38 ± 1.49
Roots0.25 ± 0.051.38 ± 0.6268.04 ± 0.06
Average for ½ Hoagland’s solution with NaCl (80 mM)0.21 ± 0.000.74 ± 0.3253.21 ± 0.72
½ Hoagland’s solution with NaCl (160 mM)Leaves0.42 ± 0.043.76 ± 0.76110.81±0.01
Roots0.22 ± 0.010.10 ± 0.0373.31 ± 3.20
Average for ½ Hoagland’s solution with NaCl (160 mM)0.32 ± 0.021.93 ± 0.3792.06 ± 1.61
4/2 Hoagland’s solution with 0 mM NaClLeaves0.17 ± 0.010.06 ± 0.0340.33 ± 0.47
Roots0.23 ± 0.130.88 ± 0.1472.68 ± 4.94
Average for 4/2 Hoagland’s solution with 0 mM NaCl0.20 ± 0.060.47± 0.0856.51 ± 2.70
Average for:Leaves0.22 ± 0.040.99 ± 0.0153.62 ± 0.16
Roots0.23 ± 0.020.92 ± 0.0161.63 ± 3.05
HSDα=0,05 for:A0.0250.9316.079
B0.0270.4703.071
InteractionB/A0.0380.9406.141
A/B0.0381.3168.597
Note: Data are the means of three independent experiments (n = 3); ± standard deviation, HSD—an honestly significant difference.
Table 2. The content of total polyphenols (mg GAE g−1 FW), reducing sugars (% FW), and antiradical activity (% DPPH g−1 FW) in leaves and roots of sweet basil exposed to salinity.
Salt Concentration (A)The Morphological Part of the Plant (B)Total PolyphenolsReducing SugarsAntiradical Activity
Control
(½ Hoagland’s solution with 0 mM NaCl)
Leaves487.93 ± 44.680.54 ± 0.02026.10 ± 1.72
Roots504.63 ± 89.210.46 ± 0.10027.56 ± 5.32
Average for Control496.28 ± 22.270.50 ± 0.03526.83 ± 3.52
½ Hoagland’s solution with NaCl (80 mM)Leaves424.60 ± 40.030.53 ± 0.01026.34 ± 2.28
Roots498.69 ± 84.430.54 ± 0.35024.87 ± 4.01
Average for ½ Hoagland’s solution with NaCl (80 mM)461.64 ± 62.230.54 ± 0.04525.60 ± 3.15
½ Hoagland’s solution with NaCl (160 mM)Leaves402.51 ± 29.850.53 ± 0.01020.81 ± 2.38
Roots469.99 ± 29.850.63 ± 0.03521.13 ± 1.50
Average for ½ Hoagland’s solution with NaCl (160 mM)436.25 ± 5.010.58 ± 0.05020.97± 1.94
4/2 Hoagland’s solution with 0 mM NaClLeaves525.39 ± 59.440.70 ± 0.20028.12 ± 2.51
Roots498.90 ± 12.420.47 ± 0.08025.12 ± 2.23
Average for 4/2 Hoagland’s solution with 0 mM NaCl462.14 ± 23.510.59 ± 0.08526.62 ± 2.37
Average for:Leaves435.11 ± 13.780.58 ± 0.05025.34 ± 2.22
Roots443.05 ± 3.050.53 ± 0.08024.67 ± 3.27
HSDα=0.05 for:A135.3970.0283.003
Bn.s.0.015n.s.
InteractionB/An.s.0.029n.s.
A/Bn.s.0.040n.s.
Note: Data are the means of three independent experiments (n = 3); ± standard deviation, HSD—an honestly significant difference.
Publisher’s Note: MDPI stays neutral with regard to jurisdictional claims in published maps and institutional affiliations.

