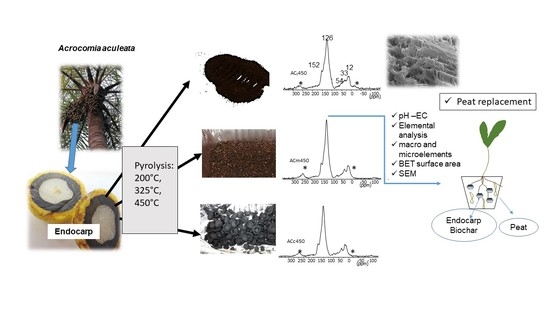
3.1. Mass Loss and Changes of the Elemental Composition during Pyrolysis
Increasing the pyrolysis temperature to 450 °C decreased the biochar yields to 33–35% of the starting weight of the
Acrocomia nutshells (
Table 2), which is in the range reported for the same material by Boas Vilas et al. [
36]. A clear impact of the particle size of the feedstock on the weight loss cannot be discerned. Most of the loss occurred during the increase in the temperature from 200 °C to 325 °C, which is related to the fact that the degradation of hemicellulose and cellulose starts around 200 °C to 300 °C and around 250 °C to 350 °C, respectively [
8]. However, note that although a slight increase in the ash content was observed with an increasing pyrolysis temperature, they were smaller than 5% of the dry weight of the biochars. Comparable low values were obtained for other nutshell biochars [
37] and were explained with the low ash content of such biomass [
38].
For the samples AC and AC200, the homogeneity of variances was asserted using Levene’s Test which showed that equal variances could be assumed (C: p = 0.133, N: p = 0.200, H: p = 0.582). Tukey’s post hoc analysis revealed that heating the feedstock until 200 °C did not lead to significant differences in the elemental composition. However, pyrolysis temperatures of 325 °C and higher caused the volatilization of organic compounds and with that, considerable changes of the elemental composition of the solid products.
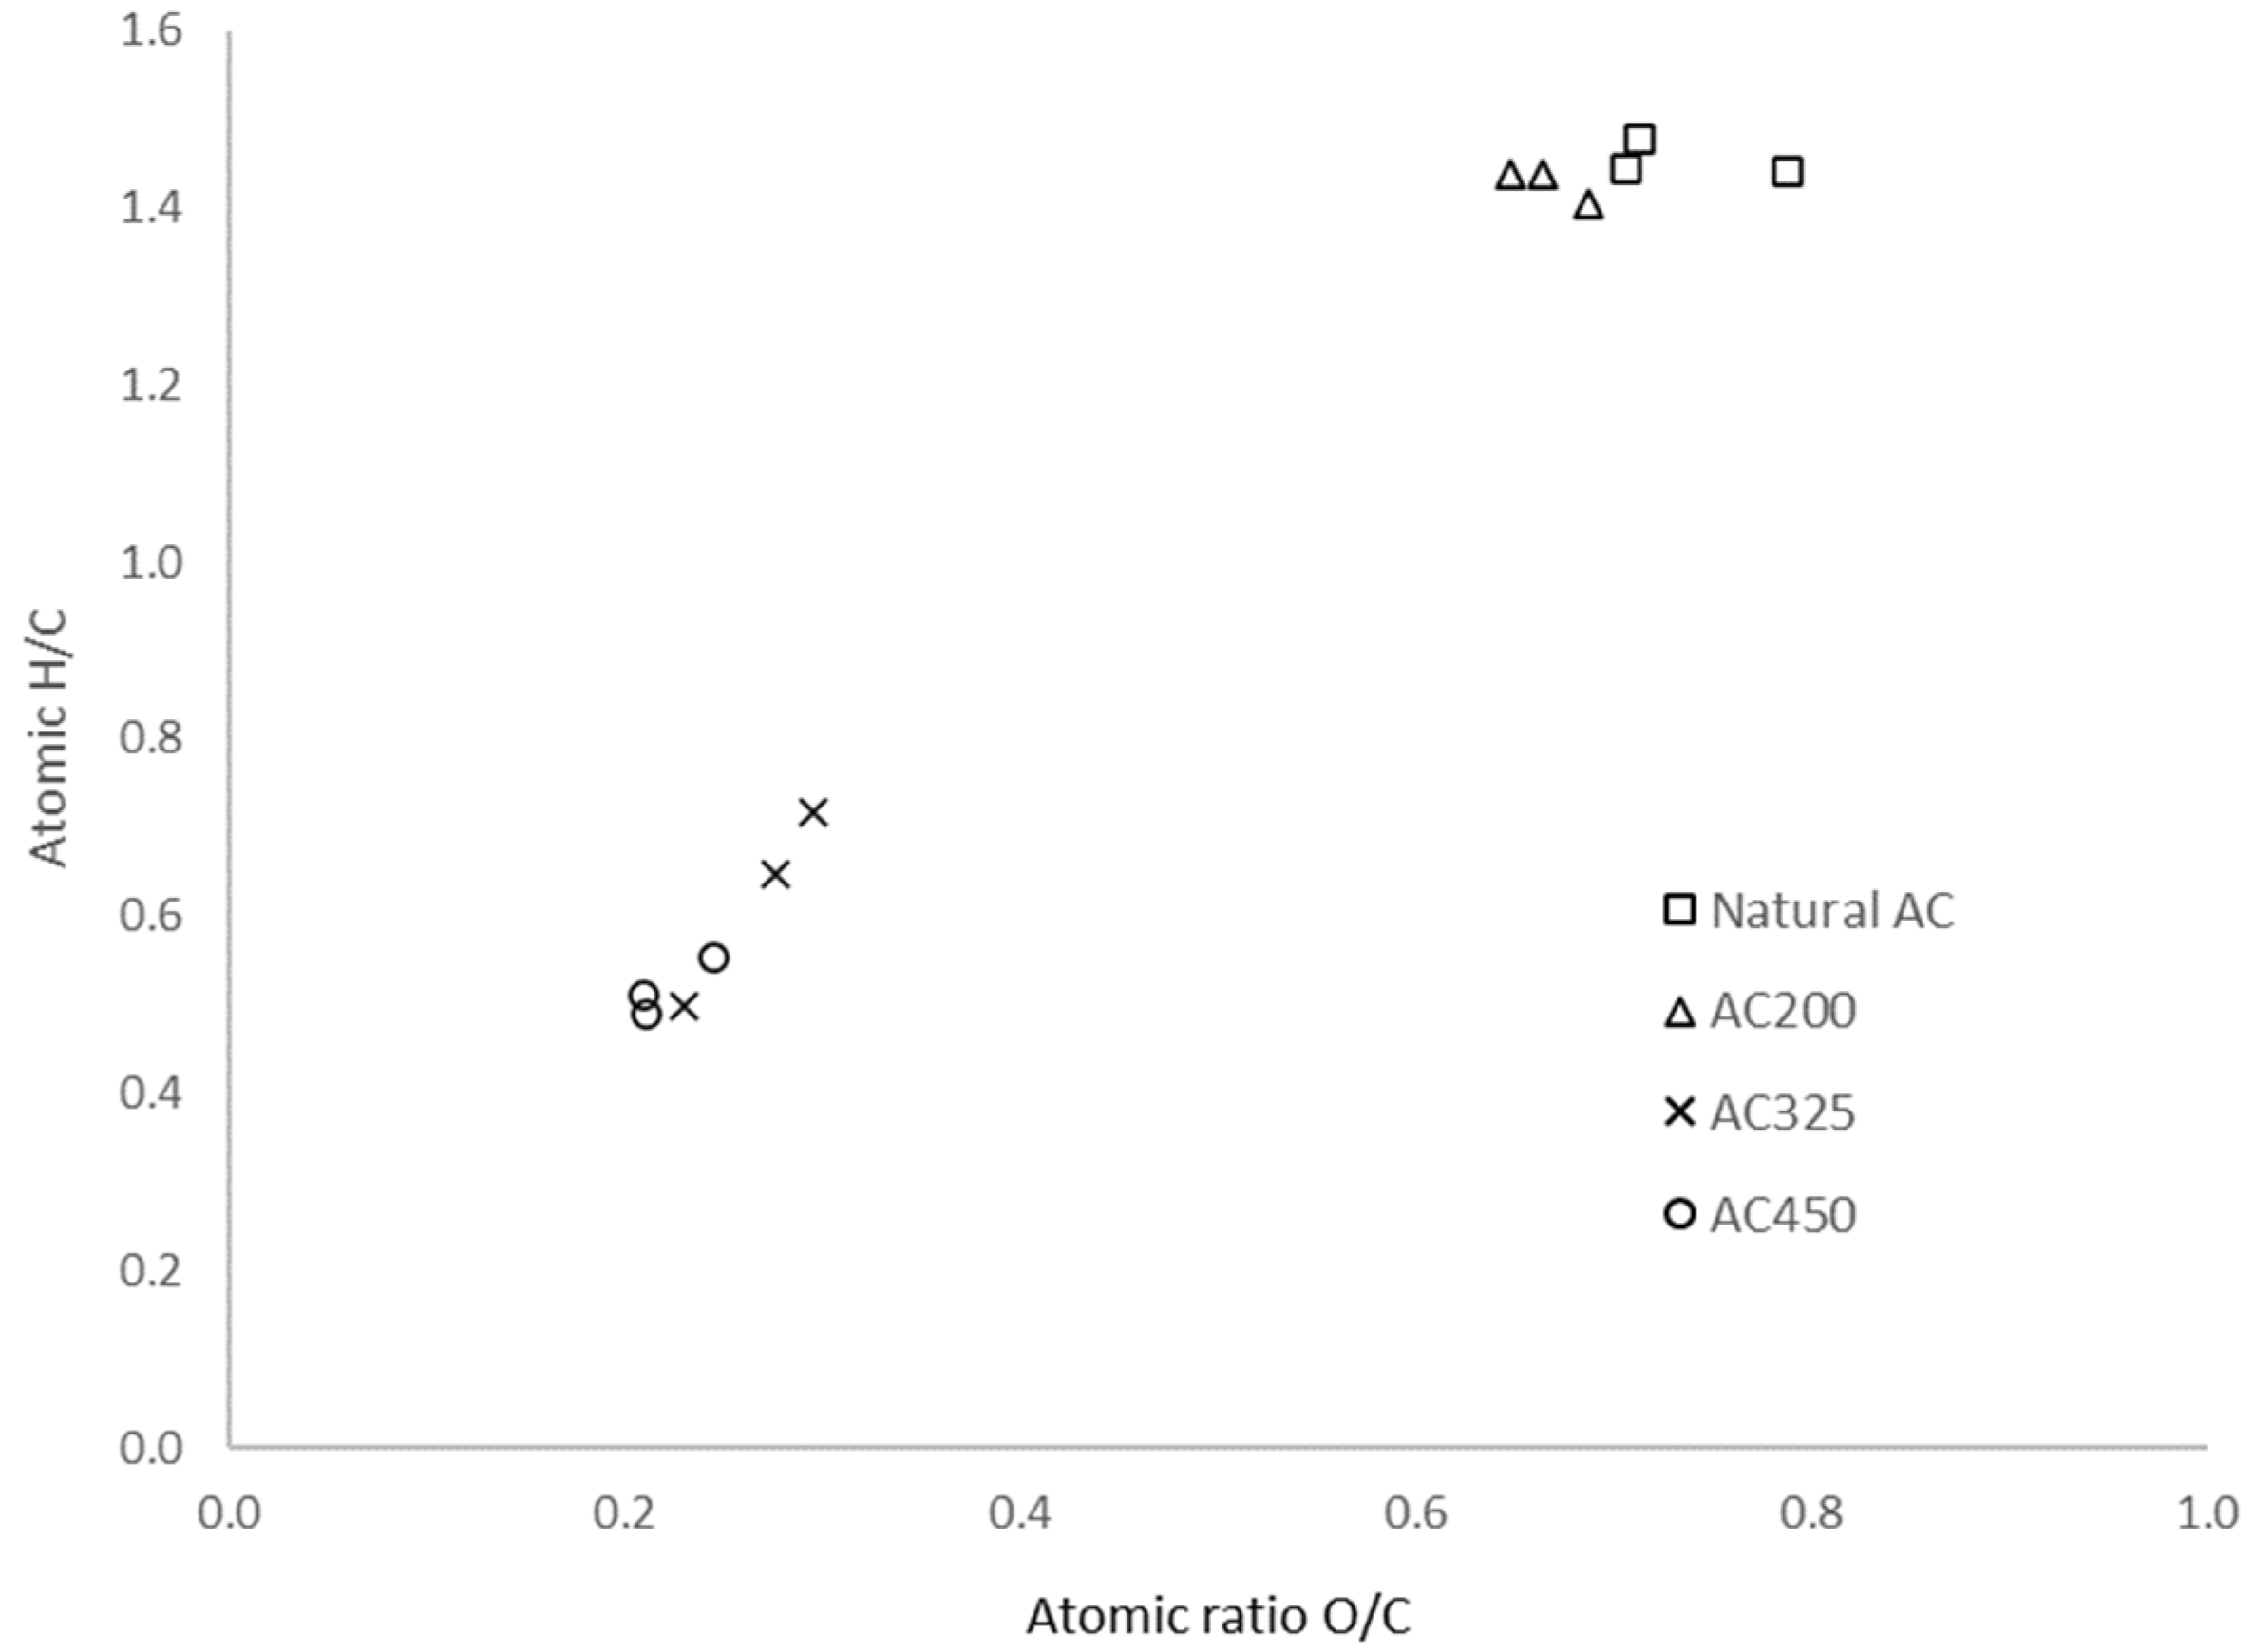
Although all elements show losses, they are bigger for O, H and N compared to C, which leads to a relative enrichment of C in the chars. Correspondingly, the C/N ratio (
w/
w) decreases and the H/C
atm and O/C
atm ratios increase. Plotting those ratios into a van Krevelen plot (
Figure 1) shows the biochars produced up to a temperature of 200 °C n the region typical for lignocellulosic material. Increasing the temperature led to values that plot along the line indicative for dehydration caused by the breakdown of bonds and formation of double bonds. Pyrolysis at 450 °C resulted in a material with an elemental composition that plots in the regions typical for biochars. According to the requirements of the International Biochar Initiative (IBI) and the European Biochar Certificate (EBC) [
39], both the biochars produced at 325 and 450 °C can be considered as biochars (H/C
atm < 0.7, O/C
atm < 0.4) (
Table 2).
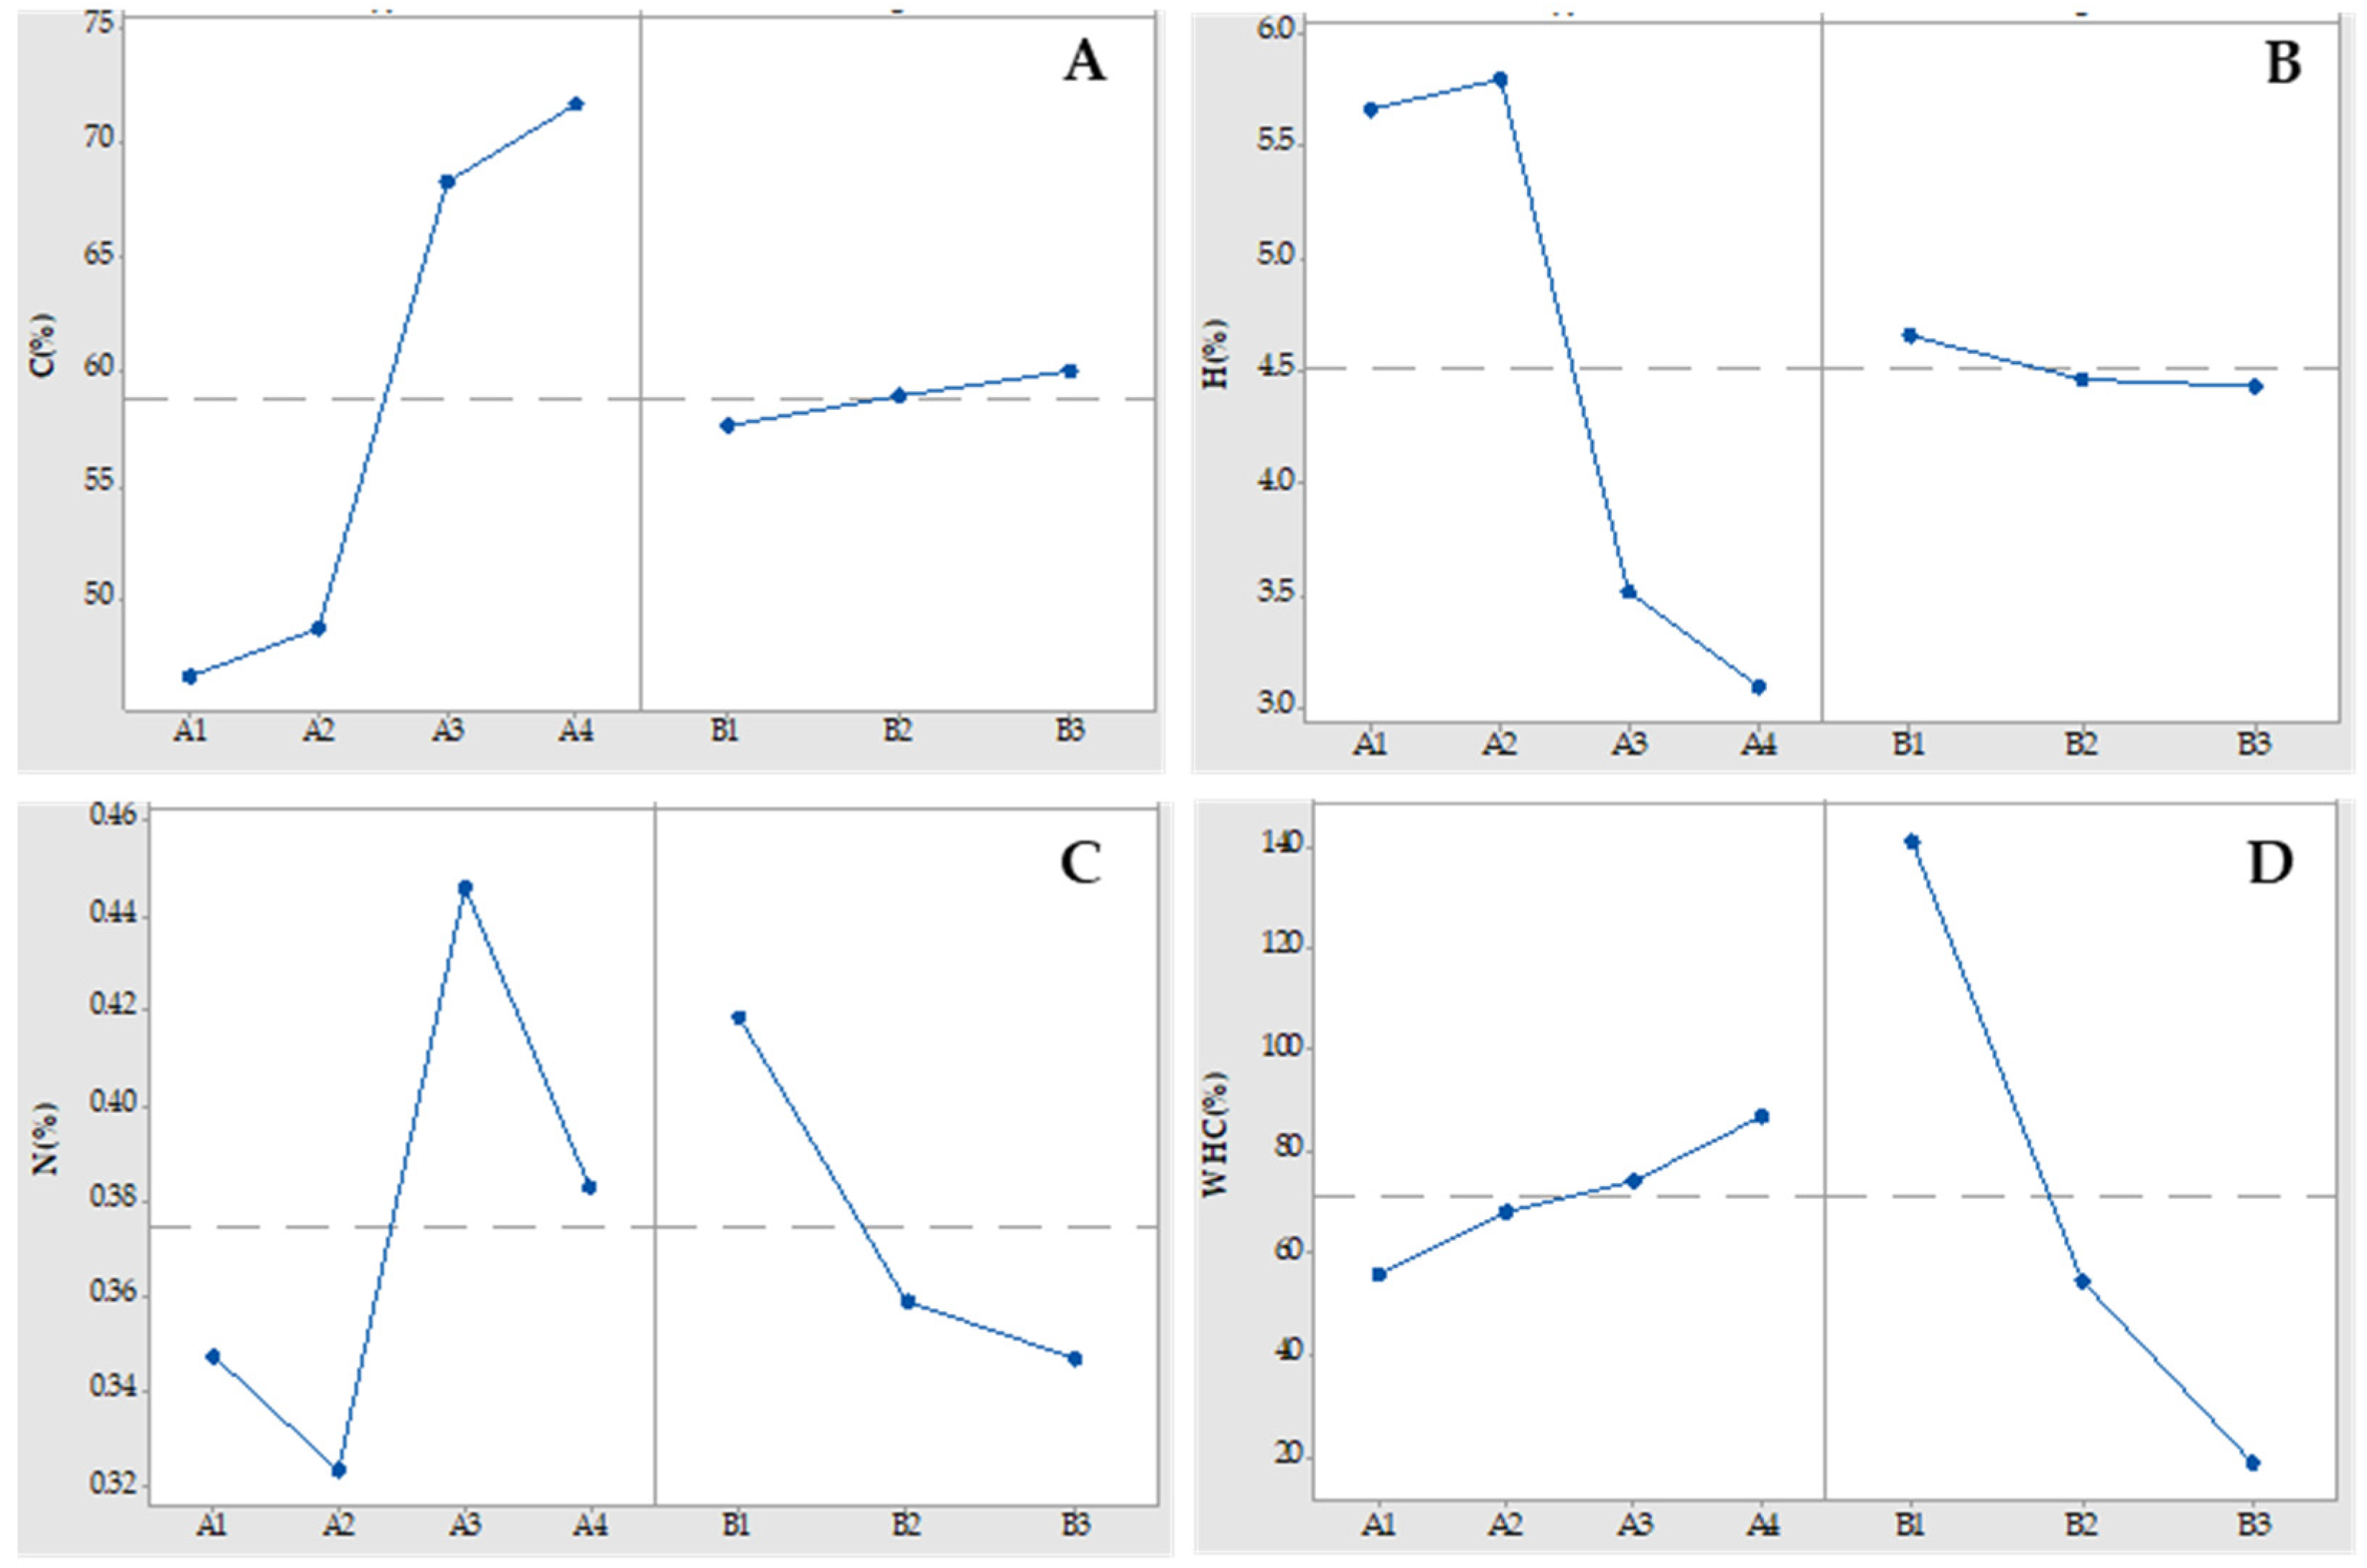
Tukey’s post hoc HSD analysis of the alteration of the elemental composition in the samples resulting from the increase in the pyrolysis temperature from 325 °C to 450 °C confirmed a heat-induced increase in the C concentration, which goes along with a decrease in the H content; no clear tendency is revealed for N. Prior use of Levene’s test showed that equal variances could be assumed for C and H contents (
p = 0.053;
p = 0.067), but not for N (
p = 0.001). Although the one-factor ANOVA provided no clear evidence for the impact of the particle size on the elemental composition of the biochars, a two-factor ANOVA for the linear model was applied for a better evaluation of this interaction. According to the F-test, the C and H contents of the charred material are up to 100 times more affected by temperature than by size. For N, this pattern is less expressed although the effect of temperature is still more significant than the impact of particle size. Since, with respect to the elemental composition, no major impact of the particle size of the feedstock can be identified (
Figure 2), we conclude that the final pyrolysis temperature rather than particle size determined the efficiency of the carbonization process.
3.2. Solid-State 13C NMR Spectroscopy
The solid-state
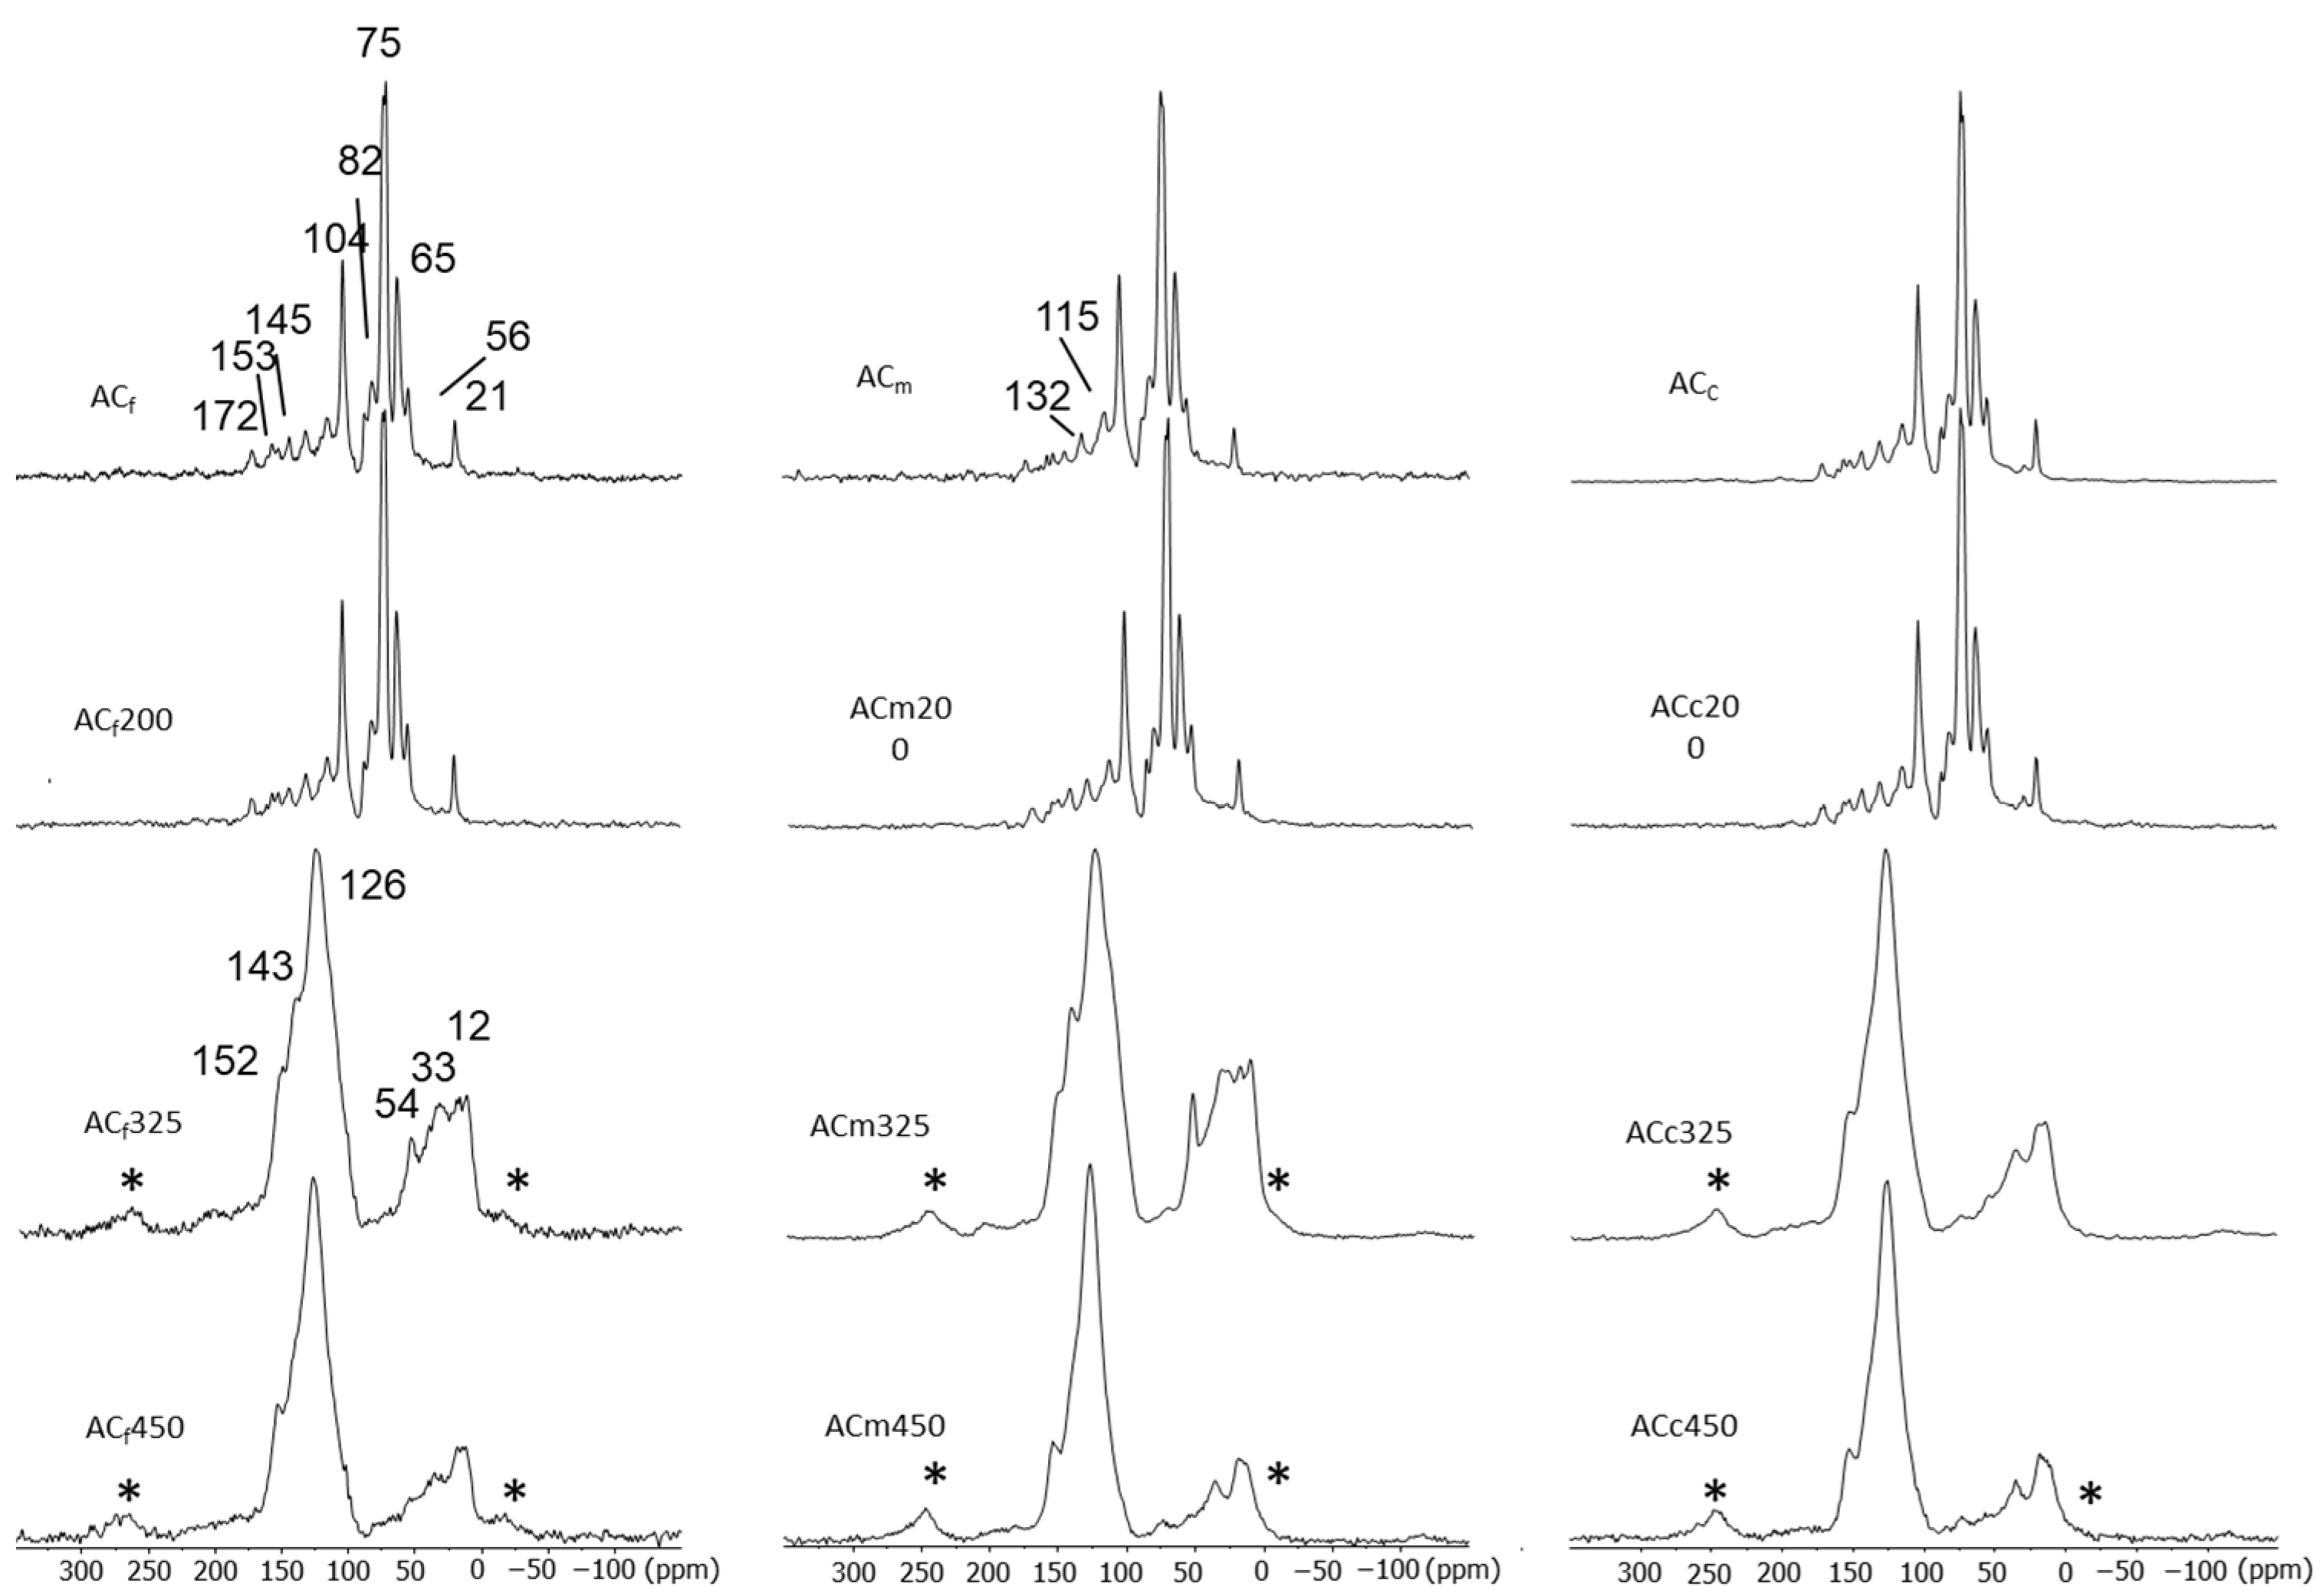
13C NMR spectra of the feedstock with different particle sizes show comparable intensity distribution (
Figure 3,
Table 3), which are typical for woody materials [
34]. The signal at 75 ppm can be assigned to C2/C3/C5 in cellulose, whereas those at 83 ppm and 89 ppm are indicative for its C4 in amorphous and crystalline domains, respectively. The C1 is typically found at 104 ppm and C6 at 65 ppm. However, hemicellulose units are also contributing to the chemical shift region of
O-alkyl C from 110 to 60 ppm. In total, these C groups contribute 63 to 66% to the total organic C of the feedstock.
Resonance lines of aryl C occur between 160 and 110 ppm and comprise 18 to 20% of the total 13C intensity. In woody samples, they derive mostly from lignin giving signals at 153 ppm (C3/C5 in syringyl), 145 ppm (C3/C4 in guaiacyl, C3 in syringyl), 132 ppm (C1) and 115 ppm (C3/C5 in p hydroxyphenyl). The respective resonance of methoxyl C appears at 56 ppm and explains 6 to 7% of the total C of the sample. The signal at 173 ppm and 21 ppm are indicative for the carboxyl C and acetyl C of uronic acids. Increasing the pyrolysis temperature to 200 °C slightly decreases the intensity in the O-alkyl C region, but only a temperature of 325 °C causes a major alteration of the chemical composition.
Calculating the recovery of C for each chemical shift region (
Table 4) confirms an almost complete loss of
O-alkyl C. Since the amount of C recovered as aryl C increases during pyrolysis to 40% of the total initial C (Ct
i), some of the cellulose units must have been transformed into new aromatic structures which have their main signal at 126 ppm and contain phenol C, resulting in signals at 152 ppm and 143 ppm. Aside from aryl C, alkyl C, possibly derived from dehydroxylated and only partially degraded carbohydrate residues, accumulates. Increasing the pyrolysis temperature to 450 °C, however, leads to their preferential combustion. In addition, a considerable loss of methoxyl C (54, 56 ppm) and C giving rise to the signal at 143 ppm is evidenced. Bearing in mind that between 325 °C and 450 °C no major loss of oxygen (
Table 2) or phenol C is indicated, one may conclude that demethylation, rather than demethoxylation, of the aromatic units occurred.
Comparing the relative intensity distributions of the spectra obtained from samples with different particle sizes that were produced at the same pyrolysis temperature reveals no major differences, confirming that a relatively homogenous temperature within the sample material was achieved.
3.3. Physical Properties of the Uncharred Particles of the Acrocomia endocarp and Their Biochars
The bulk density of the biochars (
Table 5) are in the range commonly reported for biochars [
40], but are greater than the value between 0.1 and 0.3 g cm
−3 reported for well-humified peat [
41] or moss substrate [
42]. Pyrolysis at 450 °C resulted in a slight decrease in this parameter.
The WHC
maxw of the feedstock increases considerably from 13 ± 1% to 127 ± 1% of the sample dry weight with a decreasing particle size (
Table 5), most likely because the greater surface of the smaller particles provided more water adsorbing surfaces. This converts to 84% and 8% if a volume-based WHC
maxv is used. With the exception of the biochars composed of fine particles, enhancing the pyrolysis temperature had no clear impact on the weight-based WHC
max (
p = 0.08 and F-test for Temp:size is 3.7:121.5). For AC
f, pyrolysis at 450 °C slightly increased the WHC
maxw to 169 ± 5% (WHC
maxv: 108%). This range was observed for wood biochars produced at the same temperature [
6] and is still six times higher than that of the course biochar (28 ± 2%; WHC
maxv: 15%). For comparison, the WHC
maxv of the humified peat substrate are in the range of 70 to 75% [
43].
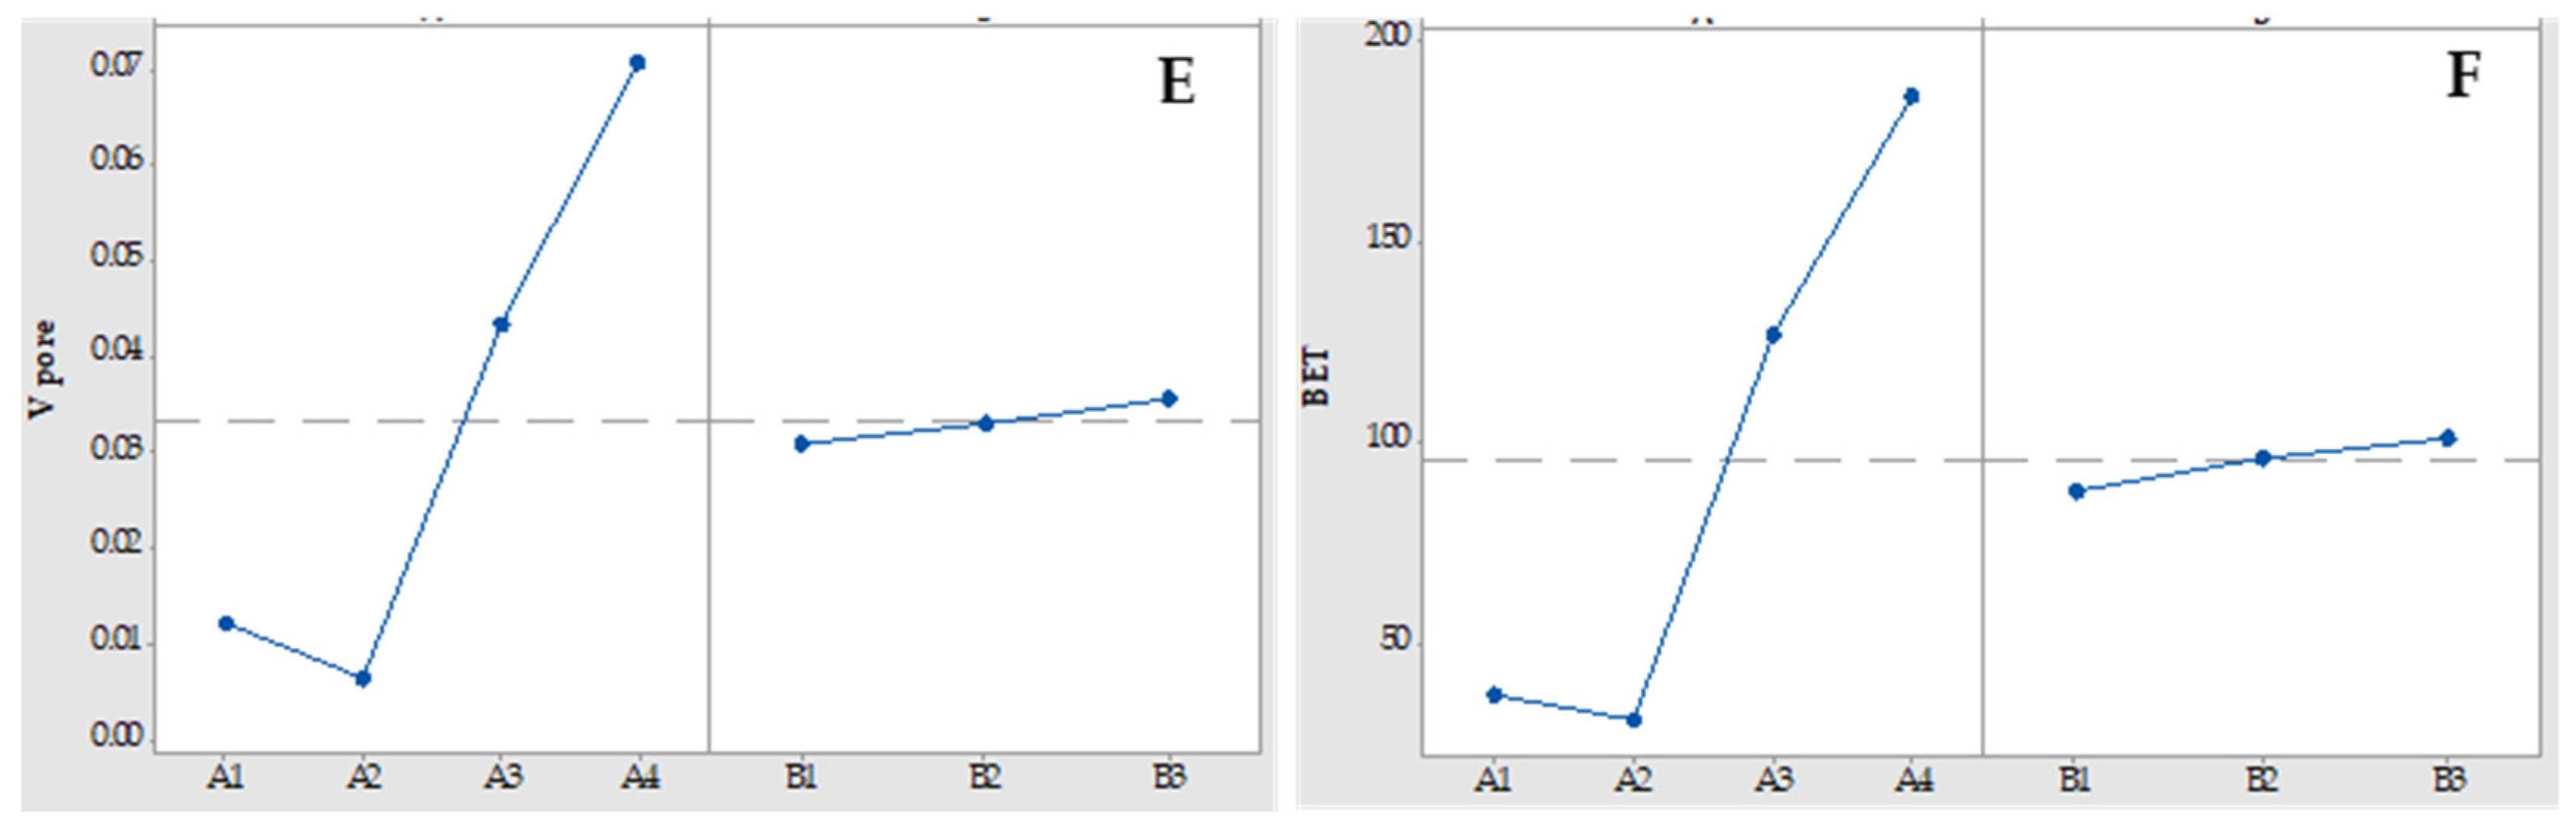
The application of the BET method using CO
2 (
Table 5) could not confirm a clear impact of particle size of the feedstock or the biochar on the specific surface area or the maximum pore volume, indicating that grinding did not lead to major alterations at the levels of meso- and microporosity grinding. This observation indicates that porosity alone cannot be directly related to the WHC of a biochar. In addition, no relationship between BET surface area and WHC
max was detectable (
R2 = 0.040). Accordingly, it may be concluded that the determination of the BET porosity of biochar may be insufficient for a good prediction of the impact of the biochar addition on the water retention capacity of amended soil.
On the other hand, irrespective of the particle size, enhancing pyrolysis temperatures yielded a higher BET-specific surface area. They increased from 42 to 176 m
2 g
−1 and from 23 to 179 m
2 g
−1 for the biochars with fine and coarse particle sizes, respectively. The maximal pore volume showed the same tendency. However, this increase affected only the biochars produced at temperatures of 325 °C and 450 °C, which is the temperature range in which a noticeable weight loss was observed. This suggests that heat-induced degradation and volatilization of organic matter lead to physical alterations that increase the specific surface area. A comparable observation is reported by Wang et al. [
44], suggesting that the loss of volatile or aliphatic compounds at higher temperatures increases the surface area, pore formation and pore volume. The specific surface areas determined in the present study are considerably higher than those reported by [
45] who found values between 0.4 and 5.8 m
2 g
−1 for the endocarp of
A. aculeata after pyrolysis at 250 °C and 450 °C by using N
2 as adsorption gas. In order to explain this difference, one has to bear in mind that with their method only pores ≥ 2 nm were probed which omits the important contribution of the micropores [
46]. Their contribution commonly increases with increasing pyrolysis temperature due to the morphological changes caused by chemical alterations. In line with this, Mukherjee et al. [
47] studying the surface area of pine, grass and oak biochars at different temperatures using N
2, detected nanopores only in biochars produced at 650 °C. However, with CO
2, they found micropores (<1.5 nm) in the biochars produced at all pyrolysis temperatures (250 °C, 400 °C and 650 °C). Comparable results are reported by Mao et al. [
48].
Compared to biochars derived from other wood residues pyrolyzed at 500 °C [
47,
49], the specific surface area determined with CO
2 adsorption of our biochars is approximately a factor of 0.5 lower, but are in the range of values (130 m
2 g
−1) published by Mao et al. [
48] for wood waste (pine and sawdust) pyrolyzed at 500 °C.
3.4. Physical Properties of the Uncharred Particles of the Acrocomia endocarp and Their Biochars
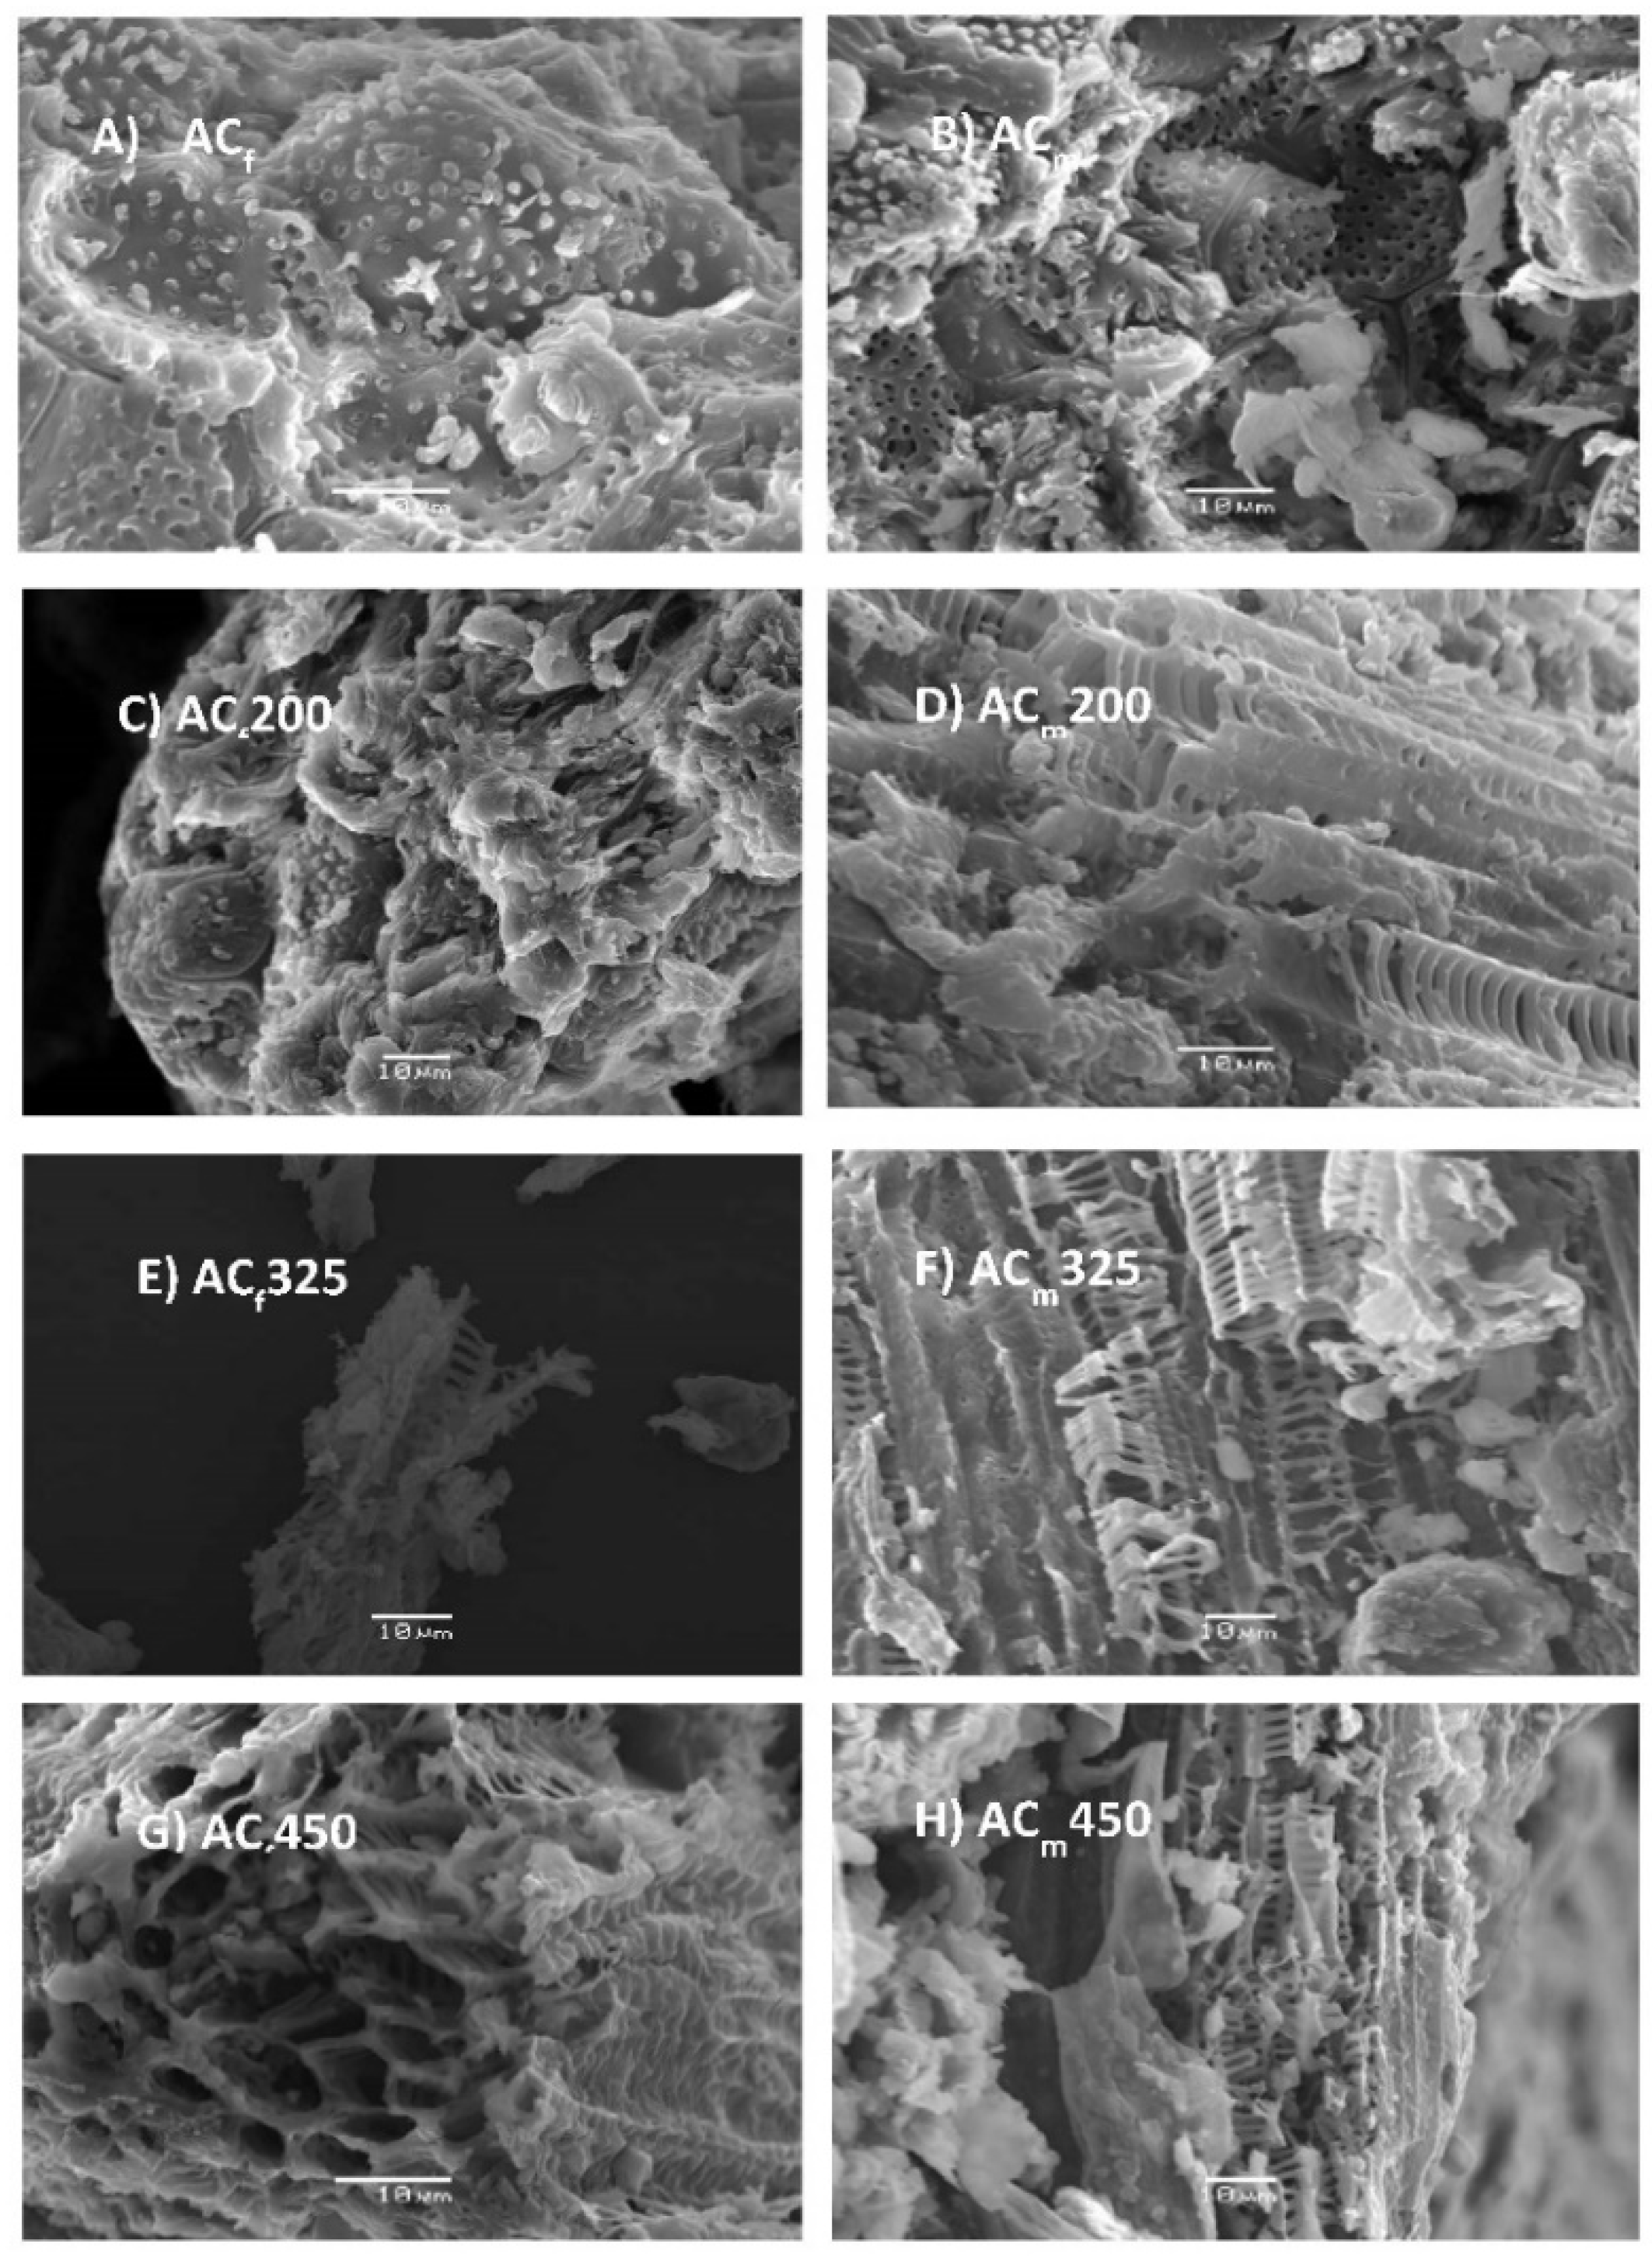
The FESEM images of AC
f and AC
m show a comparable distribution of pores with a size of approximately 1 µm as they naturally occur in cell walls (
Figure 4A,B).
This is in line with the results of BET data showing that on a microscopic level no changes of the porosity are induced by the milling.
Figure 4C,D reflect morphological disintegration after pyrolysis at 200 °C.
The respective biochar surface shows more crevices and cracks, however, mass loss and chemical characterization did not reveal major chemical alterations. Enhancing the pyrolysis temperature to 325 °C and 450 °C seems to increase the porosity of the
Acrocomia biochars and the importance of longitudinal pores with diameters ranging around 10 µm. The respective images show the xylem vessels with scalariform pores, and the fibers of the parenchyma structures are maintained in both the 1 mm and 4 mm samples. Such characteristics are typical in wood-derived biochars [
6].
Since this is the temperature at which cellulose thermally degrades, this change may be interpreted by the loss of carbohydrates leaving perforated, lignified cell walls behind, as it is also indicated by the solid-state 13C NMR spectra. Note that pores in the range of 10 µm and bigger will not only play an important role for the adsorption of water but also present a habitat for microorganisms. Both may be an advantage for a potting substrate.
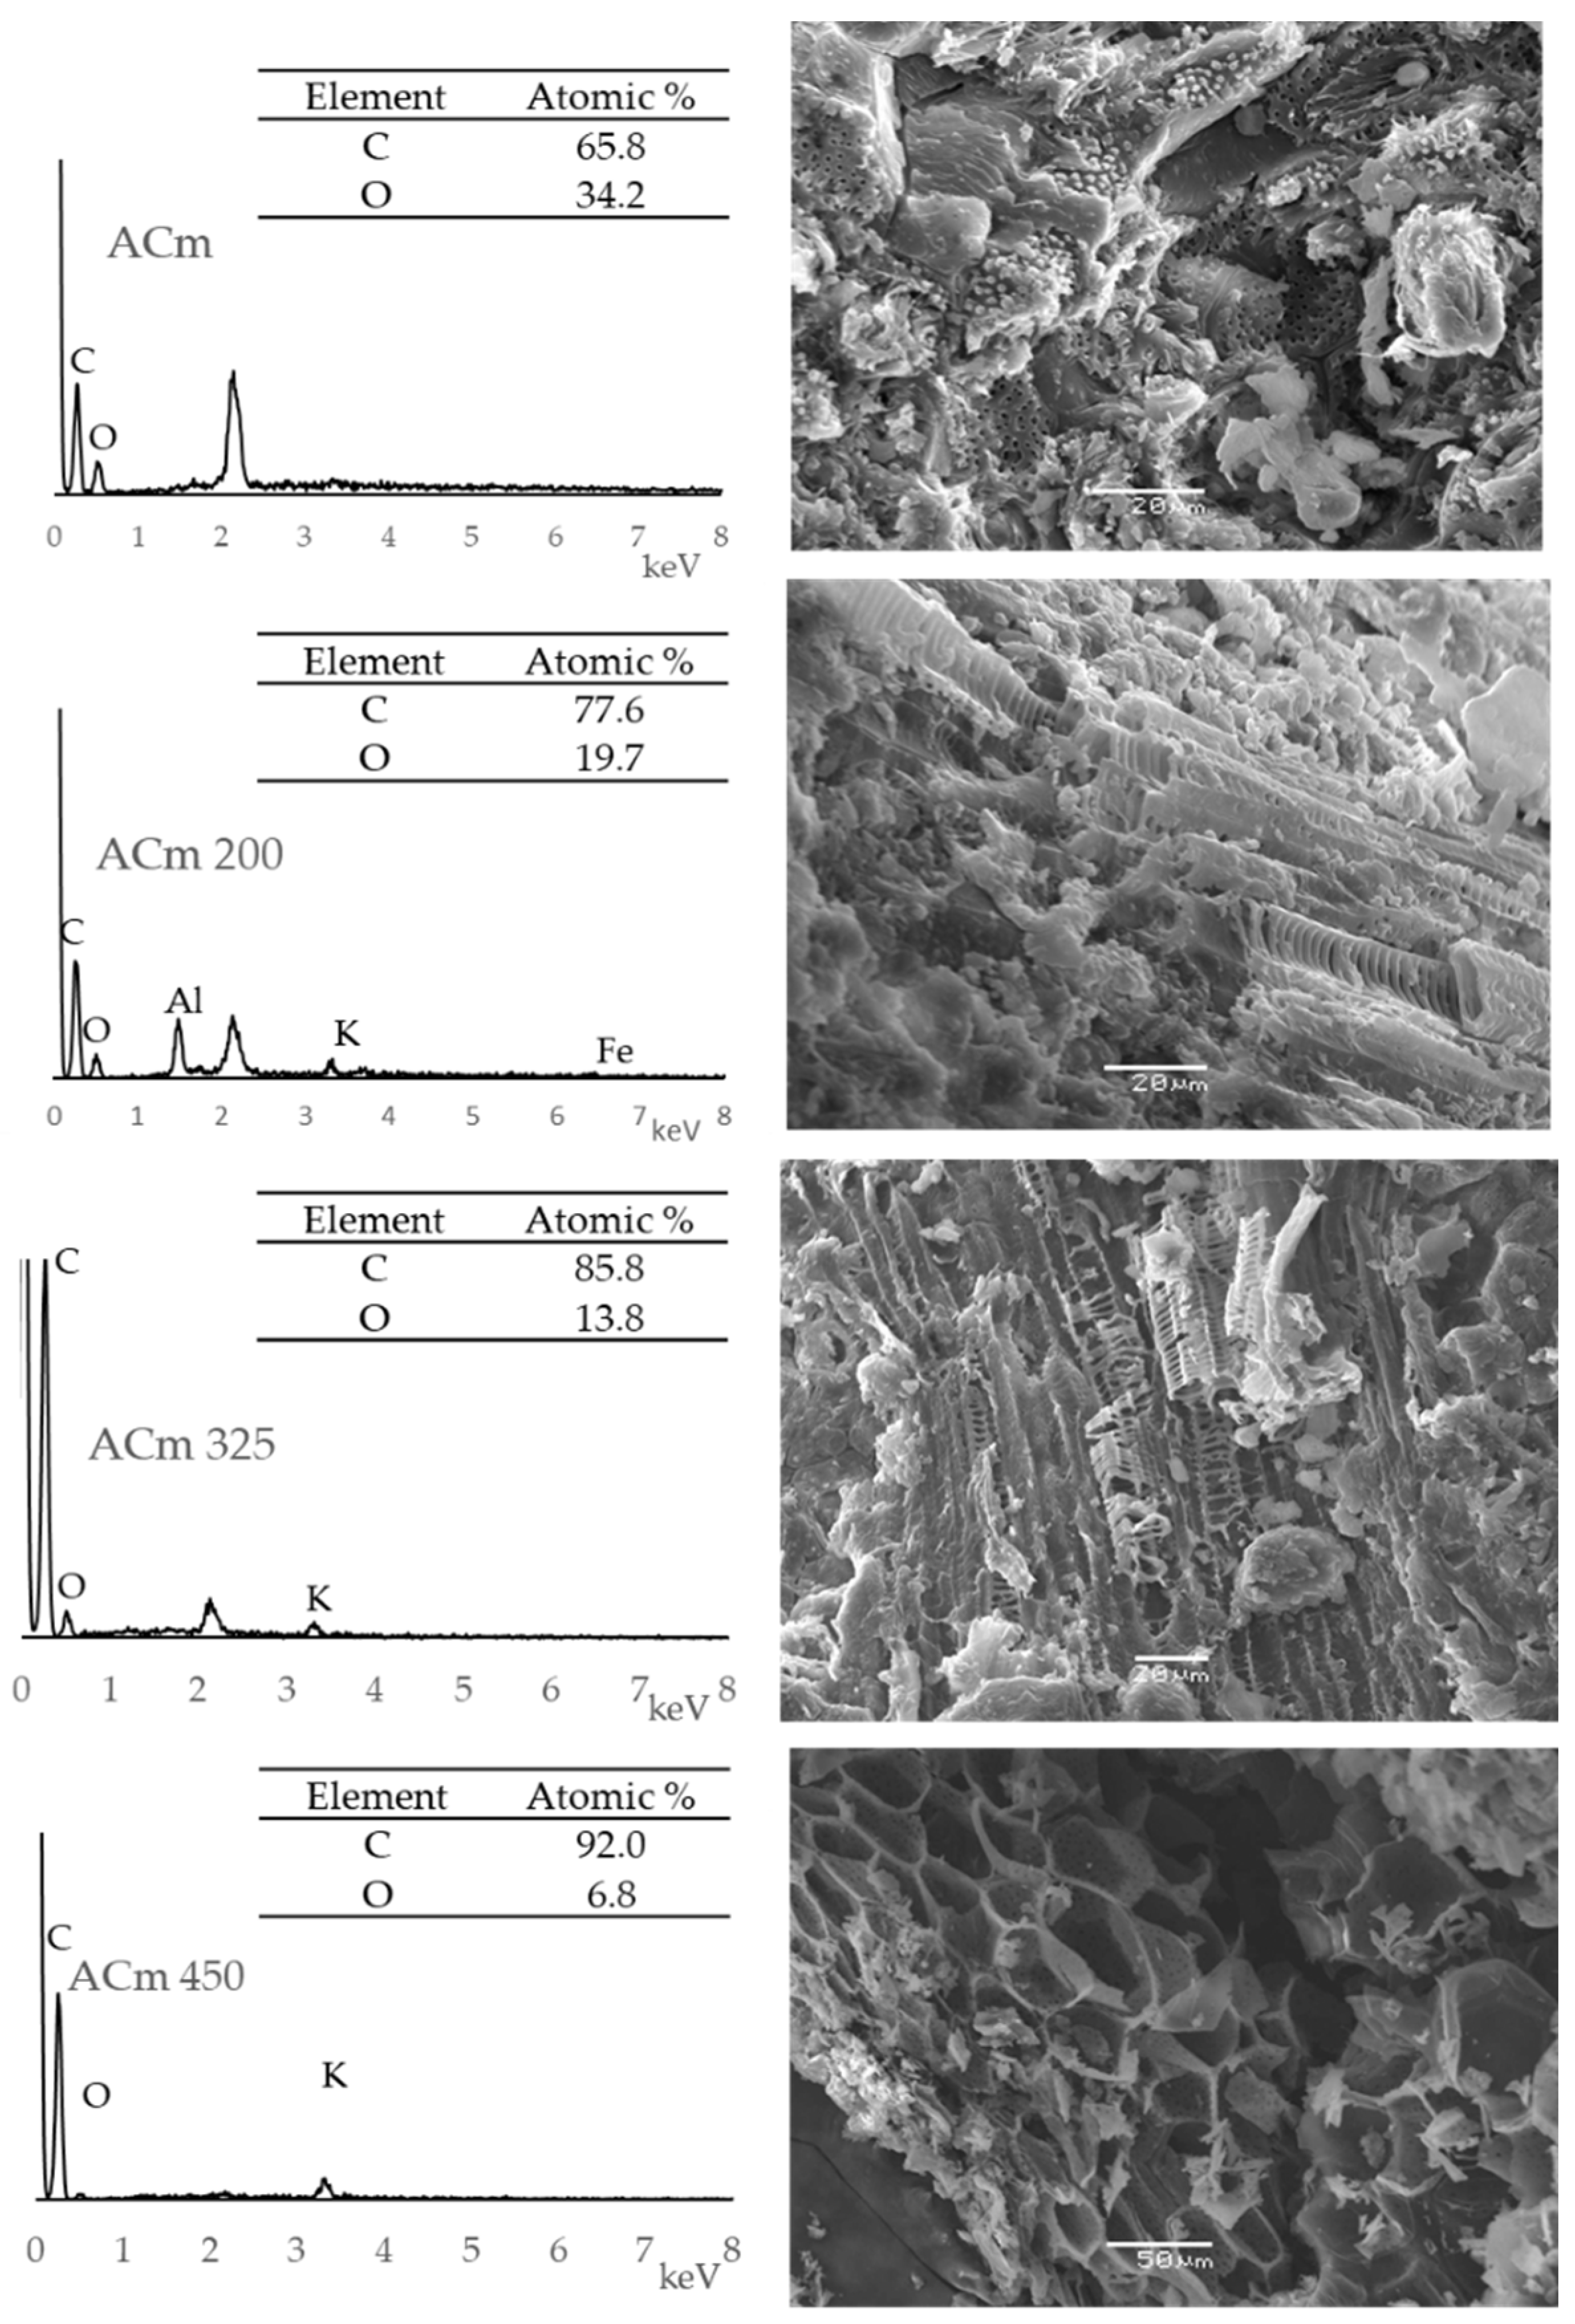
The EDS spectra in
Figure 5 confirm that C is the major element in all the samples (fine and medium) and to a lesser extent, Si, Ca, K, P and O.
3.5. pH, Electrical Conductivity and Nutrient Contents of the Biochars
Concomitantly to the accumulation of ash due to the loss of organic matter, the pH value measured for the fine biochar increases with the severity of the pyrolysis conditions (
Table 6) from 5.9, in the finely grained feedstock, to 8.4. For the coarse biochars, slightly higher values with the same trend are observed with an increasing pyrolysis temperature. Compared to biochar from wood residues, rice husks or tomato plant residues [
11,
21], the pH of the biochars obtained at 450 °C show lower pH values. This behavior may be advantageous with respect to the potential use of such biochars in soilless substrates. Whereas for acid soils, the addition of biochars with a high pH may be beneficial as liming substrate, in soilless cultures, a higher concentration of such amendments are likely to have a negative impact on nutrient availability and thus on plant growth.
A high pH of biochar and the implied high contents of cations may be of less importance if the biochar is used as an amendment for soils since it will be buffered and the cation concentration diluted. For potting substrates on the other hand, it may be a major concern since there is a low potential for compensation. Here, the removal of a surplus of cations from biochar may be essential if this material is intended to be used as a substitute for peat in growing substrates.
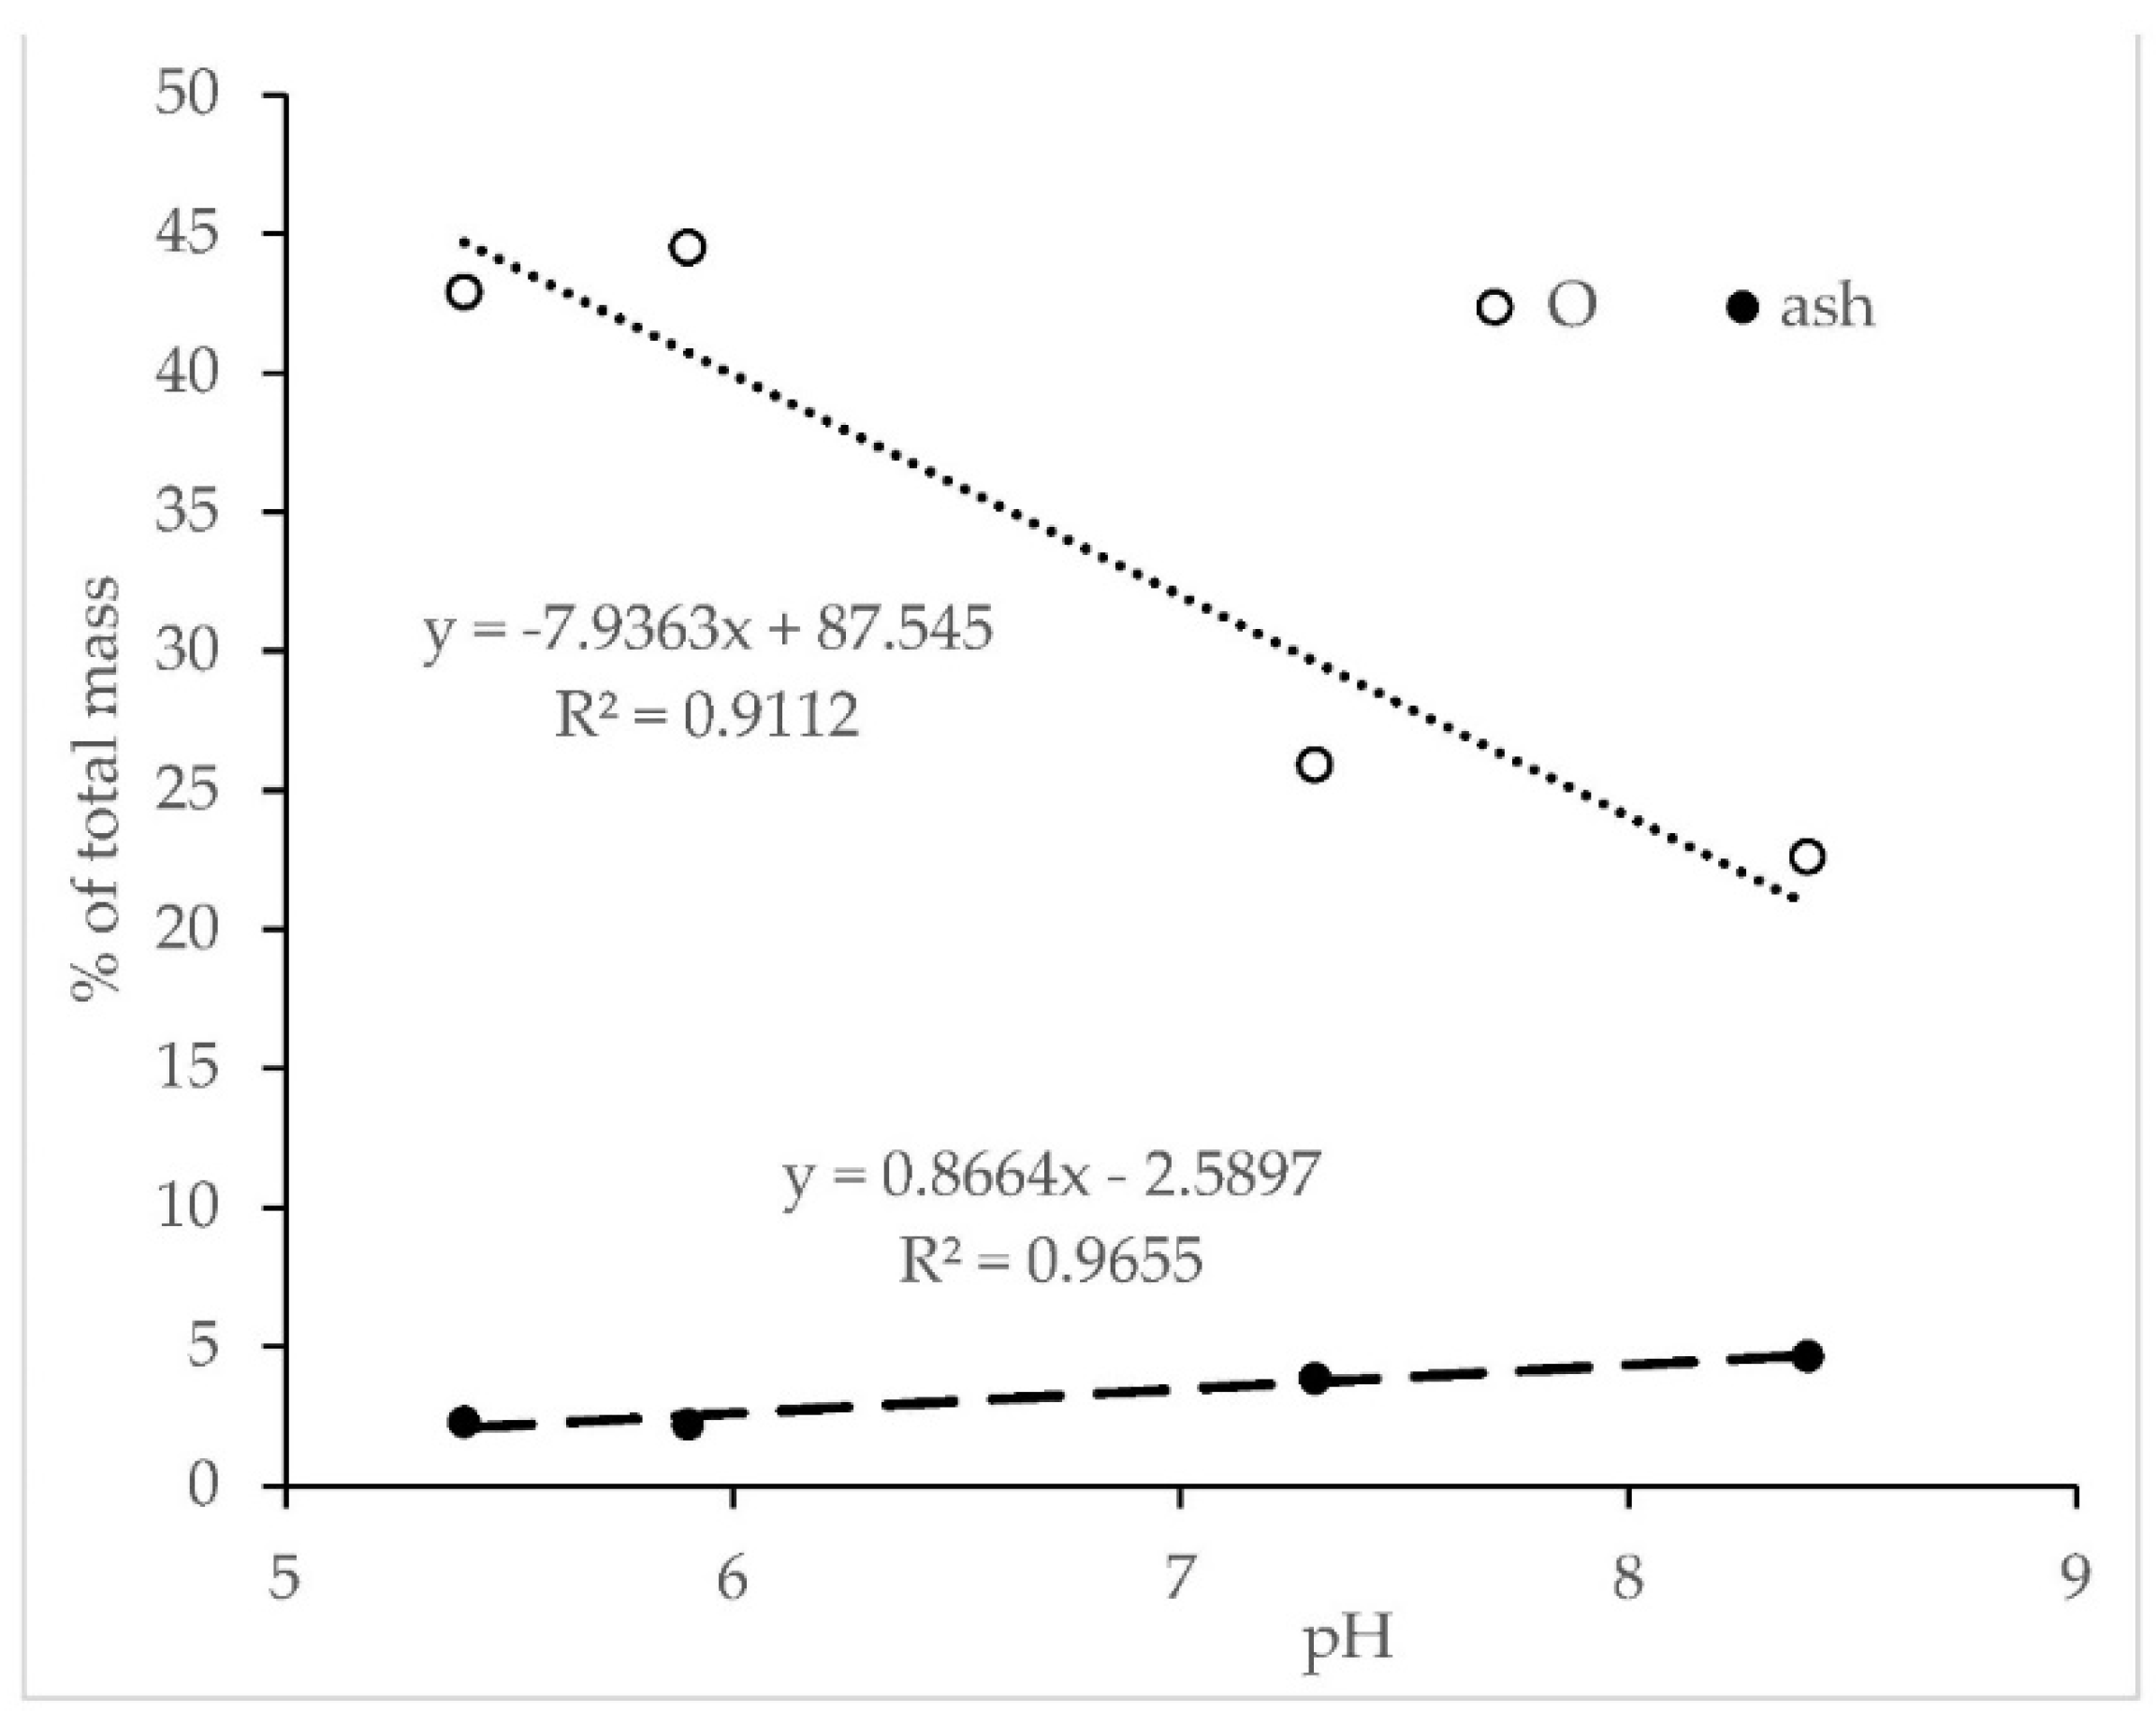
For a better prediction of the impact of biochars with a high pH amended to planting substrates on soilless cultures, a better understanding of the reasons for the rise in pH during wood pyrolysis is needed. Performing Boehm titration, Mukherjee et al. [
47] related the increase in alkalinity to a progressive loss of the acidic surface functional groups, mainly the aliphatic carboxylic acids. Indeed, our biochars show a good and negative correlation between their oxygen (O) concentrations (
Table 2) and pH values (
R2 = 0.912) (
Figure 6) which could support a loss of acid O-containing groups, such as carboxylic C.
This interpretation is in line with observations of Narzari et al. [
50] that show an increment of soluble salts and Ca with an increasing biochar pH. As a consequence, we conclude that for our samples, the increase in the pH is best explained by the accumulation of cations induced by the loss of organic matter. Thus, the lower pH of our biochars relative to other woody biochars is best explained by the low ash content of the feedstock (
Table 2). Having a closer look at the contribution of the single cations, the low Ca content suggests that other cations must be more important for the pH increase as it was also reported elsewhere [
27]. In the case of the present biochars, potassium represents, with 2.6 g kg
−1 dry mass of AC
f450, a potential candidate. Note that this is approximately three to four times higher than the concentration recommended for optimal tomato growth in a soil environment [
51]. This needs some consideration with respect to plant nutrition. Whereas potassium does not become a part of the chemical structure of plants, it plays many important regulatory roles in plant development. It is involved in enzymatic activities, determines stomatal activity, thus water use efficiency, photosynthetic and transportation processes, as well as the synthesis of proteins and starch [
52]. As an antagonist to Mg, excessive levels of K can drop the Mg in plant leaves [
19,
53]. A further primary risk of too much potassium is a nitrogen deficiency which will stunt the growth of the plant and lead to chlorosis. It also can reduce C assimilation [
54].
For the finely grained feedstock and its biochar produced at 200 °C, EC values of 620 ± 39 and 526 ± 13 µS cm
−1 were measured (
Table 6). In contrast to common reports on biochar EC, this parameter decreases considerably to a value of 130 ± 4 µS m
−1 with an increasing pyrolysis temperature. Compared to other biochars, this can be considered as low but can be related to the small contribution of ash to all samples. On the other hand, the low ash contents cannot explain the behavior of the fine feedstock. Here, one has to bear in mind that organic acid or organic material that dissolves in water can dissociate to form ions. In the finely grained feedstock and its respective biochar produced at 200 °C, soluble organic components are likely to have been released from the feedstock powder into the aqueous solution during sample preparation for the measurement of pH and EC. However, heating the sample above 200 °C seems to destroy those labile compounds and as a consequence, they can no longer contribute to the EC of the charred material. Such a scenario can also explain the big difference in the EC of the finely and coarsely grained feedstock, since the almost undestroyed physical structure of the endocarps prevents an efficient release of such soluble organic matter. As a consequence, the measured EC of those samples is representative of the concentration of the salts that could be dissolved in the water solution used for the determination of EC. Note that only a small concentration of exchangeable sodium (Na
ex) was revealed for all samples derived from the finely grained feedstock (
Table 7). This allows for the assumption that the Na surplus will not be a problem in growing media to which this material has been added.
A further major factor which affects plant growth is the availability of nitrogen and phosphate. As our biochars derive from a woody feedstock with a very low N content, the addition of
Acrocomia biochar to planting substrates will not provide sufficient N for healthy plant growth. On the other hand, Olsen P increased to 81 ± 6 mg kg
−1 and is in the range of optimal values for growing tomato plants outdoors in mineral soils (60 to 70 mg kg
−1) [
50]. For growing tomato in peat substrates, optimal Olsen P concentrations of 2 ppm are reported [
55].
The content of total P (P
t) in the final biochar depends on the content of P
t in the feedstock and on the content of the metals that could stabilize it by forming complexes [
56]. Uchimiya and Hiradate [
57] found correlations between the total inorganic P and K, Fe, Ca and Mg. Note that calcium can hinder the release of P since they form hydroapatite, whereas P complexed with iron and aluminum can be easily released [
56].
For our samples, P
t shows a relative enrichment after pyrolysis which is in line with previous publications [
9,
19,
27]. This can be related to the concomitant losses of carbon (C), nitrogen (N) and hydrogen (H) observed during the heat treatment (
Table 2) and by heat-induced immobilization reactions leading to its relative accumulation. However, at temperatures > 600 °C, P can be gasified. The underlying mechanisms explaining this immobilization of P during pyrolysis, however, are not yet completely understood. Complexation of P with Al, Ca and Fe has been observed and suggested to play a key role [
13,
20,
30]. Note that the solubility of P in soils or plant growing substrates depends on the pH and has its maximum in the near neutral pH region which coincide with the lowest degree of P fixation by Ca, Al and Fe minerals [
58]. However, in our experiment the relative contribution of Olsen P to P
t in the biochars increased with an increasing pyrolysis temperature. Possibly, their low Ca contents lowered the efficiency of P fixation.
In this context, it is also worth mentioning that in recent pot experiments with biochar-amended soils, it was demonstrated that P immobilized during pyrolysis is partially remobilized during plant growth [
59].
Having a closer look at the contents of micronutrients, the biochar from the endocarp of
A. aculeata is below the optimum values identified for growing tomatoes [
50] and values commonly recommended for nutrient solution for hydroponic cultures. As a consequence, they have to be added if the biochars are used as a planting substrate or provided with the nutrient solution if they are applied in hydroponic soilless horticulture.


