Article

Effects of Hydrogen Peroxide Products on Basil, Lettuce, and Algae in an Ebb and Flow Hydroponic System

1
Department of Horticulture & L.A., Oklahoma State University, Stillwater, OK 74078, USA
2
Department of Statistics, Oklahoma State University, Stillwater, OK 74078, USA
3
West Florida Research and Education Center, Department of Agronomy, University of Florida, Jay, FL 32565, USA
*
Author to whom correspondence should be addressed.
Horticulturae 2022, 8(7), 569; https://doi.org/10.3390/horticulturae8070569
Submission received: 12 May 2022 / Revised: 17 June 2022 / Accepted: 20 June 2022 / Published: 22 June 2022
(This article belongs to the Special Issue Indoor Farming and Artificial Cultivation)

Abstract

:
Hydrogen peroxide has been used as a sanitation agent for many years. Recently, hydrogen peroxide products have been used to remove algae from irrigation lines and sanitize hydroponic systems between uses. However, hydrogen peroxide can have phytotoxic effects on plants at high concentrations. The goal of this research was to determine if hydrogen peroxide treatments affected plant and algae growth in the ebb and flow hydroponic systems. The research was conducted at the Department of Horticulture and Landscape Architecture greenhouses in Stillwater, OK. Two cultivars of lettuce, ‘Green Forest’ and ‘Tropicana’, and two cultivars of basil, ‘Aroma II’ and ‘Genovese’, were transplanted into the ebb and flow hydroponic systems, and three different hydrogen peroxide products, PERpose Plus, ZeroTol, and 3% hydrogen peroxide, were applied at different rates and combinations in two experiments. Shoot fresh weight in lettuce was found to be significantly greater in control and 3% hydrogen peroxide treatments for both cultivars; however, in ‘Tropicana’ those treatments were not different from any other treatment. Greater amounts of PERpose Plus and ZeroTol, such as 60 mL, restricted plant growth in lettuce, whereas only cultivar differences for SPAD and plant width were reported for basil. Algae growth was not significantly controlled by any treatment in this research based on algae counts, weights, or spectrometer readings. However, algae species quantification did show that Microspora tumidula was found in the greatest concentrations in control, with a 96.0%, 99.2%, 94.0%, and 97.9% reduction in the 15 mL ZeroTol, 60 mL ZeroTol, 15 mL PERpose Plus, and 3% hydrogen peroxide treatments, respectively. Other algae genera identified included Scenedesmus, Chlamydomonas, Gloeocystis, Tetraspora, Leptolyngbya, Pennate diatoms, and Centric diatoms.

1. Introduction

Hydroponics uses a nutrient solution mixed with water to grow plants. Soilless agriculture reduces the time between plantings, with no need for fallowing or crop rotation, as well as allows for more control over more variables, such as nutrient levels, temperature, and more, while producing crops faster and with a greater yield than soil-based systems because of easier oxygen and water access for the crop’s roots [1]. Many iterations of this system have been developed, from soilless media hydroponics such as Dutch bucket to flooding of the root zone, such as in the ebb and flow technique. Despite the iterations and the precautions taken, some problems have existed since the beginning. One such problem is the universal existence of algae in freshwater sources.
Algae are photosynthetic organisms that generally live in aquatic habitats and can be unicellular or multicellular [2]. Most freshwater algae are unicellular and form colonies, or mats, on any surfaces in or on top of the water [3]. These microorganisms are capable of capturing nutrients from wastewater, atmospheric carbon dioxide (CO2), or industrial flue gas, in addition to their natural photosynthetic processes that use sunlight [4]. As algae are common in most, if not all, freshwater supplies, it is no surprise that algae have made their way into the agricultural sector via irrigation lines, pumps, and hydroponic systems. While some research has suggested that cocultivation of microalgae with crops in hydroponics can be beneficial to increasing crop biomass and releasing growth-promoting substances, these studies have predominately used two main microalgal species: Chlorella spp. and Scenedesmus spp. [4,5]. Because of the lack of study, it is difficult to say whether the full range of native microalgae may not contribute to hydroponic systems in this manner [4]. On the other hand, uncontrolled algae growth can cause several issues such as clogging lines and pumps, attracting pests such as shore flies and fungus gnats, and decreasing dissolved oxygen (DO) from mass die-offs, as well as causing organic loading [3,4,6]. In hydroponic systems, algae tend to collect around the edges of rafts and in tanks, which can lead to competition with the crop, producing a lower yield [3].
Several methods exist for eliminating or preventing algae. Some of the most popular methods include covering tanks in black plastic or covering root zones in black and white plastic mulching, which can be more expensive because of high labor needs, and the application of barley straw, which can often be unreliable because of the degradation rate [2,7]. More recently, other means of preventing or eliminating algae have been tested, such as using UV light to disrupt the integrity of algae cell membranes, as well as to degrade any organic material released by the algae, and various chemicals used to prevent or manage algae growth [8]. Free chlorine and 3-(3-indolyl) butanoic acid were discovered to have some algicidal effects, especially when used in tandem with UV, while being relatively nonphytotoxic to the crop itself [9,10]. Hydrogen peroxide is often one of the more popular choices, especially early in the process of investigating the best chemical means to prevent algae [11,12]. Known for its abilities as a sterilizing agent, hydrogen peroxide has been shown to prevent or contain algal growth in various hydroponic environments [13,14]. Hydrogen peroxide has been shown to cause limited degradation of intracellular materials when used alone, as well as having oxidative properties. This allows hydrogen peroxide to be useful in curbing algal growth while maintaining a low phytotoxic effect on the crops within the system [13,14,15]. There is a slight downside to hydrogen peroxide, which is high phytotoxicity in seedlings.
As environmental runoff is a concern, hydrogen peroxide degrades rapidly into two byproducts: oxygen and water [16,17]. Both byproducts are relatively harmless in the environment and may even increase the DO content in the remaining water [18,19]. Internally in the plant, hydrogen peroxide exists as a signaling molecule for abiotic stresses and is thought to protect organelle membranes and increase the stress resistance [20,21,22]. As an algicide, hydrogen peroxide can decrease metabolic processes, destroy pigment synthesis and membrane integrity, inhibit photosynthetic activity and genes expression, alter circadian rhythms, and induce apoptotic-like cell death while limiting growth; however, the efficacy of hydrogen peroxide is dependent on culture density, and how protected the pigments are inside of the chloroplasts [11,23,24]. While hydrogen peroxide is often combined with UV in irrigation lines to prevent algae build up, the chemical can also cause phytotoxic effects in seedlings [13,14,25,26]. While hardier seedlings often can recover, more delicate seedlings, such as lettuce (Lactuca sativa L.), are more prone to have a lower fresh weight and biomass than seedlings that were not treated with hydrogen peroxide [13]. Therefore, application time and dose, which are not universal but specific to each application, dependent on plant species [27].
Lettuce and basil (Ocimum basilicum L.) are common crops that are grown hydroponically; however, these two crops have different preferred climates and requirements [28,29,30]. Nevertheless, as herbs and leafy greens are generally desired throughout the year, it is important to be able to feasibly produce a quality crop while reducing labor and maintenance costs and preventing the reduction in crop quality due to algae accumulation. Thus, the main objective of this research was to establish efficient rates of hydrogen peroxide products that would adequately control or limit the algae population while not inhibiting plant growth and crop yield of lettuce and basil.

2. Materials and Methods

Experiment one was conducted at the Oklahoma State University Department of Horticulture and Landscape Architecture research greenhouses in Stillwater, Oklahoma. The greenhouses are the A-frame style with a polycarbonate roof. Average air temperatures for each run were 28.38 °C, with greenhouse set points at 21 °C/18 °C as the average day/night temperature. The average humidity was 55.89%. Daily light integral (DLI) averaged to be 19.3 mol m−2 d−1. Seeds of two cultivars of lettuce, ‘Green Forest’ and ‘Tropicana’, and two cultivars of basil, ‘Aroma II’ and ‘Genovese’, were obtained from Johnny’s Selected Seeds (Winslow, MN, USA) and planted in Horticubes Grow Cubes (Smithers Oasis, Kent, OH, USA) and placed under misters for 4 weeks on 9 July 2021. Seedlings in the cubes were transplanted to an ebb and flow table (Gro Master, Maple Park (Virgil), IL, USA) on 6 August 2021. A Styrofoam sheet was used as a float with 5 cm holes drilled approximately 22 cm apart. A 5 cm net pot (HydroFarm, Petaluma, CA, USA) was placed in each slot, and a single plant was placed in the net pot. The 40 gal tanks were filled with tap water, and 147.41 g of Jack’s 5-12-26 (J.R. Peters, Allentown, PA, USA), along with 97.52 g of calcium nitrate (American Plant Products, Oklahoma City, OK, USA) was added initially according to the recommended rates. The pH and electrical conductivity (EC) of the solution were checked every other day to maintain the pH between 5.5 to 6.5 and the EC at 1.5 to 2.5 mS cm−1. Treatments applied included: ZeroTol (Biosafe Systems, East Hartford, CT, USA; 27.1% hydrogen peroxide and 2.0% peroxyacetic acid) at 45 mL, ZeroTol at 45 mL with 50 mL of 3% hydrogen peroxide, ZeroTol at 60 mL, ZeroTol at 60 mL with 50 mL of 3% hydrogen peroxide (Great Value 3%, Wal-Mart, Bentonville, AR, USA), and 50 mL of 3% hydrogen peroxide, as well as a control. ZeroTol was first applied 3 d after transplanting and was repeated weekly. Hydrogen peroxide was applied 7 d after transplanting and was repeated weekly. All applications were made to the water tank. DO was measured daily using a DO meter (Milwaukee Instruments, Rocky Mount, NC, USA) after any chemical addition.
Experiment two was conducted at the same Oklahoma State University Department of Horticulture and Landscape Architecture Research greenhouses in Stillwater, Oklahoma, and was carried out in the same manner as experiment one, apart from the seeds being planted on 28 March 2021, as well as on 7 May 2021, and transplanted on 26 April 2021, and repeated on 4 June 2021. Day temperature averaged 23.01 °C and 27.07 °C per rep, respectively, while humidity averaged 55.89% and 71.97% per repetition. Daily light intensity averaged 20.8 and 19.34 mol m−2 d−1 DLI per repetition. There were 10 treatments applied: ZeroTol (Biosafe Systems, East Hartford, CT, USA) at 15, 30, 45, and 60 mL once weekly; PERpose Plus (Bioworks, Victor, NY; 33.0% hydrogen peroxide) at 15, 30, 45, and 60 mL once weekly, 3% hydrogen peroxide (Great Value 3%, Walmart, Bentonville, AR, USA) at 70 mL weekly, and control with two replications. The first application occurred 3 d after transplanting and was repeated every 7 d for the duration of 4 weeks. Data collection, algae quantification, experimental design, and statistics were all carried out in the same manner as in experiment one.
A chlorophyll meter (SPAD-502, Konica Minolta, Japan) was used 30 d after transplanting. SPAD readings were taken from each plant from the middle of the top and bottom leaf and were averaged to determine the chlorophyll concentration. Plant height, width, shoot fresh weight (FW), and leaf count were assessed 30 d after transplanting. Shoots and roots were dried at 59 °C for 2 d to obtain dry weight (DW).
After harvesting plants, 300 mL of solution was collected from each table and given to EnviroScience Lab (Stowe, OH, USA) for quantitative algae analysis. The lab followed the USGS NAWQA procedures for Phytoplankton using the Utermohl method [31,32]. A visual scale of 1 to 3 was used to grade the algae in hydroponic tanks at the end of the experiments, with 1 being little to no algae, 2 being a moderate number of algae on the sides and bottom of the tank, and 3 being large mats of algae (Figure 1). The total suspended solids method was used to measure the dry weight of algae. A 300 mL solution was collected per table and thoroughly mixed by shaking each bottle before vacuum filtering it through a filter paper of known weight. The suspended algae in the filter paper were then oven dried for 24 h at 53.9 °C. The dry weight of algae along with the filter paper was measured, and the dry weight of algae (mg L−1) was calculated using the following formula from Michaud [33].
Algae dry weight = [(filter weight + dried residue (mg))−filter weight (mg)) × 1000]/[volume used (mL)]
A hemocytometer (Hausser Scientific, Horsham, PA, USA) was used to count the number of algae cells. A 100 µL of water sample was collected from each table, and 100 µL of trypan blue dye was added to make the solution for the slide. Then 1 µL of the homogenous solution was added to the hemocytometer slide. The slide was examined under a compound microscope (Olympus, Waltham, MA, USA) at 40×, and the average number of viable algae cells was counted. The average cell count was multiplied by 10,000X the dilution factor (2) to calculate the algae concentration (viable cells/mL) according to LeGresley and McDermott [34]. A water sample from each treatment was collected to measure the chlorophyll-a of algae through spectrophotometry. The spectrophotometer (GENESYS 30, The Lab Depot, Dawsonville, GA, USA) was used to measure the absorbance of the samples at 750 nm, 665 nm, 647 nm, and 630 nm, according to Kumar and Saramma [35].
In both experiments, 10 plants per cultivar per species were treated as subsamples and were randomly planted in tables. Subsamples were averaged. Treatments were arranged as a split-plot in a randomized complete block design with two replications of each experiment. Experiment one was replicated within a run with one table per treatment for a total of 12 tables, while experiment two was replicated over time, again with one table per treatment for a total of 10 tables per run and 40 plants per table. Treatment was the whole main plot, with 6 factors in the first experiment and 10 factors in the second experiment, and cultivar was the subplot with two factors. Statistical analysis was performed using SAS/STAT software (Version 9.4; SAS Institute, Cary, NC, USA). Tests of significance were reported at the 0.05, 0.01, and 0.001 levels. The data were analyzed using generalized linear mixed models methods. Tukey multiple comparison methods were used to separate the means, which are reported as least square means.

3. Results

3.1. Hydrogen Peroxide and Cultivar Effects on Plant Growth Parameters and Chlorophyll Content

In experiment one, there were significant interactions between cultivar × chemical treatment for shoot FW of lettuce (Table 1).
Application of 3% hydrogen peroxide at 50 mL in ‘Green Forest’ resulted in the greatest amount of shoot FW but was not significantly different from the control; however, both were greater than all other treatments. For ‘Tropicana’, the control had the greatest shoot FW but was not different from any other treatment. Although not significantly different, in general, greater ZeroTol and ZeroTol plus 3% hydrogen peroxide treatments resulted in lower shoot FW (Table 2).
In experiment one, there were significant treatment effects and cultivar effects in lettuce. Treatment effects were found in plant height, the number of leaves, shoot DW, and root DW in lettuce (Table 3). Lettuce plants were the tallest in control, though not different from the 3% hydrogen peroxide treatment. The 45 mL of ZeroTol and 50 mL of 3% hydrogen peroxide treatment plants were the shortest but were not different from the 60 mL of ZeroTol and the 60 mL of ZeroTol and 50 mL of 3% hydrogen peroxide (Table 3). The 3% hydrogen peroxide treatment had the greatest number of leaves but was not different from any other treatment except the 60 mL of ZeroTol. The control had the greatest shoot DW but was not different from any other treatment except the 60 mL of ZeroTol. Similarly, root DW was greatest in control but was not significantly different from any other treatment except the 45 mL of ZeroTol and 50 mL of 3% hydrogen peroxide treatment (Table 3). The cultivar effect was significant for parameters including SPAD index and plant height and width. There were significant cultivar effects in basil for experiment one as well. ‘Aroma II’ had the greatest SPAD value and was significantly different from ‘Genovese’ (Table 4).
In experiment two, there were significant treatment effects for shoot DW for both basil and lettuce (Table 5). In basil, 45 mL of ZeroTol had the greatest shoot DW but was not different from any other treatments except the 60 mL of PERpose Plus (Table 6). In lettuce, 15 mL of PERpose Plus had the greatest shoot DW but was only different from treatments of 60 mL of ZeroTol and 60 mL of PERpose Plus. Significant cultivar effects were observed for lettuce as ‘Green Forest’ plants were significantly taller and had a greater SPAD value than ‘Tropicana’ (Table 7).

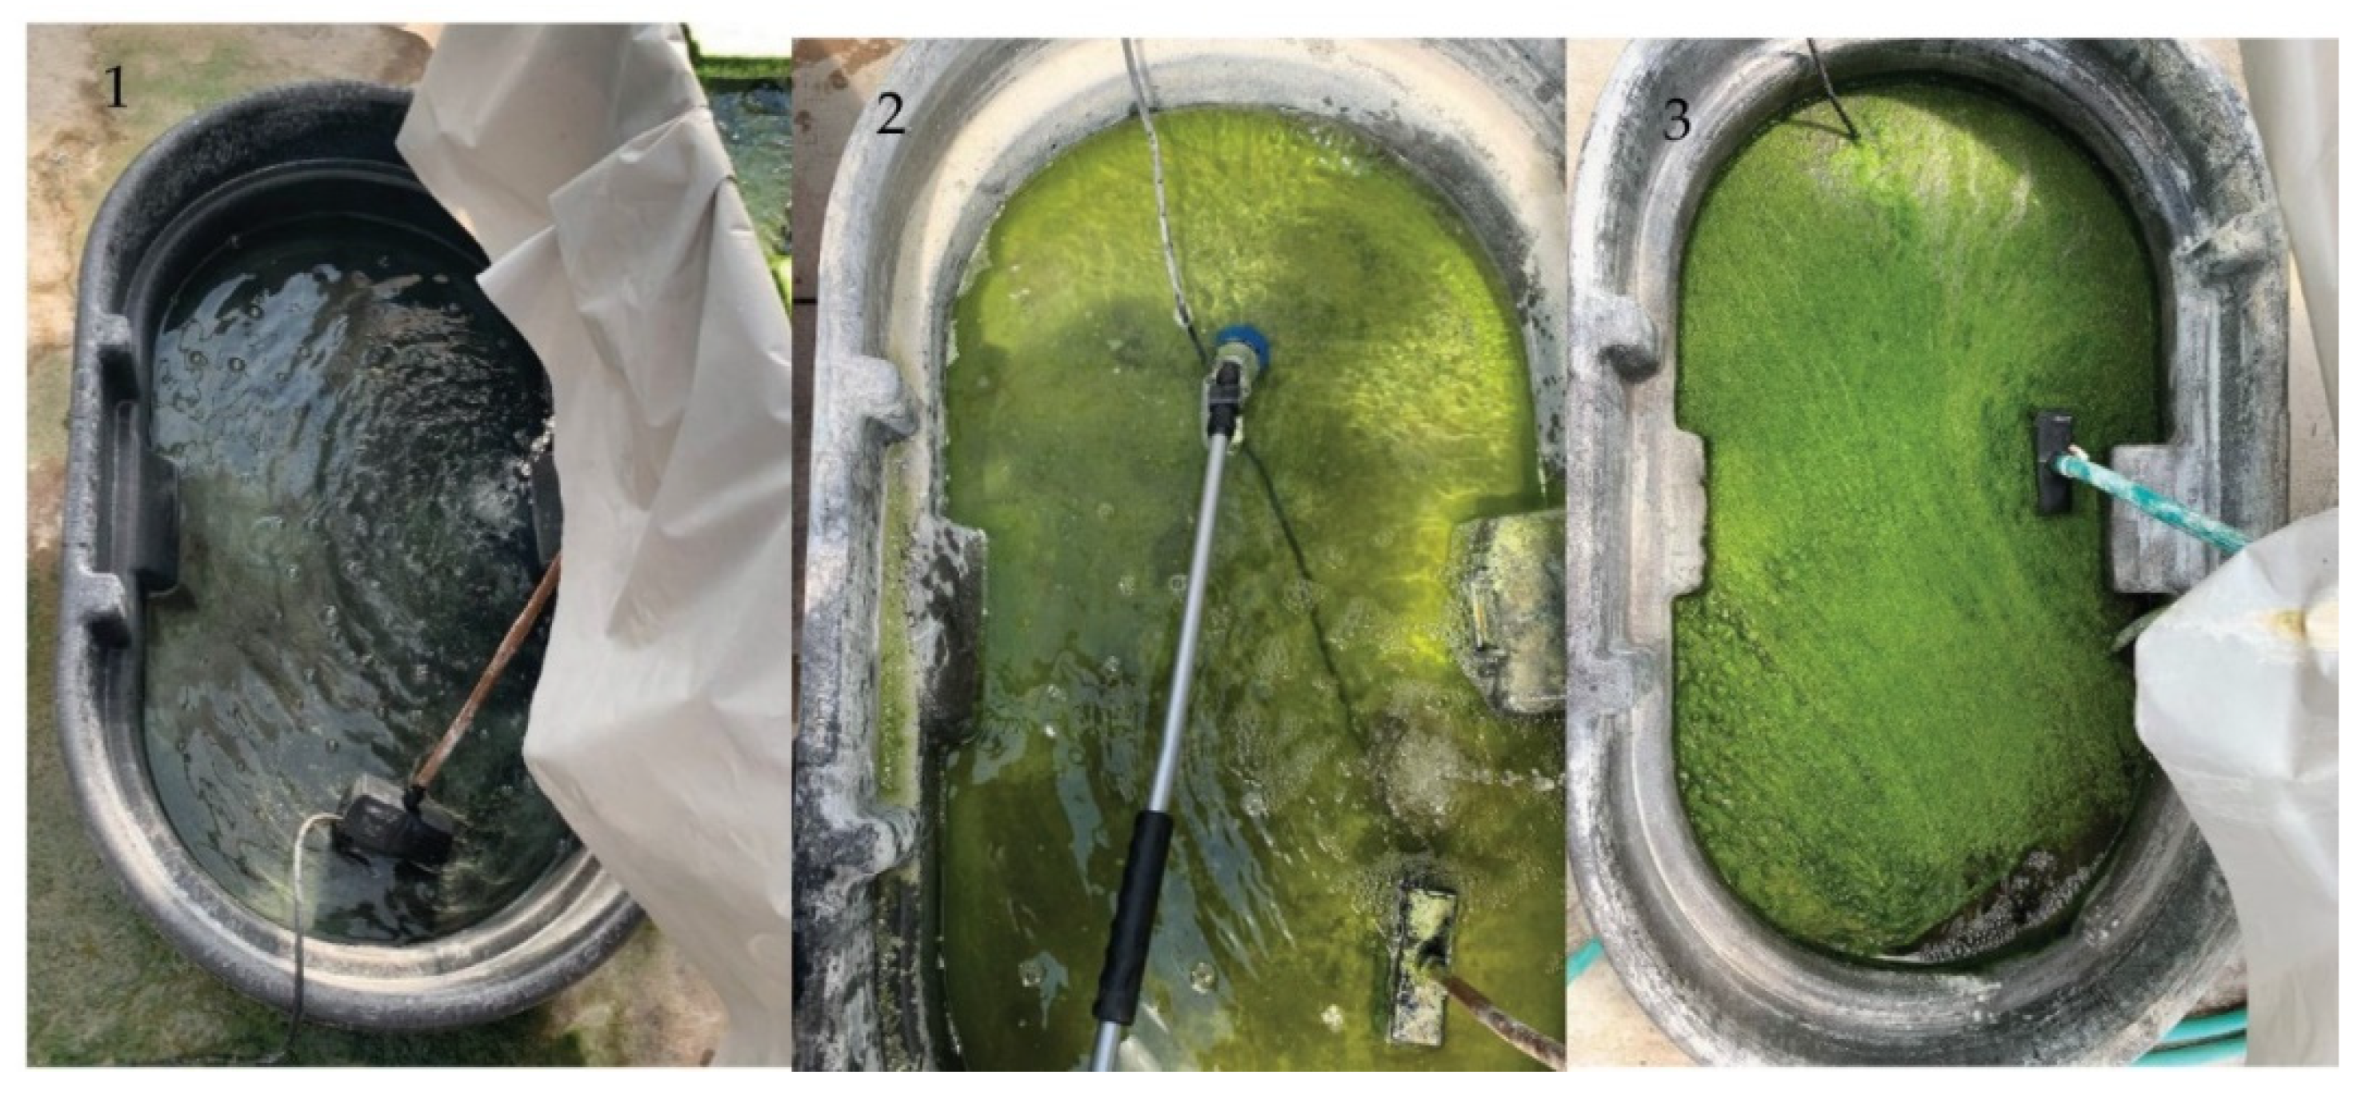
3.2. Hydrogen Peroxide Effects on Algae

In both experiments, there were no significant effects of hydrogen peroxide treatments on algae DW, cell number, or chlorophyll-a content (Table 3). However, the means of algae DW and algal cell counts were fewer in the presence of hydrogen peroxide products. However, visually, tanks that had been treated with greater concentrations of hydrogen peroxide, such as 60 mL of either PERpose Plus or ZeroTol, appeared to have fewer algae than tanks treated with lower concentrations, such as 15 to 45 mL of either PERpose Plus or ZeroTol, with the exception of 3% hydrogen peroxide, which appeared to cause algae matting on top of the surface of the water, and the control (Table 8).
There were some differences in algal species that inhabited different treatment tanks. Microspora tumidula was found in all treatment tanks at the greatest concentration except for the 60 mL of PERpose Plus, where Microspora was not present (Table 9). Microspora tumidula was found in greatest concentrations in the control, with a 96.0%, 99.2%, 94.0%, and 97.9% reduction in the 15 mL ZeroTol, 60 mL ZeroTol, 15 mL PERpose Plus, and 3% hydrogen peroxide treatments, respectively. Similarly, Gloeocystis vesiculosa was found to be dominant in all treatment tanks except for the control where Gloeocystis was not found and the ZeroTol 60 mL treatment where Gloeocystis was in low concentrations. Gloeocystis vesiculsosa was found to be highest in the ZeroTol treatment (15 mL), with a 99.2%, 66.7%, 83.6%, and 66.5% decrease in the 60 mL ZeroTol, 15 mL PERpose Plus, 60 mL PERpose Plus, and 3% hydrogen peroxide treatment, respectively. Chlamydomonas spp. was the only algae genus to be found in every treatment tank but was found to be at lower concentrations in the PERpose Plus 60 mL and ZeroTol 60 mL treatments, with a 99.9% and 96.5% reduction, respectively. The genus Scenedesmus was present in different species in all treatments except for ZeroTol 60 mL treatment and was found in the greatest concentration in the 15 mL ZeroTol treatment, with the greatest reduction in the control, 87.9%, and the 3% hydrogen peroxide treatment, 79.2%. Pennate diatoms were present in all treatments except ZeroTol 15 mL and PERpose Plus 15 mL treatments, with the greatest concentration in the 60 mL ZeroTol treatment, though there were 97.8%, 93.9%, and 97.4% reductions in the control, 60 mL PERpose Plus, and the 3% hydrogen peroxide treatment, respectively. Centric diatoms were similarly distributed in all treatments except the ZeroTol 15 mL treatment, with the greatest reduction of 97.7% in control. Leptolyngbya spp., Microspora pachyderma, Sphaerocystis planktonica, and Tetraspora cylindrica were found only in control, PERpose Plus 15 mL, PERpose Plus 60 mL, and 3% hydrogen peroxide, respectively. Overall, in the ZeroTol treatments, there was less diversity than in the other treatments (Table 9).

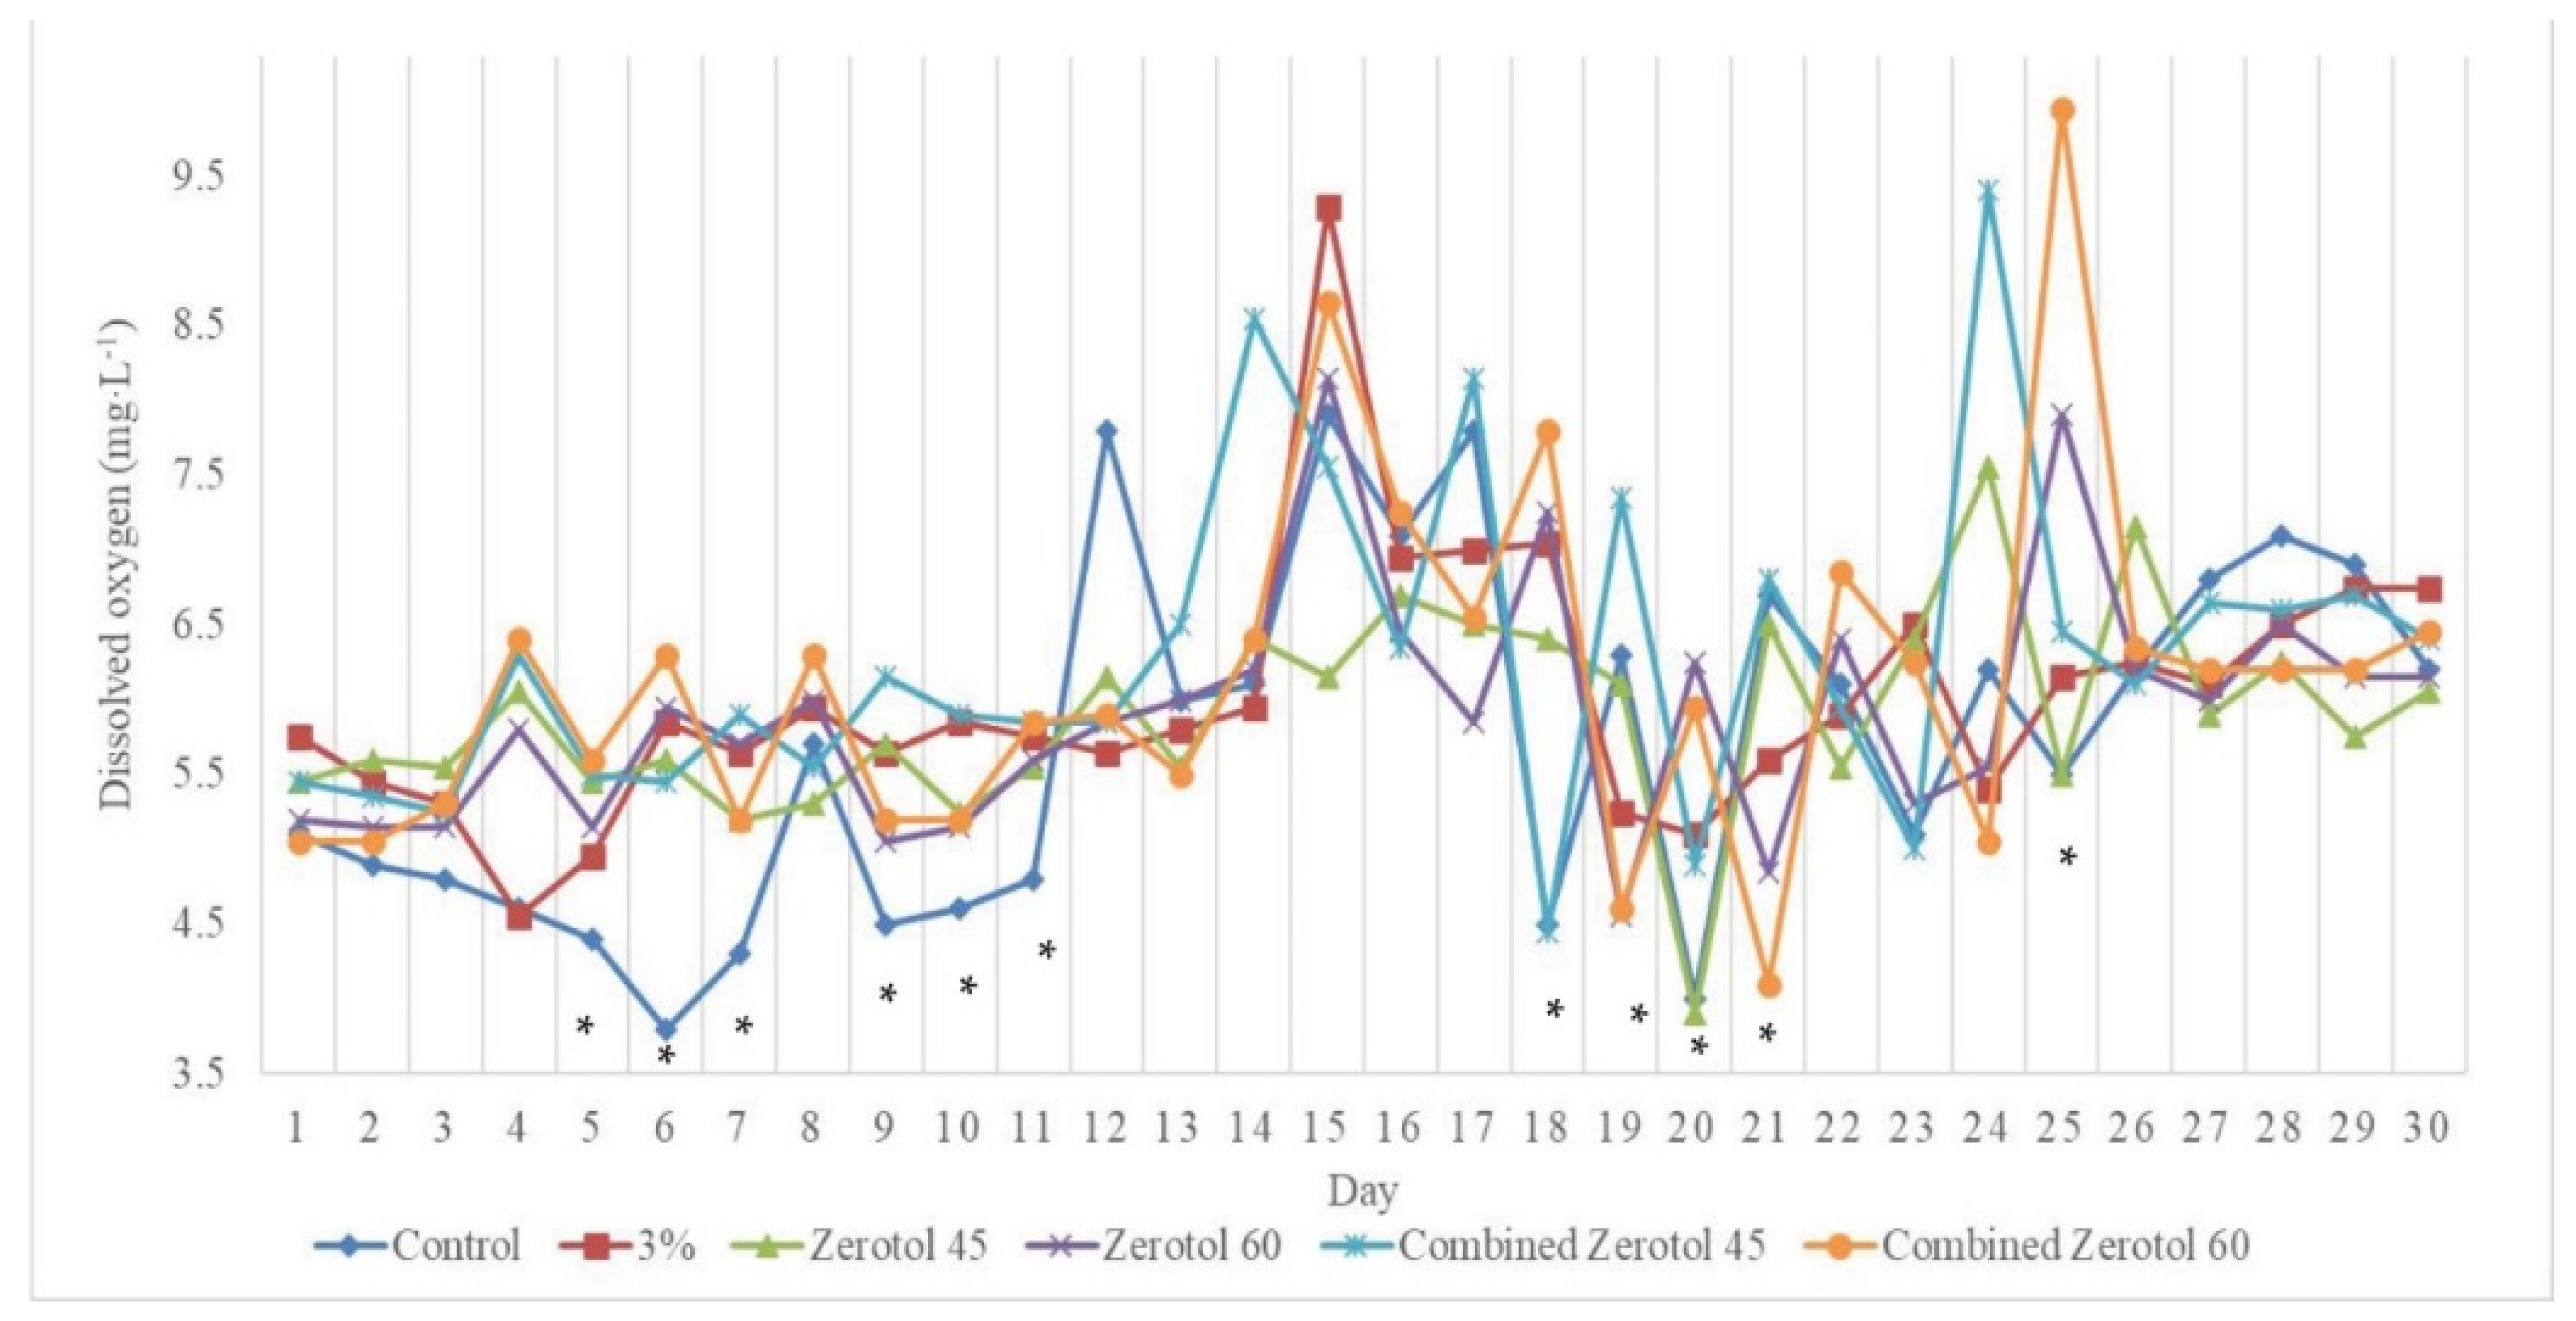
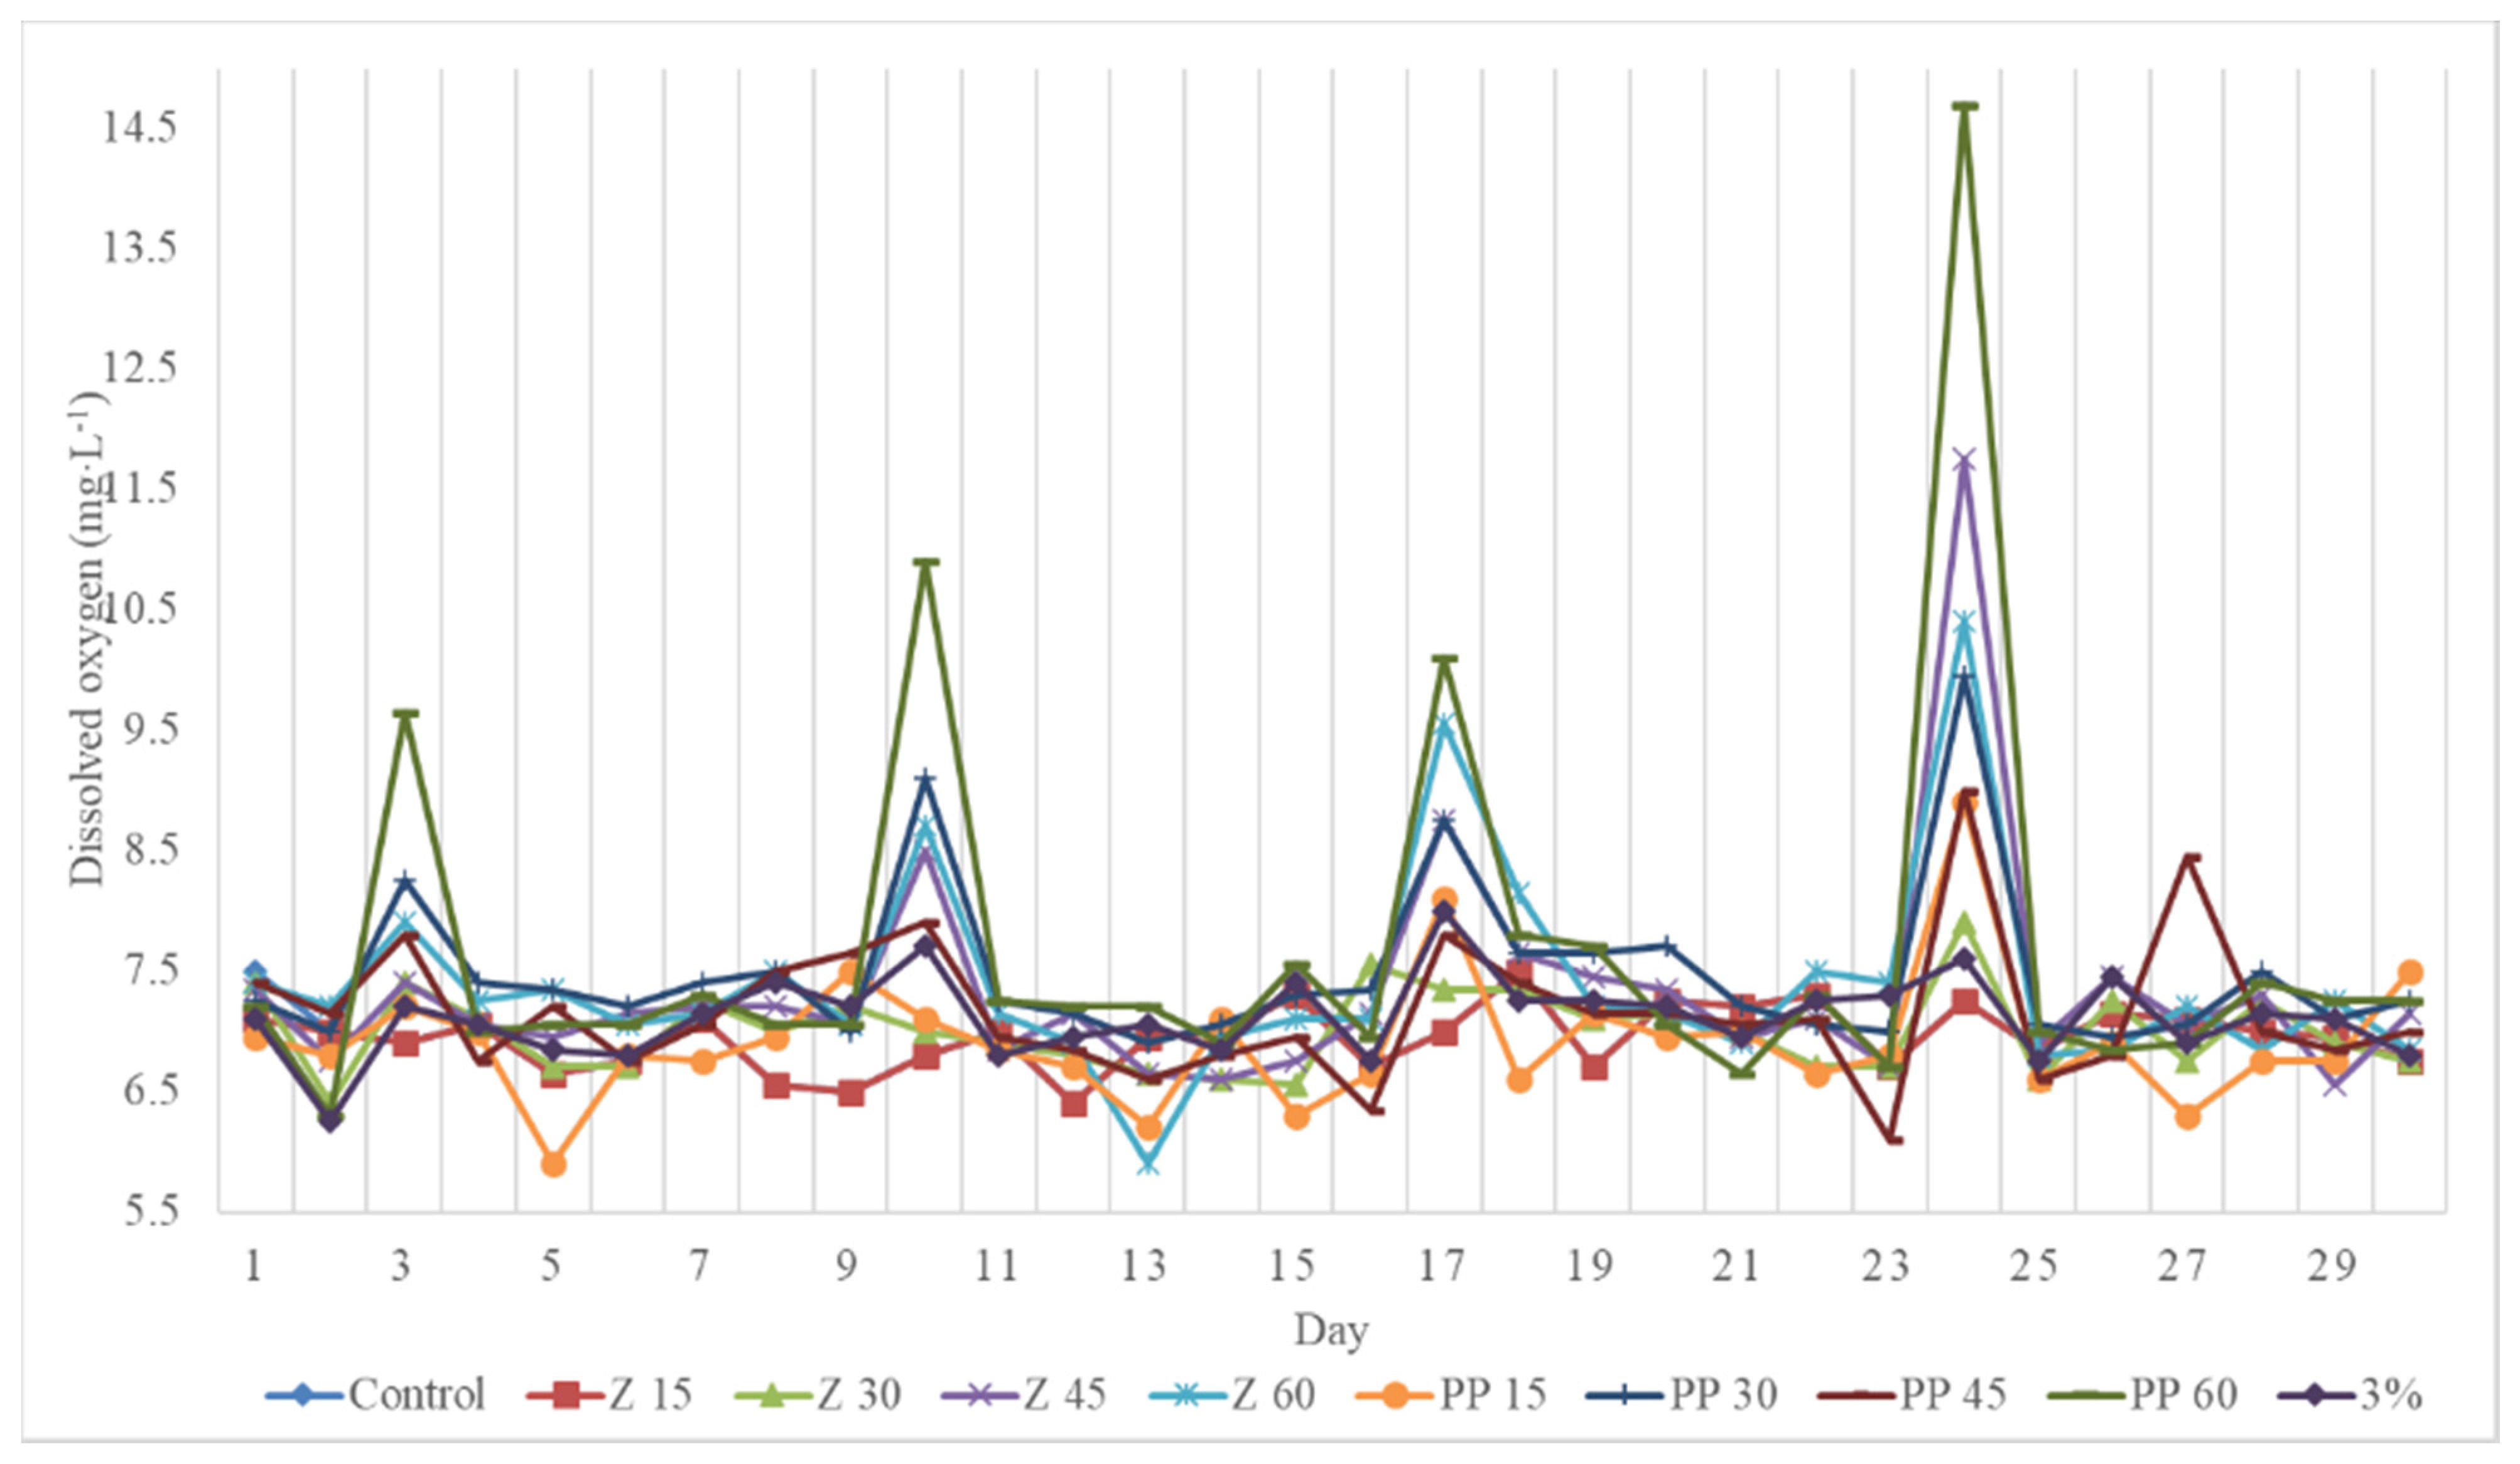
3.3. Effects of Hydrogen Peroxide on Dissolved Oxygen

In experiment one, hydrogen peroxide treatments significantly affected DO rates (Figure 2). The control had some of the lowest DO levels compared with the other treatments but was only significantly different from the 60 mL of ZeroTol and 50 mL of 3% hydrogen peroxide treatment on day 25. DO means below 5.05 mg L−1 were not significantly different from any other rates except the 60 mL of ZeroTol and 50 mL of 3% hydrogen peroxide treatment on day 25, which had a mean of 9.95 mg L−1 (Figure 2). Similar to experiment one, in experiment two, hydrogen peroxide treatments caused an increase in DO on treatment days (Figure 3). However, these treatments only caused a significant increase in DO on the day of application.

4. Discussion

4.1. Effects of Hydrogen Peroxide and Cultivar on Lettuce and Basil

Hydrogen peroxide and cultivars affected lettuce shoot FW in this research. Individually, cultivar can have a significant impact on shoot FW. Similar to this study, Lau and Mattson [36] found that 37.5 mg L−1 of 3% hydrogen peroxide, added in increments every 3 d to maintain concentration, produced a lettuce FW that was not different from the control, but the 75 mg L−1 produced lettuce with less FW than the control and 37.5 mg L−1 treatment due to indiscriminate damage of healthy tissue. In ‘Jessica’ and ‘Bolaria’ cucumber (Cucumis sativus L.) seedlings, hydrogen peroxide applications to limit algae caused a decrease in shoot weight, but the phytotoxic effects of the hydrogen peroxide treatments appeared to be dependent on temperature and amount of light affecting the speed at which hydrogen peroxide broke down [14]. Caixeta et al. [13] found that, in lettuce seedlings, hydrogen peroxide spray treatments to limit algae, fungus gnats, and shore flies on germinating seeds did not significantly affect the FW compared with the control but did affect germination rates. In contrast, Kučerová et al. [37] found that hydrogen peroxide increased lettuce cultivar ‘Král Máje I’ shoot weight slightly, but not significantly, from the control, which was thought to be due to plant tissue lignification. The concentration used and timing of application during the crop’s life cycle appears to have a great impact on the potential phytotoxicity of hydrogen peroxide applications. A combination of original cultivar shoot FW and high levels of hydrogen peroxide stress can lower shoot FW in lettuce, as seen in the current study where increased rates and concentrations of hydrogen peroxide lowered shoot FW significantly from the control in both ‘Green Forest’ and ‘Tropicana’.
In this research, greater amounts of hydrogen peroxide products tended to decrease plant growth, especially in plant height, the number of leaves, root DW in lettuce, and shoot DW in lettuce and basil. Symptoms associated with hydrogen peroxide toxicity include leaf scorching, reduced plant growth, and plant mortality [38]. Similar to our findings, Lau and Mattson [36] found that greater levels of hydrogen peroxide stunted root and shoot growth significantly more than the control and lower concentrations of hydrogen peroxide in lettuce. Thakulla et al. [39] found that lower amounts of hydrogen peroxide products applied weekly can help increase height, shoot DW and root DW, but greater concentrations applied weekly or biweekly decreased significantly in the biomass and height of tomatoes. Deng et al. [40] reported similar findings in sweet potato (Ipomoea batatas L.) seedlings with concentrations of less than or equal to 2.5 mM of exogenously applied hydrogen peroxide reported having positive effects on seedling growth and root formation, while treatments that exceeded 5 mM of hydrogen peroxide had the opposite effect. Similarly, in our study, low concentrations of 3% hydrogen peroxide and low doses of stronger peroxide products were less phytotoxic than greater concentrations of hydrogen peroxide.

4.2. Hydrogen Peroxide Effects on Algae

Hydrogen peroxide products often combine hydrogen peroxide with peracetic acid to provide stability and high reactivity on both inorganic and organic compounds [41]. Rates and timing of application have been found to be largely dependent on crop, algal species and density, water chemistry and environment, and specific system [19,42,43]. Rates as low as 12.3 mg L−1 hydrogen peroxide combined with 8 mg L−1 peracetic acid to control algae to 185 mg L−1 hydrogen peroxide plus 120 mg L−1 peracetic acid with 1 min contact time are recommended to control some pathogens [38]. Thakulla et al. [39] found that concentrations of 70 mL of ZeroTol or PERpose Plus applied biweekly to 40-gallon tanks significantly decreased algae concentrations. Because of its strong oxidizing abilities, hydrogen peroxide produces hydroxyl radicals under light exposure, which destroys proteins, lipids, and DNA, severely damaging unicellular organisms [44,45]. In algae specifically, hydrogen peroxide can decrease metabolic processes, destroy pigment synthesis and membrane integrity, inhibit photosynthetic activity and gene expression, alter circadian rhythms, and induce apoptotic-like cell death while limiting growth [11,24].
Hydrogen peroxide can cause antioxidant defense systems to activate in algae, allowing the microorganisms to survive oxidative stresses until a certain threshold [46]. In this research, rates of 15 to 70 mL of different hydrogen peroxide products (ZeroTol, PERpose Plus, and 3% hydrogen peroxide) were used; however, there were no significant effects on algae growth and density. Weenink et al. [47] found that high populations of green heterotrophic algae may rapidly degrade hydrogen peroxide applications, protecting the other populations of algae. Water composition, especially metal components, and UV exposure can impact the rates of hydrogen peroxide decomposition, and that elevated pH can influence the rapid decomposition rate of hydrogen peroxide and, therefore, its algicidal properties [11,48,49].
Sampling and analytical methods used in this work may have also caused discrepancies found between the visual grading and quantitative algae data. Marker and Bolas [50] found that no method can be precise due to variation in collection method, including biomass dry weight, counting algae cells, and chlorophyll-a extraction. Biomass dry weight is only able to measure all organic and inorganic mass found within the sample and attribute the entirety of that mass is algae [51]. This leads to other materials, such as root particles or insect eggs, being included in the total dry weight. Similarly, using a hemocytometer to count individual algae cells can be subjective and impractical [50]. Counting individual algae cells or colonies can be difficult because of the obscuration from other particles and the clustering of cells [52]. Misidentification of nonalgae particles is also common, leading to higher cell counts, and different species of algae can cause increased or decreased cell counts because of filamentation and clumping [50,53]. Proper dilution is required as well, which adds more uncertainty to quantification [52,53]. Measurements of chlorophyll-a can also be imprecise because of the different species of algae containing different concentrations of chlorophyll and their dependence on nutrient content and light exposure [51]. Furthermore, the solvent choice for extraction is important and can be highly variable [51]. Simon and Helliwell [54] found that mechanical disruption of algae cells was necessary to optimize pigment extraction and that methanol was a more efficient solvent than acetone as long as due care was taken with the process. Similarly, Schumann et al. [55] found that mechanical homogenization improved extraction up to 20%, but chlorophyll-a extraction efficiency was strongly species-specific and influenced by the growth conditions.
Thakulla et al. [39] reported similar algae species as those found in this study, with Chlamydomonas spp. found in all treatments, and Gleocystis vesiculosa found in greater concentrations in most treatments. Chlamydomonas spp. has been found in hydroponic systems frequently [10,43,56]. Scenedesmus spp. have been similarly prevalent, though Nonomura et al. reported that Scenedesmus species were rare in samples taken in Japan [4,10,43,55]. Microspora tumidula was not found to be common in reported literature, though it was one of the most common species of algae found in this research.

4.3. Effects of Hydrogen Peroxide on Dissolved Oxygen

Increases in DO were observed in relation to hydrogen peroxide treatments. Hydrogen peroxide decomposes into oxygen and water at different rates depending on environmental factors [41,57]. Tusseau-Vuillemin et al. [58] found that hydrogen peroxide could be used as a precursor to DO in place of aeration due to the increased transfer rate of oxygen to solution. Without the presence of active catalysts such as metals or UV light, hydrogen peroxide degrades slowly in water and will only contribute slightly to the dissolved oxygen content [59]. The presence of carbons can activate hydroxyl radicals that lead to either the degradation of hydrogen peroxide or oxidation of organic compounds in the water [60]. Similar to our study, Lau and Matton [36] found that DO was greatest after the application of hydrogen peroxide, and greater concentrations led to greater DO content. However, the United States Environmental Protection Agency [42] reported that, under aquatic aerobic nonsterile conditions, hydrogen peroxide had a half-life of 1.1 to 5.3 h, which could be accelerated by the presence of metals in the water or UV radiation such as sunlight. Soffer et al. [61] found that chrysanthemums (Chrysanthemum x morifolium L. ‘Bright Golden Anne’) and the weeping fig (Ficus benjamina L.) both grew faster in oxygen-saturated water. According to Ruso et al. [62], basil can persist with DO levels as low as 4 mg L−1, with optimal levels at 6.5 mg L−1. However, lettuce only needs a DO content of at least 1.6 mg L−1 [63]. Thus, increased DO did not equate to increased plant growth in this experiment due to the minimum requirements of each plant being met and the phytotoxic effects of greater hydrogen peroxide concentrations.

5. Conclusions

In this study, applications of hydrogen peroxide did not have significant effects on algae growth based on algae counts, weights, or spectrometer readings. There were, however, significant impacts on plant growth. Higher levels of hydrogen peroxide reduced plant growth, especially in lettuce, while lower concentrations of hydrogen peroxide were not toxic to the plants and the algae. Basil growth was relatively unaffected by hydrogen peroxide except at the greatest concentration of PERpose Plus. Most studies evaluate single species, but this research shows a potential limitation of growing both species together if using hydrogen peroxide to treat algae, as basil has a greater tolerance, as reported for the first time. Further research is needed to identify what rates of hydrogen peroxide products could successfully limit algae growth while remaining nontoxic to plants. Combination treatments may be the key to limiting algae while not affecting plant growth. Lower rates of hydrogen peroxide combined with UV light treatments may be effective in hydroponic systems, as it has been shown to be effective in irrigation systems.

Author Contributions

Conceptualization, B.L.D. and T.D.H.; methodology, T.D.H.; formal analysis, C.G.; resources, B.L.D.; data curation, T.D.H.; writing—original draft preparation, T.D.H.; writing—review and editing, B.L.D., B.H. and H.S.; supervision, B.L.D.; funding acquisition, B.L.D. All authors have read and agreed to the published version of the manuscript.”

Funding

This research was funded by the ODAFF Specialty Block grant program grant #20003129.

Institutional Review Board Statement

Not applicable.

Acknowledgments

We thank Stephen Stanphill for helping with system maintenance and greenhouse management.

Conflicts of Interest

The authors declare no conflict of interest.

References

  1. Shrestha, A.; Dunn, B. Hydroponics. Oklahoma Cooperative Extension Service 2016, HLA-6442. Available online: https://shareok.org/bitstream/handle/11244/50283/oksd_hla_6442_2010-03.pdf?sequence=1 (accessed on 21 June 2022).
  2. Camberato, D.M.; Lopez, R.G. Controlling Algae in Irrigation Ponds; Purdue University: West Lafayette, IN, USA, 2009; Available online: https://www.extension.purdue.edu/extmedia/ho/ho-247-w.pdf (accessed on 21 June 2022).
  3. Raudales, R. Algae on the nutrient solution and surfaces. E-Grow Edible Alert 2016, 1, 1–4. [Google Scholar]
  4. Supraja, K.V.; Behera, B.; Balasubramanian, P. Performance evaluation of hydroponic system for co-cultivation of microalgae and tomato plant. J. Clean. Prod. 2020, 272, 122823. [Google Scholar] [CrossRef]
  5. Huo, S.; Liu, J.; Addy, M.; Chen, P.; Necas, D.; Cheng, P.; Li, K.; Chai, H.; Liu, Y.; Ruan, R. The influence of microalgae on vegetable production and nutrient removal in greenhouse hydroponics. J. Clean. Prod. 2020, 243, 118563. [Google Scholar] [CrossRef]
  6. Varma, M.M.; DiGiano, F. Kinetics of oxygen uptake by dead algae. Wiley J. Water Pollut. Control Fed. 1968, 40, 613–626. [Google Scholar]
  7. Lembi, C.A. Identifying and Managing Aquatic Vegetation; Purdue University: West Lafayette, IN, USA, 2009; Available online: https://www.extension.purdue.edu/extmedia/APM/APM_3_W.pdf (accessed on 21 June 2022).
  8. Chen, Y.; Bai, F.; Li, Z.; Xie, P.; Wang, Z.; Feng, X.; Liu, Z.; Huang, L. UV-assisted chlorination of algae-laden water: Cell lysis and disinfection byproducts formation. Chem. Eng. J. 2020, 383, 123165. [Google Scholar] [CrossRef]
  9. Dannehl, D.; Schuch, I.; Gao, Y.; Cordiner, S.; Schmidt, U. Hypochlorite application for controlling algae biofilm formation, microorganisms and tomato production in recirculating systems. Gesunde Pflanz. 2015, 67, 191–199. [Google Scholar] [CrossRef]
  10. Nonomura, T.; Matsuda, Y.; Bingo, M.; Onishi, M.; Matsuda, K.; Harada, S.; Toyoda, H. Algicidal effect of 3-(3-indolyl)butanoic acid, a control agent of the bacterial wilt pathogen, Ralstonia solanacearum. Crop Prot. 2001, 20, 935–939. [Google Scholar] [CrossRef]
  11. Draäbkova, M.; Admiraal, W.; Marsalek, B. Combined exposure to hydrogen peroxide and light-selective effects on cyanobacteria, green algae and diatoms. Environ. Sci. Technol. 2007, 41, 309–314. [Google Scholar] [CrossRef]
  12. Kay, S.H.; Quimby, P.C.; Ouzts, J.D. H2O2: A potential algicide for aquaculture. In Proceedings of the 35th Annual Meeting of the Southern Weed Science Society, Atlanta, GA, USA, 19–21 January 1982; pp. 275–289. [Google Scholar]
  13. Caixeta, V.; Mata, A.; Curvelo, C.; Tavares, W.; Ferreira, L.; Pereira, A. Hydrogen peroxide for insect and algae control in a lettuce hydroponic environment. J. Agric. Sci. 2018, 10, 221. [Google Scholar] [CrossRef]
  14. Vänninen, I.; Koskula, H. Effect of hydrogen peroxide on algal growth, cucumber seedlings and the reproduction of shore flies (Scatella stagnalis) in rockwool. Crop Prot. 1998, 17, 547–553. [Google Scholar] [CrossRef]
  15. Ou, H.; Gao, N.; Deng, Y.; Wang, H.; Zhang, H. Inactivation and degradation of Microcystis aeruginosa by UV-C irradiation. Chemisphere 2011, 85, 1192–1198. [Google Scholar] [CrossRef] [PubMed]
  16. Qian, H.; Yu, S.; Sun, Z.; Xie, X.; Liu, W.; Fu, Z. Effects of copper sulfate, hydrogen peroxide and N-phenyl-2-naphthylamine on oxidative stress and the expression of genes involved photosynthesis and microcystin disposition in Microcystis aeruginosa. Aquat. Toxicol. 2010, 99, 405–412. [Google Scholar] [CrossRef] [PubMed]
  17. Tesoriero, L.; Jelinek, S.; Forsyth, L. On-Farm Hygiene and Sanitation for Greenhouse Horticulture; Prime Facts 1005. 2020. Available online: https://www.dpi.nsw.gov.au/__data/assets/pdf_file/0003/340284/On-farm-hygiene-and-sanitation-for-greenhouse-horticulture.pdf (accessed on 21 June 2022).
  18. Hernandez, J.C.; Tornos, P.; Cuervo, U.Y.; Furet, N.R.; Orihuela, D.L. Influence of hydrogen peroxide (H2O2) in the fruit of pepper (Capsicum annuum L.). In Proceedings of the 48th Annual Meeting of Caribbean Food Crops Society, Playa del Carmen, Mexico, 20–26 May 2012. [Google Scholar]
  19. Thakulla, D.; Dunn, B.; Hu, B.; Goad, C.; Maness, N. Nutrient solution temperature affects growth and °Brix parameters of seventeen lettuce cultivars grown in an NFT hydroponic system. Horticulturae 2021, 7, 321. [Google Scholar] [CrossRef]
  20. Mejía-Teniente, L.; Durán-Flores, B.; Torres-Pacheco, I.; González-Chavira, M.M. Hydrogen peroxide protects pepper (Capsicum annuum L.) against pepper golden mosaic geminivirus (PepGMV) infections. Physiol. Mol. Plant Pathol. 2019, 106, 23–29. [Google Scholar] [CrossRef]
  21. Niu, L.; Liao, W. Hydrogen peroxide signaling in plant development and abiotic responses: Crosstalk with nitric oxide and calcium. Front. Plant Sci. 2016, 7, 230. [Google Scholar] [CrossRef] [Green Version]
  22. Slesak, I.; Libik, M.; Karpinska, B.; Karpinski, S.; Miszalski, Z. The role of hydrogen peroxide in regulation of plant metabolism and cellular signaling in response to environmental stresses. Acta Biochim. Pol. 2007, 54, 39–50. [Google Scholar] [CrossRef]
  23. Barroin, G.; Feuillade, M. Hydrogen peroxide as a potential algaecide for Oscillatoria rubescens D.C. Water Res. 1986, 20, 619–623. [Google Scholar] [CrossRef]
  24. Zhou, Q.; Li, L.; Huang, L.; Guo, L.; Song, L. Combining hydrogen peroxide with sunlight regulation to control algal blooms. Environ. Sci. Pollut. Res. 2018, 25, 2239–2247. [Google Scholar] [CrossRef]
  25. Sarathy, S.; Mohseni, M. Effects of UV/H2O2 advanced oxidation on chemical characteristics and chlorine reactivity of surface water natural organic matter. Water Res. 2010, 44, 4087–4096. [Google Scholar] [CrossRef]
  26. Wan, Y.; Xie, P.; Wang, Z.; Ding, J.; Wang, J.; Wang, S.; Wiesnec, M.R. Comparative study on the pretreatment of algae-laden water by UV/persulfate, UV/chlorine, and UV/H2O2: Variation of characteristics and alleviation of ultrafiltration membrane fouling. Water Res. 2019, 158, 213–226. [Google Scholar] [CrossRef]
  27. Coosemans, J. Control of algae in hydroponic systems. Acta Hortic. 1995, 382, 263–268. [Google Scholar] [CrossRef]
  28. Currey, C.J. Managing Basil Production throughout the Year. Produce Grower. 2020. Available online: https://www.producegrower.com/article/hydroponic-production-primer-managing-basil-production-throughout-the-year (accessed on 21 June 2022).
  29. Saha, S.; Monroe, A.; Day, M.R. Growth, yield, plant quality and nutrition of basil (Ocimum basilicum L.) under soilless agricultural systems. Ann. Agric. Sci. 2016, 61, 181–186. [Google Scholar] [CrossRef]
  30. University of Illinois. Lettuce. In Watch Your Garden Grow; University of Illinois: Champaign, IL, USA, 2022; Available online: https://web.extension.illinois.edu/veggies/lettuce.cfm (accessed on 21 June 2022).
  31. Edler, L.; Elbrachter, M. The Utermohl Method for Quantitative Phytoplankton Analysis; Intergovernmental Oceanographic Commission of UNESCO: Paris, France, 2010. [Google Scholar]
  32. Charles, D.F.; Knowles, C.; Davis, R.S. Protocols for the Analysis of Algal Samples Collected As Part of the U.S. Geological Survey National Water-Quality Assessment Program; Report No. 02-06; The Academy of Natural Sciences: Philadelphia, PA, USA, 2002. [Google Scholar]
  33. Michaud, J.P. Measuring total suspended solids and turbidity in lakes and streams. In A Citizen’s Guide to Understanding and Monitoring Lakes and Streams; Washington State Dept. of Ecology, Publications Office: Olympia, WA, USA, 1994. [Google Scholar]
  34. LeGresley, M.; McDermott, G. Counting Chamber Methods for Quantitative Phytoplankton Analysis—Haemocytometer, Palmer-Maloney Cell and Sedgewick-Rafter Cell; IOC Manuals and Guides; UNESCO: Paris, France, 2020; pp. 25–30. [Google Scholar]
  35. Kumar, S.S.; Saramma, A.V. A revised method for pigment extraction from marine nannoplanktonic algal cultures. J. Algal Biomass Util. 2013, 4, 47–52. [Google Scholar]
  36. Lau, V.; Mattson, N. Effects of hydrogen peroxide on organically fertilized hydroponic lettuce (Lactuca sativa L.). Horticulturae 2021, 7, 106. [Google Scholar] [CrossRef]
  37. Kučerová, K.; Henselová, M.; Slováková, L.; Bačovčinová, M.; Hensel, K. Effect of plasma activated water, hydrogen peroxide, and nitrates on lettuce growth and its physiological parameters. Appl. Sci. 2021, 11, 1985. [Google Scholar] [CrossRef]
  38. Raudales, R.E.; Parke, J.L.; Guy, C.L.; Fisher, P.R. Control of waterborne microbes in irrigation: A review. Agric. Water Manag. 2014, 143, 9–28. [Google Scholar] [CrossRef]
  39. Thakulla, D.; Dunn, B.; Hu, B.; Goad, C. Timing and rates of two products using hydrogen peroxide (H2O2) to control algae in ebb and flow hydroponic systems. HortScience 2022, 57, 32–39. [Google Scholar] [CrossRef]
  40. Deng, X.; Cheng, Y.; Wu, X.; Kwak, S.; Chen, W.; Eneji, A.E. Exogenous hydrogen peroxide positively influences root growth and exogenous hydrogen peroxide positively influences root growth and metabolism in leaves of sweet potato seedlings. Aust. J. Crop Sci. 2012, 6, 1572–1578. [Google Scholar]
  41. Popescu, E.M.; Pantea, O.; Gologan, D.; Doukeh, R. Hydrogen peroxide and peracetic acid oxidizing potential in the treatment of water. Rev. Chim. 2019, 70, 2036–2039. [Google Scholar] [CrossRef]
  42. Breithaupt, J. Summary Review of Available Literature for Hydrogen Peroxide and Peroxyacetic Acid for New Use to Treat Wastewater; U.S. Environmental Protection Agency: Washington, DC, USA, 2007; pp. 1–35.
  43. Schwarz, D.; Krienitz, L. Do algae cause growth-promoting effects on vegetables grown hydroponically? In Proceedings of the IPI–NATESC-CAU-CAAS International Symposium on Fertirrigation, Beijing, China, 20–24 September 2005. [Google Scholar]
  44. Southard, G.M. Chapter 7: Use of hydrogen peroxide as an algaecide for Prymnesium parvum. In Management of Prymnesium Parvum at Texas State Fish Hatcheries; Texas Parks and Wildlife Department: Austin, TX, USA, 2005. [Google Scholar]
  45. Yang, T.; Kim, H. Characterizing nutrient composition and concentration in tomato-, basil-, and lettuce-based aquaponic and hydroponic systems. Water 2020, 12, 1259. [Google Scholar] [CrossRef]
  46. Liu, M.; Shi, X.; Chen, C.; Yu, L.; Sun, C. Responses of Microcystis colonies of different sizes to hydrogen peroxide stress. Toxins 2017, 9, 306. [Google Scholar] [CrossRef] [PubMed] [Green Version]
  47. Weenink, E.F.J.; Matthijs, H.C.P.; Schuurmans, J.M.; Piel, T.; van Herk, M.J.; Sigon, C.A.M.; Visser, P.M.; Huisman, J. Interspecific protection against oxidative stress: Green algae protect harmful cyanobacteria against hydrogen peroxide. Environ. Microbiol. 2021, 23, 2404–2419. [Google Scholar] [CrossRef] [PubMed]
  48. Huang, J.; Ghaly, M.; Hobson, P.; Chow, C.W.K. Innovative method of utilizing hydrogen peroxide for source water management of cyanobacteria. Environ. Sci. Pollut. Res. 2021, 29, 22651–22660. [Google Scholar] [CrossRef] [PubMed]
  49. Raffellini, S.; Guerrero, S.; Alzamora, S.M. Effect of hydrogen peroxide concentration and pH on inactivation of kinetics of Escherichia coli. J. Food Safety 2008, 28, 514–533. [Google Scholar] [CrossRef]
  50. Marker, A.F.H.; Bolas, P.M. Sampling of nonplanktonic algae (benthic algae or periphyton). In Methods for the Examination of Waters and Associated Materials; Pittwell, L.R., Ed.; Department of the Environment: London, UK, 1982. [Google Scholar]
  51. Francoeur, S.N.; Rier, S.T.; Whorley, S.B. Methods for sampling and analyzing wetland algae. In Wetland Techniques, 1st ed.; Anderson, J., Davis, C., Eds.; Springer: Dordrecht, Switzerland, 2013; Volume 2, pp. 1–87. [Google Scholar]
  52. Douglas, B. The ecology of the attached diatoms and other algae in a small stony stream. J. Ecol. 1958, 46, 295–322. [Google Scholar] [CrossRef]
  53. Peniuk, G.T.; Schnurr, P.J.; Allen, D.G. Identification and quantification of suspended algae and bacteria populations using flow cytometry: Applications for algae biofuel and biochemical growth systems. J. Appl. Phycol. 2016, 28, 95–104. [Google Scholar] [CrossRef]
  54. Simon, D.; Helliwell, S. Extraction and quantification of chlorophyll a from freshwater green algae. Water Res. 1998, 32, 2220–2223. [Google Scholar] [CrossRef]
  55. Schumann, R.; Häubner, N.; Klausch, S.; Karsten, U. Chlorophyll extraction methods for the quantification of green microalgae colonizing building facades. Int. Biodeterior. Biodegrad. 2005, 55, 213–222. [Google Scholar] [CrossRef]
  56. Schwarz, D.; Grosch, R.; Gross, W.; Hoffmann-Hergarten, S. Water quality assessment of different reservoir types in relation to nutrient solution use in hydroponics. Agric. Water Manag. 2005, 71, 145–166. [Google Scholar] [CrossRef]
  57. Hinchee, R.E.; Downey, D.C.; Aggarwal, P.K. Use of hydrogen peroxide as an oxygen source for in situ biodegradation: Part I. field studies. J. Hazard. Mater. 1991, 27, 287–299. [Google Scholar] [CrossRef]
  58. Tusseau-Vuillemin, M.H.; Lagarde, F.; Chauviere, C.; Heduit, A. Hydrogen peroxide (H2O2) as a source of dissolved oxygen in COD-degradation respirometric experiments. Water Res. 2002, 36, 793–798. [Google Scholar] [CrossRef]
  59. Taylor, N.I.; Ross, L.G. The use of hydrogen peroxide as a source of oxygen for the transport of live fish. Aquaculture 1988, 70, 183–192. [Google Scholar] [CrossRef]
  60. Oliveira, L.C.A.; Silva, C.N.; Yoshida, M.I.; Lago, R.M. The effect of H2 treatment on the activity of activated carbon for the oxidation of organic contaminants in water and the H2O2 decomposition. Carbon 2004, 42, 2279–2284. [Google Scholar] [CrossRef]
  61. Soffer, H.; Burger, D.W.; Lieth, J.H. Plant growth and development of Chrysanthemum and Ficus in aero-hydroponics: Response to low dissolved oxygen concentrations. Sci. Hortic. 1991, 45, 287–294. [Google Scholar] [CrossRef]
  62. Ruso, T.; Cowden, R.J.; Moraru, P.I.; Maxim, M.A.; Ghaley, B.B. Overview of multiple applications of basil species and cultivars and the effects of production environmental parameters on yields and secondary metabolites in hydroponic systems. Sustainability 2021, 13, 11332. [Google Scholar] [CrossRef]
  63. Sikawa, D.C.; Yakupitiyage, A. The hydroponic production of lettuce (Lactuca sativa L.) by using hybrid catfish (Clarias macrocephalus × C. gariepinus) pond water: Potentials and constraints. Agric. Water Manag. 2010, 97, 1317–1325. [Google Scholar] [CrossRef]
Figure 1. The visual scale of algae in tanks of ebb and flow hydroponic systems at OSU research greenhouses in Stillwater, OK. (1) = little to no algae, (2) = some algae collected on sides and bottom, (3) = thick algae matt.
Horticulturae 08 00569 g001
Figure 2. Effects of the rate of two hydrogen peroxide products, ZeroTol (Z) and 3% hydrogen peroxide (3%) (45 mL Z, 60 mL Z, 45mL Z, and 50 mL 3%, and 60 mL Z and 50 mL 3%) on dissolved oxygen (DO) levels of nutrient solution in ebb and flow hydroponic systems at OSU research greenhouses in Stillwater, OK. Treatments were applied weekly starting on day three. Stars show significant differences between at least two treatments that day for experiment one.
Horticulturae 08 00569 g002
Figure 3. Effects of rate of three hydrogen peroxide products, ZeroTol (Z), PERpose Plus (PP), 3% hydrogen peroxide (15, 30, 45, and 60 weekly; 15, 30, 45, and 60 mL weekly; 70 mL weekly), and control on dissolved oxygen (DO) levels of nutrient solution in ebb and flow hydroponic systems at OSU research greenhouses in Stillwater, OK. Treatments were applied weekly starting 3 days after transplanting3 for ZeroTol and Purpose Plus and 7 days for hydrogen peroxide for experiment one.
Horticulturae 08 00569 g003
Table 1. Test of effects for cultivar and treatment with hydrogen peroxide compounds on the growth of two basil cultivars (‘Genovese’ and ‘Aroma II’) and lettuce (‘Green Forest’ and ‘Tropicana’) grown in an ebb and flow hydroponic systems for 30 days at the OSU research greenhouses in Stillwater, OK. Experiment one.
Type CultivarChemical TreatmentCultivar × Chemical Treatment
BasilSPAD* zNSNS
Plant heightNSNSNS
Plant width*NSNS
Number of leavesNSNSNS
Shoot FWNSNSNS
Shoot DWNSNSNS
Root DWNSNSNS
LettuceSPAD***NSNS
Plant height***NS
Plant width*NSNS
Number of leavesNS*NS
Shoot FW*****
Shoot DWNS**NS
Root DWNS*NS
z Indicates significant at or nonsignificant (NS) at * p ≤ 0.05, ** p ≤ 0.01, or *** p ≤ 0.001.
Table 2. Least square means interaction between lettuce cultivars and hydrogen peroxide treatment for shoot fresh weight of two cultivars (‘Green Forest’ and ‘Tropicana’) grown in ebb and flow hydroponic systems for 30 days after transplanting at OSU research greenhouses in Stillwater, OK. Experiment one.
CultivarChemical TreatmentShoot FW
(g Plant−1)
Green ForestControl271.12a z
3% H2O2 (50 mL)298.80a
ZeroTol (45 mL)159.26bc
ZeroTol (60 mL)114.60bc
ZeroTol (45 ppm) and 3% H2O2 (50 mL)108.40c
ZeroTol (60 ppm) and)154.79bc
TropicanaControl223.18ab
3% H2O2 (50 mL)209.43abc
ZeroTol (45 mL)148.85bc
ZeroTol (60 mL)135.15bc
ZeroTol (45 ppm) and 3% H2O2 (50 mL)148.09bc
ZeroTol (60 ppm) and 3% H2O2 (50 mL)134.40bc
z Means (n = 20) within a column followed by the same lowercase letter are not significantly different by pairwise comparison in the mixed model (p ≤ 0.05).
Table 3. Least square means of rates of two hydrogen peroxide products on height, leaf number, shoot dry weight, and root dry weight of lettuce (‘Tropicana’ and ‘Green Forest’) grown in ebb and flow hydroponic systems at OSU research greenhouses in Stillwater, OK, in experiment one.
ChemicalPlant Height (cm)Number of LeavesShoot DW
(g Plant−1)
Root DW
(g Plant−1)
Control28.34a z12.94ab10.04a1.27a
3% H2O2 (50 mL)26.45ab15.35a9.81a1.10ab
ZeroTol (45 mL)22.80b12.85ab6.50ab1.07ab
ZeroTol (60 mL)29.40bc11.79b5.59b0.95ab
ZeroTol (45 mL) and 3% H2O2 (50 mL)17.19c12.54ab6.54ab0.80b
ZeroTol (60 mL) and 3% H2O2 (50 mL)22.35bc13.10ab6.67ab0.93ab
z Means within a column followed by the same lowercase letter are not significantly different by pairwise comparison in the mixed model (p ≤ 0.05).
Table 4. Least square means of basil and lettuce on SPAD index and plant height and width grown in ebb and flow hydroponic systems at OSU research greenhouses in Stillwater, OK, in experiment one.
TypeCultivarSPAD Index
(Unitless)
Plant Height
(cm)
Plant Width
(cm)
BasilAroma II33.99a z35.53a17.35a
Genovese32.38b33.53a15.34a
LettuceGreen Forest40.57a23.96a27.59b
Tropicana35.24b21.86b28.83a
z Means within a column followed by the same lowercase letter are not significantly different by pairwise comparison in the mixed model (p ≤ 0.05).
Table 5. Test of effects for hydrogen peroxide treatments and two basil and two lettuce cultivars grown in an ebb and flow hydroponic system at OSU research greenhouses in Stillwater, OK, for experiment 2.
Type CultivarChemical TreatmentCultivar × H2O2
BasilSPADNS zNSNS
Plant heightNSNSNS
Plant widthNSNSNS
Number of leavesNSNSNS
Shoot (FW).NSNSNS
Shoot (DW)NS*NS
Root (DW)NSNSNS
LettuceSPAD*** zNSNS
Plant height*NSNS
Number of leavesNSNSNS
Shoot (FW)NSNSNS
Shoot (DW)NS***NS
Root (DW)NSNSNS
z Indicates significant at or nonsignificant (NS) at * p ≤ 0.05, ** p ≤ 0.01, or *** p ≤ 0.001.
Table 6. The least square means of rates of two hydrogen peroxide products on growth of basil (‘Genovese’ and ‘Aroma II’) and lettuce (‘Green Forest’ and ‘Tropicana’) grown in the ebb and flow hydroponic systems at OSU research greenhouses in Stillwater, OK. Experiment two.
TypeChemical TreatmentShoot DW (g)
BasilControl7.98ab z
3% H2O2 (70 mL)7.79ab
ZeroTol (15 mL)7.82ab
ZeroTol (30 mL)7.78ab
ZeroTol (45 mL)8.35a
ZeroTol (60 mL)7.27ab
PERpose Plus (15 mL)7.99ab
PERpose Plus (30 mL)7.29ab
PERpose Plus (45 mL)8.16ab
PERpose Plus (60 mL)6.58b
LettuceControl14.01abc
3% H2O2 (70 mL)14.38abc
ZeroTol (15 mL)15.16ab
ZeroTol (30 mL)13.04abc
ZeroTol (45 mL)14.89ab
ZeroTol (60 mL)11.17bc
PERpose Plus (15 mL)15.24a
PERpose Plus (30 mL)15.07ab
PERpose Plus (45 mL)13.83abc
PERpose Plus (60 mL)10.51c
z Means within a column followed by the same lowercase letter are not significantly different by pairwise comparison in the mixed model (p ≤ 0.05).
Table 7. The least square means of cultivars (‘Green Forest’ and ‘Tropicana’) on the growth of lettuce grown in the ebb and flow hydroponic systems at OSU research greenhouses in Stillwater, OK, for experiment two.
TypeCultivarSPAD Index (Unitless)Plant Height
(cm)
LettuceGreen Forest40.47a20.12a z
Tropicana33.38b14.62b
z Means within a column followed by the same lowercase letter are not significantly different by pairwise comparison in the mixed model (p ≤ 0.05).
Table 8. The least square means of different rates applied weekly of three hydrogen peroxide products on algae samples taken 30 days after lettuce and basil were grown in the ebb and flow hydroponic systems in Stillwater, OK.
ExperimentChemical TreatmentDry Weight
(mg L−1)
Algal Cells
(105)
Chl a
(µg L−1)
Visual Scale z
1Control0.66a y13.66a740.53a3
3% H2O2 (50 mL)0.61a13.38a801.59a3
ZeroTol (45 mL)0.71a12.98a708.35a2
ZeroTol (60 mL)0.86a13.26a755.07a1
ZeroTol (45 mL) and 3% H2O2 (50 mL)1.00a13.28a856.90a2
ZeroTol (60 ppm) and 3% H2O2 (50 mL)0.64a12.57a875.28a2
2Control0.47a z6.50a945.57a3
3% H2O2 (50 mL)0.26a5.42a1209.09a3
ZeroTol (15 mL) 0.37a6.42a616.90a2
ZeroTol (30 mL) 0.37a6.75a637.19a2
ZeroTol (45 mL) 0.43a5.97a716.51a2
ZeroTol (60 mL)0.23a6.24a509.46a1
PERpose Plus (15 mL)0.21a6.15a573.41a2
PERpose Plus (30 mL)0.15a6.01a597.24a2
PERpose Plus (45 mL)0.21a5.93a607.17a2
PERpose Plus (60 mL)0.14a5.76a690.83a1
z Visual scale: 1 = little to no algae, 2 = some algae collected on sides and bottom, 3 = thick algae matt. y Means (n = 10) within a column followed by the same lowercase letter are not significantly different by pairwise comparison in the mixed model (p ≤ 0.05).
Table 9. Effects of different rates of three hydrogen peroxide products on taxonomic counts of algae present in ebb and flow hydroponic systems 30 days after production of lettuce and basil in OSU research greenhouses, Stillwater, OK for experiment one.
Chemical TreatmentScientific NameAverage
Cells/mL z
Average Natural Units/mL z
ControlMicrospora tumidula478,071976
Leptolyngbya spp48,7712342
Scenedesmus acuminatus9292
Scenedesmus acutus4611
Pennate Diatom spp. Live1111
Centric Diatom spp. Live1111
Chlamydomonas spp.1111
3% H2O2 (70 mL)Microspora tumidula10,0351476
Gloeocystis vesiculosa9888325
Chlamydomonas spp.63166316
Tetraspora cylindrica147630
Centric Diatom spp. Live472472
Scenedesmus acuminatus236148
Pennate Diatom spp. Live118118
ZeroTol (15 mL)Gloeocystis vesiculosa29,4941756
Microspora tumidula18,956568
Chlamydomonas spp.12,91312,913
Scenedesmus acutus930258
Scenedesmus quadricauda20752
ZeroTol (60 mL)Pennate Diatom spp. Live45274527
Microspora tumidula3587244
Chlamydomonas spp.451451
Centric Diatom spp. Live394394
Gloeocystis vesiculosa22519
PERpose Plus (15 mL)Microspora tumidula28,620942
Gloeocystis vesiculosa9818355
Microspora pachyderma8268
Chlamydomonas spp.496496
Scenedesmus acutus31499
Scenedesmus quadricauda8325
Centric Diatom spp. Live8383
PERpose Plus (60 mL)Gloeocystis vesiculosa48461183
Sphaerocystis planktonica1165949
Scenedesmus acutus301103
Pennate Diatom spp. Live272272
Scenedesmus acuminatus213188
Centric Diatom spp. Live150150
Chlamydomonas spp.99
z Derived from a 300 mL solution.
Publisher’s Note: MDPI stays neutral with regard to jurisdictional claims in published maps and institutional affiliations.

