Abstract
Plants actively respond to changes in photoperiods, light intensities, and temperatures; an interplay of these three factors can result in increased biomass, growth, and improved plant morphology. This study aimed to investigate the effects of different photoperiods, light intensities, and day/night temperatures on the growth and quality of glasshouse-grown lettuce, as well as to determine the optimal photo-thermal conditions. Two separate experiments were conducted; in the first experiment, the effects of photoperiods (11, 14, and 17 h d−1) and light intensities (150, 200, 250, and 300 μmol m−2 s−1 PPFD) were investigated. In the second experiment, the effects of day/night temperature combinations (15/20, 20/20, 25/20, and 30/20 °C) were assessed. The highest growth, biochemical, and physiological attributes of lettuce were obtained either at 14 or 17 h d−1 + 200 and 250 μmol m−2 s−1 PPFD. Lettuce plants grown at a 20/20 °C day/night temperature also showed promising results compared to other temperature combinations. Based on a principal component analysis and factor analysis of mixed data analyses, most of the lettuce attributes showed a negative correlation with an 11 h d−1 photoperiod and a positive correlation with 14 and 17 h d−1 photoperiods. The most positive responsive attributes to higher light intensity were leaf fresh weight:root fresh weight ratio, root dry, and water use efficiency. An increase in the day/night temperature significantly affected the N, P, K, root fresh weight:leaf fresh weight ratio, E, Pn, and root dry weight. Our findings suggest that the growth, biochemical, and physiological attributes of lettuce significantly increased to a certain level of light intensity (200 and 250 μmol m−2 s−1 PPFD), photoperiod (14 and 17 h d−1), and day/night temperature (20/20 °C), referred to as an effective combination.
1. Introduction
Lettuce (Lactuca sativa L.; family Asteraceae) is a leafy vegetable that is grown globally on 1,226,370 hectares, with an annual production of 27,660,187 metric tons []. It is widely consumed worldwide in a variety of ways, from salad to medicinal products, and contributes significant nutritional value to diets []. Lettuce is a low-calorie, low-fat, and low-sodium vegetable that contains fiber, iron, folate, vitamin C, vitamin A, vitamin K, β-carotene, and folate. Lettuce is also rich in other health-promoting bioactive compounds with anti-inflammatory, cholesterol-lowering, and anti-diabetic properties [,]. There are seven major lettuce cultivar groups, and each cultivar has several varieties, including butterhead, iceberg, loose leaf, little gem, romaine, and summer crisp. The concept of green products has gained in popularity throughout the world, and lettuce ranks among the most popular. Due to the increasing demand for lettuce, a significant number of farmers are switching to grow such high-demand vegetables in controlled environmental conditions. Controlled farming has certain advantages over the field conditions, such as increased annual production (up to 100 times), water usage efficiency (30–50 times), an organic nature (no or reduced pesticide use), and a shorter production cycle [].
Despite significant technological advancements and innovations, controlled environment agriculture is associated with high capital and operating costs. Therefore, novel and contemporary approaches to optimizing growth conditions, particularly photoperiod (PP), light intensity (LI), and day/night temperature, remain critical [,]. All of these attributes are variable and have a pronounced effect on the yield, growth, and nutritional quality of vegetables and crops []. Light provides energy to plants and acts as an environmental signal that influences their morphogenesis. Thus, variations in the intensity, photoperiod, and spectrum of light can elicit a variety of physiological responses and influence the growth and development of plants [,,]. Energy cost reduction is critical for profitability in controlled environment agriculture, and it is directly related to optimizing the photoperiod, photon spectrum, day and night temperature, and photon flux density (PFD) to maximize harvestable yield and nutritional quality. The quantity of radiation, or PFD, is referred to as the number of photons emitted in a specified area over a specified period and is usually expressed in μmol m−2 s−1, whereas the photoperiod refers to the duration of light during a 2 h period (h d−1). Although plants respond primarily to wavelengths ranging from ultraviolet (280–400 nm) to far-red (700–800 nm), the standardized photosynthesis active radiation wavelength is 400–700 nm. Low photosynthetic photon flux density (PPFD) has been shown to induce shade-avoidance responses in plants, whereas high PPFD has been shown to increase carbohydrate accumulation and the net photosynthetic rate [,]. Extending the photoperiod can result in an increase in the leaf size, chlorophyll content, and fresh weight in different lettuce cultivars [,]. This, however, may result in tip burn symptoms and marginal leaf necrosis []. Photosynthetic light responses can be thought of as concave functions of the PPFD in general. With increasing PPFD, the efficiency of photosynthetic light use invariably decreases. The decrease in photosynthetic light use efficiency with the rise in PPFDs is partly caused by photoprotective processes that convert absorbed light energy to heat instead of allowing it to be used for electron transport in photosynthesis’s light reactions [,,]. Because light is more efficient in driving photosynthesis at lower PPFDs, we used light with a range of PPFDs to determine the optimal yield parameters of lettuce.
LI is the amount (or strength) of light produced by a light source. The daily light integral (DLI) is the product of the PPFD and photoperiod in a 24 h d−1 that regulates leaf pigmentation and biomass accumulation in plants []. A reduced DLI has a detrimental effect on the growth and morphology of plants []. On the other hand, a 1% increase in light can result in a 0.8–1% increase in harvestable yield across a range of horticultural crops such as cucumber, tomato, lettuce, and radish []. By doubling the DLI from 10 to 20 μmol m−2 s−1, the accumulation of lettuce biomass was nearly doubled [,]. Thus, increasing the total amount of radiation received by a plant during the day is an effective way to increase the accumulation of leafy green biomass. Nonetheless, an increase in LI leads to an increase in nitrate to a dangerous level in lettuce, which can be harmful to humans when consumed in excess []. Both environmental and genetic factors influence the nitrate accumulation in plants, but the effect of LI on nitrate accumulation in plants is far greater than the effect of other environmental factors []. This effect on nitrate may be due to the inhibition of the asparagine synthetase responsible for the conversion of non-essential amino acids, which favors the nitrogen assimilation into glutamine and glutamate, or it may be due to the stimulation of some enzymes (such as the glutamine synthase and glutamate synthetase) involved in the nitrate metabolism of amino acids []. Increased LI has been shown to improve lettuce quality and growth, and the most efficient LI for lettuce is between 200–400 μmol m−2 s−1 [,,,,].
Lettuce is a summer annual, facultative long-day plant which responds well to longer photoperiods [,]. An increased photoperiod results in an increase in the DLI, which can result in an increased lettuce yield and a shorter production cycle []. Increased photoperiods promote plant growth by increasing the leaf area, chlorophyll concentration, and DLI, all of which contribute to increasing the yield in food crops []. The light intensity and photoperiod are very crucial not only for controlling the crop yield but also for the quality attributes. For example, the red pigmentation and anthocyanin content (color-producing compound) of lettuce cultivars are enhanced by enhancing the light intensity [,], which ultimately boosts the marketability and salability of the product. Additionally, extending the photoperiod can contribute to a plant’s nutritional quality by increasing the concentration of phytonutrients such as anthocyanin content, β-carotene, lutein, and other phenolic compounds [,].
Lettuce is usually grown outdoors with daytime and nighttime temperatures of 17–22 °C and 3–12 °C, respectively [], and under controlled greenhouse conditions at 15–20 °C []. The temperature under controlled conditions is critical, and just a few studies have investigated the effects of day and night temperature differences on lettuce production and its physicochemical attributes [,]. Increasing the DLI and photoperiod (18 h d−1) had profound beneficial effects on lettuce growth and bolting []; however, to avoid lettuce flowering, the photoperiod can be manipulated between 14 and 17 h []. The physiological characterization of gas exchange at the leaf level is based mainly on the association between the light intensity and photosynthetic rate [,]. Moreover, the relationship between the photoperiod, light intensity, and difference in day/night temperature is crucial to managing lettuce growth and development under controlled conditions [,,,]. Therefore, the objective of this study was to appraise the effects of photo-thermal controlled environments (photoperiod, light intensity, and day/night temperature) on the growth, biochemical, and physiological attributes of butterhead lettuce under glasshouse conditions. The interplay of the photoperiod and light intensity on the photosynthetic rate and related attributes during lettuce growth was also investigated in this study. Furthermore, the principal component analysis and factor analysis of mixed data highlighted the correlation between the different parameters studied. These findings provide support and knowledge to the growers to manipulate the glasshouse environmental factors such as the photoperiod, light intensity, and temperature to improve lettuce production.
2. Materials and Methods
2.1. Plant Materials and Seed Germination
Butterhead lettuce (cv. Gustav) seeds were obtained from Chiltern Seed, Wallingford, England, and were sown into module trays (53.3 × 28.2 × 5.4 cm) containing a peat-based modular compost. Seed trays were watered and held for germination at 23 ± 2 °C in a growth chamber. A mixture of white fluorescent and tungsten bulbs were used to provide light (PPFD of 160 μmol m−2 s−1) with a 16 h d−1 photoperiod. After 70% germination (3–4 true leaves), the seedlings were transferred into 22 cm plastic pots containing a mixture of peat compost and perlite (3:1 v/v).
2.2. Photoperiod, Light Integral, and Day/Night Temperature Experiments
This study comprised two experiments: in the first experiment, the effects of different PPs and LIs were assessed, while in the second experiment, the impact of different temperatures was evaluated. Fifteen-day-old lettuce seedlings with three to four true leaves of the same height were selected for both experiments. They were harvested fifty days after transplantation to determine their morphological, biochemical, and physiological attributes.
In the first experiment, a randomly selected equal number of plants were placed in three photoperiod chambers, which provided 11 h d−1 (8 a.m.–7 p.m.), 14 h d−1 (8 a.m.–10 p.m.), and 17 h d−1 (8 a.m.–1 a.m.) photoperiods. These photoperiod compartments were further divided into four light intensity suites (150, 200, 250, and 300 μmol m−2 s−1 PPFD). Additionally, the DLI was also calculated at different PPs (Table S1). The PPFD in each compartment was measured 20 cm above the plants using a quantum sensor (MQ 500, Apogee Instruments, North Logan, UT, USA). These chambers were continuously ventilated with the help of a small-sized exhaust fan (FV-25AU9, Panasonic, Tokyo, Japan) with an average airflow 920 m3 h−1 to minimize the temperature increment due to the lamps’ heat. The chambers were set to provide 24 ± 2 and 20 ± 2 °C day and night temperature, respectively, and a relative humidity of 65–70%.
In the second experiment, a randomly selected equal number of plants were placed at a PP of 14 h d−1 and an LI of 250 μmol m−2 s−1, fixed throughout the course of the experiment. The night temperature was fixed at 20 °C, whereas four different regimes of day temperature—15 °C, 20 °C, 25 °C, and 30 °C—were applied. The difference between the day and night temperatures (DIF) was either positive (when the day temperature was higher than night temperature, 25/20 and 30/20 °C), negative (when the day temperature was lower than night temperature, 15/20 °C), or zero (when the day and night temperatures were the same, 20/20 °C).
The temperature and relative humidity were recorded using the HOBO MX1104 Analogue/Temp/RH/Light data logger (Onset Computer Corporation, Bourne, MA, USA) installed inside glasshouse chambers. The plants were irrigated manually whenever it was needed, and a nutrient fertigation (Nitrophoska Perfect NPK 15-5-20 SOP, Triferto B.V., LA Bleiswijk, The Netherlands) was applied [] once a week.
2.3. Measurements of Morphological Parameters
Plant height, plant spread, leaf number, and root length data were calculated at harvest (50 days after transplantation). At the same time, the leaf area (CI-202 portable leaf area meter, CID Bio-Science, Camas, WA, USA), leaf fresh and dry weights, and root fresh and dry weights (Sartorius balance, Sartorius Lab Instruments GmbH & Co., Germany) were also measured. The leaves and roots were washed with tap water, dried, and placed in an oven (BINDER™ Series E Classic, Fisher Scientific, Waltham, MA, USA) at 80 °C for 72 h, and their dry weights were recorded.
2.4. Measurements of Biochemical Attributes
The lettuce plants were harvested fifty days after transplantation, and fresh leaf samples were used to measure the biochemical characteristics. To determine the ascorbic acid content, the 2,6-dichlorophenol indophenol titration method was followed. The fresh leaf (10 g) was initially ground in 5 mL of an oxalic acid (2%) solution. After shaking and filtering, the oxalic acid (2%) was added to yield a 100 mL solution. In an evaporating dish, 10 mL of the filtrate was titrated with the 2,6-dichlorophenol indophenol solution until the color changed to pink for 30 s, at which point the amount of dye was determined. For the titration degree and blank dye concentration, the same method was used to titrate into 10 mL of a vitamin C solution and a 2% oxalic acid solution. The ascorbic acid content was calculated using the titrate result and the sample’s parameters [].
The total sugar content (TS) was determined by the anthrone-sulfuric acid colorimetry method. In a graduated tube, 0.1–0.3 g of lettuce leaf was cut into pieces and mixed with 20 mL of distilled water. The tube was then sealed and immersed in boiling water for 30 min before being filtered into a new tube filled with distilled water up to 50 mL. Subsequently, 0.5 mL of this solution was mixed with 1.5 mL of distilled water as a test sample and subjected to an absorbance measurement at 630 nm in a spectrophotometer (Genesys 20, Thermo Scientific, Waltham, MA, USA). The TS was calculated using a standard sucrose content relative curve and the absorbance of the sample [].
The anthocyanin content was determined using the spectrometric method. Two grams of leaf tissue were mixed with a pre-cold 1% hydrogen chloride methanol solution, ground into pulp, placed in a centrifuge tube (50 mL), and then added to a 1% hydrogen chloride methanol solution to make it 50 mL. The resultant solution was incubated at 4 °C for 20 min, and then the absorbance was measured spectrophotometrically at 530 nm and 600 nm against a blank of the 1% hydrogen chloride methanol solution. The absorbance difference at 530 nm and 600 nm was used to calculate the anthocyanin content [].
The total N content was determined using the Kjeldahl method. In a Wiley Mill, dried leaf tissues were ground and passed through an 841 m screen. The leaf sample was digested by heating it in sulfuric acid with potassium sulfate and a low concentration of copper as a catalyst, which converted the organic N to ammonium. The ammonium in the digested sample was determined by the titration of the ammonia in the presence of alkali [].
The total P content was determined using the Olsen technique []. The leaf samples were oven-dried overnight at 80 °C, milled, and then digested with a mixture of concentrated nitric and perchloric acids, which was followed by dissolution in 10% (v/v) HCl using inductively coupled plasma spectrometry.
To determine the K content of the lettuce leaves, a 25 mg air dried lettuce leaf sample was placed into a 50 mL Erlenmeyer flask; 10 mL of the Glycerol-2-propanol reagent was added to it and swirled for a few seconds. The lithium standard solution (5000 ppm) was pipetted into a 250 mL volumetric flask. The leaf sample was put into the volumetric flask, which was then filled with deionized water to a volume of 250 mL. The flame photometer was calibrated using standard solutions of K. The leaf material slurry in the volumetric flasks was placed into the flame photometer, and the potentiometer reading was recorded in order to plot it in the standard curve for the estimation of the K content [].
2.5. Measurements of Physiological Attributes
The leaf chlorophyll was taken two days before harvest with the help of the SPAD-502 hand-held chlorophyll meter (Konica Minolta Sensing Inc., Tokyo, Japan). Concurrently, the photosynthesis (Pn), stomatal conductance (gs), and transpiration rate (E) were calculated on five intermediate-aged leaves per plant using the CI-340 Handheld Photosynthesis System (CID Bio-Science, Camas, WA, USA). A 12 g CO2 cylinder was used to calibrate the CO2 reference and sample readings at an airflow of 500 mL min−1. The chamber temperature of the gas analyzer was 20 °C in the first experiment, and it was 15, 20, 25, and 30 °C in the second experiment, according to the respective day temperature. The photosynthetically active radiation was selected according to the LIs set in the first experiment (150–300 μmol m2 s−1) and the second experiment (250 μmol m2 s−1), whereas the CO2 concentration was 380 μmol m2 s−1. The readings were taken using the middle section of the leaf. The measuring chamber enclosed a circular 2 × 3 cm2 leaf area and evaluated the gas fluxes on both sides of the leaf. The instantaneous WUE was measured as the photosynthesis (µmol CO2 m−2 s−1) divided by the transpiration rate (mmol H2O m−2 s−1) [].
2.6. Statistical Analysis
All the data were analyzed using the R statistical analysis software and R4.1.2 statistical language. The first experiment was laid out on two-factorial Completely Randomized Design with the photoperiod and light intensity as factors, whereas the second experiment was laid out on a Completely Randomized Design with only one factor (temperature). Each experiment treatment was comprised of three biological replicates. For multiple comparisons, the least significant difference test (LSD) was used. The comparisons were made at level of significance of p ≤ 0.05. A principal component analysis (PCA) and factor analysis of mixed data (FAMD) were conducted to infer the correlation structure among different morphological, biochemical, and physiological attributes of lettuce plants.
3. Results
3.1. Effect of the Photoperiod and Light Intensity on Morphological Attributes and Biomass
Different PP and LI treatments had a significant (p ≤ 0.05) effect on the butterhead lettuce growth attributes, such as the plant height (PH), plant spread (PS), plant fresh weight (PFW), leaf numbers (LN), leaf fresh weight (LFW), leaf dry weight (LDW), root fresh weight (RFW), root fresh weight and leaf fresh weight ratio (RFW:LFW), root dry weight and leaf dry weight ratio (RDW:LDW), root length (RL), and total leaf area (TLA) harvested 50 days after transplantation. However, the effect of both factors on the root dry weight (RDW) was non-significant (Table 1). The lettuce plants subjected to a 17 h d−1 PP + 200 μmol m−2 s−1 LI or a 14 h d−1 PP + 250 μmol m−2 s−1 LI had a higher PH, PS, PFW, LN, LFW, LDW, RFW, RL, and TLA. These PP and LI treatment combinations were statistically on par regarding the PS, PFW, LN, LFW, LDW, RL, and TLA parameters. Apart from the RDW:LDW ratio, all of the other growth attributes were significantly lower in the 11 h d−1 PP and 150 to 250 μmol m−2 s−1 LI combinations. The plants grown in an 11 h d−1 PP + 300 μmol m−2 s−1 LI exhibited moderate results compared to the other LI levels at the same PP.

Table 1.
Different growth attributes of glasshouse-grown butterhead lettuce cv. Gustav under various photoperiod and light intensity combinations. The FW and DW in the table represent the fresh weight and dry weight, respectively.
3.2. Effect of the Photoperiod and Light Intensity on Biochemical Attributes
The findings of the present study showed that different biochemical attributes, such as the ascorbic acid content (AA), anthocyanin content (AC), total sugars content (TS), nitrogen content (N), phosphorus content (P), and potassium content (K) of butterhead lettuce cv. Gustav, were significantly (p ≤ 0.05) varied with different PP and LI combinations. The average AA (Figure 1A), AC (Figure 1B), TS (Figure 1C), N (Figure 1D), P (Figure 1E), and K (Figure 1F) in the leaf tissues were the highest at the 17 h d−1 PP + 200 μmol m−2 s−1 LI combination, which was statistically on par with the 14 h d−1 PP + 250 μmol m−2 s−1 LI combination regarding the AA, AC, and TS parameters. There was a slight significant difference between the aforementioned two treatment combinations regarding the N, P, and K attributes. Additionally, the 11 h d−1 PP at all LI combinations showed the lowest biochemical parameters.
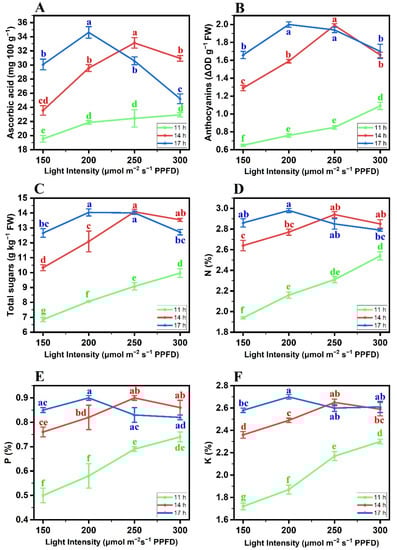
Figure 1.
Effects of different photoperiod and light intensity combinations on the biochemical attributes of butterhead lettuce cv. Gustav, including (A) ascorbic acid content, (B) anthocyanin content, (C) total sugar content (TS), (D) nitrogen content, (E) phosphorous content, and (F) potassium content. Each data point is the mean of three independent biological replicates. The Ybar on each data point indicated the standard error within the mean. The statistical analysis is based on a two-factorial completely randomized design. The comparison of the treatment means was performed by the least significance difference (LSD) test for the photoperiod and light intensity. Different letters within each graph indicate significant mean differences, as compared by the LSD (p ≤ 0.05).
3.3. Effect of the Photoperiod and Light Intensity on Physiological Attributes
Different PP and LI treatment combinations had significant (p ≤ 0.05) effects on the physiological attributes of the butterhead lettuce cv. Gustav. Our study showed that the chlorophyll content was much higher at a 17 h d−1 PP + 200 μmol m−2 s−1 LI (Figure 2A). The Pn was positively affected by increasing the PP and LI, i.e., a 14 h d−1 PP + 250 μmol m−2 s−1 LI and a 17 h d−1 PP + 200 μmol m−2 s−1 LI, and both treatment combinations behaved alike (Figure 2B). The maximum gs was determined at a 14 h d−1 PP + 250 μmol m−2 s−1 LI (Figure 2C). The data regarding the E variable were significantly higher at 17 and 14 h d−1 PPs with all LI combinations (150, 200, 250, and 300 μmol m−2 s−1), and all these treatment combinations were statistically on par with each other (Figure 2D). Apart from the 14 h d−1 PP + 150 μmol m−2 s−1 LI combination, 14 and 17 h d−1 PPs at all LI combinations (200, 250, and 300 μmol m−2 s−1) had the highest WUE and were statistically on par with each other (Figure 2E; Table 1). There were different growth attributes of glasshouse-grown butterhead lettuce cv. Gustav under various photoperiod and light intensity combinations. The FW and DW in the table represent the fresh weight and dry weight, respectively.
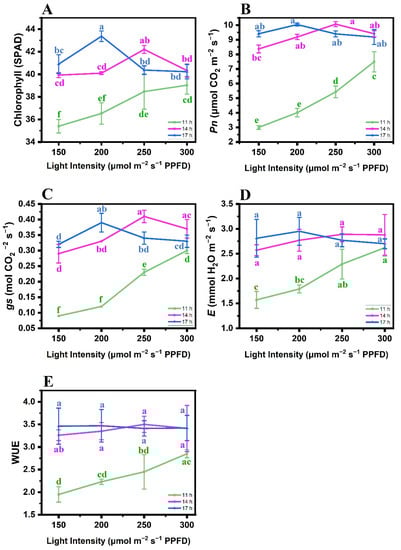
Figure 2.
Effects of different photoperiod and light intensity combinations on the physiological attributes of butterhead lettuce cv. Gustav, including (A) chlorophyll, (B) rate of photosynthesis (Pn), (C) stomatal conductance (gs), (D) transpiration rate (E), and (E) water use efficiency (WUE). Each data point is the mean of three independent biological replicates. The Ybar on each data point indicates the standard error within the mean. The statistical analysis is based on a twofactorial completely randomized design. The comparison of treatment means was performed by the least significance difference (LSD) test for the photoperiod and light intensity. Different letters within each graph indicate significant mean differences, as compared by the LSD (p ≤ 0.05).
3.4. Effect of Day/Night Temperature on Morphological Attributes and Biomass
The PFW, LN, LFW, LDW, RFW, RDW:LDW ratio, and TLA of butterhead lettuce cv. Gustav were significantly (p ≤ 0.05) affected by different day/night temperature combinations, whereas the RDW and RFW:LFW ratio data were non-significantly affected, statistically (Table 2). At zero DIF, the highest PFW, LN, LFW, LDW, RFW, and TLA were recorded. However, the highest RDW:LDW ratio was obtained at a positive DIF. Mostly, the positive DIF had a negative effect on the majority of the aforementioned morphological parameters. In contrast, the PH and RL were higher in positive DIFs, whereas the negative and zero DIF plants had the highest PS (Figure 3E).
Table 2.
Different growth attributes of glasshouse-grown butterhead lettuce cv. Gustav under different day and night temperature. The FW and DW in the table represent the fresh weight and dry weight, respectively.
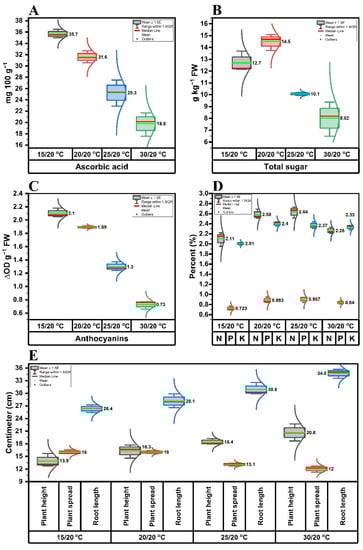
Figure 3.
Effects of different day/night temperatures on the biochemical and growth attributes of butterhead lettuce cv. Gustav, including (A) ascorbic acid content, (B) total sugar content (TS), (C) anthocyanin content, (D) nitrogen, phosphorous, and potassium contents, and (E) plant height, plant spread, and root length. The horizontal red bar represents the median, and the green bars represent the mean value. The side lines along each box represent the data curve. Each data point is the mean of three independent biological replicates. The statistical analysis is based on a single-factor completely randomized design. The comparison of treatment means was performed by the least significance difference (LSD) test (p ≤ 0.05) for day/night temperatures.
3.5. Effect of Day/Night Temperature on Biochemical Attributes
The temperature-dependent changes in the mean values of the investigated biochemical attributes of butterhead lettuce plants are depicted in Figure 3A–D. Different investigated biochemical attributes such as AA, TS, AC, N, P, and K were regulated to their highest values at different DIFs. The significantly (p ≤ 0.05) highest AA (Figure 3A) and AC (Figure 3C) contents were recorded at a negative DIF, followed by zero DIF. The lettuce plants kept at zero DIF had the highest TS content (Figure 3B) compared to others. The plants grown at positive and zero DIFs had the highest N, P, and K contents and behaved alike (Figure 3D).
3.6. Effect of Day/Night Temperature on Physiological Attributes
The impact of the DIF was significant (p ≤ 0.05) on the leaf chlorophyll content, Pn, and gs attributes of butterhead lettuce cv. Gustav; however, the E and WUE were not significantly influenced (Figure 4). A linear decrease in chlorophyll content was observed from negative DIFs onwards. It was higher at negative and zero DIFs, as both behaved alike statistically, whereas the zero DIF positively enhanced the leaf Pn. There was a statistically non-significant difference between the zero, positive (25/20 °C), and negative DIFs regarding the gs parameter, which was significantly higher compared to the 30/20 °C DIF. The E and WUE parameters were non-significantly affected, statistically, at all the DIF regimes.
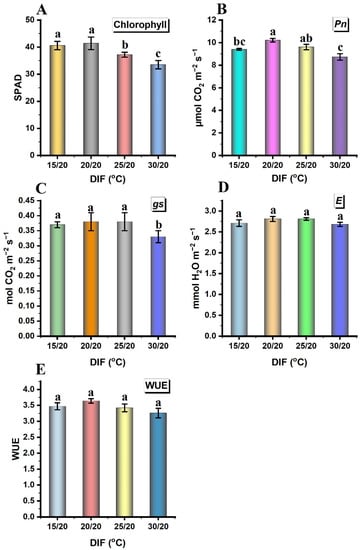
Figure 4.
Effects of different day/night temperatures on the physiological, biochemical, and growth attributes of butterhead lettuce cv. Gustav, including (A) chlorophyll, (B) rate of photosynthesis (Pn), (C) stomatal conductance (gs), (D) transpiration rate (E), and (E) water use efficiency (WUE). Each bar is the mean of three independent biological replicates. The Ybar on each bar indicates the standard error within the mean. The statistical analysis is based on a singlefactor completely randomized design. The comparison of treatment means was performed by the least significance difference (LSD) test for day/night temperatures. Different letters within each graph indicate significant mean differences, as compared by the LSD (p ≤ 0.05).
3.7. Correlation, PCA, and FAMD Analyses
The correlation coefficients among all the investigated attributes of lettuce plants, analyzed by Pearson’s correlation model, are represented in Figure 5A. Among the morphological attributes, the root DW:leaf DW ratio was significantly negatively correlated with all other morphological, biochemical, and physiological attributes, except for the root DW, while the rest of the attributes (morphological, biochemical, and physiological) had significantly positive correlations with each other (Figure S1).
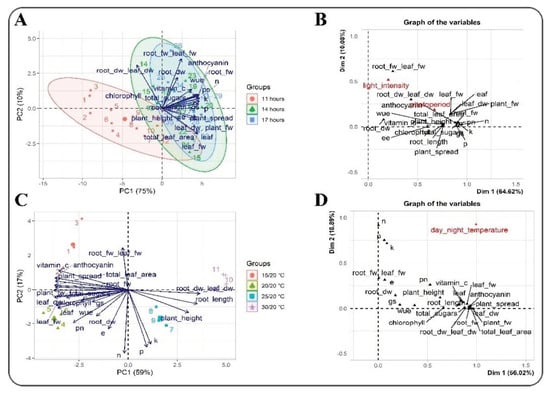
Figure 5.
Biplot principal component analysis (PCA) and factor analysis of mixed data (FAMD) of the morphological, biochemical, and physiological attributes of lettuce plants. (A) PCA and (B) FAMD analysis under different photoperiod and light intensity regimes. (C) PCA and (D) FAMD analysis under different day/night temperature conditions. The distribution of attributes at different photoperiods and day/night temperatures is represented in different colors. The arrows and circles signify the levels and quantities of each attribute.
A biplot PCA was conducted to infer the precise relationship between PP and LI and their effects on the morphological, biochemical, and physiological attributes of lettuce plants (Figure 5A). The biplots PC1 and PC2 explained 75% and 10% of the total variance, respectively. The levels of all the attributes, except for the root DW:leaf DW ratio, were positively correlated in PC1, while the root DW:leaf DW ratio was positively correlated in PC2. Similarly, the plant spread, plant height, plant FW, and TLA were negatively correlated in PC2. A biplot PCA was conducted to infer the precise relationship of DIF with the morphological, biochemical, and physiological attributes of lettuce plants (Figure 5C). The biplots PC1 and PC2 explained 59% and 17.4% of the total variance, respectively. Most of the investigated attributes were found to be negatively correlated in PC1, except for the P, K, plant height, root length, and root DW:leaf DW ratio. The root FW:leaf FW ratio, ascorbic acid content, anthocyanin content, plant spread, TLA, and root FW were positively correlated in PC2 (Figure 5C).
The FAMD analysis of the PP and LI revealed 64.62% and 10.08% of the total variance, respectively. The FAMD indicated that the root FW:leaf FW ratio increases substantially by the LI, whereas the PP had a significant impact on most of the attributes (Figure 5B). In general, all the attributes (morphological, biochemical, and physiological) were mainly separated along with the PP. The FAMD analysis of the DIF exhibited 56.02% and 18.89% of the total variance, and all the investigated attributes responded to the changing temperature. Nonetheless, the N, P, K, root FW:leaf FW ratio, and Pn showed a significant response to an increase in temperature (Figure 5D).
4. Discussion
In lettuce production, the photo-thermal environment is critical for plant growth and quality. The epigeous and hypogeous parts of lettuce plants are influenced by the light intensity, photoperiod, and temperature. Many epigeous attributes, including the PH, PS, PFW, LN, LFW, LDW, RL, and TLA, were boosted when lettuce plants were grown at a 200–250 μmol m−2 s−1 LI and a 14–17 h d−1 PP, indicating that too low or too high LI and PP values would result in a lower lettuce plant yield. The results described in the present study indicate that both of these environmental cues have a persistent impact on lettuce plant development and yield, which is corroborated with earlier studies [,,]. The LN, PS, LFW, and LDW increased as the PP increased in our study. The leaf size and LFW are related to dry weight in a positive way. Because a larger surface area for the absorption of light by the chlorophyll antennae results in an increased light interception, the large leaf area of plants grown under longer PPs is likely to have contributed to the increase in DW, which is also reported in the same crop [,]. Furthermore, in line with our findings, butterhead lettuce cv. Pansoma grown under an increasing LI have more LNs []. The highest increase in TLA was recorded at 200–250 µmol m−2 s−1 LI, when the PP was 14 or 17 h d−1. Corresponding to the present results, the lettuce leaf area of cvs. Adriana, Coastal Star, and Partavousi significantly increased when the PP and LI were increased [,]. The present study revealed that a low LI and a longer PP enhanced the fresh and dry mass of lettuce plants. These findings are consistent with previous findings showing that an increase in supplemental irradiance increases the fresh mass of greenhouse-grown lettuce (cvs. Rosana and Karlo) [], hydroponically grown lettuce (cv. Ziwei) [], and basil plant []. Furthermore, our results demonstrated that increasing the LI increases the lettuce biomass up to an effective LI (200–250 µmol m−2 s−1) and PP (14 or 17 h d−1), after which a reduction in biomass production was observed. The increasing PP and LI enhanced the plant dry weight, leaf size, and chlorophyll content in greenhouse-grown lettuce cv. Little Gem []. Similarly, in cv. Lvling, increasing the LI from 100 to 600 μmol m−2 s−1 (for 14 h d−1 PP) increased the fresh mass, and the fresh mass was reduced when the LI increased to 800 μmol m−2 s−1 []. The optimal or effective LI could vary depending on the plant species or cultivar, and it can be influenced by other environmental factors such as the temperature and CO2 concentration. The rate of plant development is influenced primarily by temperature. The findings of the present study revealed that the PFW, LN, LFW, LDW, RFW, and TLA were higher at zero DIF. Lettuce plant subjected to a 23/18 °C day/night temperature enhanced the PFW from 200 to 600 µmol m−2 s−1 LI []. Lower temperatures (18–22 °C) also enhanced the lettuce leaf area compared to higher temperatures (26–30 °C) [].
The organic flavonoid compounds, called anthocyanins, are responsible for leaf pigmentation, which is an important quality of lettuce. The increase in anthocyanin content is associated with the activation of MYB transcription factors, which promote the expression of the chalcone synthase enzyme [] that catalyzes the first rate-limiting reaction of anthocyanin biosynthesis. Usually, plants grown under high irradiance have high anthocyanin contents. In the present study, longer PPs (14–17 h d−1) and high LIs (200–250 μmol m−2 s−1) increased the anthocyanin contents. In a previous study, Kelly et al. [] demonstrated that increasing the DLI or PP enhanced the red or blue leaf pigmentation in lettuce cv. Rouxai. Our results of the DIF revealed that anthocyanin production was stimulated under low temperatures and was compromised under higher temperatures. Similar results were reported previously for lettuce, grapes, and strawberry plants producing the highest anthocyanin contents at 20 °C [,,], while its production was negatively affected by high temperatures []. Lettuce plants exposed to light showed an increase in anthocyanin content, whereas high temperatures caused a reduction in the anthocyanin accumulation in plants [].
The most significant antioxidant in plants is ascorbic acid, which performs a range of crucial functions and regulates numerous physiological processes []. Our results showed that a longer PP (14–17 h d−1) and a medium LI (200–250 μmol m−2 s−1) led to a higher accumulation of ascorbic acid content. Several studies are in line with our findings, reporting higher levels of vitamin C with a longer PP [,,]. Ascorbic acid biosynthesis is temperature-dependent, and its production is usually compromised at higher temperatures []. Our findings support this study, as a substantial reduction in the ascorbic acid content was observed with the increase in temperature (Figure 3A).
Sugar contributes substantially to promoting the flavor and nutritional value of lettuce plants. The data in our study supported the previous findings that a longer PP (14–17 h d−1) and a medium LI (200–250 μmol m−2 s−1) effectively enhanced the TS in lettuce plants [,,]. Short-term continuous illumination before harvest improved the soluble sugar content of lettuce leaves []. High LIs promote nitrate assimilation by increasing photosynthetic production (sucrose concentration) []. Nitrogen and carbon metabolisms and their distribution are complicated processes in plants that are primarily regulated by the LI, PP, and light quality composition, affecting the photosynthesis and plant leaf morphogenesis. In line with our findings, a low temperature induced TS production by affecting the carbohydrate metabolic pathways []. High temperatures affect the activity of carbohydrate synthesis enzymes, leading to a variation in the sugar content.
Mineral nutrients play a critical role in plant carbohydrate content and photosynthesis []. In our study, increasing the PP (14–17 h d−1) and LI (200–250 μmol m−2 s−1) increased the accumulation of three critical nutrients, N, P, and K, in lettuce plants. The accumulation of N, P, and K in the leaves increased as the LI increased, and low temperatures also increased their accumulation []. Some studies reported a higher accumulation of total N, Zn, K, Mg, Ca, and P at low light intensities in some leafy vegetables [,]. The total Ca, K, and P contents increased with the photoperiod extension, while the total Zn and N contents were higher under shorter photoperiods []. Our results demonstrated a higher accumulation of N, P, and K at zero and positive DIFs. Gent [] reported that low temperatures reduced N accumulation in lettuce plants, increased sugar and K concentration, but had no effect on the P.
Plant leaves’ photosynthetic activity is influenced by several factors including the light, temperature, leaf moisture, pigment content, and CO2 diffusion through the stomatal apparatus [,,]. Increased light intensities and longer PPs had significant effects on the chlorophyll, Pn, E, and gs attributes. The majority of the lettuce plant’s morphological, biochemical, and physiological attributes were positively correlated with Pn, gs, and E. The results showed that lettuce plants exposed to a 200–250 μmol m−2 s−1 LI and a 14–17 h d−1 PP were more efficient in their use of light energy, photosynthesis, and transpiration. Low Pn, gsI, and E values at low LIs and shorter PPs were most likely caused by photoinhibition, which could be linked to lettuce receiving less light than the light saturation point, ultimately limiting carbon assimilation []. Our results are in line with a previous study that found photoinhibition in lettuce plants after the plants were exposed to high LIs []. The increase in leaf chlorophyll content observed under longer PPs, according to Langton et al. [], may be due to the fact that plants can only synthesize chlorophyll in light. The SPAD index (relative chlorophyll content) was increased with PP, but it decreased after reaching an effective LI (200–250 μmol m−2 s−1), implying that high radiation stress can reduce chlorophyll content [,]. The SPAD levels remained consistent in lettuce cv. Hongyeom Jeockckukmyeon grown under moderate LIs []. In our study, the chlorophyll content and Pn were the highest at zero DIF, which indicated that a 20 °C constant mean diurnal temperature (zero DIF) is optimum to accelerate the photosynthetic activity of lettuce. Very recently, a study showed that Romaine lettuce had the highest chlorophyll content, photosynthetic rate, and light saturation point at 23/18 °C under different LIs []. Our findings also corroborate the previous studies that found a decrease in chlorophyll content due to high temperature stress in a variety of crop species [,].
The gaseous exchange takes place through stomata; thus, any change in the stomatal morphology, density, and index could influence the plant WUE []. The highest WUE was observed at a 14–17 h d−1 PP at almost all LIs (150 to 300 μmol m−2 s−1 LI). However, the DIF regimes had no significant effect on the WUE at constant PPs (14 h d−1) and LIs (250 μmol m−2 s−1). At low PPs and LIs, a low WUE was expected, because the chlorophyll fluorescence was decreased. This could also be attributed to the cooling process, as high LIs increased the temperature of the plants and, in turn, the WUE of the plants increased []. The high WUE is linked indirectly to a greater uptake of minerals, plant biomass, and root development—and vice versa []. In line with the results of this study, it has been reported that increasing LIs (up to an effective LI) led to increased photosynthesis and plant biomass, and higher LIs increased transpiration and the generation of more functional stomata [,].
5. Conclusions
Environmental factors such as light and temperature play a pivotal role in lettuce growth and development. The investigated morphological, biochemical, and physiological attributes of lettuce considerably promoted up to an effective light and temperature. For most of the growth and quality-associated attributes for butterhead lettuce cv. Gustav, the effective photoperiod, light intensity, and DIF were found to be 14 and 17 h d−1, 200–250 μmol m−2 s−1, and 20/20 °C, respectively. Lettuce growers can also approve a 14 h d−1, 200–250 μmol m−2 s−1, and 20/20 °C DIF combination to reduce the production cost by reducing the three-hour photoperiod at a minimal expense of the lettuce quality under glasshouse conditions. As lettuce is a long-day plant, a 11 h d−1 short-day photoperiod in combination with all light intensities did not have any promising effects and is not advisable. The zero DIF had beneficial impacts on the lettuce growth and quality parameters, whereas positive DIFs had undesirable effects. Further studies are needed to use LED as a light source to explore the combination of daily light integrals, light intensities, light qualities, and temperatures on leaves’ phenology and canopy architecture in order to design a more precise environmental mitigation strategy. Reciprocal transfer studies from a long day to a short day and from a low temperature to a high temperature—and vice versa—over a set period of time can be designed to enhance lettuce quality by improving leaf attributes. For the flowering and seed production prospective of lettuce, studies can also be designed under long-day inductive photoperiods.
Supplementary Materials
The following supporting information can be downloaded at: https://www.mdpi.com/article/10.3390/horticulturae8060515/s1, Figure S1: Correlation coefficient among various morphological, biochemical, and physiological attributes of butterhead lettuce cv. Gustav.; Table S1: Photoperiod, light intensity, and daily light integrals of butterhead lettuce.
Author Contributions
Methodology, investigation, data curation, analysis, and writing—original draft preparation: M.M. and Z.I.; conceptualization: M.M.; validation and writing: Z.I., M.M. and M.N.S.; review and editing: M.M. and M.N.S.; funding acquisition: Z.I. All authors have read and agreed to the published version of the manuscript.
Funding
The authors extend their gratitude to the Deanship of Scientific Research (DSR), King Faisal University, Saudi Arabia, for funding the publication of this work under the Annual Track Program (Project # AN000401).
Institutional Review Board Statement
Not applicable.
Informed Consent Statement
Not applicable.
Data Availability Statement
All the data related to this work are presented in the manuscript.
Acknowledgments
The authors are thankful to Sami Ullah, University of Sargodha, Pakistan, for performing the statistical analysis.
Conflicts of Interest
The authors declare no conflict of interest.
References
- FAO. Stat Food and Agriculture Organization of the United Nations Statistics Division. Available online: http://faostat3.fao.org/home/E (accessed on 25 January 2022).
- Kenny, O.; O’Beirne, D. The effects of washing treatment on antioxidant retention in ready-to-use iceberg lettuce. Int. J. Food Sci. Technol. 2009, 44, 1146–1156. [Google Scholar] [CrossRef]
- Mou, B. Nutrient Content of Lettuce and Its Improvement. Curr. Nutr. Food Sci. 2009, 5, 242–248. [Google Scholar] [CrossRef]
- Abu, M.; Osei-Kwarteng, M.; Atinpoore Atuna, R. Fertilizer effect on proximate composition and nutritive value of exotic/minor vegetable crops. J. Hortic. Post. Res. 2021, 4, 81–94. [Google Scholar]
- Zha, L.; Liu, W.; Zhang, Y.; Zhou, C.; Shao, M. Morphological and physiological stress responses of lettuce to different intensities of continuous light. Front. Plant Sci. 2019, 10, 1440. [Google Scholar] [CrossRef]
- Munir, M.; Hadley, P.; Carew, J.; Adams, S.; Pearson, S.; Sudhakar, B. Effect of constant temperatures and natural daylength on flowering time and leaf number of Antirrhinum using the photo-thermal model. Pak. J. Bot. 2015, 47, 1717–1720. [Google Scholar]
- Munir, M.; Hadley, P.; Carew, J.; Adams, S.; Pearson, S. Modification of photo-thermal model by accommodating light integrals using antirrhinum flowering and leaf number data from restricted range of environmental conditions. Pak. J. Bot 2017, 49, 181–186. [Google Scholar]
- Savvas, D.; Passam, H. Hydroponic Production of Vegetables and Ornamentals; Embryo Publications: Athens, Greece, 2002. [Google Scholar]
- Abidi, F.; Girault, T.; Douillet, O.; Guillemain, G.; Sintes, G.; Laffaire, M.; Ahmed, H.B.; Smiti, S.; Huché-Thélier, L.; Leduc, N. Blue light effects on rose photosynthesis and photomorphogenesis. Plant Biol. 2013, 15, 67–74. [Google Scholar] [CrossRef]
- Kang, J.H.; KrishnaKumar, S.; Atulba, S.L.S.; Jeong, B.R.; Hwang, S.J. Light intensity and photoperiod influence the growth and development of hydroponically grown leaf lettuce in a closed-type plant factory system. Hort. Environ. Biotechnol. 2013, 54, 501–509. [Google Scholar] [CrossRef]
- Zhang, X.; He, D.; Niu, G.; Yan, Z.; Song, J. Effects of environment lighting on the growth, photosynthesis, and quality of hydroponic lettuce in a plant factory. Int. J. Agric. Biol. Eng. 2018, 11, 33–40. [Google Scholar] [CrossRef]
- Fu, Y.; Li, H.; Yu, J.; Liu, H.; Cao, Z.; Manukovsky, N.S.; Liu, H. Interaction effects of light intensity and nitrogen concentration on growth, photosynthetic characteristics and quality of lettuce (Lactuca sativa L. Var. youmaicai). Sci. Hortic. 2017, 214, 51–57. [Google Scholar] [CrossRef]
- Dou, H.; Niu, G.; Gu, M.; Masabni, J.G. Responses of sweet basil to fifferent daily light integrals in photosynthesis, morphology, yield, and nutritional quality. HortScience 2018, 53, 496–503. [Google Scholar] [CrossRef]
- Yan, Z.; He, D.; Niu, G.; Zhai, H. Evaluation of growth and quality of hydroponic lettuce at harvest as affected by the light intensity, photoperiod and light quality at seedling stage. Sci. Hortic. 2019, 248, 138–144. [Google Scholar] [CrossRef]
- Weaver, G.; van Iersel, M.W. Longer photoperiods with adaptive lighting control can improve growth of greenhouse-grown ‘little gem’ lettuce (Lactuca sativa). HortScience 2020, 55, 573–580. [Google Scholar] [CrossRef]
- Sago, Y. Effects of light intensity and growth rate on tipburn development and leaf calcium concentration in butterhead lettuce. Hortscience 2016, 51, 1087–1091. [Google Scholar] [CrossRef]
- Demmig-Adams, B.; Cohu, C.M.; Muller, O.; Adams, W.W. Modulation of photosynthetic energy conversion efficiency in nature: From seconds to seasons. Photosynth. Res. 2012, 113, 75–88. [Google Scholar] [CrossRef]
- Rochaix, J.-D. Regulation and dynamics of the light-harvesting system. Ann. Rev. Plant Biol. 2014, 65, 287–309. [Google Scholar] [CrossRef] [PubMed]
- Ruban, A.V. Evolution under the sun: Optimizing light harvesting in photosynthesis. J. Exp. Bot. 2015, 66, 7–23. [Google Scholar] [CrossRef]
- Gent, M.P.N. Effect of daily light integral on composition of hydroponic lettuce. HortScience 2014, 49, 173–179. [Google Scholar] [CrossRef]
- Hernández, R.; Kubota, C. Growth and morphological response of cucumber seedlings to supplemental red and blue photon flux ratios under varied solar daily light integrals. Sci. Hortic. 2014, 173, 92–99. [Google Scholar] [CrossRef]
- Marcelis, L.F.M.; Broekhuijsen, A.G.M.; Meinen, E.; Nijs, E.M.F.M.; Raaphorst, M.G.M. Quantification of the Growth Response to Light Quantity of Greenhouse Grown Crops; International Society for Horticultural Science (ISHS): Leuven, Belgium, 2006; pp. 97–104. [Google Scholar]
- Both, A.J.; Albright, L.D.; Langhans, R.W.; Reiser, R.A.; Vinzant, B.G. Hydroponic Lettuce Production Influenced by Integrated Supplemental Light Levels in a Controlled Environment Agriculture Facility: Experimental Results; International Society for Horticultural Science (ISHS): Leuven, Belgium, 1997; pp. 45–52. [Google Scholar]
- Yan, Z.; He, D.; Niu, G.; Zhou, Q.; Qu, Y. Growth, nutritional quality, and energy use efficiency of hydroponic lettuce as influenced by daily light integrals exposed to white versus white plus red light-emitting diodes. HortScience 2019, 54, 1737–1744. [Google Scholar] [CrossRef]
- Cometti, N.N.; Martins, M.Q.; Bremenkamp, C.A.; Nunes, J.A. Nitrate concentration in lettuce leaves depending on photosynthetic photon flux and nitrate concentration in the nutrient solution. Hortic. Bras. 2011, 29, 548–553. [Google Scholar] [CrossRef][Green Version]
- Chen, Z.; Shah Jahan, M.; Mao, P.; Wang, M.; Liu, X.; Guo, S. Functional growth, photosynthesis and nutritional property analyses of lettuce grown under different temperature and light intensity. J. Hortic. Sci. Biotechnol. 2021, 96, 53–61. [Google Scholar] [CrossRef]
- Zhang, T.; Shi, Y.; Piao, F.; Sun, Z. Effects of different LED sources on the growth and nitrogen metabolism of lettuce. Plant Cell 2018, 134, 231–240. [Google Scholar] [CrossRef]
- Weiguo, F.; Pingping, L.; Yanyou, W.; Jianjian, T. Effects of different light intensities on anti-oxidative enzyme activity, quality and biomass in lettuce. Hortic. Sci. 2012, 39, 129–134. [Google Scholar] [CrossRef]
- Bantis, F.; Ouzounis, T.; Radoglou, K. Artificial LED lighting enhances growth characteristics and total phenolic content of Ocimum basilicum, but variably affects transplant success. Sci. Hortic. 2016, 198, 277–283. [Google Scholar] [CrossRef]
- Song, J.; Huang, H.; Hao, Y.; Song, S.; Zhang, Y.; Su, W.; Liu, H. Nutritional quality, mineral and antioxidant content in lettuce affected by interaction of light intensity and nutrient solution concentration. Sci. Rep. 2020, 10, 2796. [Google Scholar] [CrossRef]
- Ferrón-Carrillo, F.; Guil-Guerrero, J.L.; González-Fernández, M.J.; Lyashenko, S.; Battafarano, F.; da Cunha-Chiamolera, T.P.L.; Urrestarazu, M. LED enhances plant performance and both carotenoids and nitrates profiles in lettuce. Plant Foods Hum. Nutr. 2021, 76, 210–218. [Google Scholar] [CrossRef]
- Min, Q.; Marcelis, L.F.M.; Nicole, C.C.S.; Woltering, E.J. High light intensity applied shortly before harvest improves lettuce nutritional quality and extends the shelf life. Front. Plant Sci. 2021, 12, 615355. [Google Scholar] [CrossRef]
- Waycott, W. Photoperiodic response of genetically diverse lettuce accessions. J. Am. Soc. Hortic. Sci. 1995, 120, 460–467. [Google Scholar] [CrossRef]
- Thomas, B.; Vince-Prue, D. Photoperiodism in Plants, 2nd ed.; Elsevier: Academic Press: London, UK, 1996. [Google Scholar]
- Gaudreau, L.; Charbonneau, J.; Vézina, L.-P.; Gosselin, A. Photoperiod and photosynthetic photon flux influence growth and quality of greenhouse-grown lettuce. HortScience 1994, 29, 1285–1289. [Google Scholar] [CrossRef]
- Koontz, H.; Prince, R. Effect of 16 and 24 hours daily radiation (light) on lettuce growth. HortScience 1986, 21, 123–124. [Google Scholar] [PubMed]
- Owen, W.G.; Lopez, R.G. End-of-production supplemental lighting with red and blue light-emitting diodes (LEDs) influences red pigmentation of four lettuce varieties. Hortscience 2015, 50, 676–684. [Google Scholar] [CrossRef]
- Mou, B. Genetic variation of beta-carotene and lutein contents in lettuce. J. Am. Soc. Hortic. Sci. 2005, 130, 870–876. [Google Scholar] [CrossRef]
- Lefsrud, M.G.; Kopsell, D.A.; Kopsell, D.E.; Curran-Celentano, J. Irradiance levels affect growth parameters and carotenoid pigments in kale and spinach grown in a controlled environment. Physiol. Plant. 2006, 127, 624–631. [Google Scholar] [CrossRef]
- Thompson, H.C.; Langhans, R.W.; Both, A.-J.; Albright, L.D. Shoot and root temperature effects on lettuce growth in a floating hydroponic system. J. Am. Soc. Hortic. Sci. 1998, 123, 361–364. [Google Scholar] [CrossRef]
- Choi, K.Y.; Paek, K.Y.; Lee, Y.B. Effect of air temperature on tipburn incidence of butterhead and leaf lettuce in a plant factory. In Transplant Production in the 21st Century: Proceedings of the International Symposium on Transplant Production in Closed System for Solving the Global Issues on Environmental Conservation, Food, Resources and Energy; Kubota, C., Chun, C., Eds.; Springer: Dordrecht, The Netherlands, 2003; pp. 166–171. [Google Scholar]
- Jeong, S.W.; Kim, G.-S.; Lee, W.S.; Kim, Y.-H.; Kang, N.J.; Jin, J.S.; Lee, G.M.; Kim, S.T.; Abd El-Aty, A.M.; Shim, J.-H.; et al. The effects of different night-time temperatures and cultivation durations on the polyphenolic contents of lettuce: Application of principal component analysis. J. Adv. Res. 2015, 6, 493–499. [Google Scholar] [CrossRef][Green Version]
- Zhou, J.; Li, P.; Wang, J. Effects of light intensity and temperature on the photosynthesis characteristics and yield of lettuce. Horticulturae 2022, 8, 178. [Google Scholar] [CrossRef]
- Nicole, C.C.S.; Charalambous, F.; Martinakos, S.; van de Voort, S.; Li, Z.; Verhoog, M.; Krijn, M. Lettuce Growth and Quality Optimization in a Plant Factory; International Society for Horticultural Science (ISHS): Leuven, Belgium, 2016; pp. 231–238. [Google Scholar]
- Walters, K.J.; Hurt, A.A.; Lopez, R.G. Flowering, stem extension growth, and cutting yield of foliage annuals in response to photoperiod. HortScience 2019, 54, 661–666. [Google Scholar] [CrossRef]
- Zhou, J.; Li, P.; Wang, J.; Fu, W. Growth, photosynthesis, and nutrient uptake at different light intensities and temperatures in lettuce. HortScience 2019, 54, 1925–1933. [Google Scholar] [CrossRef]
- Lee, R.J.; Bhandari, S.R.; Lee, G.; Lee, J.G. Optimization of temperature and light, and cultivar selection for the production of high-quality head lettuce in a closed-type plant factory. Hortic. Environ. Biotechnol. 2019, 60, 207–216. [Google Scholar] [CrossRef]
- Kong, Y.; Nemali, K. Blue and far-red light affect area and number of individual leaves to influence vegetative growth and pigment synthesis in lettuce. Front. Plant Sci. 2021, 12, 667407. [Google Scholar] [CrossRef] [PubMed]
- Lee, H.S. Experimental Principle and Technology of Plant Physiology and Biochemistry; Higher Education Press: Beijing, China, 2000; Volume 123–124, pp. 186–191. [Google Scholar]
- Cao, J.; Jiang, W.; Zhao, Y. Physiological and Biochemical Experimental Guidance of Fruits and Vegetables; China Light Industry Press: Beijing, China, 2007; pp. 49–50. [Google Scholar]
- Bremner, J.T. Total nitrogen. In Methods of Soil Analysis: Part 2 Chemical and Microbiological Properties Agronomy Monograph; Black, C.A., Evans, D., White, J.L., Ensminger, L.E., Clark, F.E., Eds.; American Society of Agronomy, Soil Science Society of America: Madison, WI, USA, 1965; Volume 9, pp. 1149–1178. [Google Scholar]
- Olsen, S.R. Estimation of Available Phosphorus in Soils by Extraction with Sodium Bicarbonate; US Department of Agriculture: Washington, DC, USA, 1954.
- Mason, J.L. Flame photometric determination of potassium in unashed plant leaves. Anal. Chem. 1963, 35, 874–875. [Google Scholar] [CrossRef]
- Niu, S.; Jiang, G.; Wan, S.; Li, Y.; Gao, L.; Liu, M. A sand-fixing pioneer C3 species in sandland displays characteristics of C4 metabolism. Environ. Exp. Bot. 2006, 57, 123–130. [Google Scholar] [CrossRef]
- Hang, T.; Lu, N.; Takagaki, M.; Mao, H. Leaf area model based on thermal effectiveness and photosynthetically active radiation in lettuce grown in mini-plant factories under different light cycles. Sci. Hortic. 2019, 252, 113–120. [Google Scholar] [CrossRef]
- Esmaili, M.; Aliniaeifard, S.; Mashal, M.; Ghorbanzadeh, P.; Seif, M.; Gavilan, M.U.; Carrillo, F.F.; Lastochkina, O.; Li, T. CO2 enrichment and increasing light intensity till a threshold level, enhance growth and water use efficiency of lettuce plants in controlled environment. Not. Bot. Hortic. Agrobot. 2020, 48, 2244. [Google Scholar] [CrossRef]
- Solis-Toapanta, E.; Fisher, P.; Gómez, C. Growth rate and nutrient uptake of basil in small-scale hydroponics. HortScience 2020, 55, 507–514. [Google Scholar] [CrossRef]
- Fu, W.; Li, P.; Wu, Y. Effects of different light intensities on chlorophyll fluorescence characteristics and yield in lettuce. Sci. Hortic. 2012, 135, 45–51. [Google Scholar] [CrossRef]
- Gullino, M.L.; Gilardi, G.; Garibaldi, A. Evaluating severity of leaf spot of lettuce, caused by Allophoma tropica, under a climate change scenario. Phytopathol. Mediterr. 2017, 56, 235–241. [Google Scholar]
- Butelli, E.; Titta, L.; Giorgio, M.; Mock, H.-P.; Matros, A.; Peterek, S.; Schijlen, E.G.W.M.; Hall, R.D.; Bovy, A.G.; Luo, J.; et al. Enrichment of tomato fruit with health-promoting anthocyanins by expression of select transcription factors. Nat. Biotechnol. 2008, 26, 1301–1308. [Google Scholar] [CrossRef]
- Kelly, N.; Choe, D.; Meng, Q.; Runkle, E.S. Promotion of lettuce growth under an increasing daily light integral depends on the combination of the photosynthetic photon flux density and photoperiod. Sci. Hortic. 2020, 272, 109565. [Google Scholar] [CrossRef]
- Jeong, S.T.; Goto-Yamamoto, N.; Kobayashi, S.; Esaka, M. Effects of plant hormones and shading on the accumulation of anthocyanins and the expression of anthocyanin biosynthetic genes in grape berry skins. Plant Sci. 2004, 167, 247–252. [Google Scholar] [CrossRef]
- He, F.; Mu, L.; Yan, G.-L.; Liang, N.-N.; Pan, Q.-H.; Wang, J.; Reeves, M.J.; Duan, C.-Q. Biosynthesis of anthocyanins and their regulation in colored grapes. Molecules 2010, 15, 9057–9091. [Google Scholar] [CrossRef] [PubMed]
- Boo, H.-O.; Heo, B.-G.; Gorinstein, S.; Chon, S.-U. Positive effects of temperature and growth conditions on enzymatic and antioxidant status in lettuce plants. Plant Sci. 2011, 181, 479–484. [Google Scholar] [CrossRef]
- Romani, A.; Pinelli, P.; Galardi, C.; Sani, G.; Cimato, A.; Heimler, D. Polyphenols in greenhouse and open-air-grown lettuce. Food Chem. 2002, 79, 337–342. [Google Scholar] [CrossRef]
- Davey, M.W.; Montagu, M.V.; Inzé, D.; Sanmartin, M.; Kanellis, A.; Smirnoff, N.; Benzie, I.J.J.; Strain, J.J.; Favell, D.; Fletcher, J. Plant L-ascorbic acid: Chemistry, function, metabolism, bioavailability and effects of processing. J. Sci. Food Agric. 2000, 80, 825–860. [Google Scholar] [CrossRef]
- Shen, Y.Z.; Guo, S.S.; Ai, W.D.; Tang, Y.K. Effects of illuminants and illumination time on lettuce growth, yield and nutritional quality in a controlled environment. Life Sci. Space Res. 2014, 2, 38–42. [Google Scholar] [CrossRef]
- Bian, Z.-H.; Cheng, R.-F.; Yang, Q.-C.; Wang, J.; Lu, C. Continuous light from red, blue, and green light-emitting diodes reduces nitrate content and enhances phytochemical concentrations and antioxidant capacity in lettuce. J. Am. Soc. Hortic. Sci. 2016, 141, 186–195. [Google Scholar] [CrossRef]
- Schonhof, I.; Kläring, H.P.; Krumbein, A.; Claußen, W.; Schreiner, M. Effect of temperature increase under low radiation conditions on phytochemicals and ascorbic acid in greenhouse grown broccoli. Agric. Ecosyst. Environ. 2007, 119, 103–111. [Google Scholar] [CrossRef]
- Scaife, A.; Schloemer, S. The diurnal pattern of nitrate uptake and reduction by spinach (Spinacia oleracea L.). Ann. Bot. 1994, 73, 337–343. [Google Scholar] [CrossRef]
- Gruda, N. Impact of environmental variables on product quality of greenhouse vegetables for fresh consumption. Crit. Rev. Plant Sci. 2005, 24, 227–247. [Google Scholar] [CrossRef]
- Wanlai, Z.; Wenke, L.; Qichang, Y. Reducing nitrate content in lettuce by pre-harvest continuous light delivered by red and blue light-emitting diodes. J. Plant Nutr. 2013, 36, 481–490. [Google Scholar] [CrossRef]
- Guilherme, E.A.; Carvalho, F.E.L.; Daloso, D.M.; Silveira, J.A.G. Increase in assimilatory nitrate reduction and photorespiration enhances CO2 assimilation under high light-induced photoinhibition in cotton. Environ. Exp. Bot. 2019, 159, 66–74. [Google Scholar] [CrossRef]
- Qin, X.; Li, P.; Lu, S.; Sun, Y.; Meng, L.; Hao, J.; Fan, S. Phosphoproteomic analysis of lettuce (Lactuca sativa L.) reveals starch and sucrose metabolism functions during bolting induced by high temperature. PLoS ONE 2021, 15, e0244198. [Google Scholar] [CrossRef]
- Hocking, P.J. Dry-matter production, mineral nutrient concentrations, and nutrient distribution and redistribution in irrigated spring wheat. J. Plant Nutr. 1994, 17, 1289–1308. [Google Scholar] [CrossRef]
- Colonna, E.; Rouphael, Y.; Barbieri, G.; De Pascale, S. Nutritional quality of ten leafy vegetables harvested at two light intensities. Food Chem. 2016, 199, 702–710. [Google Scholar] [CrossRef] [PubMed]
- Gent, M.P.N. Effect of Temperature on Composition of Hydroponic Lettuce; International Society for Horticultural Science (ISHS): Leuven, Belgium, 2016; pp. 95–100. [Google Scholar]
- Rozentsvet, O.; Bogdanova, E.; Nesterov, V.; Bakunov, A.; Milekhin, A.; Rubtsov, S.; Dmitrieva, N. Physiological and biochemical parameters of leaves for evaluation of the potato yield. Agriculture 2022, 12, 757. [Google Scholar] [CrossRef]
- Li, Z. Vertical column and system of columnar soilless culture (SCSC) and its application to cultivation of lettuce (Capitata L.). Chin. J. Appl. Environ. Biol. 2002, 8, 142–147. [Google Scholar]
- Zhou, Y.-H.; Zhang, Y.-Y.; Zhao, X.; Yu, H.-J.; Shi, K.; Yu, J.-Q. Impact of light variation on development of photoprotection, antioxidants, and nutritional value in Lactuca sativa L. J. Agric. Food Chem. 2009, 57, 5494–5500. [Google Scholar] [CrossRef]
- Langton, F.A.; Adams, S.R.; Cockshull, K.E. Effects of photoperiod on leaf greenness of four bedding plant species. J. Hortic. Sci. Biotechnol. 2003, 78, 400–404. [Google Scholar] [CrossRef]
- Sharma, L.; Priya, M.; Bindumadhava, H.; Nair, R.; Nayyar, H. Influence of high temperature stress on growth, phenology and yield performance of mungbean [Vigna radiata (L.) Wilczek] under managed growth conditions. Sci. Hortic. 2016, 213, 379–391. [Google Scholar] [CrossRef]
- Patriyawaty, N.R.; Rachaputi, R.C.N.; George, D. Physiological mechanisms underpinning tolerance to high temperature stress during reproductive phase in mungbean (Vigna radiata (L.) Wilczek). Environ. Exp. Bot. 2018, 150, 188–197. [Google Scholar] [CrossRef]
- Fan, X.-X.; Xu, Z.-G.; Liu, X.-Y.; Tang, C.-M.; Wang, L.-W.; Han, X.-l. Effects of light intensity on the growth and leaf development of young tomato plants grown under a combination of red and blue light. Sci. Hortic. 2013, 153, 50–55. [Google Scholar] [CrossRef]
- Urban, J.; Ingwers, M.W.; McGuire, M.A.; Teskey, R.O. Increase in leaf temperature opens stomata and decouples net photosynthesis from stomatal conductance in Pinus taeda and Populus deltoides x nigra. J. Exp. Bot. 2017, 68, 1757–1767. [Google Scholar] [CrossRef]
- Yu, L.; Chen, X.; Wang, Z.; Wang, S.; Wang, Y.; Zhu, Q.; Li, S.; Xiang, C. Arabidopsis enhanced drought tolerance1/HOMEODOMAIN GLABROUS11 confers drought tolerance in transgenic rice without yield penalty. Plant Physiol. 2013, 162, 1378–1391. [Google Scholar] [CrossRef] [PubMed]
- Fanourakis, D.; Aliniaeifard, S.; Sellin, A.; Giday, H.; Körner, O.; Rezaei Nejad, A.; Delis, C.; Bouranis, D.; Koubouris, G.; Kambourakis, E.; et al. Stomatal behavior following mid- or long-term exposure to high relative air humidity: A review. Plant Physiol. Biochem. 2020, 153, 92–105. [Google Scholar] [CrossRef] [PubMed]
- Ghorbanzadeh, P.; Aliniaeifard, S.; Esmaeili, M.; Mashal, M.; Azadegan, B.; Seif, M. Dependency of growth, water use efficiency, chlorophyll fluorescence, and stomatal characteristics of lettuce plants to light intensity. J. Plant Grow. Regul. 2021, 40, 2191–2207. [Google Scholar] [CrossRef]
Publisher’s Note: MDPI stays neutral with regard to jurisdictional claims in published maps and institutional affiliations. |
© 2022 by the authors. Licensee MDPI, Basel, Switzerland. This article is an open access article distributed under the terms and conditions of the Creative Commons Attribution (CC BY) license (https://creativecommons.org/licenses/by/4.0/).