Article

Spirulina platensis Foliar Spraying Curcuma longa Has Improved Growth, Yield, and Curcuminoid Biosynthesis Gene Expression, as Well as Curcuminoid Accumulation

by
Munirah F. Al Dayel
1,* and
Fadia El Sherif
1,2
1
Department of Biological Sciences, Faculty of Science, King Faisal University, Al Hofuf 31982, Saudi Arabia
2
Department of Horticulture, Faculty of Agriculture, Suez Canal University, Ismaïlia 8366004, Egypt
*
Author to whom correspondence should be addressed.
Horticulturae 2022, 8(6), 469; https://doi.org/10.3390/horticulturae8060469
Submission received: 25 April 2022 / Revised: 19 May 2022 / Accepted: 21 May 2022 / Published: 25 May 2022

Abstract

:
The application of Spirulina platensis aqueous extract (SAE) in foliar spraying has been shown to promote plant growth and yield, as well as to modify the compositions of bioactive chemicals in various plant species. Curcuma longa is an antioxidant-rich medicinal herb that is used as a spice and culinary additive. The application of a natural plant growth enhancer, SAE, to C. longa plants was used in this study to test the effect of SAE for increasing active chemical production. The effects of SAE on the growth, yield and chemical composition of C. longa were investigated. SAE boosted the C. longa growth, yield and curcuminoid content, with SAE at 2 g/L having the most impact. The CURS-1, -2, -3 and DCS genes were found to be differentially elevated by SAE treatments in this investigation. When the plant was sprayed with SAE at 2 g/L, the curcuminoid content (bisdemethoxycurcumin, dimethoxycurcumin and curcumin) increased, which corresponded with the curcuminoid gene’s expression level.

1. Introduction

The undeniable need to safeguard the environment and combat the negative impacts of climate change on agriculture has led to the widespread reintroduction of plant extracts and algae as means of increasing agricultural yields and preventing and treating plant illnesses. These extracts are biodegradable and have low to no toxicity for both animals and humans [1].
Spirulina platensis, a type of cyanobacterium, is a green-blue microalgae that can help increase soil fertility, crop development and production and environmental quality in sustainable agriculture. Beyond those uses, in recent years, there has been an increasing interest in its application in agriculture for biofertilizers and plant growth biostimulants [2,3,4,5].
Curcuma longa L. (Curcuma; turmeric) is a perennial herbaceous plant of the Zingiberaceae family [6]. Rhizomes are the most often used plant portion and contain a wide range of chemicals, including bioactive non-volatile curcuminoids (curcumin, dimethoxy- and bisdemethoxy-curcumin), as well as volatile oil molecules (mono- and sesquiterpenoids) [7,8].
Curcuminoids, especially curcumin, are the most important bioactive elements of turmeric, with antioxidant, anticancer, anti-inflammatory, anti-acidogenic, radioprotective and neuroprotective characteristics [7,9]. The DCS (diketide-CoA synthase), CURS-1 (curcumin synthase 1), CURS-2 and CURS-3 genes were discovered to be involved in the process of curcuminoid metabolism in C. longa [10,11,12,13].
The goal of this study was to see how foliar Spirulina platensis aqueous extract (SAE) spraying affected the vegetative development and bioactive components of C. longa plants. The expression patterns of curcuminoid genes in the rhizomes were evaluated using real-time qRT-PCR to elucidate the molecular mechanisms behind the responses to Spirulina platensis treatments.

2. Materials and Methods

2.1. Preparation of Spirulina platensis Aqueous Extract (SAE)

Spirulina platensis powder was purchased from Earth Circle Organics (USA). S. platensis powder (1, 2 and 3 g) was separately ground in 50 mL of cold (4 °C) deionized water using a mortar and pestle for 1 min. The S. platensis paste from the three preparations were then centrifuged in a refrigerated centrifuge for 10 min at 8000× g. The clear supernatant from each preparation (1, 2 and 3 g) was collected into three separate volumetric flasks (1 L). The volume in each flask was top up to 1 L using cold distilled water to obtain the corresponding SAE at 1, 2 and 3 g/L concentrations [14].

2.2. Analysis of Spirulina platensis Powder Compositions

Extraction and identification of vitamins in S. platensis powder was carried out according to the methods of [15,16]. For water soluble vitamins, ten grams of S. platensis powder were homogenized with methanol, while fat-soluble vitamins were extracted with acetone–chloroform (30:70 v/v). The mixtures were agitated for 5 min on a vortex mixer, centrifuged for 5 min at 4000 rpm, then filtered through a Millipore filter (45 µm). The filtrates were evaporated, and the residues were re-dissolved in 1 mL of water for water soluble vitamins and in 1 mL butanol for fat-soluble vitamins. Analysis of vitamins was performed using HPLC. HPLC separation and quantitation were performed at an ambient temperature (25 °C) with a C18 Inertsil (4.6 mm × 250 mm, 5 µm) column. The mobile phase was prepared by mixing acetic acid in water (6:94 v/v) for water soluble vitamins and methanol:water (98:2 v/v) for fat soluble vitamins. The flow rate was maintained at 1 mL/min. Quantification of fat- and water-soluble vitamins were performed at a wavelength of 220 nm and 254 nm respectively. The mobile phase was filtered using a 0.45-μm membrane filter (Millipore, Milford, MA, USA) and was degassed by a vacuum before use.
Fat, fiber, moisture, protein, starch and ash percentage were determined using the near-infrared spectroscopy (NIRS) method according to [17,18]. S. platensis powder was dried for 48 h at 60 °C in an air-forced oven. For a minimum of 48 h, dried samples were allowed to equilibrate to ambient moisture levels at room temperature. A Foss NIRS DS2500 (Near Infrared Spectroscopy, Copenhagen, Denmark) analyzer was used to scan the samples, which recorded data every 0.5 nm from 400 to 2500 nm. The average of three replicates of near-infrared spectroscopy was calculated. Model calibration was done using fecal near-infrared spectroscopy in the range of 1105 to 2450. The compositions from the above analysis are documented in Table 1.

2.3. Plant Materials and Growth Conditions

The experiment was conducted under greenhouse conditions in 2021 at the Agriculture and Veterinary Research and Training Center, King Faisal University, Al-Ahasa, Saudi Arabia. During the experiment, the temperature ranged between 32 and 36 °C, the relative humidity was 47–56%, and the average photoperiod was 14 h. Turmeric rhizomes (Agriculture and Veterinary Research and Training Center, King Faisal University, Saudi Arabia) were sown on 1 April 2021. Germination was carried out by sowing rhizomes in trays (depth of 1–2 cm) filled with a moist mixture of sand and peat moss (1:1 v:v). Turmeric seedlings, 5 cm tall and with three pairs of leaves, were transplanted into sandy soil (Table 2). and placed 40 cm × 40 cm from each other [19]. Each plot was 120 cm × 160 cm (19.20 m2), with 20 plants in each plot and 10 replicates of each treatment. As detailed in [3], the study used distilled water as a control and three concentrations of SAE (1, 2 and 3 g/L) as treatment groups. SAE (Table 1) solutions containing the surfactant (0.1 percent triton) were sprayed on the entire foliage three times in the morning (8–9 a.m.) at two-month intervals. The volume of sprayed solution per plant was roughly 50 mL each time. The control plants received the same amount of deionized water plus 0.1 percent Triton as the experimental plants. As needed, all of the plants were irrigated with ground water. The compositions and properties of soil (Table 2) and the ground water (Table 3) were measured as described in [19]. After eight months of cultivation, the whole plant was harvested, and the plant height (cm), number of leaves (n), number of roots and rhizomes/plant (n), dry weight of the leaves, roots and rhizomes/plant (g) and rhizome diameter (mm) were recorded using 10 random plants from each treatment group.

2.4. Chemical Analysis

2.4.1. Measurement of Photosynthetic Pigments

A fresh leaf located third from the bottom of each of six randomly selected eight-month-old turmeric plants was removed. Fresh leaves in a quantity of 0.5 g were macerated in 5 mL of acetone for 48 h in the dark using 80% acetone. Vacuum filtration through a centered glass funnel G4 was used for filtering. The residue was washed with acetone numerous times until the filtrate was colorless, according to [20]. The amounts of chlorophyll a and b, as well as carotenoid, were measured. Using an Agilent 8453 UV–visible spectrophotometer (Agilent Technologies, Santa Clara, CA, USA). the absorbance was calculated as (mg/100 g fresh weight).

2.4.2. Mineral Composition of Plant Leaves and Powder of S. platensis

Plant leaf samples were dried for 48 h at 60 °C 270 days after planting. Sulfuric acid was used to decompose dry leaf samples and S. platensis powder [21]. The modified micro-Kjeldahl technique was used to determine the nitrogen content [22]. Calorimetry was used to measure the phosphorus content, as reported in [23], and atomic absorption flame photometry was used to determine the potassium (K), iron (Fe) and manganese (Mg) content, as described in [24]. Analysis was performed on soil samples collected at the end of the experiment. Soil and water analyses were performed according to [25].

2.5. GC/MS Analysis

One gram each of the homogenized air-dried rhizome powder of three randomly selected turmeric plants from each treatment group, along with one from the control (i.e., control and 1, 2 and 3 g/L of SAE), carried out separately, was added to a 28 milliliter stoppered culture tube and defatted by 30 mL ethanol for one day with shaking at 100 rpm on a rotary shaker. The extracts were filtered through a 0.2-micrometer syringe filter, and 2 µL was injected into the GC/MS system. Gas chromatography–mass spectrometry (GC–MS) was performed at the Department of Chemistry, Faculty of Science, King Faisal University using a GC 1310-ISQ mass spectrometer (Thermo Scientific, Austin, TX, USA) with a direct capillary column TG–35MS (30 m × 0.25 mm × 0.25 µm film thickness). The separation conditions and method for identifying the separated components were as described by [3].

2.6. Determination of Curcumin, Bisdemethoxycurcumin and Demethoxycurcumin Contents by High-Performance Liquid Chromatography (HPLC)

2.6.1. Instrumentation

HPLC analysis was performed using a Waters 2690 Alliance HPLC system (Waters, Milford, MA, USA) equipped with a Waters 996 photodiode array detector (Waters, Milford, MA, USA).

2.6.2. Preparation of Curcumin, Bisdemethoxycurcumin and Demethoxycurcumin Standard Curves

Authentic curcumin (≥99.5%), bisdemethoxycurcumin (≥98%) and demethoxycurcumin (≥98%) were purchased from Sigma–Aldrich (Darmstadt, Germany).
A stock solution of 1 mg/mL of three standards was prepared and diluted in methanol to obtain standard solutions of 10, 20, 30, 40, 50 and 60 μg/mL. All standard solutions were filtered using 0.22-μm syringe filters, and 10 μL of each standard solution was injected into the HPLC system per run.

2.6.3. Preparation of C. longa Rhizome Ethanolic Extracts

Five grams each of the homogenized, air-dried rhizome powder of three randomly selected turmeric plants from each treatment group and the control (i.e., control and 1, 2 and 3 g/L of SAE) was combined with 50 mL of ethanol for four days using a maceration technique. All ethanol supernatants collected were combined and placed in a rotary evaporator (Büchi Labortechnik AC, Flawil, Switzerland) operated at 40 °C, to remove the solvent completely. Five hundred milligram of the residue (ethanolic extract) was then dissolved in 5 mL of the mobile phase (0.1% trifluoroacetic acid in water/acetonitrile (50:50%)), and the solution was filtered using a 0.22 μm syringe filter. For each sample, 10 μL of filtrate was injected into the HPLC system.

2.6.4. HPLC Analysis Conditions

HPLC separation and quantitation were performed at an ambient temperature with a C18 Inertsil (4.6 mm × 250 mm, 5 µm) column. The mobile phase was prepared by mixing 0.1% trifluoroacetic acid in water with acetonitrile (50:50%). The flow rate was maintained at 1.5 mL/min. All determinations were performed at an ambient temperature (25 °C), at a wavelength of 420 nm. The mobile phase was filtered using a 0.45 μm membrane filter (Millipore, Milford, MA, USA) and was degassed by a vacuum before use.

2.7. Analysis of CURS-1, -2, -3 and DCS Gene Expression by Real-Time Reverse Transcriptase Polymerase Chain Reaction (Real-Time RT-PCR)

2.7.1. Total RNA Preparation and cDNA Synthesis

Rhizomes were collected from four randomly selected eight-month-old plants of each treatment group and the control (i.e., control and 1, 2 and 3 g/LSAE) (second season) and stored at −80 °C until RNA extraction was performed. RNA was extracted from the frozen rhizome samples using an RNeasy Mini Kit (Qiagen cat. no. 74104, Germantown, MD, USA) according to the manufacturer’s protocol. The quantity and quality of the extracted total RNA from each sample were analyzed using a NanoDropTM 2000c spectrophotometer (Thermo Fisher Scientific, Waltham, MA, USA). Additionally, cDNA synthesis was performed using the ReadyScriptTM cDNA synthesis mix (Sigma–Aldrich cat. no. RDRT) according to the manufacturer’s protocol. The reaction was incubated at 25 °C for 5 min, followed by a 30 min incubation at 42 °C and final heating to 85 °C for 5 min.

2.7.2. Real-Time RT-PCR and Curcuminoid Gene Expression Analysis

Real-time PCR containing 2 µL of the cDNA reaction mixture, 0.3 µM concentrations (final concentrations) of each forward and reverse primer (Table 4), 12.5 µL of SYBR Green PCR Master Mix (QuantiTech SYBR Green PCR Kit, Qiagen cat. no. 204143), 1 µL of RNase inhibitor and a final volume of 25 µL of RNase-free water was set up. Primers for the target (CURS-1, -2 and -3 and DCS) and housekeeping (Actin) genes were designed according to the gene sequences available in GenBank (Table 4). The real-time reaction was performed using an Applied Biosystems 7500 Real-Time PCR System under the following conditions: 95 °C initial heating for 10 min, followed by 45 cycles of 95 °C for 20 s and 60 °C for 1 min. PCR was performed in duplicate in addition to the non-template control (NTC) and negative cDNA template. The specificity of the amplified product was verified by performing melting curve analyses at the end of the amplification cycles. The CURS-1, -2 and -3 as well as DCS (target) gene expressions were normalized with that of the actin (reference) gene and quantified using the 2−−△△CT method [26]. Relative expressions of the CURS-1, -2 -3 and DCS genes in SAE (1, 2, 3 g/L) treatments were expressed as fold expressions of that of the control treatment.

2.8. Statistical Analysis

A completely randomized block design with 20 repetitions was used in the experiment. ANOVA was used to statistically analyze the data using Statistica 6 software from StatSoft [27]. At p = 0.05, the significance of differences between means was determined using the least significant difference test (LSD).

3. Results

3.1. Effect of SAE on Plant Development and Yield

The means of the vegetative growth parameters are presented in Table 5. The data show that there were significant changes in the plant height, leaf and root numbers and dry weight of the leaves of plants in the SAE treatment groups compared to the control. With an increasing SAE concentration, the plant height increased compared to control treatments (Table 5). We found that 2 g/L gave the highest number of leaves and root dry weight among all four treatments; this increase was significant in the case of the leaf number. In contrast, 1 g/L of SAE produced the greatest number of roots, longest root lengths and highest dry weight of leaves among all four treatments (Table 5).
In terms of yield, the numbers of rhizomes, rhizome dry weights and rhizome diameters in the SAE-treated groups were higher than those in the control group, and the difference was statistically significant. The highest rhizome number [19], rhizome dry weight (21.27 g) and rhizome diameter (19.48 mm) were obtained with the 2 g/L SAE treatment, while the lowest rhizome number (3.25), rhizome dry weight (11.35 g) and rhizome diameter (14.58 mm) were observed with the control treatment (Table 6).

3.2. Chemical Analysis

Photosynthetic Pigments and Mineral Contents

The data in Table 7 show that SAE treatments positively affected the chlorophyll a and b and carotenoid contents compared to the control treatment. The 3 g/L SAE treatment yielded higher values compared to the 1 and 2 g/L SAE treatments for all recorded parameters (Table 7). The data in Table 8 show that 2 g/LSAE increased the nitrogen (N) content in the leaves of C. longa compared with the control plants and other SAE treatments. On the other hand, the control treatment resulted in higher phosphorus (P) and potassium (K) contents in the C. longa leaves compared to the SAE treatments (Table 8).

3.3. Gas Chromatography–Mass Spectrometry (GC-MS) Analysis of Ethanolic Extract
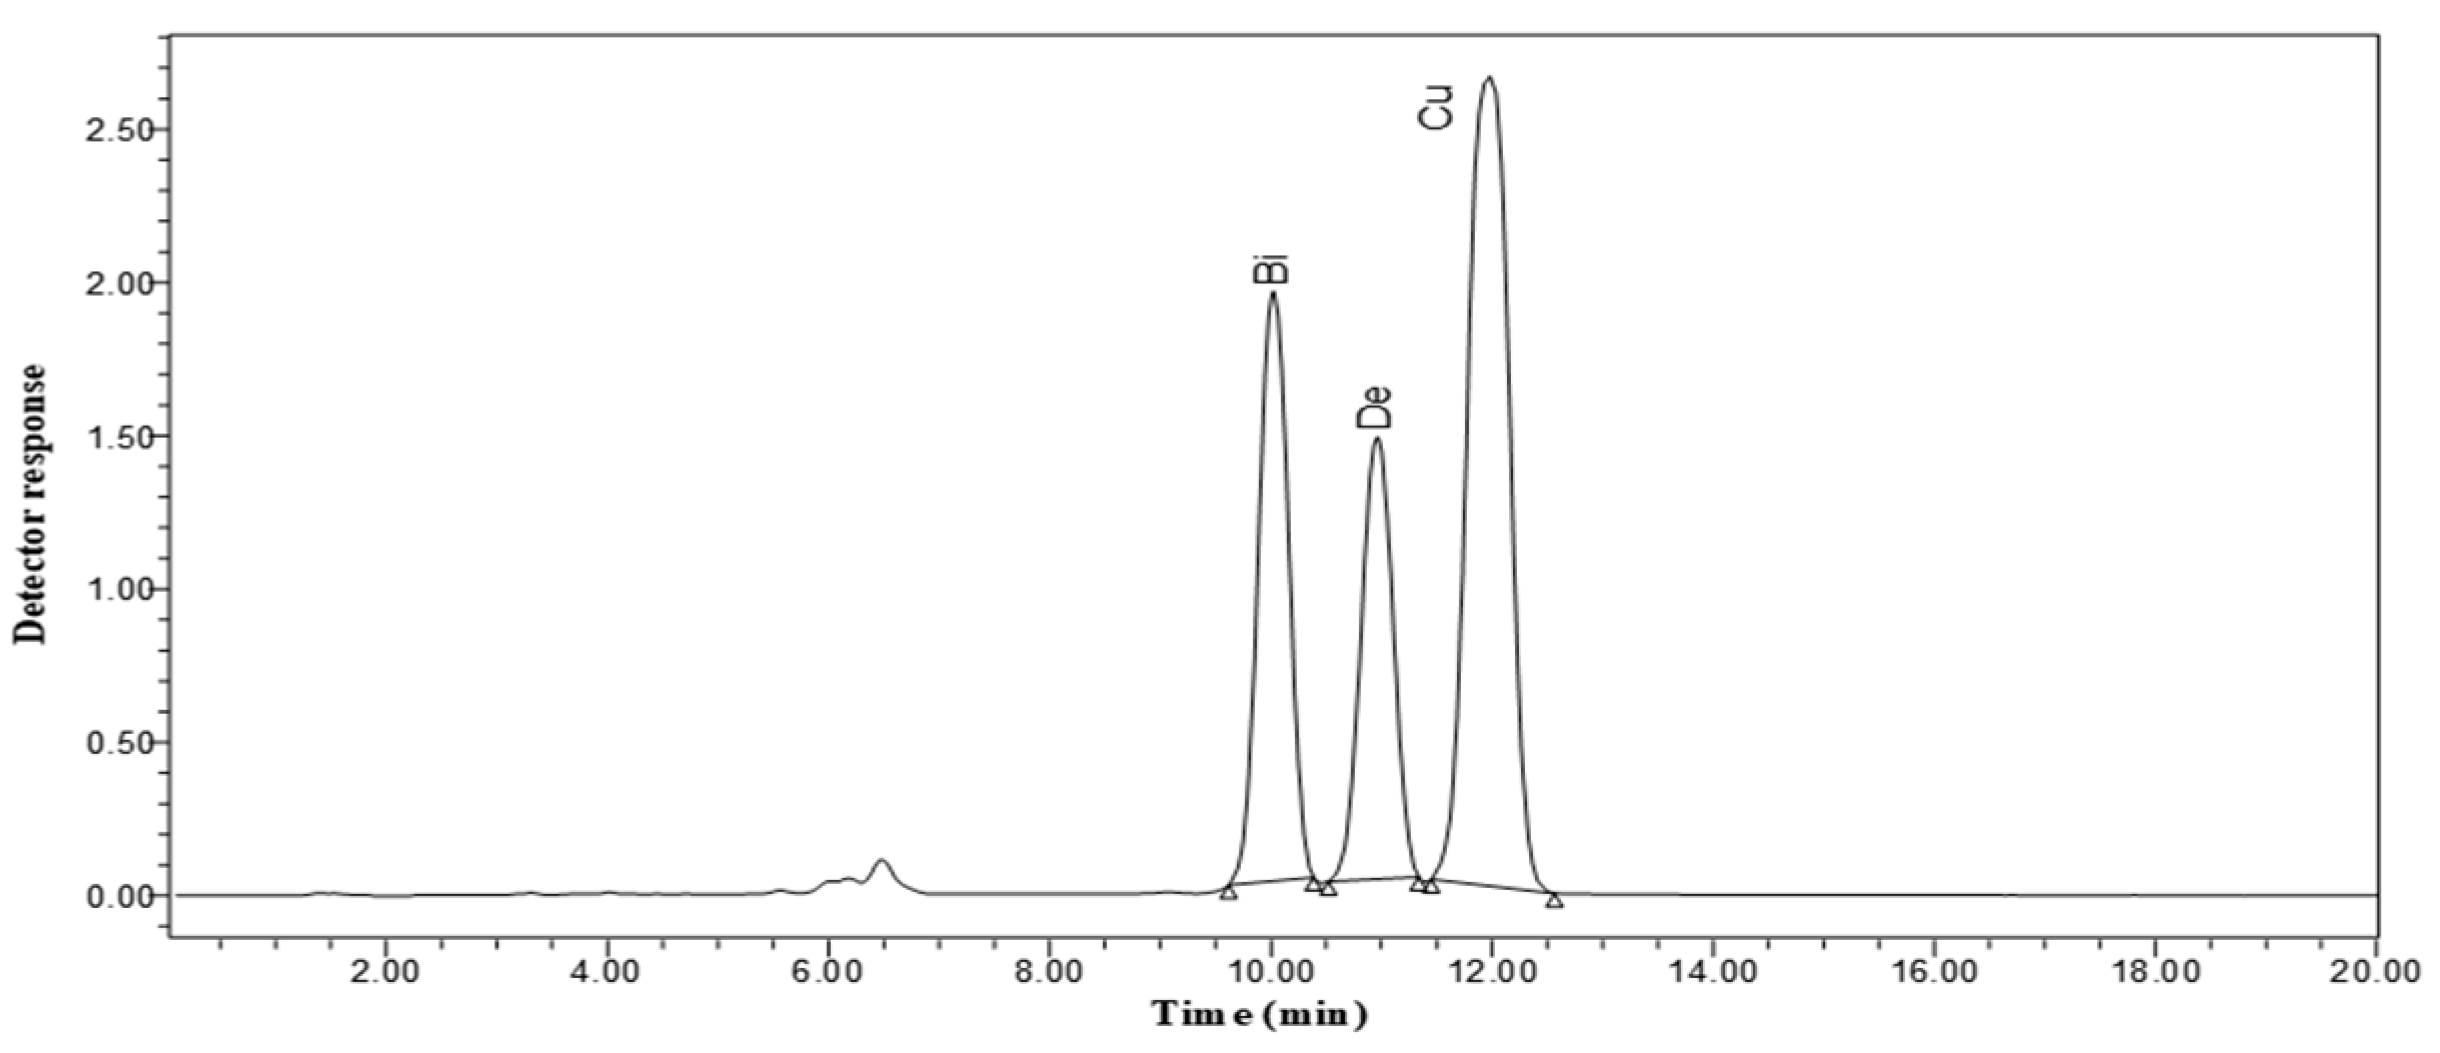
GC-MS was used to examine ethanolic extracts of C. longa rhizomes obtained from treatments with different SAE concentrations as well as the control (Table 9). Following GC-MS analysis, at least 15 components were discovered in the ethanolic extracts of the C. longa rhizomes. Table 9 and Table S1 lists the names of the compounds and their retention times (RTs), peak areas (in percentage), molecular formulas and molecular weights. Substantial amounts of coumarin, vanillin, caryophyllene, alpha-curcumene, ar-turmerone and curlone were present in the extracts of all treatments. These six components have been documented as the major components of C. longa essential oil. When compared to control treatments, SAE raised the compounds coumarin, vanillin, caryophyllene and alpha-curcumene, with 2 g/L SAE having the largest effect, resulting in a 2.03-, 2.28-, 3.22- and 2.03-fold increase in these compounds, respectively (Table 9), while 1 g/L SAE resulted in respective 1.0- and 1.37-fold increases in ar-turmerone and curlone compared to the control (Table 9). A few unique compounds were detected only in particular treatments. For instance, thymol, cis-linoleic acid, oleic acid and ethyl ester compounds were detected in all the SAE treatment groups (Table 9). Beyond those, in the 1 and 2 g/L SAE treatments, zingiberene and cedr-8(15)-ene compounds were discovered, with 2 g/L of SAE yielding the highest amounts of both compounds (Table 9).

3.4. HPLC Results

The effects of different SAE concentrations on the production of secondary metabolites in C. longa rhizomes were investigated (Table 10 and Figure 1). The amounts of bisdemethoxycurcumin, dimethoxycurcumin and curcumin present in the ethanolic extracts were quantified using high-performance liquid chromatography (HPLC) by comparison with a standard curve prepared using a series of bisdemethoxycurcumin, dimethoxycurcumin and curcumin solutions with known concentrations. SAE treatments significantly increased the bisdemethoxycurcumin, dimethoxycurcumin and curcumin levels compared to the control treatment (Table 10). As the SAE concentration increased, the effect on all three compounds increased (Table 10). Foliar spraying with 2 g/L of SAE resulted in a significant increase in the bisdemethoxycurcumin, dimethoxycurcumin and curcumin levels by approximately 3.09-, 2.7- and 2.3-fold, respectively, compared with the control treatment (Table 10 and Figure 2).

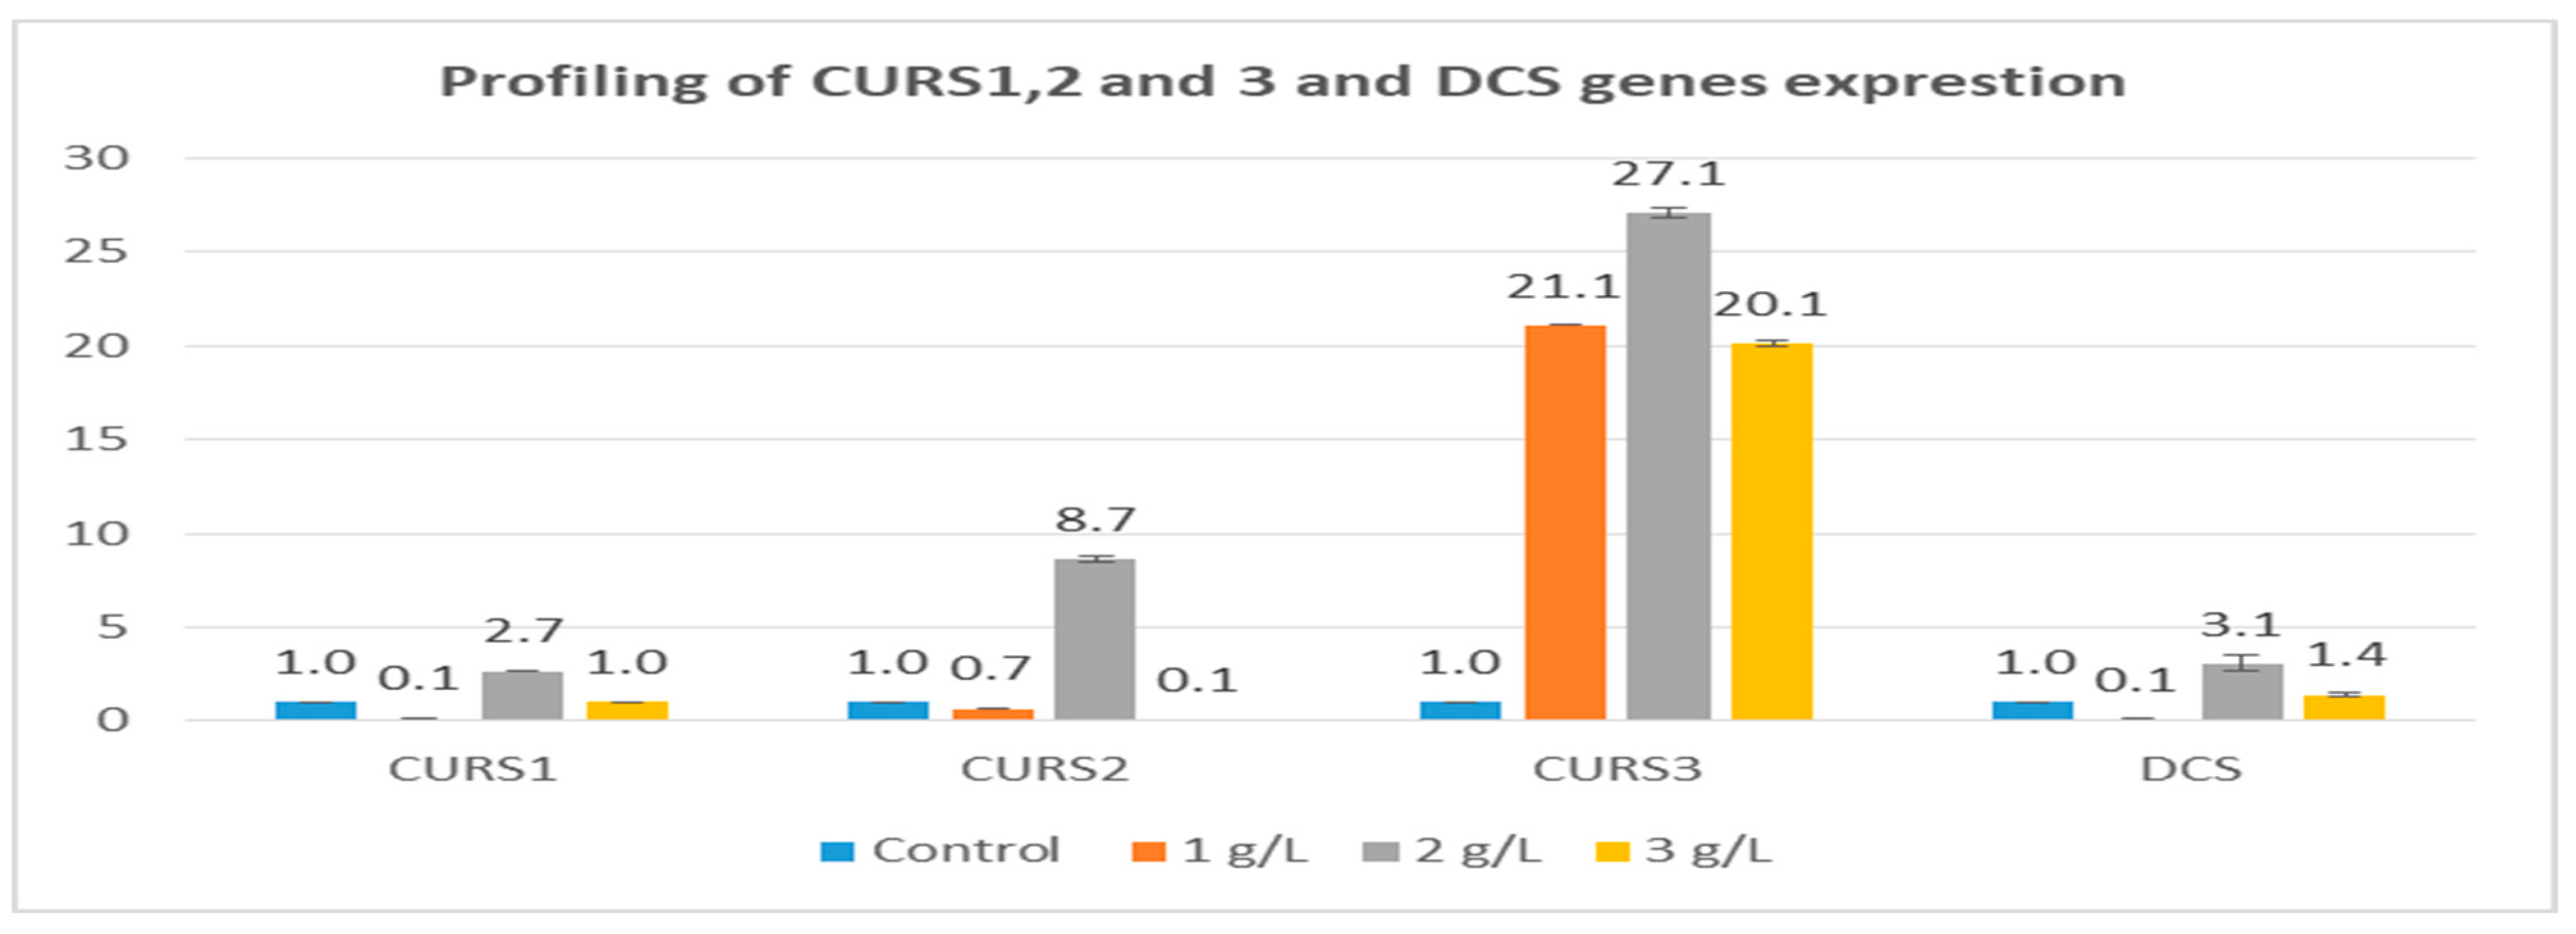
3.5. Effect of SAE on the Expression of Curcuminoid Biosynthesis Genes

In this study, our results indicated that the CURS-1, -2, -3 and DCS genes were upregulated differentially by SAE treatments. The results showed that the expression level of the CURS-3 gene was higher following SAE foliar application compared to the control treatment (Figure 2). The CURS-1, -2, -3 and DCS genes had higher expression levels under the 2 g/L SAE treatment compared to the control and 1 and 3 g/L SAE treatments (Figure 2). Using 3 g/L of SAE increased the DCS gene (1.4-fold) compared to the control. Downregulation of the CURS-1 and DCS genes was observed under the 1 g/L SAE treatment compared to the control treatment. In addition, downregulation of the CURS-2 gene was observed in both the 1 and 3 g/L SAE treatments when compared to the control treatment (Figure 2).

4. Discussion

The effects of foliar spraying of C. longa plants with different concentrations of SAE on the vegetative growth, yield, phytochemical composition and expression patterns of curcuminoid genes were investigated. Our data indicate that foliar spraying with SAE increased the plant growth parameters, rhizome yield and photosynthetic pigments in C. longa plants compared to the control treatment. SAE at 2 g/L had the most favorable effect on the plant height, number of leaves, dry weight of the root and N contents in the leaves, which correlated with the highest rhizome number, rhizome dry weight and rhizome diameter.
The importance of SAE in providing plants with complex compounds produced by these organisms could be related to the improved development and yield characteristics of C. longa plants in this study. Proteins, vitamins, vital amino acids and minerals are abundant in S. platensis powder (Table 3) [28,29], and all of these metabolites are necessary for plant development and growth. Stimulants can boost fertilizer uptake, increase nutrient and water intake, increase photosynthetic rate and dry matter partitioning, and hence increase crop yield [30,31]. The effects of foliar spraying of SAE on plant development and productivity have been thoroughly documented [28,32,33,34,35,36,37]. Yet, no one analytical technique has yet been able to detect the whole metabolome of higher plants, notably medicinal and aromatic species, due to their great number of chemically diverse metabolites [38]. In this study, we used GC–MS and HPLC to detect distinct chemical components in C. longa plants treated with various SAE concentrations, along with control plants. GC–MS was used to evaluate the bioactive components of C. longa ethanolic rhizome extract.
The results showed that the coumarin, vanillin, caryophyllene and alpha-curcumene compounds were all increased by the SAE treatments, with the 2 g/L SAE treatment having the greatest effect. The thymol, cis-linoleic acid, oleic acid and ethyl ester compounds were found in all SAE-treated plants, while SAE treatments at 1 and 2 g/L also produced zingiberene and cedr-8(15)-ene compounds. Polyphenolic curcuminoids, including bisdemethoxycurcumin, dimethoxycurcumin and curcumin, found in C. longa play a significant role in food, cosmetics and medicinal compounds. Curcuminoids have extensive biological activities with antioxidant, neuroprotective, antitumor, anti-inflammatory, anti-acidogenic and radioprotective properties [9].
HPLC examination of bisdemethoxycurcumin, dimethoxycurcumin and curcumin revealed that the SAE treatments greatly enhanced these compounds compared to the control, with the effect of SAE at 2 g/L on height resulting in the largest amounts of the three compounds mentioned. The SAE elicitor action on the synthesis of secondary metabolites in medicinal plants has previously been assessed [3,14,32,39].
The current study’s findings of concomitant upregulation of curcuminoid synthase (CURS-1, -2, -3 and DCS) genes and bisdemethoxycurcumin, dimethoxycurcumin and curcumin composition were consistent with previous findings that showed that accumulation of major products of secondary metabolism in plants has been linked to the expression of coordinate genes in response to appropriate elicitors [40,41,42]. Yet, the roles of each of the CURS-1, -2 and -3 genes, as well as the DCS gene, in the accumulation of bisdemethoxycurcumin, dimethoxycurcumin and curcumin molecules remain unclear.

5. Conclusions

According to our findings, SAE appears to be a good elicitor for enhancing C. longa plant growth and rhizome yield. In C. longa, SAE foliar spraying has been demonstrated to stimulate plant growth and yield, as well as change the compositions of bioactive compounds. Plant growth, yield, photosynthetic pigment concentration, and nitrogen content all improved when SAE was added to the foliar spray. Two grams per liter of SAE was a better elicitor than 1 or 3 g/L of SAE or the control treatment in terms of rhizome yield and effective compound. In this study, the CURS-1, -2, -3, and DCS genes were revealed to be differently upregulated by SAE treatments. The curcuminoid content (bisdemethoxycurcumin, dimethoxycurcumin, and curcumin) increased when the plant was sprayed with SAE at 2 g/L, which corresponded with the curcuminoid gene’s expression level.

Supplementary Materials

The following supporting information can be downloaded at: https://www.mdpi.com/article/10.3390/horticulturae8060469/s1, Table S1: components name, retention time (min), molecular weight and molecular formula identified by GC-MS analysis in the C. longa ethanolic rhizome extracts from different Spirulina platensis aqueous extract (SAE) treatments.

Author Contributions

Conceptualization, F.E.S. and M.F.A.D.; methodology and formal analysis, F.E.S.; data curation and writing—original draft preparation, F.E.S. and M.F.A.D.; writing—review and editing. All authors have read and agreed to the published version of the manuscript.

Funding

The authors extend their appreciation to the Deanship of Scientific Research, King Faisal University, for funding this research work through grant number AN000634.

Institutional Review Board Statement

Not applicable.

Informed Consent Statement

Not applicable.

Data Availability Statement

Not applicable.

Acknowledgments

The authors are grateful for support from Salah Khattab and Yun-Kiam Yap of the Department of Biological Sciences, College of Science, King Faisal University, as well as the greenhouse personnel at King Faisal University’s Agriculture and Veterinary Research and Training Centre, is greatly appreciated.

Conflicts of Interest

The authors declare no conflict of interest.

References

  1. López, I.; Martínez, L.; Pérez, G.; Reyes, Y.; Núñez, M.; Cabrera, J. Algae and their uses in agriculture. An update. Cultiv. Trop. 2020, 41, 1–10. [Google Scholar]
  2. Anitha, L.; Sai Bramari, G.; Kalpana, P. Effect of Supplementation of Spirulina platensis to Enhance the Zinc Status in Plants of Amaranthus gangeticus, Phaseolus aureus and Tomato. Adv. Biosci. Biotechnol. 2016, 7, 289–299. [Google Scholar] [CrossRef] [Green Version]
  3. El Sherif, F.; Albotnoor, N.; Yap, Y.K.; Meligy, A.; Khattab, S. Enhanced bioactive compounds composition in Lavandula officinalis in-vitro plantlets using NaCl and Moringa oleifera, Aloe vera and Spirulina platensis extracts. Ind. Crops Prod. 2020, 157, 112890. [Google Scholar] [CrossRef]
  4. Yanni, Y.G.; Elashmouny, A.A.; Elsadany, A.Y. Differential Response of Cotton Growth, Yield and Fiber Quality to Foliar Application of Spirulina platensis and Urea Fertilizer. Asian J. Adv. Agric. Res. 2020, 12, 29–40. [Google Scholar] [CrossRef] [Green Version]
  5. Godlewska, K.; Michalak, I.; Pacyga, P.; Baśladyńska, S.; Chojnacka, K. Potential applications of cyanobacteria: Spirulina platensis filtrates and homogenates in agriculture. World J. Microbiol. Biotechnol. 2019, 35, 80. [Google Scholar] [CrossRef] [Green Version]
  6. Ahmad, W.; Hasan, A.; Ansari, A.; Tarannum, T. Curcuma longa, Linn—A Review. Hippocrat. J. Unani Med. 2010, 5, 179–190. [Google Scholar]
  7. Sharifi-Rad, J.; El Rayess, Y.; Rizk, A.A.; Sadaka, C.; Zgheib, R.; Zam, W.; Sestito, S.; Rapposelli, S.; Neffe-Skocińska, K.; Zielińska, D.; et al. Turmeric and Its Major Compound Curcumin on Health: Bioactive Effects and Safety Profiles for Food, Pharmaceutical, Biotechnological and Medicinal Applications. Front. Pharmacol. 2020, 11, 1021. [Google Scholar] [CrossRef]
  8. Itokawa, H.; Shi, Q.; Akiyama, T.; Morris-Natschke, S.L.; Lee, K.H. Recent advances in the investigation of curcuminoids. Chin. Med. 2008, 3, 11. [Google Scholar] [CrossRef] [Green Version]
  9. Amalraj, A.; Pius, A.; Gopi, S.; Gopi, S. Biological activities of curcuminoids, other biomolecules from turmeric and their derivatives—A review. J. Tradit. Complement. Med. 2017, 7, 205–233. [Google Scholar] [CrossRef] [Green Version]
  10. Katsuyama, Y.; Kita, T.; Funa, N.; Horinouchi, S. Curcuminoid biosynthesis by two type III polyketide synthases in the herb Curcuma longa. J. Biol. Chem. 2009, 284, 11160–11170. [Google Scholar] [CrossRef] [Green Version]
  11. Katsuyama, Y.; Kita, T.; Horinouchi, S. Identification and characterization of multiple curcumin synthases from the herb Curcuma longa. FEBS Lett. 2009, 583, 2799–2803. [Google Scholar] [CrossRef] [PubMed] [Green Version]
  12. Chakraborty, A.; Mahajan, S.; Jaiswal, S.K.; Sharma, V.K. Genome sequencing of turmeric provides evolutionary insights into its medicinal properties. Commun. Biol. 2021, 4, 1193. [Google Scholar] [CrossRef] [PubMed]
  13. Sandeep, I.S.; Das, S.; Nasim, N.; Mishra, A.; Acharya, L.; Joshi, R.K.; Nayak, S.; Mohanty, S. Differential expression of CURS gene during various growth stages, climatic condition and soil nutrients in turmeric (Curcuma longa): Towards site specific cultivation for high curcumin yield. Plant Physiol. Biochem. 2017, 118, 348–355. [Google Scholar] [CrossRef] [PubMed]
  14. Amin, G.H.; Al-Gendy, A.A.; Yassin, M.E.A.; Abdel-Motteleb, A. Effect of Spirulina platensis extract on growth, phenolic compounds and antioxidant activities of Sisymbrium irio callus and cell suspension cultures. Aust. J. Basic Appl. Sci. 2009, 3, 2097–2110. [Google Scholar]
  15. Qian, H.; Sheng, M. Simultaneous determination of fat-soluble vitamins A, D and E and pro-vitamin D2 in animal feeds by one-step extraction and high-performance liquid chromatography analysis. J. Chromatogr. A 1998, 825, 127–133. [Google Scholar] [CrossRef]
  16. Shindy, W.W.; Smith, O.E. Identification of Plant Hormones from Cotton Ovules. Plant Physiol. 1975, 55, 550–554. [Google Scholar] [CrossRef] [PubMed] [Green Version]
  17. Noel, S.J.; Jørgensen, H.J.H.; Knudsen, K.E.B. The use of near-infrared spectroscopy (NIRS) to determine the energy value of individual feedstuffs and mixed diets for pigs. Anim. Feed Sci. Technol. 2022, 283, 115156. [Google Scholar] [CrossRef]
  18. González-Martín, I.; Álvarez-García, N.; González-Cabrera, J.M. Near-infrared spectroscopy (NIRS) with a fibre-optic probe for the prediction of the amino acid composition in animal feeds. Talanta 2006, 69, 706–710. [Google Scholar] [CrossRef]
  19. Buurman, P.; Van Lagen, B.; Velthorst, E.J. WfM Manual for Soil and Water Analysis; Backhuys Publishers: Leiden, The Netherlands, 1996. [Google Scholar]
  20. A.O.A.C. Official Method of Analysis of the Association of Official Chemist, 14th ed.; Official Methods of Analysis; Howitz, Ed.; AOAC International: Washington DC, USA, 1984. [Google Scholar]
  21. Piper, C.S. Soil and Plant Analysis; Hans Publishers: Wuhan, China, 1942. [Google Scholar]
  22. Jackson, M.L. Soil Chemica Analysis; Prentice Hall: New Delhi, India, 1967. [Google Scholar]
  23. Murphy, J.; Riley, J.P. A modified single solution method for the determination of phosphate in natural waters. Anal. Chim. Acta 1962, 27, 31–36. [Google Scholar] [CrossRef]
  24. Mazumdar, B.; Majumder, K.; Mazumdar, B.C.; Majumder, K. Methods of Physiochemical Analysis of Fruits; Daya Publi. India, Daya Publishing House: Delhi, India, 2003. [Google Scholar]
  25. Olsen, S.R.; Sommers, L.E. Phosphorus. In Methods of Soil Analysis—Part 2: Chemical and Microbiological Properties, 9.2.2, 2nd ed.; Page, A.L., Ed.; American Society of Agronomy Inc. Publ.: Madison, WI, USA; SSSA: Madison, WI, USA, 1982; Volume 9, pp. 403–430. [Google Scholar]
  26. Livak, K.J.; Schmittgen, T.D. Analysis of relative gene expression data using real-time quantitative PCR and the 2−ΔΔCT method. Methods 2001, 25, 402–408. [Google Scholar] [CrossRef]
  27. StatSoft STATISTICA for Windows, Version 6, 2300; StatSoft Inc.: Tulsa, OK, USA, 2001.
  28. Jufri, A.F.; Sudradjat; Sulistyono, E. Effects of Dry Spirulina platensis and Antitranspirant on Growth and Yield of Chili Pepper (Capsicum annuum L.). J. Agron. Indones. 2016, 44, 170–175. [Google Scholar] [CrossRef] [Green Version]
  29. Anvar, A.A.; Nowruzi, B. Bioactive Properties of Spirulina: A Review. Microb. Bioact. 2021, 4, 134–142. [Google Scholar] [CrossRef]
  30. Shalaby, T.A.; El-Ramady, H. Effect of foliar application of bio-stimulants on growth, yield, components, and storability of garlic (Allium sativum L.). Aust. J. Crop Sci. 2014, 8, 271–275. [Google Scholar]
  31. Papenfus, H.B.; Kulkarni, M.G.; Stirk, W.A.; Finnie, J.F.; Van Staden, J. Effect of a commercial seaweed extract (Kelpak) and polyamines on nutrient-deprived (N, P and K) okra seedlings. Sci. Hortic. 2013, 151, 142–146. [Google Scholar] [CrossRef]
  32. Abdallah, M.A.; Salem, S.M.M.; Hendi, D.M.G. Effect of Nitrogen Fertilizer Rates and Microalgae Application on the Vegetative Growth and Biochemical Constituents of Sweet Basil Plants. J. Hortic. Sci. Ornam. Plants 2019, 11, 244–251. [Google Scholar] [CrossRef]
  33. Akgül, F. Effect of Spirulina platensis (Gomont) Geitler Extract on Seed Germination of Wheat and Barley. Alınteri Zirai Bilimler Dergisi 2019, 34, 148–153. [Google Scholar] [CrossRef]
  34. Shaaban, M.M.; Abou-Zaid, E.A.A. Growth, yield and berries quality in Red Roomy grapevines improved under different foliar application of Spirulina algae, zinc and boron. Middle East J. Agric. Res. 2019, 8, 654–661. [Google Scholar]
  35. Dias, G.A.; Rocha, R.H.C.; Araújo, J.L.; De Lima, J.F.; Guedes, W.A. Growth, yield, and postharvest quality in eggplant produced under different foliar fertilizer (Spirulina platensis) treatments. Semin. Cienc. Agrar. 2016, 37, 3893–3902. [Google Scholar] [CrossRef] [Green Version]
  36. Morsy, N. Productivity and Quality of Kohlrabi Grown in a Newly Reclaimed Sandy Soil Using Organic and Mineral-N Fertilizer regimes with or without Spraying of Spirulina platensis Extract. Egypt. J. Hortic. 2019, 46, 169–178. [Google Scholar] [CrossRef] [Green Version]
  37. Geries, L.S.M.; Elsadany, A.Y. Maximizing growth and productivity of onion (Allium cepa L.) by Spirulina platensis extract and nitrogen-fixing endophyte Pseudomonas stutzeri. Arch. Microbiol. 2021, 203, 169–181. [Google Scholar] [CrossRef]
  38. Liu, R.; Bao, Z.X.; Zhao, P.J.; Li, G.H. Advances in the study of metabolomics and metabolites in some species interactions. Molecules 2021, 26, 3311. [Google Scholar] [CrossRef] [PubMed]
  39. Amer, H.M.; Marrez, D.A.; Salama, A.B.; Wahba, H.E.; Khalid, K.A. Growth and chemical constituents of cardoon plant in response to foliar application of various algal extracts. Biocatal. Agric. Biotechnol. 2019, 21, 101336. [Google Scholar] [CrossRef]
  40. Yap, Y.K.; El-sherif, F.; Habib, E.S.; Khattab, S. Moringa oleifera leaf extract enhanced growth, yield and silybin content while mitigating salt-induced adverse effects on the growth of Silybum marianum. Agronomy 2021, 11, 2500. [Google Scholar] [CrossRef]
  41. Alkuwayti, M.A.; El-Sherif, F.; Yap, Y.K.; Khattab, S.; Alkuwayti, M.A. ESFYYK and KS. Foliar application of Moringa oleifera leaves extract altered stress-responsive gene expression and enhanced bioactive compounds composition in Ocimum basilicum. S. Afr. J. Bot. 2020, 129, 291–298. [Google Scholar] [CrossRef]
  42. Lan, T.T.P.; Huy, N.D.; Luong, N.N.; Quang, H.T.; Tan, T.H.; Thu, L.T.A.; Loc, N.H. Effect of salicylic acid and yeast extract on curcuminoids biosynthesis gene expression and curcumin accumulation in cells of Curcuma zedoaria. J. Plant Biotechnol. 2019, 46, 172–179. [Google Scholar] [CrossRef] [Green Version]
Figure 1. HPLC chromatogram of organic extract of C. longa exposed to 2 g/LSAE. Show curcuminoids compounds bisdemethoxycurcumin (Bi), dimethoxycurcumin (De) and curcumin (Cu).
Horticulturae 08 00469 g001
Figure 2. Differential expression profiling of curcuminoid synthase genes, CURS-1, CURS-2, CURS-3 and DCS, in C. longa rhizomes from control and SAE (1, 2 and 3 g/L)-treated plants. The CUR-1, -2 and -3 as well as DCS gene expressions were [26] The CURS-1, -2, -3 and DCS genes in SAE (1, 2 and 3 g/L) treatments were expressed as fold expressions of that of the control.
Horticulturae 08 00469 g002
Table 1. Chemical composition of Spirulina platensis powder.
Chemical CompositionAmountUnit
Iron6000mg/100 g
Phosphorus2000mg/100 g
Manganese3000mg/100 g
Thiamin7000mg/100 g
Riboflavin5000mg/100 g
Vitamin B31000mg/100 g
Vitamin E1000mg/100 g
Fat2.4%
Fiber1.19%
Moisture10.23%
Protein58.51%
Starch1.81%
Ash5.48%
Table 2. Physical and chemical properties of the experimental soil.
CharacteristicValue
TextureSandy
Sand %91.51
Silt %5.74
Clay %2.75
Saturation %23
pH 7.5
Electrical conductivity (EC) (dS/m)2.2
Organic matter (OM) %0.05
Total N %0.014
Available P ppm3.9
Available K ppm110
Table 3. Chemical properties and compositions of the irrigation water.
Salinity Level (ppm) Cations (meq/L)Anions (meq/L)Sodium Adsorption Ratio (SAR)
Ca2+Mg2+Na+K+CO32−HCO3SO42−Cl
8645.722.027.270.380.282.684.038.43.43
Table 4. Sequences of forward and reverse primers for real-time RT-PCR.
GenePrimers SequenceAmplicon Length (bp)GenBank Accession NumberReferences
Diketide-CoA
synthase
(DCS)
5′-GTGCTGTTCATCCTGGACGAG-3′ (forward primer)21AB495006.1[10]
5′-CAACAGCACGCCCCAGTCGA-3′ (reverse primer)20
Curcumin synthase 1
(CURS-1)
5′-CATCATTGACGCCATCGAAGC-3′ (forward primer)21AB495007.1[10]
5′-TCAGCTCATCCATCACGAAGTACAC-3′ (reverse primer)25
Curcumin synthase 2
(CURS-2)
5′-TCGGGATCAAGGACTGGAACAAC-3′ (forward primer)23AB506762.1[10]
5′-TGTTGCCGAACTCGGAGAAGAC-3′ (reverse primer)22
Curcumin synthase 3
(CURS-3)
5′-TGGAGCCCTCCTTCGACGACC-3′ (forward primer)21AB506763.1[10]
5′-CCCATTCCTTGATCGCCTTTTCC-3′ (reverse primer)23
Actin5′-GGATATGCTCTTCCTCATGCT-3′ (forward primer)21CP002686.1
AK118354.1
AY087740.1
[10]
5′-TCTGCTGTGGTGGTGAATGA-3′ (reverse primer)20
Table 5. Effects of Spirulina platensis aqueous extract (SAE) treatments on the plant height (cm), number (n) of leaves and roots, dried weight (g) of leaves and roots of C. longa.
SAE (g/L)Plant Height(cm)No. of Leaves (n)No. of Roots (n)Root Length (cm)Leaves Dried Weight (g)Roots Dried Weight (g)
Control97.5 b *9.50 b19.25 b12.25 b0.825 b9.60 b
SAE (1)145 a13.67 ab65.00 a21.67 a3.63 a38.77 a
SAE (2)147 a19.00 a52.00 a18.17 a3.10 a46.63 a
SAE (3)155 a13.25 ab56.50 a20.50 a3.35 a42.15 a
* Means followed by the same letter within a column are not significantly different at 0.05 level of probability according to L.S.D. test.
Table 6. Effects of Spirulina platensis aqueous extract (SAE) treatments on the number (n) of rhizomes, rhizomes dried weight and rhizome diameter (mm) of C. longa.
SAE (g/L)No. of Rhizomes (n)Rhizome Dried Weight (g)Rhizome Diameters (mm)
Control3.25 b *11.35 b14.58 b
SAE (1)12.67 a14.57 ab18.11 a
SAE (2)19.00 a21.27 a19.46 a
SAE (3)14.75 a16.18 ab17.93 a
* Means followed by the same letter within a column are not significantly different at 0.05 level of probability according to L.S.D. test.
Table 7. Effects of Spirulina platensis aqueous extract (SAE) treatments on the chlorophyll a (chl a), b (chl b), and carotenoid contents of C. longa leaves.
SAE (g/L)Chl a
(mg/100 g F.W.)
Chl b
(mg/100 g F.W.)
Carotenoids
(mg/100 g F.W.)
Control62.23 b *28.34 b78.99 b
SAE (1)69.96 b28.97 b79.54 b
SAE (2)82.59 a33.62 ab94.94a b
SAE (3)87.09 a38.44 a100.31 a
* Means followed by the same letter within a column are not significantly different at 0.05 level of probability according to L.S.D. test.
Table 8. Effects of Spirulina platensis aqueous extract (SAE) treatments on nitrogen (N), phosphorus (P) and potassium (K) percentage in Curcuma longa leaves.
SAE (g/L)N%P (ppm)K (ppm)
Control16.14 a *0.0399 a11.45 a
SAE (1)13.66 a0.0199 b9.57 bc
SAE (2)18.90 a0.0245 b10.65 ab
SAE (3)15.55 a0.0205 b9.41 c
* Means followed by the same letter within a column are not significantly different at 0.05 level of probability according to L.S.D. test.
Table 9. Components identified by GC-MS analysis in the C. longa ethanolic rhizome extracts from different Spirulina platensis aqueous extract (SAE) treatments. Each area (%) was calculated from the measurements obtained from the ethanolic extracts of 3 plantlets. ND means non detectable.
PhytochemicalComposition (Area %)
ControlSEA (1 g)SEA (2 g)SEA (3 g)
(-)-alpha-cedreneNDNDND1.33
(-)-ZingibereneND0.270.40ND
(1,1-Dimethyldodecyl)benzeneNDNDND7.12
2,4,4-Trimethyl-3-(3-methylbutyl)cyclohex-2-enone1.691.832.304.00
3-Methyl-but-2-enoic acid, 1,7,7-trimethyl-bicyclo[2.2.1]hept-2-yl ester0.18NDNDND
4-Fluorophenol0.390.16NDND
4-Hydroxy-3-methylacetophenone0.093.483.63ND
4-PropylphenolND0.07NDND
alpha.-Curcumene1.011.352.081.13
Ar-tumerone0.6949.2943.5242.2
Benzene, (1,1-dimethylnonyl)-ND1.49ND1.70
Benzene, 1,4-dimethyl-2-(2-methylpropyl)-ND2.03NDND
beta.-Sesquiphellandrene1.64NDNDND
Caryophyllene49.050.220.290.16
Cedr-8(15)-eneND1.452.14ND
cis oleic acidNDND0.561.35
cis-Linoleic acidND0.770.720.90
Coumaran0.861.281.751.64
cuminoneNDNDND0.26
Curlone5.3527.9221.2822.25
Cyclohexanecarboxylic acid, 3-phenylpropyl ester22.02NDNDND
Germacron2.66NDNDND
Humulane-1,6-dien-3-olNDND1.19ND
Linoleic acid ethyl esterNDND0.700.97
M-cymene4.30NDNDND
Oleic AcidND0.68NDND
Oleic acid, ethyl esterND0.560.300.70
Palmetic acidND2.70NDND
Pentadecanoic acidND1.52ND2.72
ThymolND0.090.210.04
Tumerone3.491.067.125.33
Vanillin3.070.780.890.87
Table 10. Effects of Spirulina platensis aqueous extract (SAE) treatment on bisdemethoxycurcumin, demethoxycurcumin and curcumin (ug/mL) accumulation of C. longa.
SAE (g/L)Bisdemethoxycurcumin (ug/mL)Demethoxycurcumin (ug/mL)Curcumin (ug/mL)
Control210.392 d *156.008 d559.867 d
SAE (1)558.227 b358.859 b1190.234 b
SAE (2)651.199 a422.195 a1300.827 a
SAE (3)276.799 c231.947 c857.027 c
* Means followed by the same letter within a column are not significantly different at 0.05 level of probability according to L.S.D. test.
Publisher’s Note: MDPI stays neutral with regard to jurisdictional claims in published maps and institutional affiliations.

