Article

The Phenolic Composition of Hops (Humulus lupulus L.) Was Highly Influenced by Cultivar and Year and Little by Soil Liming or Foliar Spray Rich in Nutrients or Algae

by
Sandra Afonso
1,2,
Maria Inês Dias
1,
Isabel C. F. R. Ferreira
1,
Margarida Arrobas
1,
Mário Cunha
2,3,
Lillian Barros
1,* and
Manuel Ângelo Rodrigues
1,*
1
Centro de Investigação de Montanha (CIMO), Instituto Politécnico de Bragança, Campus de Santa Apolónia, 5300-253 Bragança, Portugal
2
Faculdade de Ciências, Universidade do Porto, Rua do Campo Alegre, s/n, 4169-007 Porto, Portugal
3
Institute for Systems and Computer Engineering, Technology and Science (INESCTEC), Campus da Faculdade de Engenharia da Universidade do Porto, Rua Dr. Roberto Frias, 4200-465 Porto, Portugal
*
Authors to whom correspondence should be addressed.
Horticulturae 2022, 8(5), 385; https://doi.org/10.3390/horticulturae8050385
Submission received: 15 February 2022 / Revised: 24 April 2022 / Accepted: 26 April 2022 / Published: 27 April 2022

Abstract

:
The interest in expanding the production of hops outside the traditional cultivation regions, mainly motivated by the growth of the craft brewery business, justifies the intensification of studies into its adaptation to local growing conditions. In this study, four field trials were undertaken on a twenty-year-old hop garden, over periods of up to three years to assess the effect of important agro-environmental variation factors on hop phenol and phenolic composition and to establish its relationship with the elemental composition of hop cones. All the field trials were arranged as factorial designs exploring the combined effect of: (1) plots of different vigour plants × year; (2) plots of different plant vigor × algae- and nutrient-rich foliar sprays × year; (3) plot × liming × year; and (4) cultivars (Nugget, Cascade, Columbus) × year. Total phenols in hops, were significantly influenced by most of the experimental factors. Foliar spraying and liming were the factors that least influenced the measured variables. The year had the greatest effect on the accumulation of total phenols in hop cones in the different trials and may have contributed to interactions that often occurred between the factors under study. The year average for total phenol concentrations in hop cones ranged from 11.9 mg g−1 to 21.2 mg g−1. Significant differences in quantity and composition of phenolic compounds in hop cones were also found between cultivars. The phenolic compounds identified were mainly flavonols (quercetin and kaempferol glycosides) and phenolic carboxylic acids (p-coumaric and caffeic acids).

1. Introduction

The most important hop (Humulus lupulus L.) compounds for brewing are resins and essential oils, which are responsible for beer bitterness and flavour. Both are synthesized in the lupulin glands of female cones [1,2]. Hop cones also contain other important compounds, such as polyphenols, which contribute to beer flavour, colour, taste and haze formation and have a strong antioxidant power [3,4]. Hop polyphenols include flavonols (e.g., quercertin and kaempferol), flavan-3-ol (e.g., catechins and epicatechins), phenolic acids (e.g., ferulic acid), prenylflavonoids (xanthohumol, isoxanthohumol, desmethylxanthohumol, 6- and 8-prenylnaringenin), multifidus glycosides and resveratrol [1,5,6]. The polyphenolic fraction of hops is so complex that researchers still continue to identify compounds [1,7].
In Portugal, hop plants occur spontaneously along riverbanks, in particular in the north of the country, a region that has been found to have some ecological potential for hop production [8]. The crop was introduced into the country in the early 1960s and currently the national production is located mainly in the Bragança district in the northeast of the country. Nugget, a bitter cultivar, is produced on all the local farms, being destined for a national brewing company. However, local farmers are currently interested in growing aroma cultivars due to the recent growth of the craft beer industry both at home and abroad. According to the Euromonitor [9] report “Beer in Portugal”, dozens of craft brewers launched different craft beer products in 2019. Currently Cascade and Columbus are some of the aroma cultivars that regional farmers are starting to experiment with. With the expansion of the craft beer market, new opportunities arise for small-scale growers, producing and supplying desirable cultivars at more favourable prices [10]. The growing of aroma cultivars for the craft beer market is probably also more suited to the Portuguese production structure, which is based on small-sized plots. To reduce the risk of failure, as occurred during recent years with the bitter cultivars grown for the conventional beer industry, greater knowledge should be applied to the Portuguese production system. In other Mediterranean countries, hops also attracted the attention of producers and researchers, and recent work has shown good suitability of different cultivars both for the beer industry [11] and for the production of fresh edible shoots [12,13,14]. Thus, an important step for Portuguese farmers is comparing the agronomic performance of other cultivars sought by the craft beer industry with the well-established Nugget. The response of hops to soil pH, for instance, is also important to be understood since pH is an important factor in hop production [15,16]. Farmers are currently starting to use foliar sprays to complement their fertilization programmes, given the potential beneficial effects of such products in crop production and quality [17,18]. There is also growing interest in the use of biofertilizer formulations from readily available materials to improve soil conditions and plant yield [19,20]. Over the years, some fields have been showing patches of poorly developed plants that reduce overall productivity and farmers’ incomes [21]. Strictly speaking, the cause of these underdeveloped plant is not yet clearly known. There are no signs of phytosanitary problems. Thus, it is important to look at these patches of poorly developed plants and observe the effect of foliar sprays on hop cone quality.
As mentioned above, previous studies have shown that hops can be a promising crop for Mediterranean environments, although it is necessary to improve several aspects of the cropping technique [11]. Thus, this study aims to carry out a set of experimental trials to test important factors (plant vigour, foliar sprays, liming, cultivar and year) that can influence the quality of the cones and particularly phenol concentration and phenolic composition. A high content of phenols is a positive trait of hop cones, due to their bioactive effect, which contributes to beer quality [4,5,6]. The field trials included four factorial designs exploring the combined effects of (1) plots of different vigour plants and year, (2) plots of different vigour plants, algae- and nutrient-rich foliar sprays and year, (3) plots, liming and year and (4) cultivars and year. From these trials, the concentration of polyphenols in hop cones is reported. The samples presenting the higher polyphenolic content from each of the trials, were selected for phenolic characterization. Furthermore, the relationship between total phenols and nutrient concentration in hop cones was evaluated through a principal component analysis (PCA) and correlation analysis. The results of the elemental composition of hop cones, already reported in previous studies [22,23,24], were used to evaluate their relationship with hop phenols. Data on dry matter (DM) yield and hop acids from these experiments have also been reported [21,22,23,24], but the relevant information to understand the accumulation of phenols in plants in response to the different factors of variation was discussed here. In short, the ultimate objective of this research was to obtain useful data for both hop producers and the craft beer industry.

2. Materials and Methods

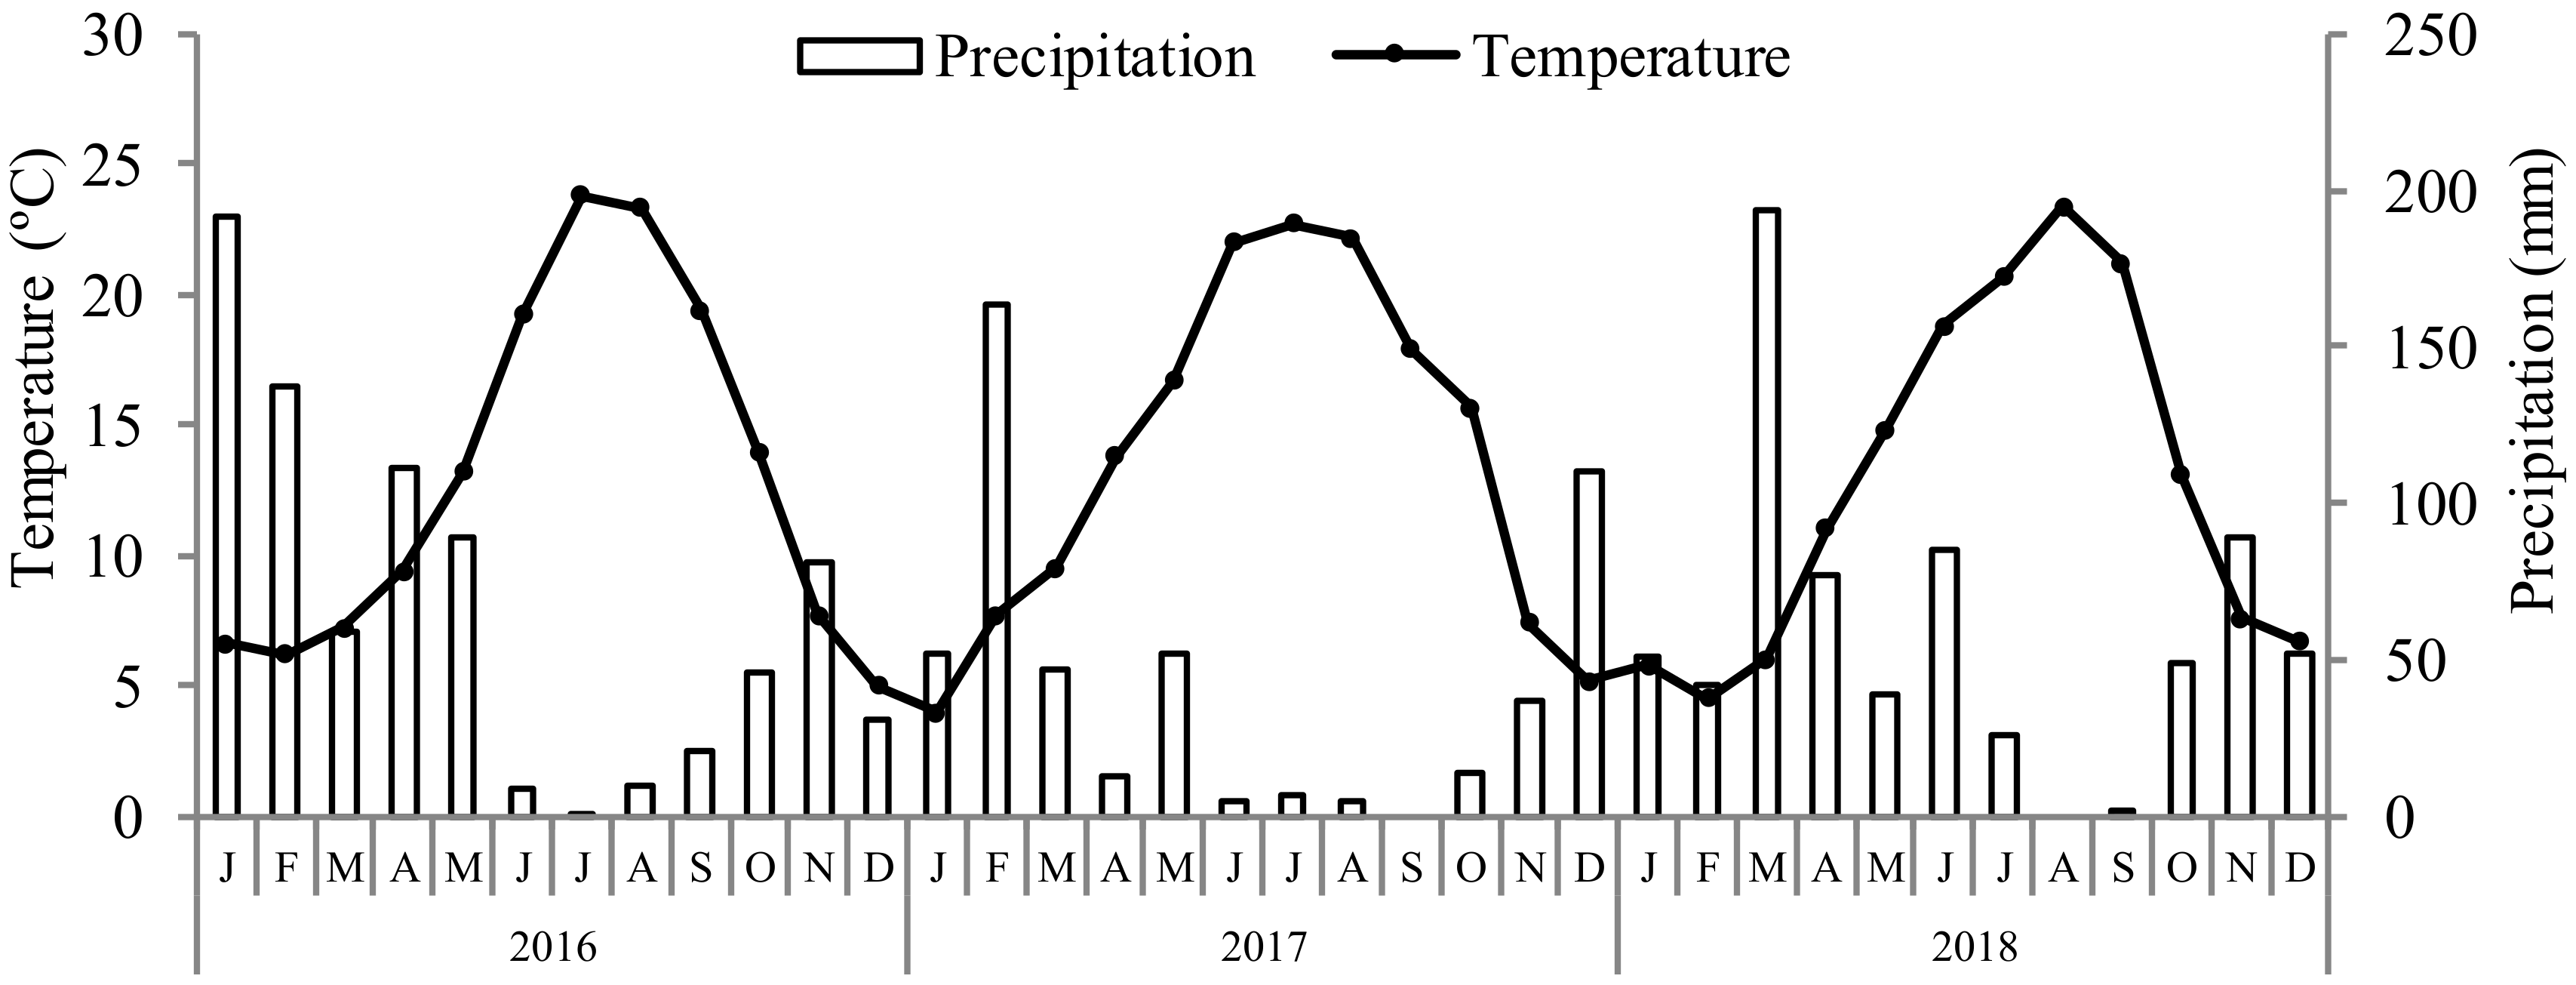
2.1. Experimental Conditions

The field trials were conducted on hop farms located in Bragança (41°41′33.6″ N, 6°44′32.7″ W, and 850 m above sea level), north-eastern Portugal, from 2016 to 2018. The region benefits from a Mediterranean-type climate, with an average annual temperature and precipitation of 12.7 °C and 772.8 mm, respectively [25]. Data on average monthly temperatures and precipitation during the experimental period are shown in Figure 1.
Six plots, named here as Plot 1 (~0.5 ha), Plot 2 (~0.5 ha), Plot 3 (~4 ha), Plot 4 (~2 ha), Plot 5 (~2 ha) and Plot 6 (~2 ha), were used in this experimental protocol. The classification of the fields was made with the farmers’ help and was based on the crop growth and yield in the previous years. In Plot 1, the plants were classified as weak vigour plants, as the hop bines did not reach 4 m in height. In Plot 2, the growth of the plants was classified as fair, as the plants did not reach the top of the pole (7 m). In Plot 3, the vigour of the plants was classified as good, as the hop bines exceeded 7 m in height, but the volume of the canopies, aboveground biomass and cone production were clearly below optimal. In the Plots 4, 5 and 6, the vigour of plants was classified as very good vigour, since the hop bines reached a full size and produced abundantly.
Before the installation of the trials, all the plots were analysed for soil properties. The soil samples were collected in three replicates at 0–0.20 m depth. Each replicate was a composite sample, prepared from soil collected from 15 random points. The samples were oven-dried at 40 °C and sieved in a mesh of 2 mm. Thereafter, they were analysed for pHH2O (soil: solution, 1:2.5), cation-exchange capacity (ammonium acetate, pH 7.0), organic C (wet digestion, Walkley–Black method), extractable P and K (Egner–Riehm method) and soil separates [26]. The results of the soil analysis are presented in Table 1.
All the plots where the experiments took place were grown on a high trellis system supported by concrete poles and a network of steel cables placed at a height of 7 m. The hop bines were guided from the ground to the upper net with nylon threads. At planting, the seedlings were spaced at 2.8 m × 1.6 m between and within rows. Two tutors emerged from each original place where the seedlings were planted, giving rise to a density of 2232 plants per hectare, which were trained in Spring into two twin canopies.
The plots were irrigated by flooding the space between rows. Farmers estimate the average use of 6000 m3 of water per hectare and per year, equivalent to 600 mm. From the end of May to mid-August they perform an average of 10 watering events of 60 mm each.
The floor was managed by tillage (3 to 4 passes per year), which has a double function of controlling weeds and removing the superficial crust caused by this irrigation method allowing a better water infiltration at subsequent irrigation events.
All the plots received an annual fertilization plan consisting of the application of a compound NPK (7:14:14) fertilizer late in winter (just before plant regrowth from winter resting period) at a rate of ~500 kg ha−1. Thereafter, during the growing season, two side dress N applications were performed by using ~200 kg ha−1 of ammonium nitrate (27% N) (applied when plants were close to reach the top wire) followed by ~450 kg ha−1 of calcium nitrate (15.5% N) (applied at early flowering).

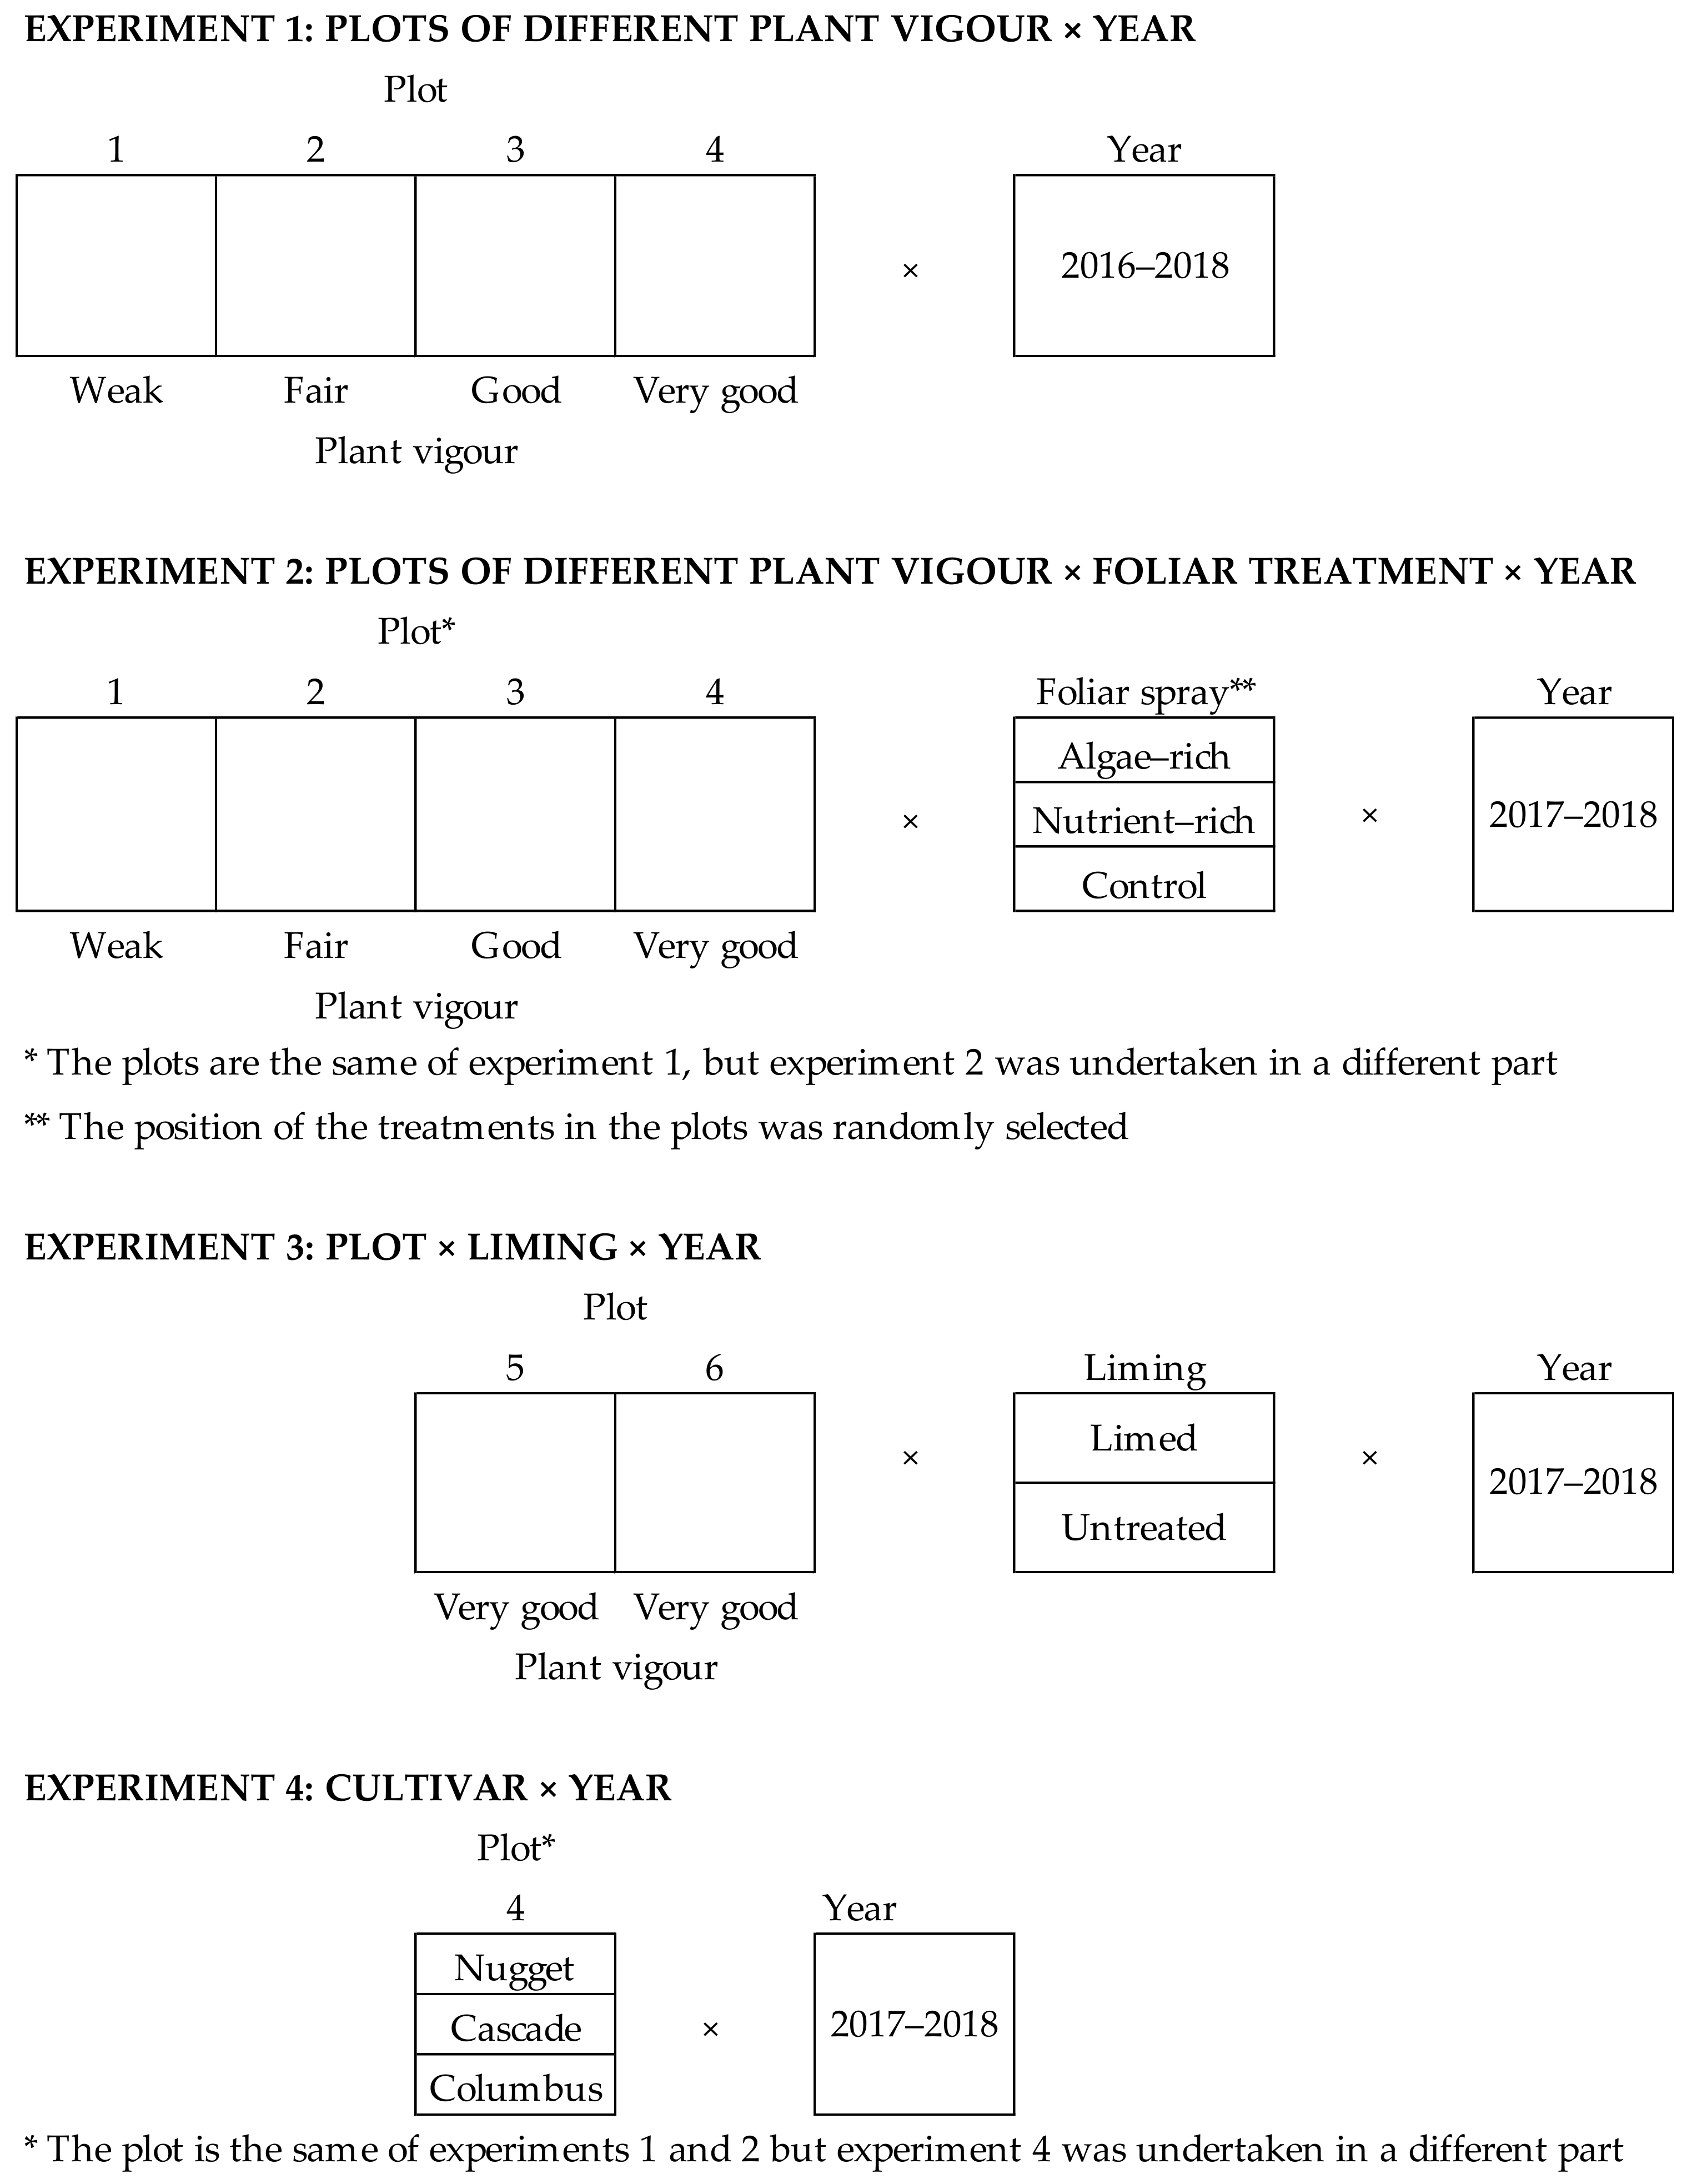
2.2. Experimental Designs

The experimental design was divided into four field trials arranged as factorial designs with six replications (six twin canopies of three plants). The plants were randomly selected in the corresponding experimental plots when they reached 3 m in height in the plots of higher vigour plants.
Experiment 1 consisted of a factorial design (two factors) including plots of plants of different vigour (weak, fair, good and very good) and years (2016, 2017 and 2018). The classification of the vigour of the plants was made with the farmers help as above mentioned. The plots were planted with the Nugget cultivar and were installed ~20 years ago.
Experiment 2 consisted of a factorial design (three factors) of plots of different plant vigour (weak, fair, good and very good), foliar sprays (algae- and nutrient-rich foliar sprays and control) and years (2017 and 2018).
The algae-rich foliar spray (Algae) is a solution containing 15% (w/w) the algae Ascophyllum nodosum (L.) Le Jolis, applied at a rate of 2 L ha−1 (diluted in 1500 L of water) three times during the growing season, at the phenological stages of inflorescence emergence, flowering, and beginning of the development of cones (on 20 June, 10 July and 27 July 2017, and 20 June, 8 July and 24 July 2018, respectively). In spite of the differences on plant vigour of the different plots, the phenological stage of the plants was similar.
The nutrient-rich foliar spray (Fnut) is a mixture of A. nodosum (1.4% w/w) enriched with macro- and micronutrients containing (w/w) 12% N, 6% P2O5, 4% K2O, 0.025% B, 0.1% Fe-EDTA, 0.05% Cu-EDTA, 0.05% Zn-EDTA, and 0.05% Mn-EDTA. This fertilizer was applied at a rate of 3.5 L ha−1 (diluted in 1500 L of water) on the dates reported for Algae. In each plot the foliar sprays were applied in four rows and the six twin canopies of each treatment were sampled in the two interior rows. The plots where this experiment was carried out were the same reported for experiment 1, although in a different part of the plots.
Experiment 3 was arranged as a factorial design (three factors) and included hop plots (two) of good vigour plants (Plots 5 and 6), liming (limed and not limed) and years (2017 and 2018). The limestone (55% CaCO3, 28% CaO and 20% MgO) was applied at a rate of 1000 kg ha−1 in February 2017 and incorporated into the soil with a cultivator. Both fields, ~2 ha each, are of the Nugget cultivar and they are ~20 years old. As the study was carried out as on-farm research, liming was carried out in a larger part of the area, with only four rows of ~150 m remaining for the control treatment, and the plants were sampled from the internal rows of the treated or untreated plots.
Experiment 4 was a factorial of two factors: cultivars (Nugget, Cascade and Columbus) and year (2017 and 2018). This experiment was carried out in Plot 4, in which part of the plot was installed with several different cultivars, each one occupying a row of ~150 m. This hop field was planted in 2014. An overview of the experimental design is shown in Figure 2.

2.3. Plant Sampling and Tissue Analysis for Elemental Composition

Plant material was collected at harvest and subsamples of fresh cones were carried to the laboratory, oven-dried at 70 °C and thereafter ground for laboratory analysis. Tissue analysis for elemental composition was performed by Kjeldahl (N), colorimetry (P and B), flame emission spectroscopy (K), and atomic absorption spectroscopy (Ca, Mg, Cu, Fe, Zn, and Mn) methods [27], after the samples were digested with nitric acid in a microwave (MARSXpress CEM).

2.4. Analysis of Total Phenolics

Hop cone samples were ground in a Cyclotec mill, with a 1 mm mesh screen, to obtain a fine powdered sample. Infusion preparation was performed by using 1 g of fine powdered hop sample, which was added to 100 mL of boiling distilled water and left to stand at room temperature for 5 min, and then filtered. Total phenols were determined in a total of 204 samples (36 samples from Experiment 1, 72 samples from Experiment 2, 72 samples from Experiment 3 and 24 samples from Experiment 4). The extracts obtained were diluted 1:1. Folin–Ciocalteu’s assay, briefly, 0.5 mL of each diluted extract was mixed with the Folin–Ciocalteu reagent (2.5 mL). After 3 min, they were saturated with sodium carbonate solution (2 mL) and the reaction was kept in a water bath at 40 °C for 30 min. The absorbance was read at 765 nm (PG Instruments T80 UV/VIS Spectrophotometer, QLabo, Portugal). Gallic acid was used to prepare the standard curve and the results were expressed as mg of gallic acid equivalents (GAEs) per g of dry matter of hop cones. The analysis of total phenols in each sample was carried out in triplicate.

2.5. HPLC Analysis

The samples of phenolic extracts with the highest content of total phenols from each trial and 2017 (experiment 1 also from 2016) were selected and analysed for their phenolic compound content in the directly infused extracts, and then filtered using 0.22 μm disposable disk filters. Phenolic compounds were determined in a total of 36 samples from all the experiments. The operating conditions were followed according to that previously described by Bessada et al. [28] using a HPLC system (Dionex Ultimate 3000 UPLC, Thermo Scientific, San Jose, CA, USA) coupled with a diode-array detector (DAD, using 280 and 370 nm as preferred wavelengths) and a Linear Ion Trap (LTQ XL) mass spectrometer (MS, Thermo Finnigan, San Jose, CA, USA) equipped with an electrospray ionization (ESI) source. The separation was made in a Waters Spherisorb S3 ODS-2 C18 column (3 µm, 4.6 mm × 150 mm; Waters, Milford, MA, USA). Tentative phenolic compound identification was made according to their UV and mass spectra and retention times compared with commercial standards when available or using reported data from the literature. For the quantitative analysis of phenolic compounds, a 7-level calibration curve was obtained by injecting known concentrations. The results were expressed in mg per kg of fresh weight (fw), as mean ± standard deviation of three independent analyses.

2.6. Statistical Analysis

Data were firstly tested for normality and homogeneity of variance using Shapiro–Wilk and Bartlett’s tests, respectively. Thereafter, data were subjected to two- or three-way ANOVA according to the experimental design using SPSS v. 25.0 programme. When the means differed significantly, they were separated by Student’s or Tukey HSD tests (α = 0.05), when the factors were applied at two or more levels, respectively. A PCA was performed with the object principal normalization method on data collected from 2016 to 2018 regarding total phenols and nutrient concentration in cones. The principal components were retained considering the eigenvalues superior to 1 and the scree plot. Internal consistency was measured with Cronbach’s alpha. In addition, the scores of each one of the PCA components were calculated as a function of plant vigour, foliar treatment, limestone treatment, cultivars and year, and subjected to analysis of variance, using the Tukey–Kramer HSD test (α = 0.05) to compare averages for each trial and year. A correlation analysis was applied to the same data as the PCA analysis with the Spearman coefficient.

3. Results

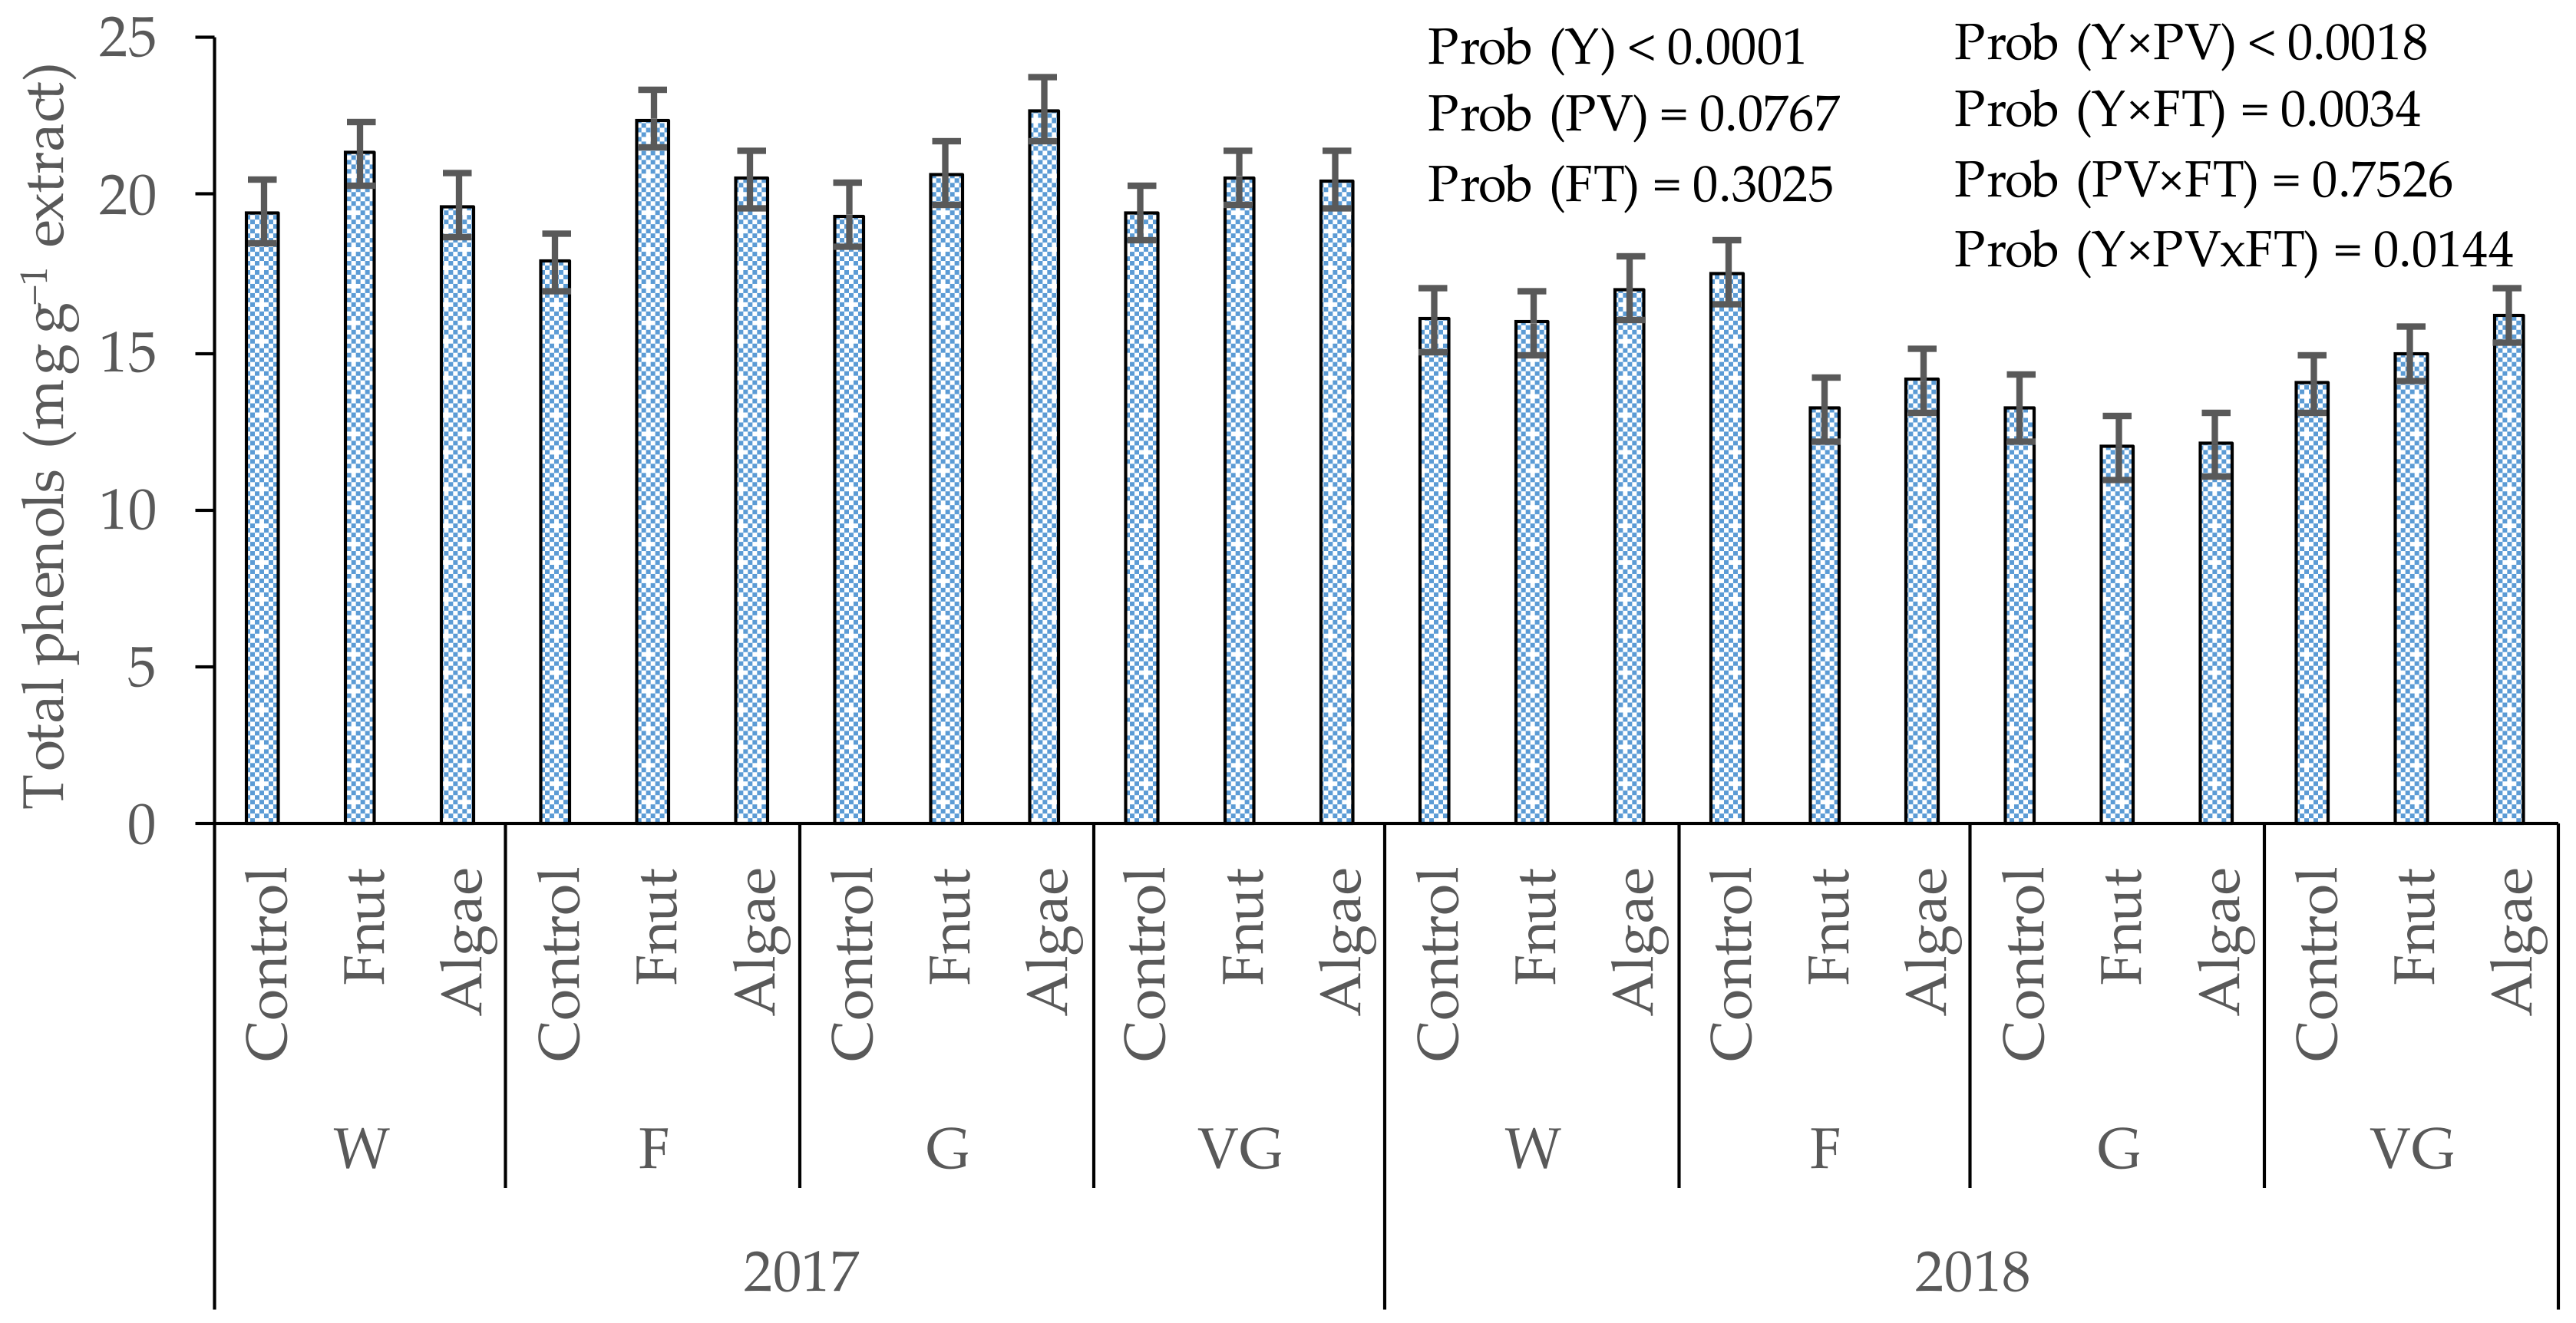
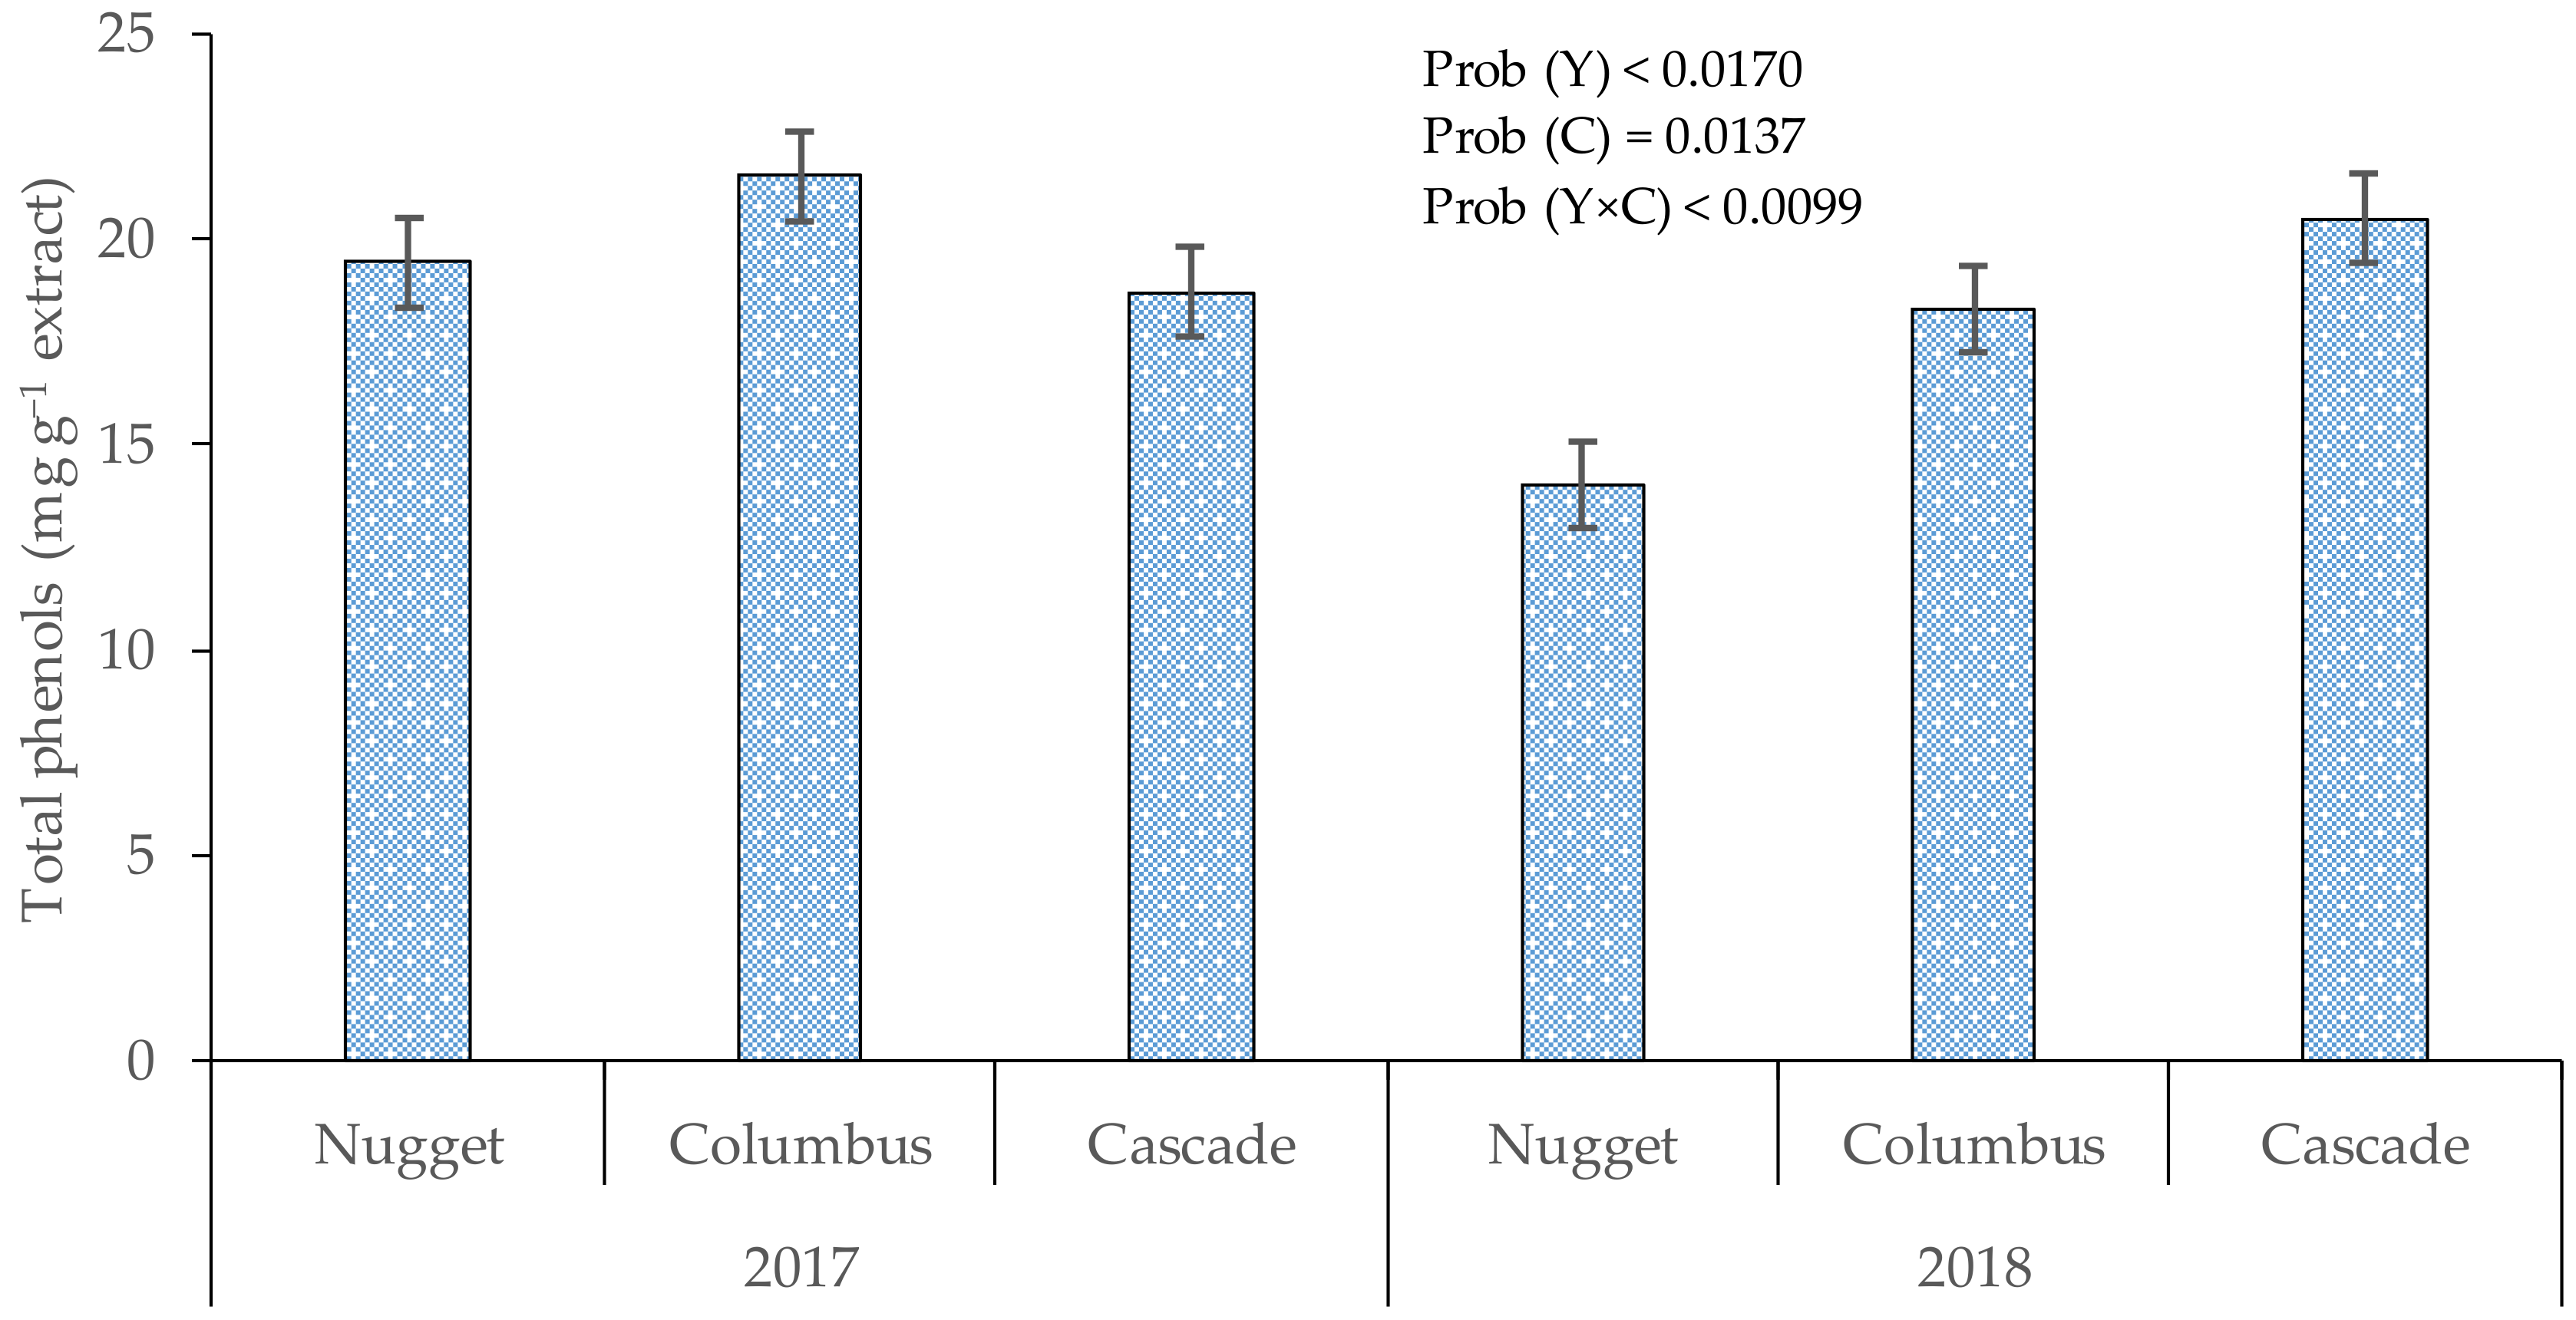
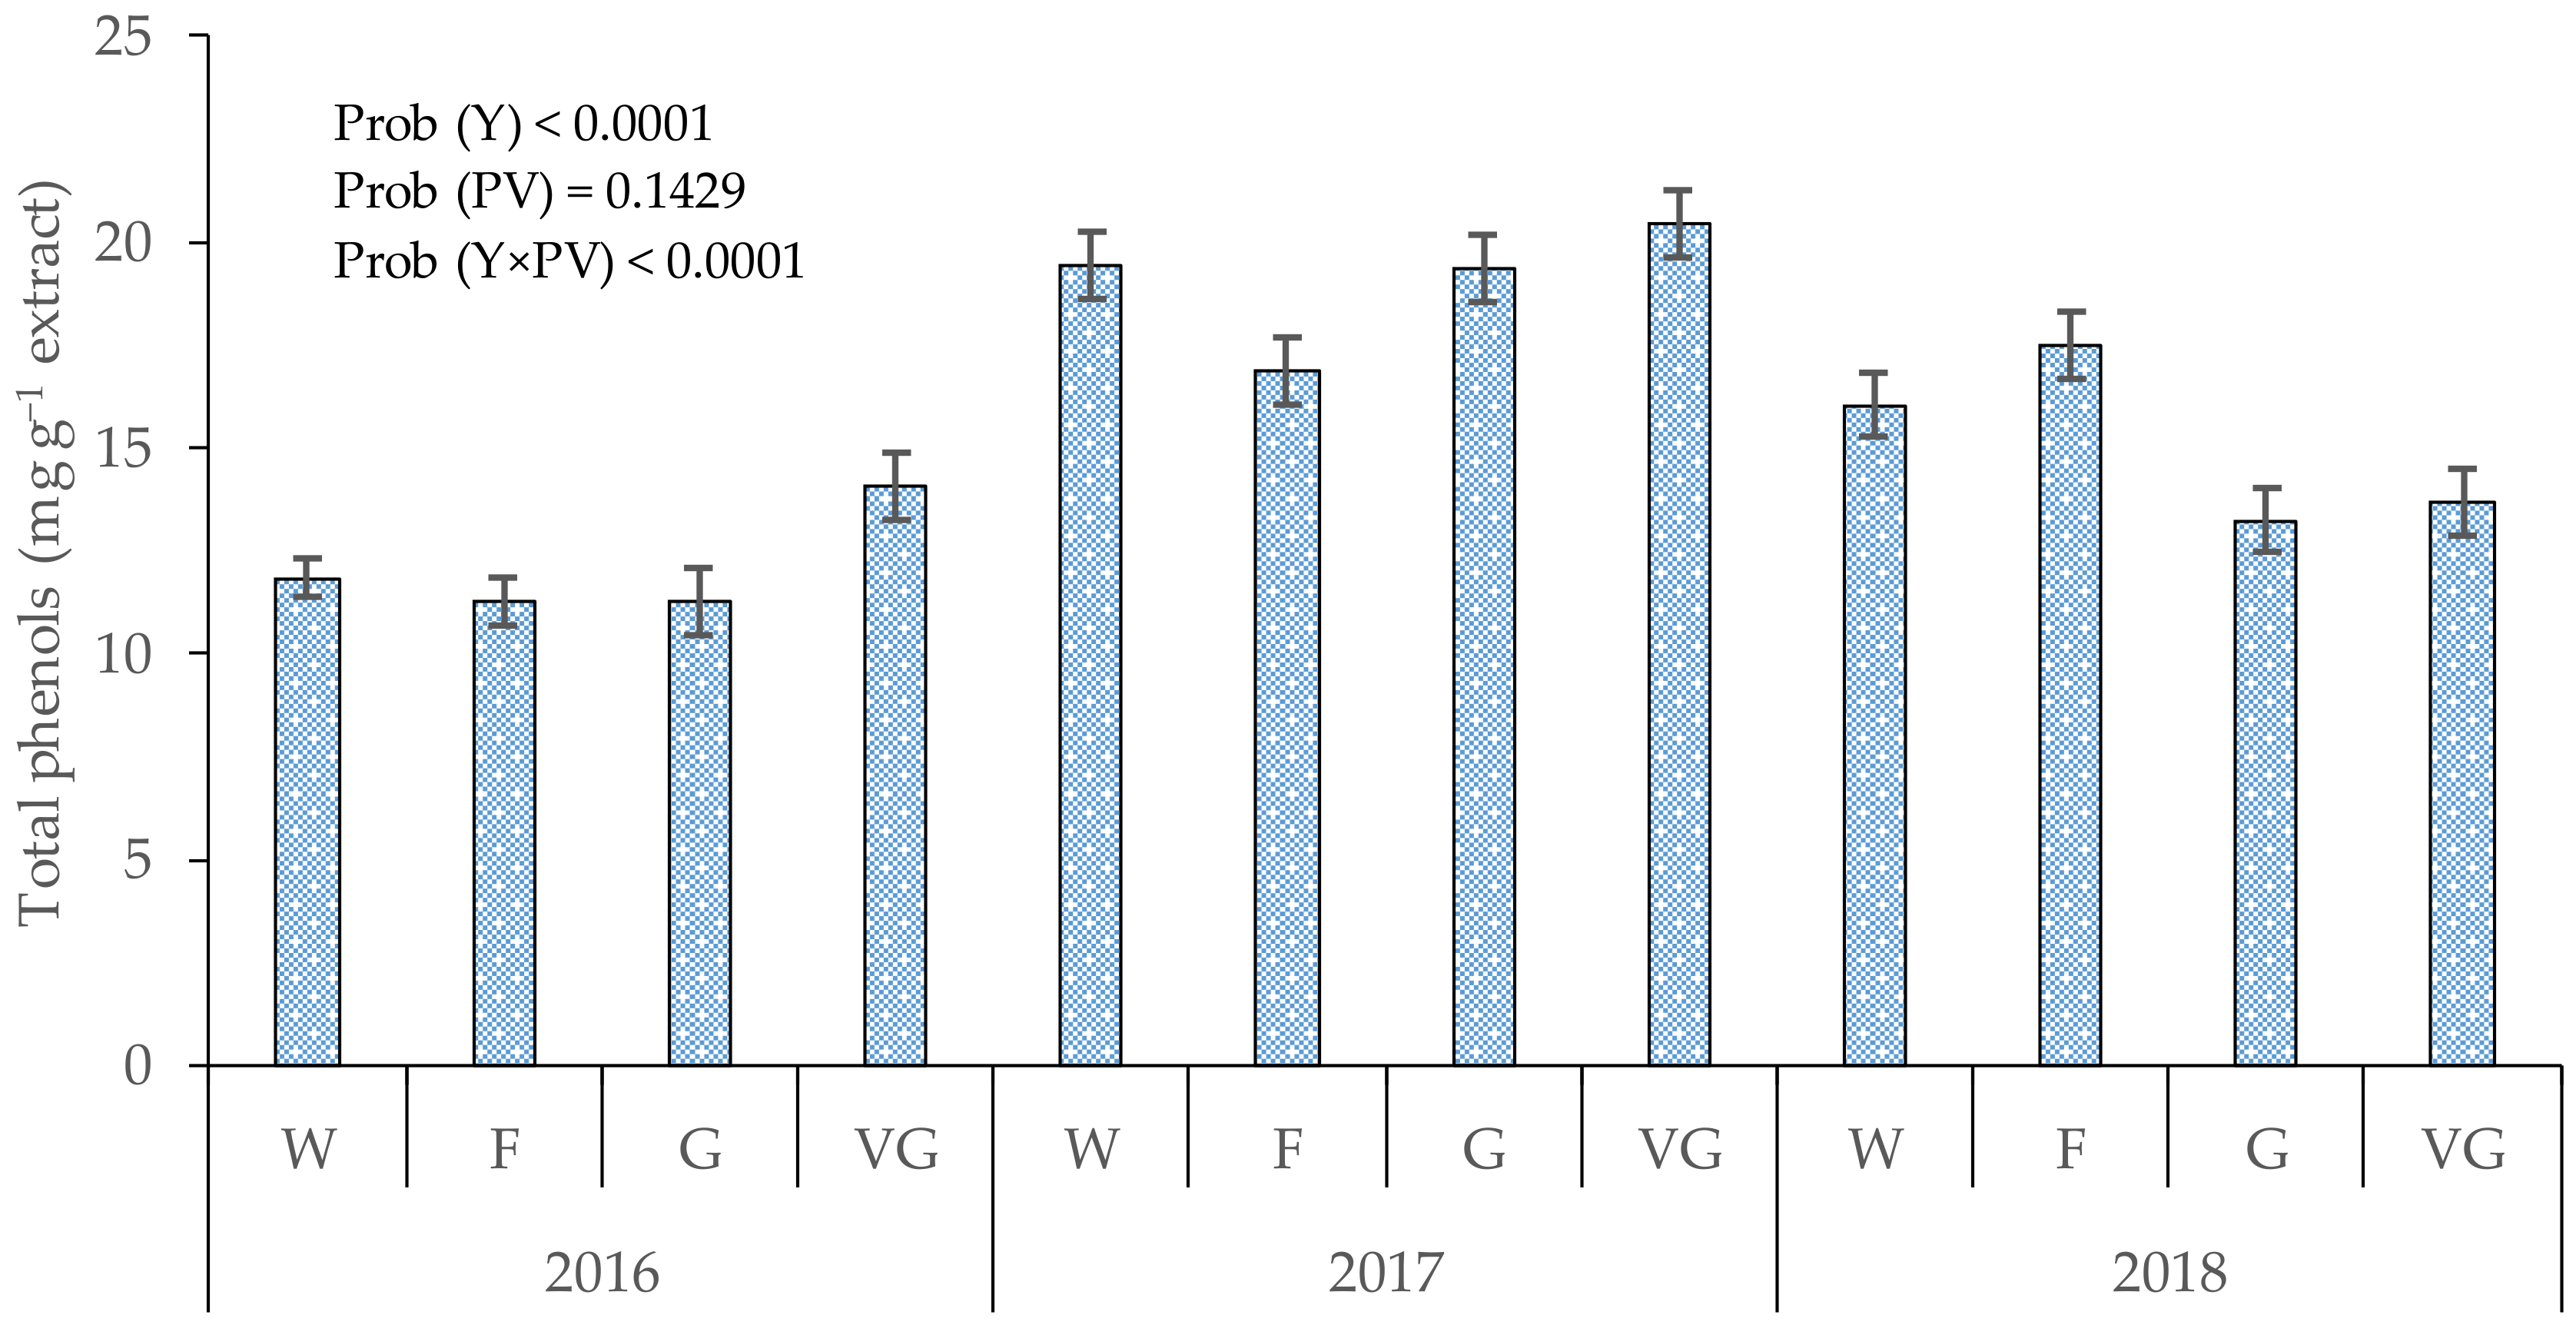
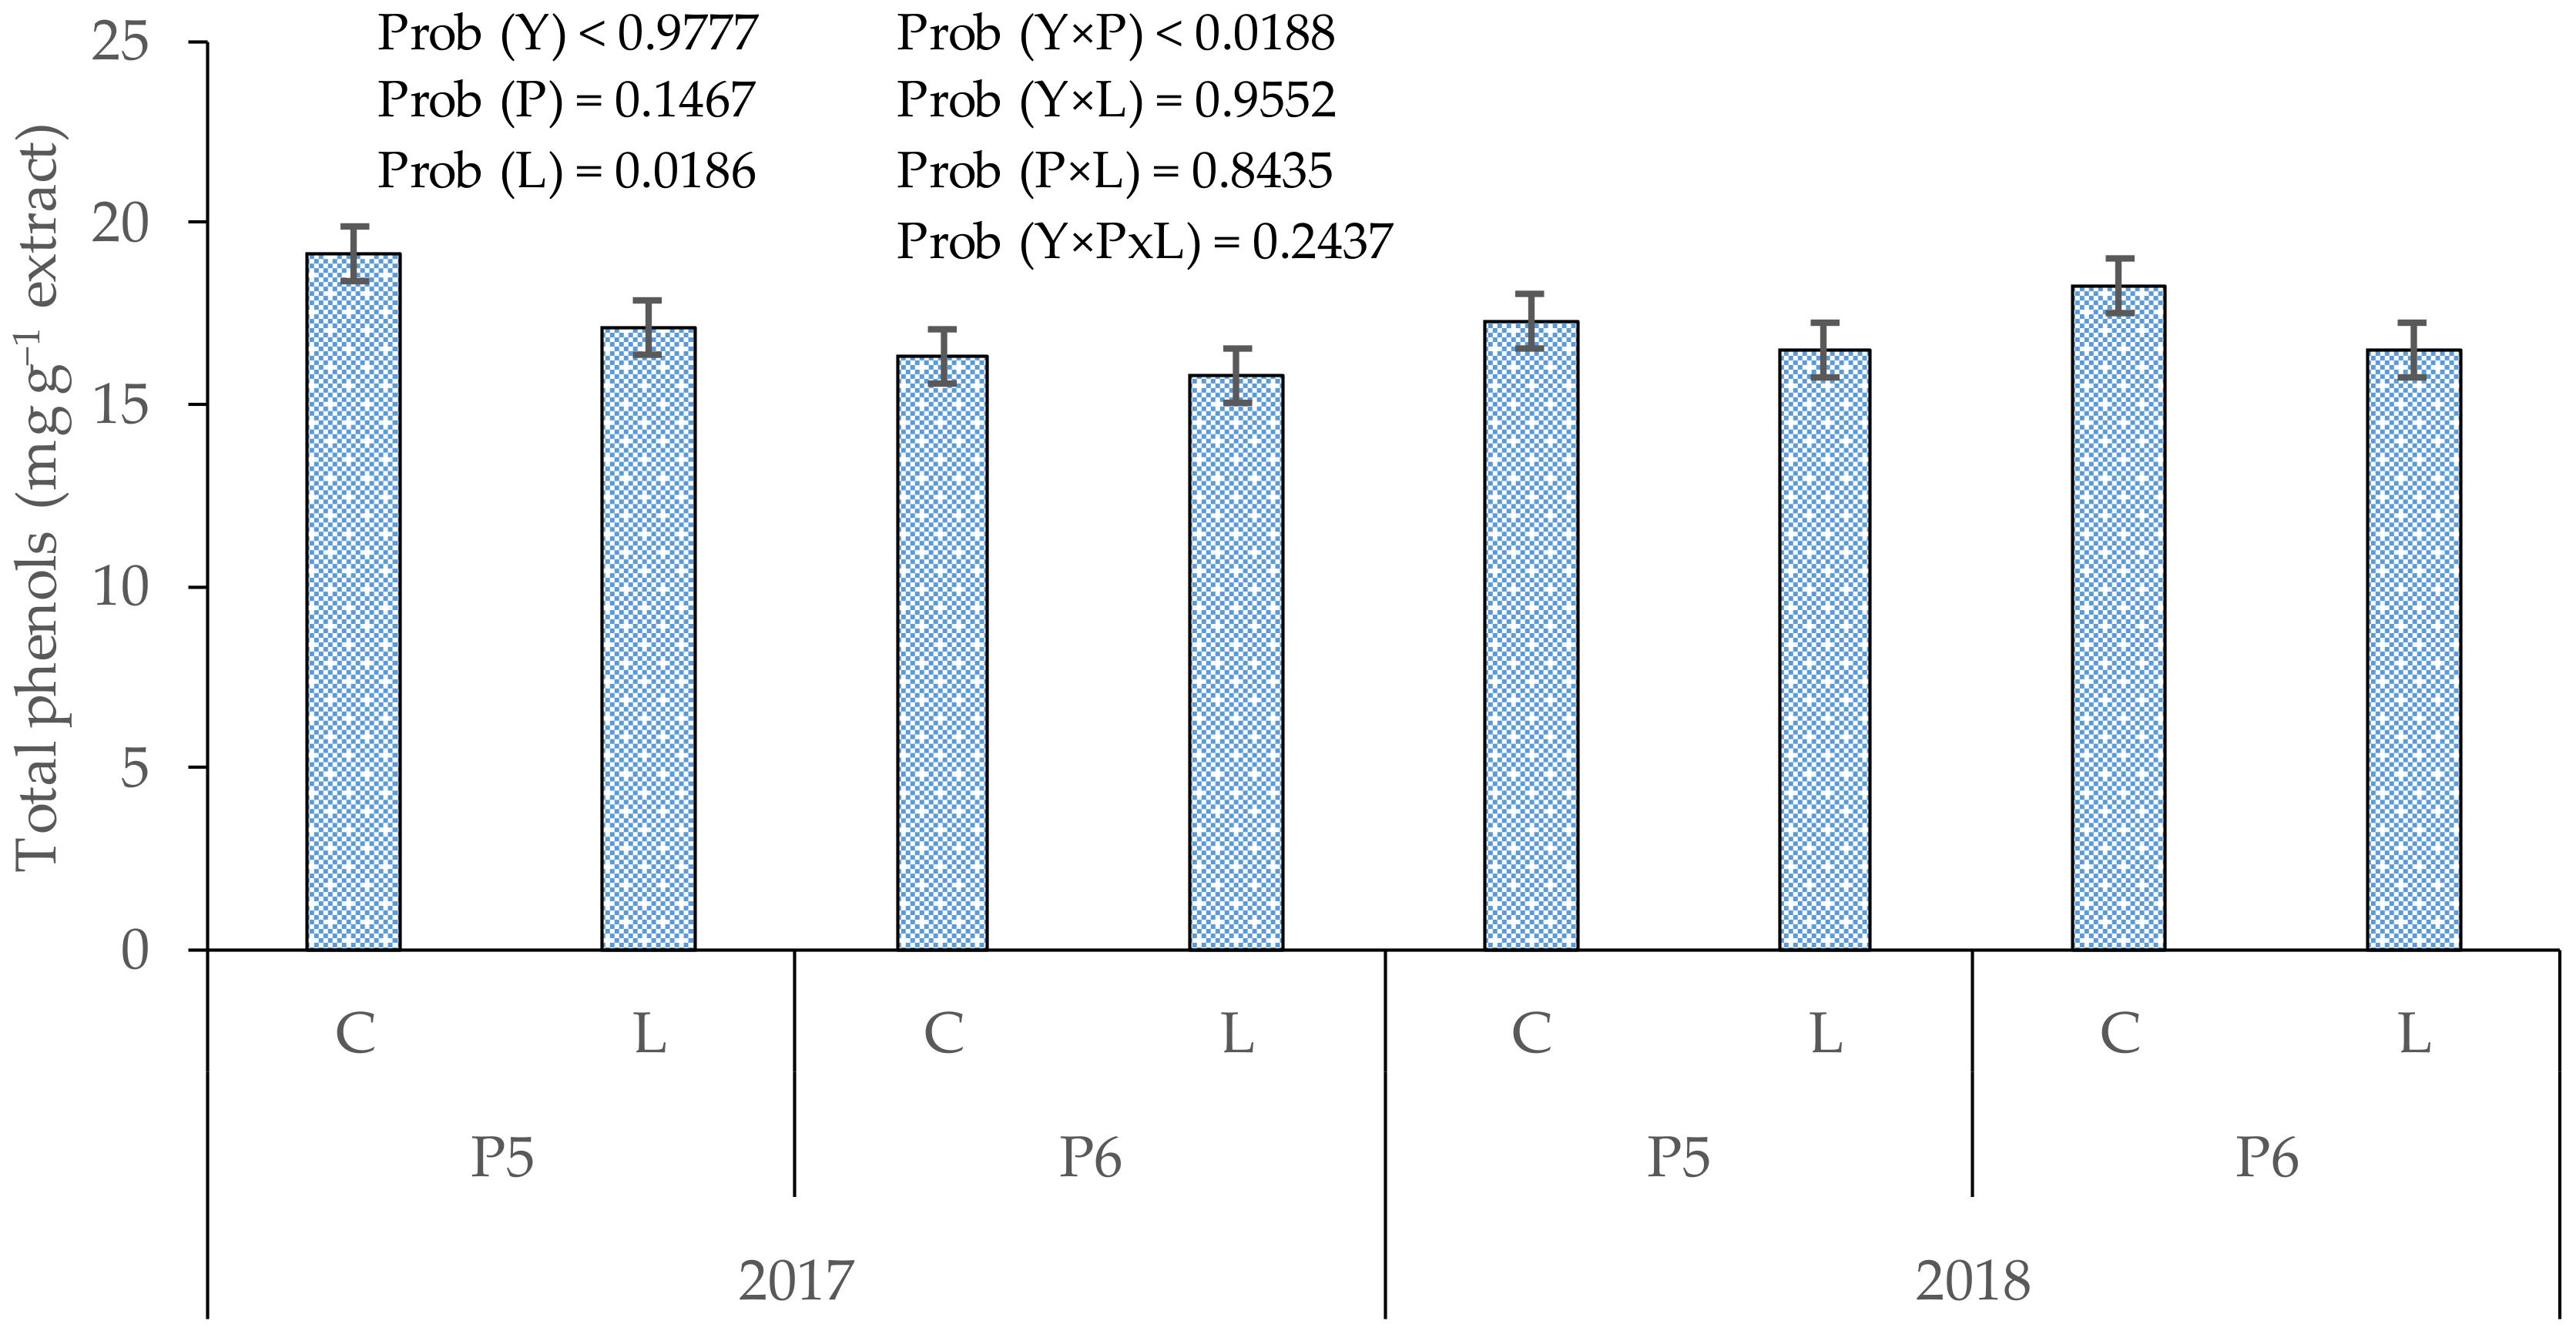
3.1. Total Phenols in Cones

In the factorial experiment of plant vigour × year, a significant interaction was found for total phenols (Figure 3), meaning that the response of this variable to the field of plants of different vigour depended on the year and/or vice versa. Observing the effect of each factor separately, significant differences were found between years but not between fields. In 2017 total phenols were particularly higher than in 2016 and 2018. The average values were 19.0, 11.9 and 15.1 mg g−1 in 2017, 2018 and 2016, respectively.
In the factorial experiment of plant vigour × foliar treatment × year, a significant interaction was found for total phenols for the combination of the three factors and for plant vigour × year and foliar treatment × year (Figure 4). Thus, the year seems to be the factor that adds more variability to the results, influencing the accumulation of total phenols in plants of different vigor and subject to different foliar treatment. By analysing the factors separately, differences in total phenols between plots were found, but without any relation to the vigour of the plants. Foliar sprays did not cause a significant effect on total phenols, but in 2017 the values were significantly higher than those of 2018. The average values were 21.2 and 14.7 mg g−1, respectively, in 2017 and 2018.
In the factorial experiment of different plots × liming × year, significant interaction for total phenols only occurred between plot × year (Figure 5), meaning that total phenol accumulation in plants from different plots was dependent on the year effect. In this experiment, the effect of the plot and year was not statistically significant, and lime’s application significantly reduced the content of total phenols. The average values of total phenols were 17.8 and 16.5 mg g−1, respectively, in control and limed plots.
In the factorial experiment cultivars × year, significant interaction was found for total phenols, which means that the response of the cultivars depended on the year (Figure 6). A separate observation of the effect of each of the factors indicated that Nugget showed significantly lower values than Columbus and Cascade, and the values of 2017 were significantly higher than those of 2018. The average values of Nugget, Columbus and Cascade were 16.7, 19.9 and 19.6 mg g−1, respectively, and the average values of 2017 and 2018 were 19.9 and 17.6 mg g−1, respectively.

3.2. Principal Component Analysis

The PCA applied to data collected from 2016 to 2018 concerning total phenols and nutrient concentration in hop cones resulted in four principal components (PC1 to PC4), which accounted for 70.02% of the variance explained. The main differences in the variance explained were between PC1 (23.35%) and PC4 (11.77%). All variables presented high scores for at least one, or more than one, PC (Table 2). The positive association with N, P, Mg and negative association with K seems to explain greater variance. The higher loading of total phenols was negative and registered in PC3 (−1.606), but scores were also high in PC4 (0.753) and in PC1 (−0.730). These results seem to indicate a negative association of total phenols with Zn and B.
Correlation analysis (Table 3) indicates total phenols significantly and negatively correlated with Zn followed by Cu, N and Fe in decreasing order. Positive and significant correlations of total phenols with other nutrients were not recorded. On the other hand, cone N concentration presented positive correlations with other nutrients and most significantly with Mg and P, whereas K was significant and positively correlated with Mn.

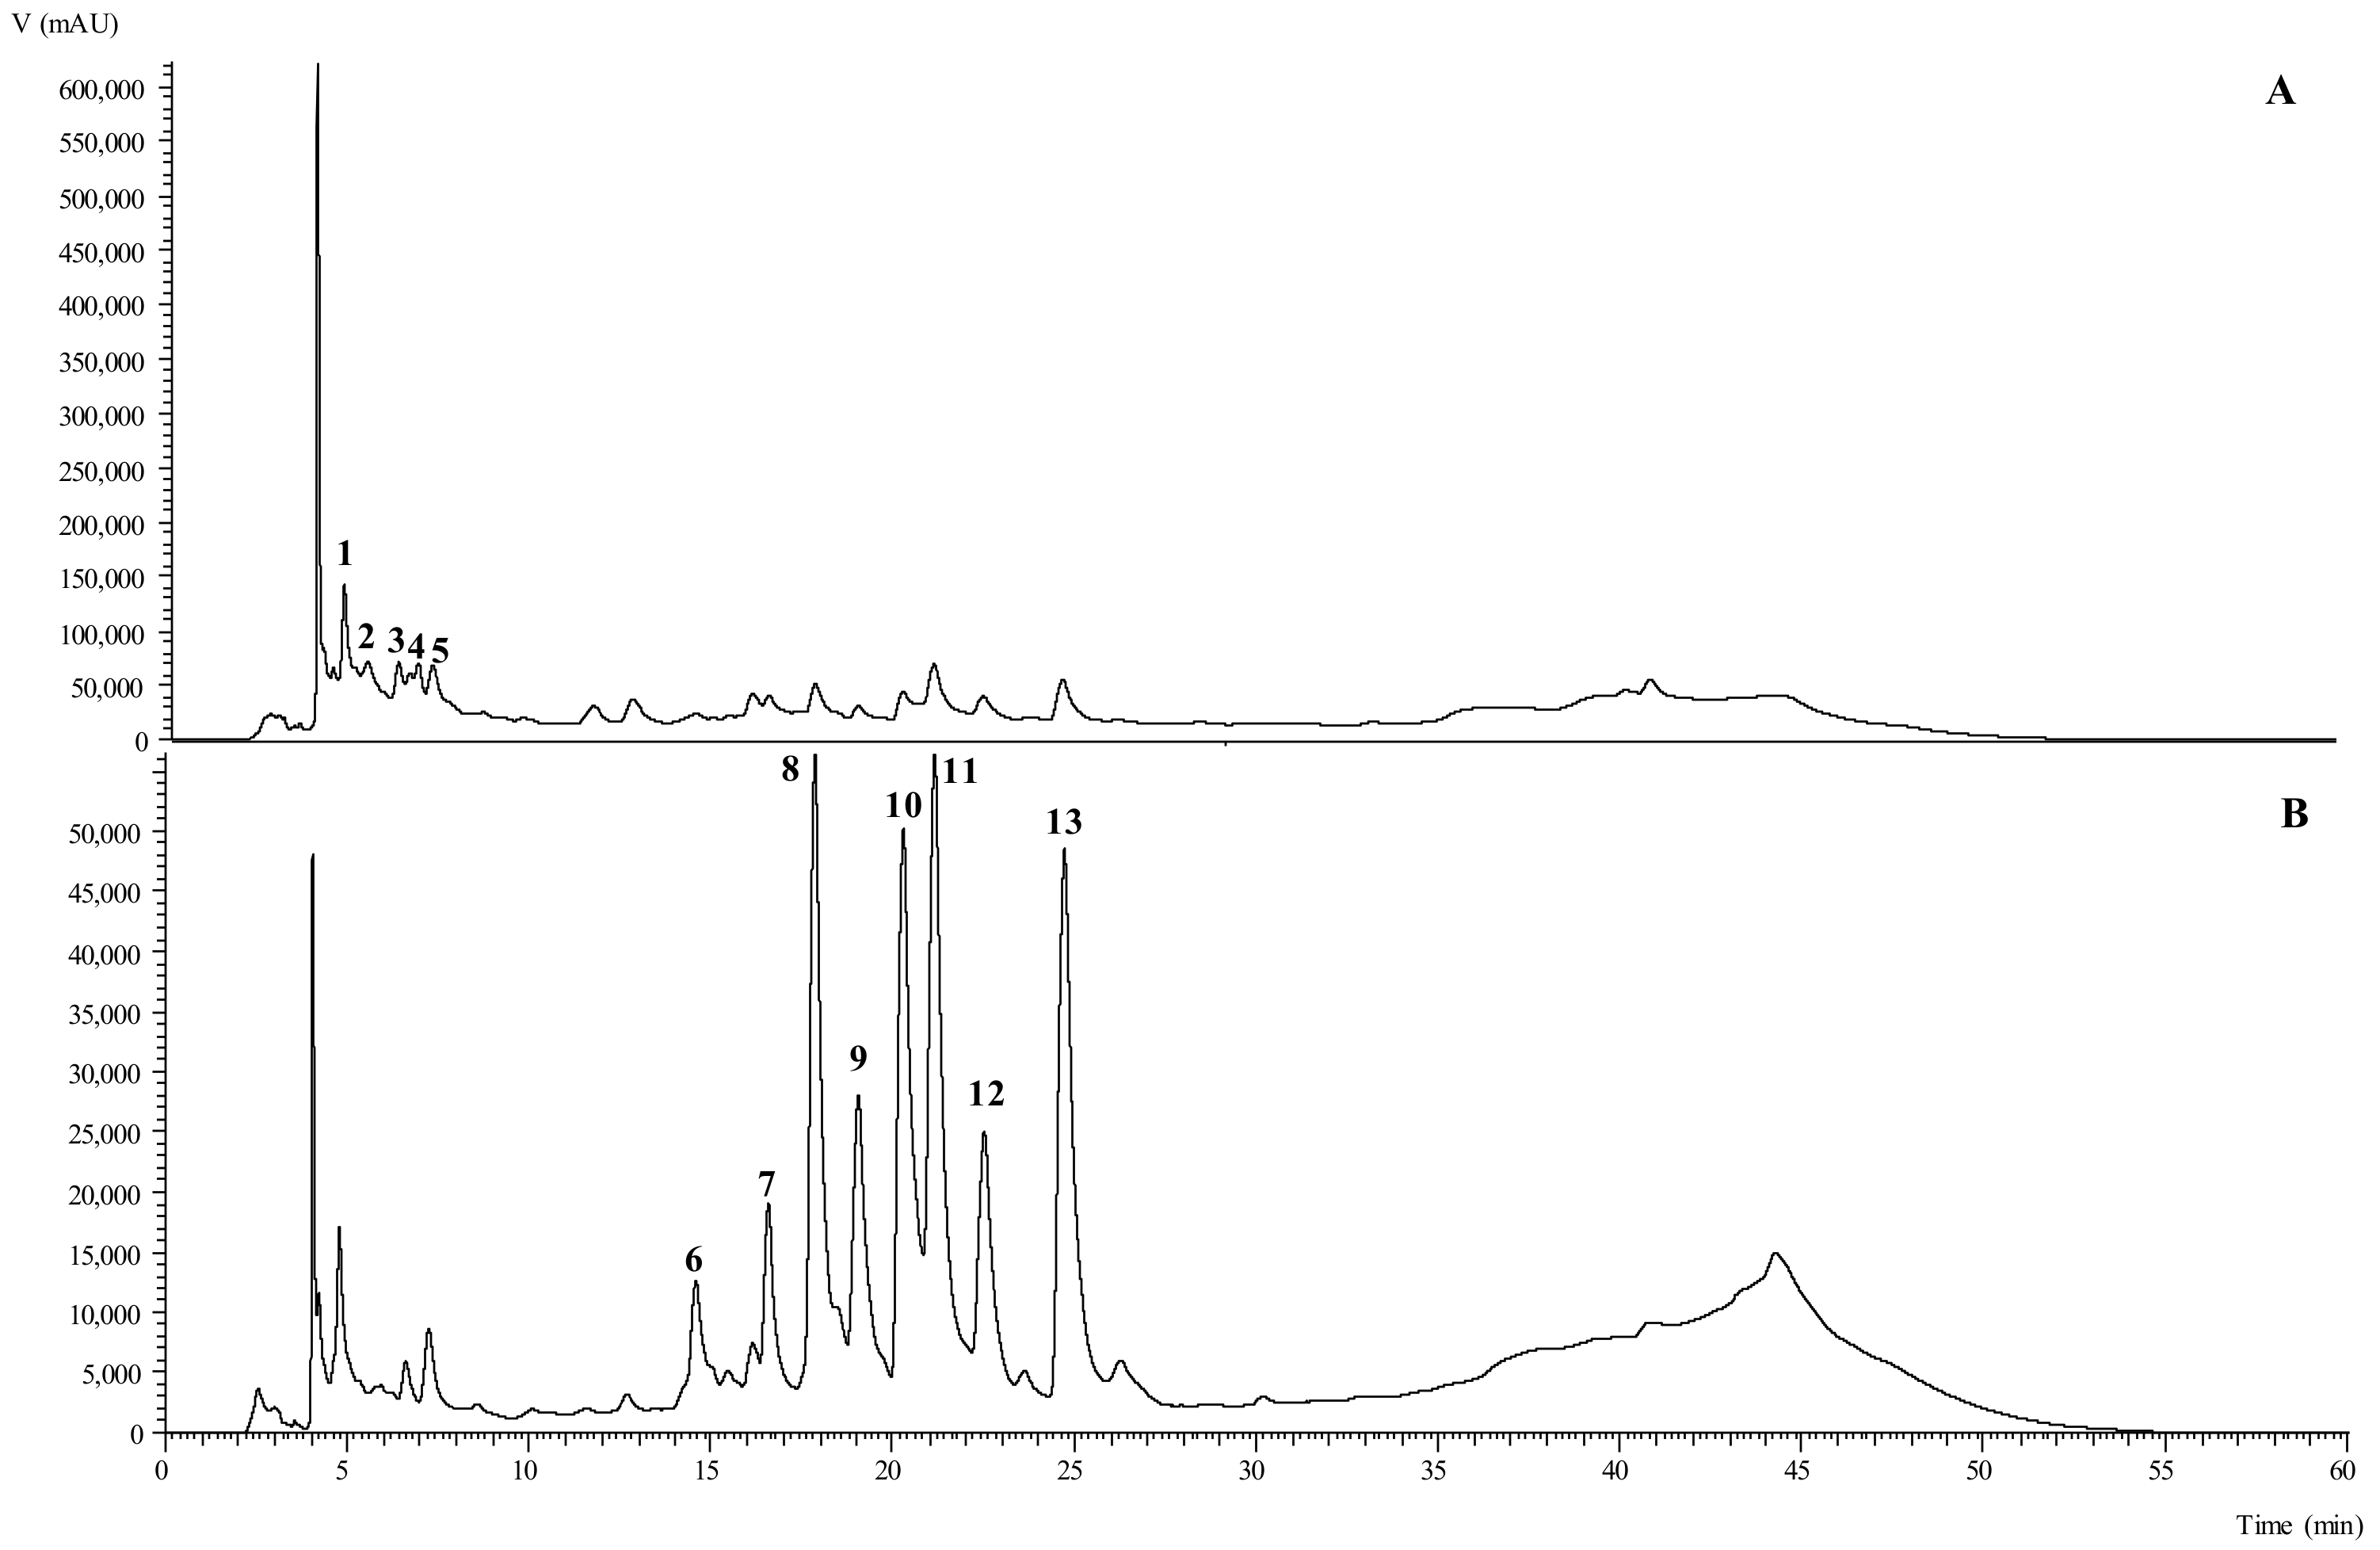
3.3. Phenolic Compounds Identification and Quantification

Data on the chromatographic characteristics (retention time, UV in the maximum absorption, molecular ion, and main MS2 fragments) and tentative identification of the phenolic compounds found in the extracts of hop cones are described in Table 4. A total of 13 phenolic compounds were tentatively identified in the samples, namely, 5 phenolic acids (p-coumaroyl- and caffeoylquinic acid derivatives) and 8 O-glycosylated flavonoids (quercetin and kaempferol derivatives).
Data on the quantification of phenolic compounds in the three different cultivars of hop cones are described in Table 5 and Table 6. An example phenolic profile chromatogram of the Cascade cultivar is presented in Figure 7. The quantification of the individual phenolic compounds from the first trial (Plant Vigour × Year) revealed that some of the compounds were not detected in plants with good and very good vigour, in particular, O-glycosylated kaempferol derivatives and caffeoylquinic acid derivatives (data not shown). Plants of weak vigour were generally higher in quercetin and kaempferol derivatives. The concentration of phenolic compounds in hop cones was very similar among foliar fertilizer treatments, although for most of the compounds the values were slightly higher in the control treatment and slightly lower in the algae treatment (Table 5). In comparison with the control, plants on limed soil presented a significantly higher concentration of kaempferol-3-O-(2-rhamnosyl)-rutinoside and 4-O-caffeoylquinic acid though not significantly.
Between cultivars, the differences in phenolic compound quantification were significant for most of the compounds, though not for the total sum of phenolic compounds. Cascade presented lower concentrations of p-coumaroylquinic acid (p-CoQA) and 4-O-caffeoylquimic acid (4-CQA), but was generally higher in quercetin and kaempferol derivatives (Table 6). Nugget and Columbus were overall very similar in their phenolic profile.

4. Discussion

4.1. Total Phenols in Hop Cones

In the four factorial experiments, a significant interaction was found between two or three factors of each experiment for several traits related to total phenols in the cones. This means that the effect of a factor on a given variable was dependent on the other(s) factor(s) under study, and the year was the factor with greatest influence. The accumulation of total phenols in cones in plants of different vigour, in those subject to different foliar treatments and grown in different plots, and between different cultivars was dependent on the year. Abram et al. [29] also reported that the year influenced the phenolic content of hop cones of different cultivars and of hop plants grown in different locations (Slovenia, Austria, Czech Republic). The year effect results from the combination of important environmental variables, such as precipitation, temperature, solar radiation, etc., which are able to influence physiological and biochemical processes in plants and also the efficiency of foliar nutrition [30]. The year had a marked effect on total phenol content. Total phenols showed lower values in 2018 in most experiments in comparison with 2017.
During important phases of the growing season, such as flowering and initial cone development (June, July), the temperature was lower in 2018 than in 2016 and 2017, and precipitation was higher (Figure 1). This region is at a low latitude, compared to Europe’s major hop producing regions. In lower temperature years, plant growth conditions are closer to those observed at higher latitudes, where hops have better general growing conditions [2,8]. In several studies, it has been shown that the growing region, in general, has a great influence on the performance of hop plants [11,13,29,31,32,33,34]. It is also known that environmental variables can affect the secondary metabolism of plants and, therefore, the accumulation of phenolic compounds [35,36]. Although plant vigor had a marked effect on tissue nutrient concentration [24], its effect on total phenols in hop coves was reduced.
The average content of total phenols in hop cones of the Nugget cultivar did not vary significantly between the plots of different plant vigour. The stress affecting plant growth and yield in the low vigour plots did not influence total phenols in the cones. A previous study analysing these plots [21] has shown that the plants appeared with excessive levels of Fe and Mn in the leaves, which may indicate poor soil aeration, probably caused by a deficient spatial water distribution along the rows by the flooding irrigation system. The soil texture in these plots did not seem to be different enough to create a gradient effect. Phenols significantly decreased with liming treatment. Likewise, Zu et al. [37] found a decrease in the flavonoid content of Panax notoginseng with calcium and lime application under cadmium stress. Although calcium seems to have an inhibitory effect on important enzymes in the phenolic pathway, it seems that the greater amount of cadmium in the roots inhibited the absorption of calcium and influenced flavonoid content. Unfortunately, with the data collected, it was not possible to identify the stress factors that caused the reduction in the content of phenols in the limed plots.
The foliar sprays did not influence significantly the content of total phenols in hop cones. To the best of our knowledge, results from hop cones have not yet been reported from experiments using foliar sprays. Foliar sprays, including those containing seaweed extracts, usually tend to increase the content of total phenols in plant tissues [17,38,39,40]. However, some studies have also reported an absence of a significant response to the application of this kind of products [41,42]. Of the cultivars, Nugget showed lower average values of total phenols in comparison to Cascade or Columbus if the two years were taken into account. From the samples selected for phenolic characterization, Nugget presented slightly higher values of total phenolic compounds but, in this case, just the samples with higher phenol content from the first year were characterized.
Previous studies have also shown significant differences in total phenols when different hop cultivars were compared [29,43,44]. The phenols content seems to depend on the cultivar and, in general, low molecular weight phenols are found in greater amounts in aroma cultivars, as the increase in alpha acid content seems to be achieved at the expense of the phenol content [4]. This seems to be true for Cascade, which showed significantly lower levels of alpha acid content, but not for Colombus, which was similar to Nugget, both presenting significantly higher levels of alpha acid content in comparison to Cascade [22]. Overall, the year average values found in this study ranged from 11.9 to 21.2 mg g−1 and were of similar magnitude to those reported by Kowalczyk et al. [45], varying between 16.2 and 25.5 mg g−1 (water extraction, followed by the Folin–Ciocalteau method). Lower values of 7.12 ± 0.09 mg GAE g−1 were reported by Keskin et al. [46] (methanol extraction, followed by the Folin–Ciocalteau method). These results emphasize the potential of the region to grow the cultivars Cascade and Columbus, along with the well-established Nugget.

4.2. PCA and Correlation Analysis

PCA and correlation analysis indicate a significant and negative association between total phenols and Zn concentrations in the cones. The results also indicate a negative influence of Cu, N and Fe in the accumulation of total phenols in the cones. Hop is a species particularly sensitive to Zn deficiency, affecting plant growth and cone production [47]. In this case, an association of Zn with plant vigour was not found, but higher concentrations of Zn, Cu and Fe were previously reported for these plots, and the result associated with poor soil aeration [21].
Enhanced absorption of Zn and Cu was also noticed in industrial hemp (Cannabis sativa subsp. Sativa) with higher irrigation level, with Zn showing higher mobility to aerial tissues [48]. The results of correlation analysis also showed significant and positive correlation between cone Cu and Fe, and cone Zn and Cu. Regarding Fe, the high levels previously reported in soil and plants [21], may have contributed to lowering total phenol concentrations. Zn, Fe and Cu do not seem to be important nutrients in phenolic biosynthesis, and they may interfere negatively with other nutrients that provide co-factors for many enzymes of the flavonoid pathway [35].
Regarding N, its supplementation has been negatively associated with the phenolic composition of plant tissues in several crops [49,50], and associated with plant growth particularly in sensitive species to soil N availability [51]. In accordance with the protein competition model (PCM), since phenols and proteins compete for a common precursor, conditions that increase plant growth may reduce the concentration of total phenols [51]. Phenols are secondary metabolites synthesized through the shikimate pathway in which the amino acid phenylalanine is released, and this amino acid is a common precursor of phenylpropanoids and protein synthesis [35,51].

4.3. Phenolic Compounds Identification and Quantification

The phenolic compounds identified were mainly flavonols (quercetin and kaempferol) and phenolic carboxylic acids (p-coumaric and caffeic acids), which represent a minor fraction of the polyphenols that can be found in hop cones [5,7]. The result might be due to the in-water extraction method, which while suitable for many applications, is less efficient than the hydroalcoholic extraction method, particularly on hop prenylated flavonoids detection, which are lipophilic compounds [45]. The phenolic profile of H. lupulus is in accordance with those previously reported for bracts [7], leaves [52] and cones [53,54] and also for leaves, stem and roots of H. japonicus Siebold and Zucc [55]. The identification of peaks 8 ([M-H] at m/z 609), 9 ([M-H] at m/z 463), 11 ([M-H] at m/z 593), and 12 ([M-H] at m/z 447), quercetin-3-O-rutinoside, quercetin-3-O-hexoside, kaempferol-3-O-rutinoside, kaempferol-3-O-glucoside, respectively, was performed by comparison of their retention time, UV spectra, and mass fragmentation patterns with the available commercial standards. Three caffeoylquinic acid derivatives were tentatively identified regarding the phenolic acid groups, peaks 1, 4, and 5 (3-O-, 4-O-, and 5-O-caffeoylquinic acids, respectively).
According to Clifford et al. [56,57], peaks 1 and 5 present a major ion MS2 fragment at m/z 191, whereas peak 4 presents at m/z 173 an abundance of 100%, indicating the connection 4-O- position in the molecule. The organization of the three peaks, besides the major abundant fragments, was performed according to the hierarchical keys developed by Clifford et al. [56,57]. The two 3-p-coumaroylquinic acids found (peaks 2 and 3, cis and trans, respectively) were also assigned using the same hierarchical keys developed by Clifford et al. [56,57] the base peak at m/z 163 is for 3-p-coumaroylquinic acids. Since both peaks presented the same chromatographic characteristics, they were assigned as cis and trans isomers. Tanaka et al. [7] have also reported the same phenolic acids in the bracts of hop plants and Choi et al. [55] in the leaves, stem and roots of Humulus japonicus Siebold and Zucc. Finally, two O-glycosylated quercetin derivatives and two O-glycosylated kaempferol derivatives were also tentatively identified in the hop cones, peaks 6 and 10, and peaks 7 and 13, respectively. The tentative identification of these four peaks was performed based on those previously described in H. lupulus samples [7,52].
The hop cones of the less vigorous plants of the Nugget cultivar were higher in quercetin and kaempferol, whereas in the hops from the more vigorous plants, the kaempferol flavonoids and caffeic acids were found in small concentrations or were not even detectable. Environmental variables such as light exposure and temperature can significantly influence the accumulation of quercetin and kaempferol compounds in plant tissues [35]. Galieni et al. [58] have also found an increase in caffeic acid and other phenolic compounds in Latuca sativa L. grown under drought stress and an increase in cell wall lignification as a tolerance response.
In these experiments, the increased levels of phenolic compounds in less vigorous plants are probably a response to the environmental stress affecting plants’ growth. The plants treated with foliar sprays presented slightly lower values of phenolic compounds. Similarly, Xu and Leskovar [42] did not find any effect of applying a seaweed extract on flavonoid content in spinach. Hop cones of plants on limed soil presented a significantly higher concentration of kaempferol-3-O-(2-rhamnosyl)-rutinoside and 4-O-caffeoylquinic acid though not significantly. Likewise, Ngadze et al. [59] found an increase in caffeic acid content in potato (Solanum tuberosum L.) as a response to Ca applications.
As far as we know, no studies have reported the phenolic composition of hop cones after liming. Cascade stood out from the other cultivars, showing higher concentrations in quercetin and kaempferol compounds and lower in p-coumaric acids. Similarly, Almeida et al. [60] reported isoquercitrin followed by quercetin as the major phenolic compounds found in extracts of Cascade hops grown in Brazil. Santagostini et al. [61] identified quercetin-3-O-malonylglucoside and kaempferol-3-O-malonylglucoside compounds for the first time in Cascade hop. These compounds were also identified for the cultivars used in this study. In agreement with the present results, other studies [29,43] also showed significant differences in phenolic composition of different cultivars of hop, which probably was due to the potential influence of genetic factors on agronomic and biochemical traits [62].

5. Conclusions

Total phenols in hop cones were influenced significantly by most of the experimental factors (plant vigour, foliar treatment, liming, cultivar, plot and year) under study. However, in this study, foliar sprays and liming were among the factors that least influenced the measured variables (total phenol, nutrient concentration, and phenolic composition). The year, which represents the joint action of several environmental variables (temperatures, rainfall, relative humidity, etc.) resulted as the most important factor for the phenols accumulation between plants of different vigour, subject to different foliar treatments and grown in different plots and between different cultivars. Nugget showed significantly lower average values of total phenols than Cascade or Colombus cultivars if the two years were taken into account. The high levels of Zn in hop cones seemed to be associated with lower phenol content in the hop cones. The phenolic compounds identified were mainly flavonols (quercetin and kaempferol) and phenolic carboxylic acids (p-coumaric and caffeic acids). The less vigorous plants showed higher levels of quercetin and kaempferol in hop cones. The plants treated with foliar sprays (nutrient-rich and algae-rich foliar spray) presented slightly lower values of phenolic compounds, and plants on limed soil were notably higher in kaempferol-3-O-(2-rhamnosyl)-rutinoside. Cascade stood out from the other cultivars, showing higher concentration in quercetin and kaempferol compounds and lower concentration in p-coumaric acids. The phenolic compounds quercetin-3-O-malonylglucoside and kaempferol-3-O-malonylglucoside, reported previously in other studies for the first time in Cascade, were present in this study in Cascade, Columbus and Nugget. This study showed that most of the analysed compounds can vary in opposite directions with agro-environmental variables, making it difficult to recommend a coherent strategy to farmers without a well-defined target for the use of hop cones. It should also be noted that hop gardens are usually contaminated with viruses, especially old plantations, as may have been the case in the Nugget plots, which may have influenced the results of the experimental factors.

Author Contributions

Conceptualization, S.A., M.I.D. and M.A.; methodology, L.B. and M.A.; validation, L.B., M.I.D., M.A., M.Â.R. and M.C.; formal analysis, S.A. and M.I.D.; writing—original draft preparation, S.A., M.I.D. and M.Â.R.; writing—review and editing, L.B., I.C.F.R.F., M.Â.R. and M.C. All authors have read and agreed to the published version of the manuscript.

Funding

The authors are grateful to the Foundation for Science and Technology (FCT, Portugal) for financial support from national funds FCT/MCTES, to CIMO (UIDB/AGR/00690/2020) and for Sandra Alonso’s doctoral scholarship (BD/116593/2016), and also for national funding by FCT, P.I., through the institutional scientific employment program-contract for M. I. Dias and L. Barros contracts. To the project “GreenHealth—Digital strategies in biological assets to improve well-being and promote green health” (Norte-01-0145-FEDER-000042) funded by the European Regional Development Fund (ERDF) under the scope of Regional Operational Program North 2020.

Data Availability Statement

No new data were created or analyzed in this study. Data sharing is not applicable to this article.

Conflicts of Interest

The authors declare no conflict of interest.

References

  1. Bocquet, L.; Sahpaz, S.; Hilbert, J.L.; Rambaud, C.; Rivière, C. Humulus lupulus L., a very popular beer ingredient and medicinal plant: Overview of its phytochemistry, its bioactivity, and its biotechnology. Phytochem. Rev. 2018, 17, 1047–1090. [Google Scholar] [CrossRef]
  2. Korpelainen, H.; Pietiläinen, M. Hop (Humulus lupulus L.): Traditional and present use, and future potential. Econ. Bot. 2021, 75, 302–322. [Google Scholar] [CrossRef]
  3. De Keukeleire, D. Fundamentals of beer and hop chemistry. Quim. Nova 2000, 23, 108–112. [Google Scholar] [CrossRef]
  4. Almaguer, C.; Schönberger, C.; Gastl, M.; Arendt, E.K.; Becker, T. Humulus lupulus—A story that begs to be told: A review. J. Inst. Brew. 2014, 120, 289–314. [Google Scholar] [CrossRef]
  5. Biendl, M. Hops and Health. Master Brew. Assoc. Am. Tech. Q. 2009, 46, 1–7. [Google Scholar] [CrossRef]
  6. Olsovska, J.; Kolar, M. Humulus lupulus L. (hops)—A valuable source of compounds with bioactive effects for future therapies. Mil. Med. Sci. Lett. 2016, 85, 19–30. [Google Scholar] [CrossRef] [Green Version]
  7. Tanaka, Y.; Yanagida, A.; Komeya, S.; Kawana, M.; Honma, D.; Tagashira, M.; Kanda, T.; Shibusawa, Y. Comprehensive separation and structural analyses of polyphenols and related compounds from bracts of hops (Humulus lupulus L.). J. Agric. Food Chem. 2014, 62, 2198–2206. [Google Scholar] [CrossRef]
  8. Rodrigues, M.Â.; Morais, J.; Castro, J.P. O lúpulo: Da cultura ao extrato. Técnica cultural tradicional. In Livro de Atas Das Jornadas do Lúpulo e da Cerveja: Novas Oportunidades de Negócio; Instituto Politécnico: Bragança, Portugal, 2015; pp. 1–10. [Google Scholar]
  9. Euromonitor. Beer in Portugal. Available online: https://www.euromonitor.com/beer-in-portugal/report (accessed on 15 August 2020).
  10. Small, E. Hop (Humulus lupulus)—A bitter crop with sweet prospects. Biodiver 2016, 17, 115–127. [Google Scholar] [CrossRef]
  11. Marceddu, R.; Carrubba, A.; Sarno, M. Cultivation trials of hop (Humulus lupulus L.) in semi-arid environments. Heliyon 2020, 6, e05114. [Google Scholar] [CrossRef]
  12. Ruggeri, R.; Loreti, P.; Rossini, F. Exploring the potential of hop as a dual purpose crop in the Mediterranean environment: Shoot and cone yield from nine commercial cultivars. Eur. J. Agron. 2018, 93, 11–17. [Google Scholar] [CrossRef]
  13. Rossini, F.; Virga, G.; Loreti, P.; Provenzano, M.E.; Danieli, P.P.; Roberto, R. Beyond beer: Hop shoot production and nutritional composition under Mediterranean climatic conditions. Agronomy 2020, 10, 1547. [Google Scholar] [CrossRef]
  14. Vidmar, M.; Abram, V.; Čeh, B.; Demšar, L.; Ulrih, N. White hop shoot production in Slovenia: Total phenolic, microelement and pesticide residue content in five commercial cultivars. Food Technol. Biotech. 2019, 57, 525–534. [Google Scholar] [CrossRef] [Green Version]
  15. Sirrine, J.R.; Rothwell, N.; Lizotte, E.; Goldy, R.; Marquie, S.; Brown-Rytlewski, D. Sustainable hop production in the Great Lakes region. Michigan State University Extension Bulletin E-3083. 2010. Available online: https://www.uvm.edu/sites/default/files/media/Sirrine-Sustainable-Hop-Production-in-the-Great-Lakes-Region.pdf (accessed on 12 February 2022).
  16. Čeh, B.; Čremožnik, B. Soil pH and hop (Humulus lupulus) yield related to liming material rate. Hmelj. Bilt. 2015, 22, 49–57. [Google Scholar]
  17. Battacharyya, D.; Babgohari, M.Z.; Rathor, P.; Prithiviraj, B. Seaweed extracts as biostimulants in horticulture. Sci. Hortic. 2015, 196, 39–48. [Google Scholar] [CrossRef]
  18. Bindraban, P.S.; Dimkpa, C.; Nagarajan, L.; Roy, A.; Rabbinge, R. Revisiting fertilisers and fertilisation strategies for improved nutrient uptake by plants. Biol. Fertil. Soils 2015, 51, 897–911. [Google Scholar] [CrossRef] [Green Version]
  19. Balogun, D.A.; Oke, M.A.; Rocha-Meneses, L.; Fawole, O.B.; Omojasola, P.F. Phosphate solubilization potential of indigenous rhizosphere fungi and their biofertilizer formulations. Agron. Res. 2021, 19. [Google Scholar] [CrossRef]
  20. Pascual, P.; Carabio, D.; Abello, N.; Remedios, E.; Pascual, V. Enhanced assimilation rate due to seaweed biostimulant improves growth and yield of rice bean (Vigna umbellata). Agron. Res. 2021, 19, 1863–1872. [Google Scholar] [CrossRef]
  21. Afonso, S.; Arrobas, M.; Rodrigues, M.Â. Soil and plant analyses to diagnose hop fields irregular growth. J. Soil Sci. Plant Nut. 2020, 20, 1999–2013. [Google Scholar] [CrossRef]
  22. Afonso, S.; Arrobas, M.; Morais, J.S.; Rodrigues, M.Â. Agronomic and chemical evaluation of hop cultivars grown under Mediterranean conditions. Span. J. Agric. Res. 2021, 19, e0904. [Google Scholar] [CrossRef]
  23. Afonso, S.; Arrobas, M.; Rodrigues, M.Â. Twenty-years of hop irrigation by flooding the inter-row did not cause a gradient along the row in soil properties, plant elemental composition and dry matter yield. Horticulturae 2021, 7, 194. [Google Scholar] [CrossRef]
  24. Afonso, S.; Arrobas, M.; Rodrigues, M.Â. Response of hops to algae-based and nutrient-rich foliar sprays. Agriculture 2021, 11, 798. [Google Scholar] [CrossRef]
  25. IPMA. Normais Climatológicas. Instituto Português do Mar e da Atmosfera. Available online: http://www.ipma.pt/pt/oclima/normais.clima/ (accessed on 20 July 2020).
  26. Van Reeuwijk, L. Procedures for Soil Analysis; Technical Paper 9; International Soil Reference and Information Centre: Wageningen, The Netherlands, 2002. [Google Scholar]
  27. Walinga, I.; Van Vark, W.; Houba, V.; Van der Lee, J. Soil and Plant Analysis, Part 7: Plant Analysis Procedures; Wageningen Agricultural University: Wageningen, The Netherlands, 1989. [Google Scholar]
  28. Bessada, S.M.F.; Barreira, J.C.M.; Barros, L.; Ferreira, I.C.F.R.; Oliveira, M.B.P.P. Phenolic profile and antioxidant activity of Coleostephus myconis (L.) Rchb.f.: An underexploited and highly disseminated species. Ind. Crop. Prod. 2016, 89, 45–51. [Google Scholar] [CrossRef] [Green Version]
  29. Abram, V.; Čeh, B.; Vidmar, M.; Hercezi, M.; Lazić, N.; Bucik, V.; Možina, S.S.; Košir, I.J.; Kač, M.; Demšar, L.; et al. A comparison of antioxidant and antimicrobial activity between hop leaves and hop cones. Ind. Crop. Prod. 2015, 64, 124–134. [Google Scholar] [CrossRef]
  30. Smoleń, S. Foliar nutrition: Current state of knowledge and opportunities. In Advances in Citrus Nutrition; Srivastava, A.K., Ed.; Springer: New York, NY, USA, 2012; pp. 41–58. [Google Scholar] [CrossRef]
  31. Čeh, B.; Naglič, B.; Luskar, M. Hop (Humulus lupulus L.) cones mass and length at cv. Savinjski golding. Hmelj. Bilt. 2012, 19, 5–16. [Google Scholar]
  32. Matsui, H.; Inui, T.; Oka, K.; Fukui, N. The influence of pruning and harvest timing on hop aroma, cone appearance, and yield. Food Chem. 2016, 202, 15–22. [Google Scholar] [CrossRef] [PubMed]
  33. Rossini, F.; Loreti, P.; Provenzano, M.E.; De Santis, D.; Ruggeri, R. Agronomic performance and beer quality assessment of twenty hop cultivars grown in Central Italy. Ital. J. Agron. 2016, 11, 180. [Google Scholar] [CrossRef] [Green Version]
  34. MacKinnon, D.; Pavlovič, V.; Čeh, B.; Naglič, B.; Pavlovic, M. The impact of weather conditions on alpha-acid content in hop (Humulus lupulus L.) cv. Aurora. Plant Soil Environ. 2020, 66, 519–525. [Google Scholar] [CrossRef]
  35. Treutter, D. Managing phenol contents in crop plants by phytochemical farming and breeding-visions and constraints. Int. J. Mol. Sci. 2010, 11, 807–857. [Google Scholar] [CrossRef] [Green Version]
  36. Li, Y.; Kong, D.; Fu, Y.; Sussman, M.R.; Wu, H. The effect of developmental and environmental factors on secondary metabolites in medicinal plants. Plant Physiol. Biochem. 2020, 148, 80–89. [Google Scholar] [CrossRef]
  37. Zu, Y.; Mei, X.; Li, B.; Li, T.; Li, Q.; Qin, L.; Yang, Z. Effects of calcium application on the yields of flavonoids and saponins in Panax notoginseng under cadmium stress. Int. J. Environ. Anal. Chem. 2020, 1–12. [Google Scholar] [CrossRef]
  38. Drobek, M.; Frac, M.; Cybulska, J. Plant biostimulants: Importance of the quality and yield of horticultural crops and the improvement of plant tolerance to abiotic stress-A review. Agronomy 2019, 9, 335. [Google Scholar] [CrossRef] [Green Version]
  39. Salvi, L.; Brunetti, C.; Cataldo, E.; Niccolai, A.; Centritto, M.; Ferrini, F.; Mattii, G.B. Effects of Ascophyllum nodosum extract on Vitis vinifera: Consequences on plant physiology, grape quality and secondary metabolism. Plant Physiol. Biochem. 2019, 139, 21–32. [Google Scholar] [CrossRef]
  40. Vasantharaja, R.; Abraham, L.S.; Inbakandan, D.; Thirugnanasambandam, R.; Senthilvelan, T.; Jabeen, S.K.A.; Prakash, P. Influence of seaweed extracts on growth, phytochemical contents and antioxidant capacity of cowpea (Vigna unguiculata L. Walp). Biocatal. Agric. Biotechnol. 2019, 17, 589–594. [Google Scholar] [CrossRef]
  41. Chouliaras, V.; Tasioula, M.; Chatzissavvidis, C.; Therios, I.; Tsabolatidou, E. The effects of a seaweed extract in addition to nitrogen and boron fertilization on productivity, fruit maturation, leaf nutritional status and oil quality of the olive (Olea europaea L.) cultivar Koroneiki. J. Sci. Food Agric. 2009, 89, 984–988. [Google Scholar] [CrossRef]
  42. Xu, C.P.; Leskovar, D.I. Effects of A. nodosum seaweed extracts on spinach growth, physiology and nutrition value under drought stress. Sci. Hortic. 2015, 183, 39–47. [Google Scholar] [CrossRef]
  43. Maliar, T.; Nemecek, P.; Urgeova, E.; Maliarova, M.; Nesvadba, V.; Krofta, K.; Vulganova, K.; Kroslak, E.; Kraic, J. Secondary metabolites, antioxidant and anti-proteinase activities of methanolic extracts from cones of hop (Humulus lupulus L.) cultivars. Chem. Pap. 2017, 71, 41–48. [Google Scholar] [CrossRef]
  44. Arruda, T.R.; Pinheiro, P.F.; Silva, P.I.; Bernardes, P.C. A new perspective of a well-recognized raw material: Phenolic content, antioxidant and antimicrobial activities and α- and β-acids profile of Brazilian hop (Humulus lupulus L.) extracts. LWT 2021, 141, 110905. [Google Scholar] [CrossRef]
  45. Kowalczyk, D.; Świeca, M.; Cichocka, J.; Gawlik-Dziki, U. The phenolic content and antioxidant activity of the aqueous and hydroalcoholic extracts of hops and their pellets. J. Inst. Brew. 2013, 119, 103–110. [Google Scholar] [CrossRef]
  46. Keskin, S.; Sirin, Y.; Cakir, H.E.; Keskin, M. An investigation of Humulus lupulus L.: Phenolic composition, antioxidant capacity and inhibition properties of clinically important enzymes. S. Afr. J. Bot. 2019, 120, 170–174. [Google Scholar] [CrossRef]
  47. Gent, D.H.; Sirrine, J.R.; Darby, H.M. Nutrient management and imbalances. In Field Guide for Integrated Pest Management in Hops; Washington Hop Commission: Moxee, WA, USA, 2015; pp. 98–100. Available online: https://ipm.wsu.edu/field/pdf/hophandbook2009.pdf (accessed on 13 April 2019).
  48. Golia, E.; Angelaki, A.; Giannoulis, K.; Skoufogianni, E.; Bartzialis, D.; Cavalaris, C.; Vleioras, S. Evaluation of soil properties, irrigation and solid waste application levels on Cu and Zn uptake by industrial hemp. Agron. Res. 2021, 19, 92–99. [Google Scholar] [CrossRef]
  49. Otalora, G.; Pinero, M.C.; Lopez-Marin, J.; Varo, P.; del Amor, F.M. Effects of foliar nitrogen fertilization on the phenolic, mineral, and amino acid composition of escarole (Cichorium endivia L. var. latifolium). Sci. Hortic. 2018, 239, 87–92. [Google Scholar] [CrossRef]
  50. Elhanafi, L.; Houhou, M.; Rais, C.; Mansouri, I.; Elghadraoui, L.; Greche, H. Impact of excessive nitrogen fertilization on the biochemical quality, phenolic compounds, and antioxidant power of Sesamum indicum L. Seeds. J. Food. Qual. 2019, 2019, 9428092. [Google Scholar] [CrossRef] [Green Version]
  51. Rejmánková, E. Phenolic content and growth of wetland macrophytes: Is the allocation to secondary compounds driven by nutrient availability? Folia Geobot. 2016, 51, 239–250. [Google Scholar] [CrossRef] [Green Version]
  52. Kite, G.; Veitch, N. Assigning glucose or galactose as the primary glycosidic sugar in 3-O-mono-, di- and triglycosides of kaempferol using negative ion electrospray and serial mass spectrometry. Rapid Commun. Mass Spectrom. 2009, 23, 3125–3132. [Google Scholar] [CrossRef] [PubMed]
  53. Magalhães, P.J.; Vieira, J.S.; Gonçalves, L.M.; Pacheco, J.G.; Guido, L.F.; Barros, A.A. Isolation of phenolic compounds from hop extracts using polyvinylpolypyrrolidone: Characterization by high-performance liquid chromatography–diode array detection–electrospray tandem mass spectrometry. J. Chromatogr. A 2010, 1217, 3258–3268. [Google Scholar] [CrossRef] [PubMed]
  54. Sommella, E.; Pagano, F.; Salviati, E.; Chieppa, M.; Bertamino, A.; Manfra, M.; Sala, M.; Novellino, E.; Campiglia, P. Chemical profiling of bioactive constituents in Hop cones and pellets extracts by online comprehensive two dimensional liquid chromatography-tandem mass spectrometry and direct infusion Fourier Transform Ion Cyclotron Resonance MS. J. Sep. Sci. 2017, 41, 1548–1557. [Google Scholar] [CrossRef] [PubMed]
  55. Choi, J.; Taye Desta, K.; Lee, S.; Kim, Y.-H.; Shin, S.; Kim, G.-S.; Lee, S.; Shim, J.H.; Hacımüftüo, A. LC-MS/MS profiling of polyphenol-enriched leaf, stem, and root extracts of Korean Humulus japonicus Siebold & Zucc and determination of their antioxidant effects. Biomed. Chromatogr. 2017, 32, e4171. [Google Scholar] [CrossRef]
  56. Clifford, M.; Johnston, K.; Knight, S.; Kuhnert, N. Hierarchical scheme for LC-MS n Identification of chlorogenic acids. J. Agr. Food Chem. 2003, 51, 2900–2911. [Google Scholar] [CrossRef]
  57. Clifford, M.; Knight, S.; Kuhnert, N. Discriminating between the six isomers of dicaffeoylquinic acid by LC-MS n. J. Agr. Food Chem. 2005, 53, 3821–3832. [Google Scholar] [CrossRef]
  58. Galieni, A.; Di Mattia, C.; De Gregorio, M.; Speca, S.; Mastrocola, D.; Pisante, M.; Stagnari, F. Effects of nutrient deficiency and abiotic environmental stresses on yield, phenolic compounds and antiradical activity in lettuce (Lactuca sativa L.). Sci. Hortic. 2015, 187, 93–101. [Google Scholar] [CrossRef]
  59. Ngadze, E.; Coutinho, T.A.; Icishahayo, D.; van der Waals, J.E. Effect of calcium soil amendments on phenolic compounds and soft rot resistance in potato tubers. Crop. Prot. 2014, 62, 40–45. [Google Scholar] [CrossRef] [Green Version]
  60. Almeida, A.D.R.; Maciel, M.V.D.O.B.; Machado, M.H.; Bazzo, G.C.; de Armas, R.D.; Vitorino, V.B.; Vitali, L.; Block, J.M.; Barreto, P.L.M. Bioactive compounds and antioxidant activities of Brazilian hop (Humulus lupulus L.) extracts. Int. J. Food Sci. Technol. 2020, 55, 340–347. [Google Scholar] [CrossRef]
  61. Santagostini, L.; Caporali, E.; Giuliani, C.; Bottoni, M.; Ascrizzi, R.; Araneo, S.R.; Papini, A.; Flamini, G.; Fico, G. Humulus lupulus L. cv. Cascade grown in Northern Italy: Morphological and phytochemical characterization. Plant Biosyst. 2020, 154, 316–325. [Google Scholar] [CrossRef]
  62. McAdam, E.L.; Vaillancourt, R.E.; Koutoulis, A.; Whittock, S.P. Quantitative genetic parameters for yield, plant growth and cone chemical traits in hop (Humulus lupulus L.). BMC Genet. 2014, 15, 22. [Google Scholar] [CrossRef]
Figure 1. Average monthly temperature and precipitation during the three years of the study.
Horticulturae 08 00385 g001
Figure 2. Schematic view of the experiments, including the four field trials reported in this study.
Horticulturae 08 00385 g002
Figure 3. Total phenols as a function of year and hop plant vigour (weak—W, fair—F, good—G and very good—VG) and year. Error bars are the standard errors (α = 0.05).
Horticulturae 08 00385 g003
Figure 4. Total phenols as a function of year, plant vigour (weak—W, fair—F, good—G and very good—VG) and foliar treatment (Fnut, nutrient-rich foliar spray; Algae, algae-rich foliar spray; and Control). Error bars are the standard errors (α = 0.05).
Horticulturae 08 00385 g004
Figure 5. Total phenols as a function of year, plot (P5 and P6) and liming (L, limed; and C, not limed). Error bars are the standard errors (α = 0.05).
Horticulturae 08 00385 g005
Figure 6. Total phenols as a function of year and cultivar. Error bars are the standard errors (α = 0.05).
Horticulturae 08 00385 g006
Figure 7. Chromatographic profile obtained at 280 nm (A) and 370 nm (B) of a hop cone extract (Cascade cultivar). The peaks 1 to 13 correspond to the phenolic compounds identified in Table 4.
Horticulturae 08 00385 g007
Table 1. Selected soil properties (average ± standard deviation; n = 3) determined just before the start of the experiments from soil samples collected in plots of different plant vigour (weak, fair, good and very good) at 0–0.20 m depth.
Soil PropertiesPlot 1
(Weak)
Plot 2
(Fair)
Plot 3
(Good)
Plot 4
(Very Good)
Plot 5
(Very Good)
Plot 6
(Very Good)
Clay (%) a27.0 ± 5.835.0 ± 4.622.1 ± 2.018.1 ± 1.817.7 ± 2.116.8 ± 0.9
Silt (%) a21.6 ± 10.722.8 ± 4.45.1 ± 1.635.5 ± 5.724.7 ± 3.224.3 ± 3.1
Sand (%) a51.4 ± 16.542.2 ± 2.472.8 ± 18.446.4 ± 6.957.6 ± 4.858.9 ± 8.5
pHH2O b5.8 ± 0.125.8 ± 0.045.5 ± 0.105.1 ± 0.135.8 ± 0.035.3 ± 0.03
Organic carbon (g kg−1) c13.4 ± 0.2015.7 ± 0.107.6 ± 0.0414.5 ± 0.2017.2 ± 0.0819.4 ± 0.07
Extract. P (mg P2O5 kg−1) d283 ± 45452 ± 34191 ± 28213 ± 28296 ± 20289 ± 16
Extract. K (mg K2O kg−1) d116 ± 7193 ± 9111 ± 6286 ± 5332 ± 9162 ± 6
Exch. Ca (cmolc kg−1) e14.8 ± 1.8423.3 ± 1.3910.7 ± 0.172.7 ± 0.464.9 ± 0.244.6 ± 0.18
Exch. Mg (cmolc kg−1) e4.8 ± 0.849.5 ± 1.222.7 ± 0.070.5 ± 0.040.7 ± 0.030.6 ± 0.02
Exch. K (cmolc kg−1) e0.3 ± 0.020.5 ± 0.040.2 ± 0.010.5 ± 0.080.6 ± 0.030.3 ± 0.01
Exch. Na (cmolc kg−1) e0.2 ± 0.050.6 ± 0.050.1 ± 0.010.3 ± 0.060.06 ± 0.010.05 ± 0.01
Exch. acidity (cmolc kg−1) e0.3 ± 0.030.3 ± 0.020.2 ± 0.030.6 ± 0.130.2 ± 0.020.4 ± 0.03
CEC (cmolc kg−1) e20.7 ± 2.6434.4 ± 2.5614.0 ± 0.215.1 ± 0.376.7 ± 0.286.5 ± 0.17
a Pipette method; b Potentiometry; c Walkley–Black; d Egner–Riehm; e Ammonium acetate, pH 7.
Table 2. PCA results for total phenols and nutrient concentrations on hop cones from 2016 to 2018.
PC1PC2PC3PC4
Eigenvalue2.5692.0281.8111.294
Cronbach’s Alpha0.6720.5580.4920.250
Explained variance23.3518.4416.4611.77
Cumulative variance23.3541.7958.2570.02
Variable Loadings
Total phenols−0.730−0.359−1.6060.753
Nitrogen1.391−1.1950.3690.618
Phosphorus1.516−0.091−0.555−0.074
Potassium−1.206−0.8670.2161.134
Calcium0.272−1.982−0.0140.311
Magnesium1.319−0.363−0.5841.707
Iron0.0541.2260.8221.147
Manganese−0.868−0.5721.1361.238
Copper0.3611.2651.0711.363
Zinc1.277−0.1791.409−0.823
Boron−0.668−1.0771.578−0.605
PC—principal component; values in bold correspond to the higher loadings of each variable in the respective PC.
Table 3. Correlation matrix of total phenols (TPH) and nutrient in hop cones, with Spearman correlation coefficients.
TPHNPKCaMgFeMnCuZnB
TPH1
N−0.223 **1
P−0.0080.412 **1
K0.114−0.052−0.266 **1
Ca0.1380.393 **0.1030.0781
Mg−0.0510.513 **0.295 **0.0320.1471
Fe−0.186 *−0.077−0.069−0.126−0.220 **0.232 **1
Mn0.074−0.016−0.298 **0.402 **0.019−0.191 *0.0961
Cu−0.295 **0.0280.047−0.139−0.356 **0.294 **0.520 **0.1161
Zn−0.456 **0.345 **0.371 **−0.269 **0.1380.0050.100−0.0710.197 *1
B−0.1050.074−0.176 *0.250 **0.348 **−0.273 **−0.0580.311 **−0.0700.223 **1
*, ** Significant correlations according to selected significance levels, 0.05 and 0.01, respectively.
Table 4. Retention time (Rt), wavelengths of maximum absorption (λmax), mass spectral data, and identification of the phenolic compounds present in hop cones extract: 3-CQA (3-O-Caffeoylquinic acid), cis 3-p-CoQA (cis 3-p-Coumaroylquinic acid), trans 3-p-CoAD (trans 3-p-Coumaroylquinic acid), 4-CQA (4-O-Caffeoylquinic acid), 5-CQA (5-O-Caffeoylquinic acid), Q-3-2Rh-Ru (Quercetin-3-O-(2-rhamnosyl)-rutinoside), K-3-2Rh-Ru (Kaempferol-3-O-(2-rhamnosyl)-rutinoside), Q-3-Ru (Quercetin-3-O-rutinoside), Q-3-H (Quercetin-3-O-hexoside), Q-3-6M-G (Quercetin-3-O-(6-O-malonyl)-glucoside), K-3-Ru (Kaempferol-3-O-rutinoside), K-3-G (Kaempferol-3-O-glucoside), K-3-6M-G (Kaempferol-3-O-(6-O-malonyl)-glucoside).
PeakTentative IdentificationRt
(min)
λmax
(nm)
[M-H]
(m/z)
MS2
13-CQA4.80340353191(100), 179(47), 173(3), 135(7)
2cis 3-p-CoQA5.46310337191(10), 163(100), 119(10)
3trans 3-p-CoAD6.31310337191(53), 163(100), 119(12)
44-CQA6.86325353191(14), 179(53), 173(100), 135(2)
55-CQA7.25323353191(100), 179(15),173(5), 135(2)
6Q-3-2Rh-Ru14.6330755609(45), 591(94), 573(12), 489(70), 301(100)
7K-3-2Rh-Ru16.59330739593(26), 575(100), 393(8), 285(38)
8Q-3-Ru17.86353609301(100)
9Q-3-H19.06351463301(100)
10Q-3-6M-G20.29353549505(100), 463(25), 301(50)
11K-3-Ru21.15347593285(100)
12K-3-G22.52345447285(100)
13K-3-6M-G24.72347533489(100), 285(20)
Table 5. Phenolic compound quantification (mean ± standard deviation) in hop cone samples from 2017 as a function of foliar treatments (Fnut, nutrient-rich foliar spray; Algae, algae-rich foliar spray; and Control) and liming: 3-CQA (3-O-Caffeoylquinic acid), cis 3-p-CoQA (cis 3-p-Coumaroylquinic acid), trans 3-p-CoAD (trans 3-p-Coumaroylquinic acid), 4-CQA (4-O-Caffeoylquinic acid), 5-CQA (5-O-Caffeoylquinic acid), Q-3-2Rh-Ru (Quercetin-3-O-(2-rhamnosyl)-rutinoside), K-3-2Rh-Ru (Kaempferol-3-O-(2-rhamnosyl)-rutinoside), Q-3-Ru (Quercetin-3-O-rutinoside), Q-3-H (Quercetin-3-O-hexoside), Q-3-6M-G (Quercetin-3-O-(6-O-malonyl)-glucoside), K-3-Ru (Kaempferol-3-O-rutinoside), K-3-G (Kaempferol-3-O-glucoside), K-3-6M-G (Kaempferol-3-O-(6-O-malonyl)-glucoside).
Phenolic Compounds
(mg kg−1, dw)
Foliar TreatmentLimestone Treatment
FnutAlgaeControlLimedControl
3-CQA37.1 ± 16.4a39.8 ± 15.7a40.5 ± 10.4a24.4 ± 7.0a21.5 ± 6.4a
cis 3-p-CoQA27.9 ± 3.0a23.8 ± 6.9a28.0 ± 3.9a5.7 ± 3.6a5.8 ± 7.1a
trans 3-p-CoAD23.6 ± 6.9a16.0 ± 6.0a19.0 ± 4.1a1.1 ± 2.2a4.2 ± 7.3a
4-CQA24.4 ± 1.7a23.2 ± 1.0a25.3 ± 1.9a24.5 ± 4.8a7.6 ± 15.2a
5-CQA31.1 ± 7.8a26.1 ± 3.5a28.7 ± 3.7a5.3 ± 10.7a5.6 ± 11.2a
Q-3-2Rh-Ru47.5 ± 0.2a47.0 ± 0.3a47.2 ± 0.2a46.7 ± 0.4a47.7 ± 1.4a
K-3-2Rh-Ru46.5 ± 0.1a46.5 ± 0.2a46.5 ± 0.1a46.5 ± 0.2a11.6 ± 23.2b
Q-3-Ru56.1 ± 0.8a54.5 ± 4.0a58.5 ± 1.5a50.6 ± 1.1a50.5 ± 2.1a
Q-3-H72.6 ± 5.1a64.6 ± 4.6a71.5 ± 1.5a54.6 ± 4.5a56.6 ± 6.7a
Q-3-6M-G93.1 ± 4.8a84.9 ± 9.0a96.5 ± 6.4a70.2 ± 3.9a66.1 ± 10.3a
K-3-Ru50.2 ± 1.3a49.6 ± 1.5a51.0 ± 0.3a47.5 ± 0.7a46.9 ± 0.5a
K-3-G52.1 ± 0.6a50.8 ± 1.1a52.3 ± 0.6a48.0 ± 0.4a36.2 ± 24.2a
K-3-6M-G59.1 ± 3.5a57.3 ± 3.3a62.3 ± 2.7a52.4 ± 1.2a51.3 ± 3.1a
Total phenolic compounds621.4 ± 32.8a584.1 ± 52.0a627.2 ± 13.6a477.6 ± 25.4a414.0 ± 81.0a
Means followed by the same letter are not statistically different by Tukey HSD (Foliar Treatment) or t-Student (Limestone treatment) tests (α = 0.05).
Table 6. Phenolic compound quantification (mean ± standard deviation) in hop cone samples from 2017 as a function of the cultivar: 3-CQA (3-O-Caffeoylquinic acid), cis 3-p-CoQA (cis 3-p-Coumaroylquinic acid), trans 3-p-CoAD (trans 3-p-Coumaroylquinic acid), 4-CQA (4-O-Caffeoylquinic acid), 5-CQA (5-O-Caffeoylquinic acid), Q-3-2Rh-Ru (Quercetin-3-O-(2-rhamnosyl)-rutinoside), K-3-2Rh-Ru (Kaempferol-3-O-(2-rhamnosyl)-rutinoside), Q-3-Ru (Quercetin-3-O-rutinoside), Q-3-H (Quercetin-3-O-hexoside), Q-3-6M-G (Quercetin-3-O-(6-O-malonyl)-glucoside), K-3-Ru (Kaempferol-3-O-rutinoside), K-3-G (Kaempferol-3-O-glucoside), K-3-6M g (Kaempferol-3-O-(6-O-malonyl)-glucoside).
Phenolic Compounds
(mg kg−1 Dry Matter)
Cultivar
NuggetColumbusCascade
3-CQA40.5 ± 10.4a32.6 ± 5.9a40.7 ± 9.9a
cis 3-p-CoQA28.0 ± 3.9a24.6 ± 14.9a11.6 ± 6.0a
trans 3-p-CoAD19.0 ± 4.1a15.1 ± 4.9ab9.0 ± 2.5b
4-CQA25.3 ± 1.9ab28.2 ± 7.9a14.7 ± 3.2b
5-CQA28.7 ± 3.7ab22.1 ± 3.2b32.1 ± 2.9a
Q-3-2Rh-Ru47.2 ± 0.2b46.8 ± 0.2b50.3 ± 0.6a
K-3-2Rh-Ru46.5 ± 0.1b46.6 ± 0.1b54.5 ± 2.4a
Q-3-Ru58.5 ± 1.5b52.3 ± 1.4b72.4 ± 5.2a
Q-3-H71.5 ± 1.5a62.3 ± 4.9b56.9 ± 1.6b
Q-3-6M-G96.5 ± 6.4a77.2 ± 11.4ab71.5 ± 4.7b
K-3-Ru51.0 ± 0.3b51.5 ± 1.4b74.2 ± 3.1a
K-3-G52.3 ± 0.6b54.9 ± 2.9ab58.5 ± 2.2a
K-3-6M-G62.3 ± 2.7a71.3 ± 10.7a76.1 ± 4.8a
Total phenolic compounds627.2 ± 13.6a585.3 ± 61.8a622.6 ± 35.7a
Means followed by the same letter are not statistically different by Tukey HSD tests (α = 0.05).
Publisher’s Note: MDPI stays neutral with regard to jurisdictional claims in published maps and institutional affiliations.

