Article

Characterization of Young Shoot Population, Yield, and Nitrogen Demands of Tea (Camellia sinensis L.) Harvested under Different Standards

Key Laboratory of Tea Biology and Resources Utilization, Tea Research Institute of Chinese Academy of Agricultural Sciences and Ministry of Agriculture, Hangzhou 310008, China
*
Author to whom correspondence should be addressed.
These authors contributed equally to this work.
Horticulturae 2022, 8(4), 275; https://doi.org/10.3390/horticulturae8040275
Submission received: 22 February 2022 / Revised: 18 March 2022 / Accepted: 18 March 2022 / Published: 22 March 2022
(This article belongs to the Special Issue Advances in Tea Plant Biology and Tea Quality Regulation)

Abstract

:
The quality of green tea is greatly influenced by the harvest standards for young shoots. The present field experiment was conducted to characterize the young shoot populations, yields, and nitrogen (N) demands of tea plants subjected to four different harvest standards, i.e., buds with one, two, or three young expanding leaves (referred to as B1L, B2L, and B3L, respectively) and a combination of B1L and B3L (B1L/B3L) throughout the year. Weight per shoot was closely related to the number of expanding leaves and was greater in B3L than B1L and B2L, and also greater in summer and autumn than in spring, whereas B1L revealed the greatest young shoot density and highest N concentration. Annual shoot yield and shoot N content were largest in B3L and decreased in the following order: B3L > B2L ≈ B1L/B3L > B1L. However, in the early spring the shoot density, yield, and shoot N content of B1L were much higher than those of B3L. The harvest of B3L significantly reduced the biomass of brown roots and its ratio against the above-ground biomass compared to other harvest standards, suggesting a decreased allocation of carbon to the root system due to seasonal removal. The N dilution curve (Nys = a × Yysb, where Nys is the shoot N content and Yys is the shoot yield) of spring tea differed markedly from those of summer and autumn teas, suggesting different coordination properties for shoot growth and N supply among the seasons. The annual harvest index (NHI) measured by 15N traces ranged between 0.18 and 0.23, indicating relatively low N allocation to young shoots, whereby large proportions (58.2–66.9% of the total 15N absorption) remained in the plant at the end of the experiment. In conclusion, the seasonal distribution of the shoot density, weight per shoot, yield, and N demands vary with harvest standards and highlight the importance of N precision management in tea production to be finely tuned to meet the changes in harvest season and requirements.

1. Introduction

Tea is widely consumed throughout the world. Young shoots consisting of a bud with several expanding leaves are harvested and usually processed into various teas, such as green, black, and oolong. The content and composition of a tea’s chemical components change during the development of young shoots [1,2,3,4]. Therefore, the quality of tea is greatly influenced by the developmental stage of the young shoots [5,6,7]. To produce tea of a desired quality, young shoots are harvested at defined shoot stages (standards) with specific selectivity and intensity [8]. In sub-tropical areas, tea seasons are empirically divided into spring (late March and April), summer (May, June, and July), and autumn (August and September) based on their different quality characteristics [9]. The quality of green tea in the subtropical areas of China varies among production seasons, and spring tea is of better quality than summer and autumn teas [9,10]. Spring tea is further separated into early and late spring teas, as these teas differ in quality and market price [11]. Tender young shoots consisting of a bud with one expanding leaf or only a single bud are harvested in early spring to produce premium green tea of the highest quality [11]. The average price of premium green tea is approximately three times that of common tea produced from a bud and three or more expanding leaves. Today, premium green teas account for over 70% of the total tea value and approximately 49% of the total tea quantity. When tea output surpasses consumption, stricter harvest policies produce much better economic benefits and marketing prospects, despite the fact that some yield is sacrificed [12]. Nonetheless, the seasonal distributions of shoot populations, yields, and nutrient demands associated with different harvest standards have not been fully characterized.
Nitrogen (N) is the most abundant nutrient in the tea plant and is preferentially allocated to actively growing young shoots [13]. N nutrition has profound effects on young shoot growth, yield, and quality [14,15,16,17,18,19]. The optimal N level for supply depends on the quality requirements of the different tea types [14,20], the clone, and the plantation age [21]. In addition, nitrogen influences water availability [22,23] and the levels of other nutrients such as potassium [24]. Nevertheless, most field experiments have been carried out under the conditions of the defined harvest standards (buds with 2–4 expanding leaves). Only a few studies have investigated the interactions between N nutrition and harvest policies [7,25]. Cloughley et al. reported that yield was more influenced by high N application when young shoots were harvested at more mature stages (coarser plucking standards) [25]. Other work showed no significant interactions between the N rate, plucking interval, and plucking standard [7]. Our knowledge is very limited concerning young shoot characteristics, yield, and N demands in tea plantations harvested under different standards. The present field experiment was conducted to determine the responses in terms of shoot populations and yields to different harvest standards. We also focused on the dynamic changes and seasonality of shoot N demands and the relationship with biomass production.

2. Materials and Methods

2.1. Experimental Site and Tea Plantation

A field experiment was conducted for three years in the experimental tea plantation belonging to the Tea Research Institute of the Chinese Academy of Agricultural Sciences located at Hangzhou, Zhejiang province, China (120.05° E, 30.10° N, 64 m above sea level). The site is characterized by a monsoon climate, with an annual mean precipitation rate of 1533 mm and annual mean temperature of 17.0 °C (Supplementary Figure S1). The soil was red soil derived from quaternary red clay. At a depth of 0–20 cm the pH was 4.30, as measured in 1:2.5 water paste using a glass electrode (Orion 3 Star, Thermo Ltd., Waltham, MA, USA). The contents of soil organic carbon and total nitrogen were 21.9 g kg−1 and 1.24 g kg−1, respectively, which were measured using a C/N elemental analyzer (Vario Max, Elementar, Langenselbold, Germany). Soil-available P, K, and Mg were extracted using the Mehlich 3 method [26], with values of 43, 181, and 65 mg kg−1, respectively, measured using inductive coupled plasma (Thermo Jarrell Ash Ltd., Franklin, MA, USA). The tea plantation was established from rooted cuttings of clone Longjing 43, a famous clone used for the production of premium green tea (Longjing tea), and the age of the plants was 7 years old. Each bush consisting of two rooted cuttings was cultivated at a distance of 0.33 m into lines, with a distance of 1.5 m between lines.

2.2. Harvest Standard

There were four harvest standards, namely buds with one, two, or three young expanding leaves throughout the year and a combination of buds with one and three expanding leaves in spring and summer or autumn, respectively (hereafter referred to as B1L, B2L B3L, and B1L/3L, respectively). The harvest standard (treatment) was determined visually by the number of expanding leaves. The four harvest standards mimicked different production systems prevalent in green tea production areas. The harvest standard for the youngest shoots (B1L) represented the production of ‘premium green teas’, such as Longjing tea. The harvest standards for B2L and B3L represented ‘common green tea’ production systems. The combination harvest represented the production of ‘premium green tea’ in the spring and ‘common green tea’ in the summer and autumn. All harvests were performed by hand when young shoots had achieved the required developmental stage following the standards. Each treatment was replicated four times. Before the experiment, the plants were harvested at B1L standards only in spring for the production of Longjing tea. A uniform canopy height was maintained by light pruning (removing 5–8 cm top leaves and twigs). After the spring tea season in the second experimental year, tea plants were deeply pruned at a height of 60 cm above ground, allowed to recover, and harvested regularly from July of the same year.

2.3. Fertilization

All treatments received sufficient nutrients in identical amounts: N (400 kg ha−1), P (150 kg P2O5 ha−1), K (150 kg K2O ha−1), and Mg (30 kg MgO ha−1). The N fertilizer was separated into four applications per year in the form of urea. Thirty percent of N was applied at soil depths of 15–20 cm in mid-October as a basal dressing along with other fertilizers, including single superphosphate, potash of sulphate, and kieserite. Basal fertilizers were applied into 15–20-cm-deep furrows in the middle space between the two rows and the soil was replaced after application. The remaining N fertilizer was applied at soil depths of 5–10 cm in mid-February (30%), mid-May (20%), and late July (20%), preceding the spring, summer, and autumn teas. In October of year 1 before basal fertilization, one bush in each plot was isolated using four plastic boards and vertically embedded into the soil to a depth of 40 cm. The size of the resulting micro-plots measured 0.495 m2 (0.33 × 1.5 m). 15N-labelled urea (abundance of 5.25%, purchased from Shanghai Research Institute of Chemical Industry Co., Ltd., Shanghai, China) was applied to micro-plots at similar timings (October, February, May, and July) in the same amounts as normal urea specified in [27]. In October of year 2, all plants received normal urea.

2.4. Sampling and Measurement of Parameters

The number of young shoots that conformed to harvest standards was counted using an iron wire frame measuring 0.25 m2 that had been pre-installed on the surface of the canopy. The shoot number was then converted to shoots per square meter, hereafter referred to as the shoot density. At each harvest, young shoots were randomly sampled, counted, and weighed for fresh and dry weight after being dried in an electric oven at 70 °C for 48 h. The moisture content and the weight per young shoot were then calculated. In November of year 3, the whole plants in the micro-plots were sampled and separated into fibrous roots and brown roots (at 50 cm depth), stems, and leaves. Plant samples were dried at 70 °C in an electric oven and ground until homogenous with a ball mill (Mixer Mill MM301, Retsch GmbH & Co. KG, Haan, Germany).
Total N concentrations of plant samples were measured with a CN analyzer (Vario Max, Elementar Analysensysteme GmbH, Langenselbold, Germany). The abundance of 15N in the plant samples was determined using an elemental analyzer (Thermo NE 1112) interfaced (ConFlo III) with an isotope ratio mass spectrometer (ΔPlusAD, Thermo Finnigen, Bremen, Germany). For 15N analysis, samples of teas from the same plot were pooled into groups according to harvest date in early spring (late March and early April), late spring (middle and late April), summer (May, June, and July), and autumn (August and September). The proportion of 15N derived from fertilizer N (Ndff%) and the amount of 15N were calculated according to equations presented in [27]. Total plant 15N absorption was calculated as the sum of its amounts in young shoots, prunings, and above-ground parts and roots of the final plant. The annual 15N harvest index (NHI) was calculated as the ratio between the shoot 15N and total above-ground 15N (the sum of 15N in young shoots, prunings, and the above-ground part of the final plant) divided by 2 (the duration of the 15N experiment). The young shoot harvest index (SHI) was calculated as the ratio of young shoot yields against total above-ground biomass (the sum of young shoots, biomass of prunings, and the above-ground part of the final plant) divided by three (the duration of the experiment).

2.5. Statistical Analysis

One-way analysis of variance (ANOVA) combined with the least significant difference (LSD) test was used to compare the effects of different harvest standards. Pearson’s correlation analysis was performed for these parameters. The relationship between mean shoot N content (Nys, kg ha−1) and shoot yield (Yys, t ha−1) values in the spring, summer, and autumn tea seasons within the three experimental years was described by the following empirical formula (Nys = a × Yysb) for non-limiting N conditions [28]. All statistical analyses were performed using SigmaStat embedded in SigmaPlot (Version 12.5, Systat Software, Inc., CA, USA).

3. Results

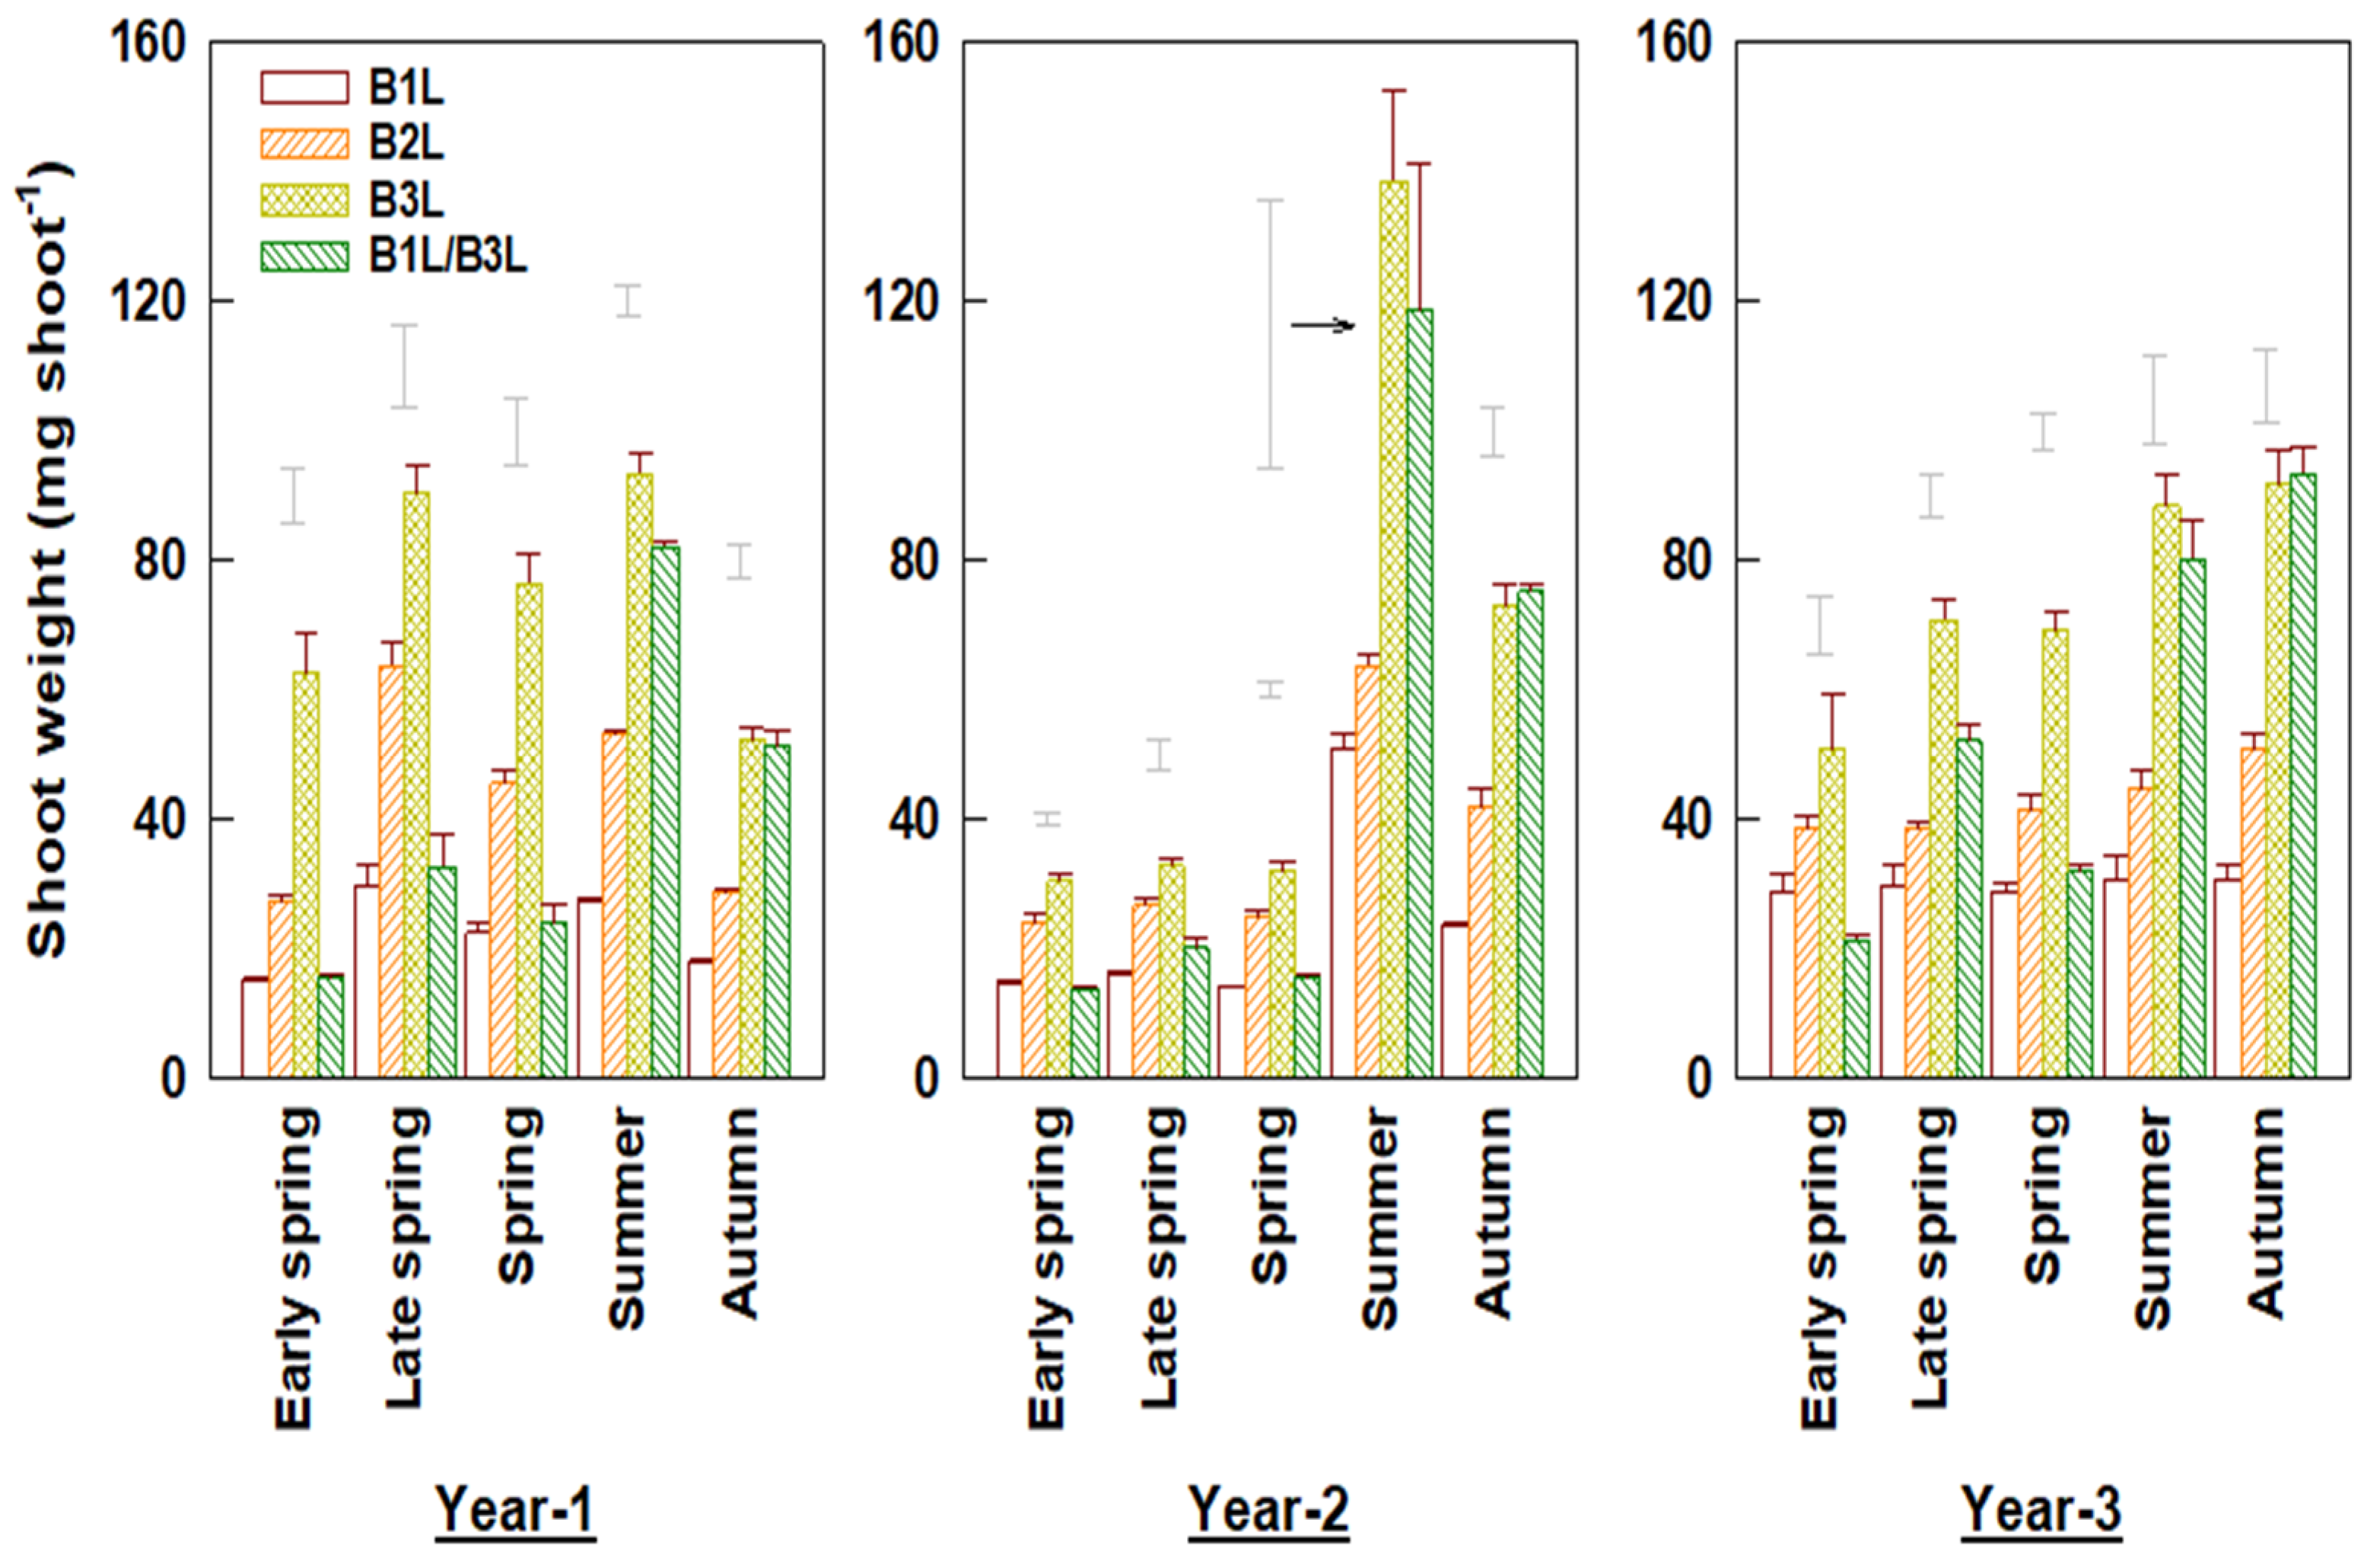
3.1. Weight per Young Shoot

The weight per young shoot was significantly affected by the harvest standard (Figure 1). The harvest at B3L resulted in larger shoot sizes and greater shoot weight than other standards (e.g., B1L or B2L). The weight per shoot was closely related to the number of expanding leaves, and the relationship was well described using linear regressions (R2 = 0.825−0.966, p < 0.001) (Table 1). The shoot weights varied greatly among seasons. The spring tea weight per shoot was less than in summer and autumn teas. This was also reflected in the different coefficient-b values (Table 1). The shoot weights also differed significantly between early and late spring (Figure 1). In the three experimental years, the average shoot weights in the early spring were 13.0%, 30.5%, and 23.7% lower than in the late spring for B1L, B2L, and B3L, respectively. The weight per shoot also varied greatly among years (Figure 1). In year 2, young shoots in spring were especially small but became larger in the summer tea season after deep pruning at the end of spring.

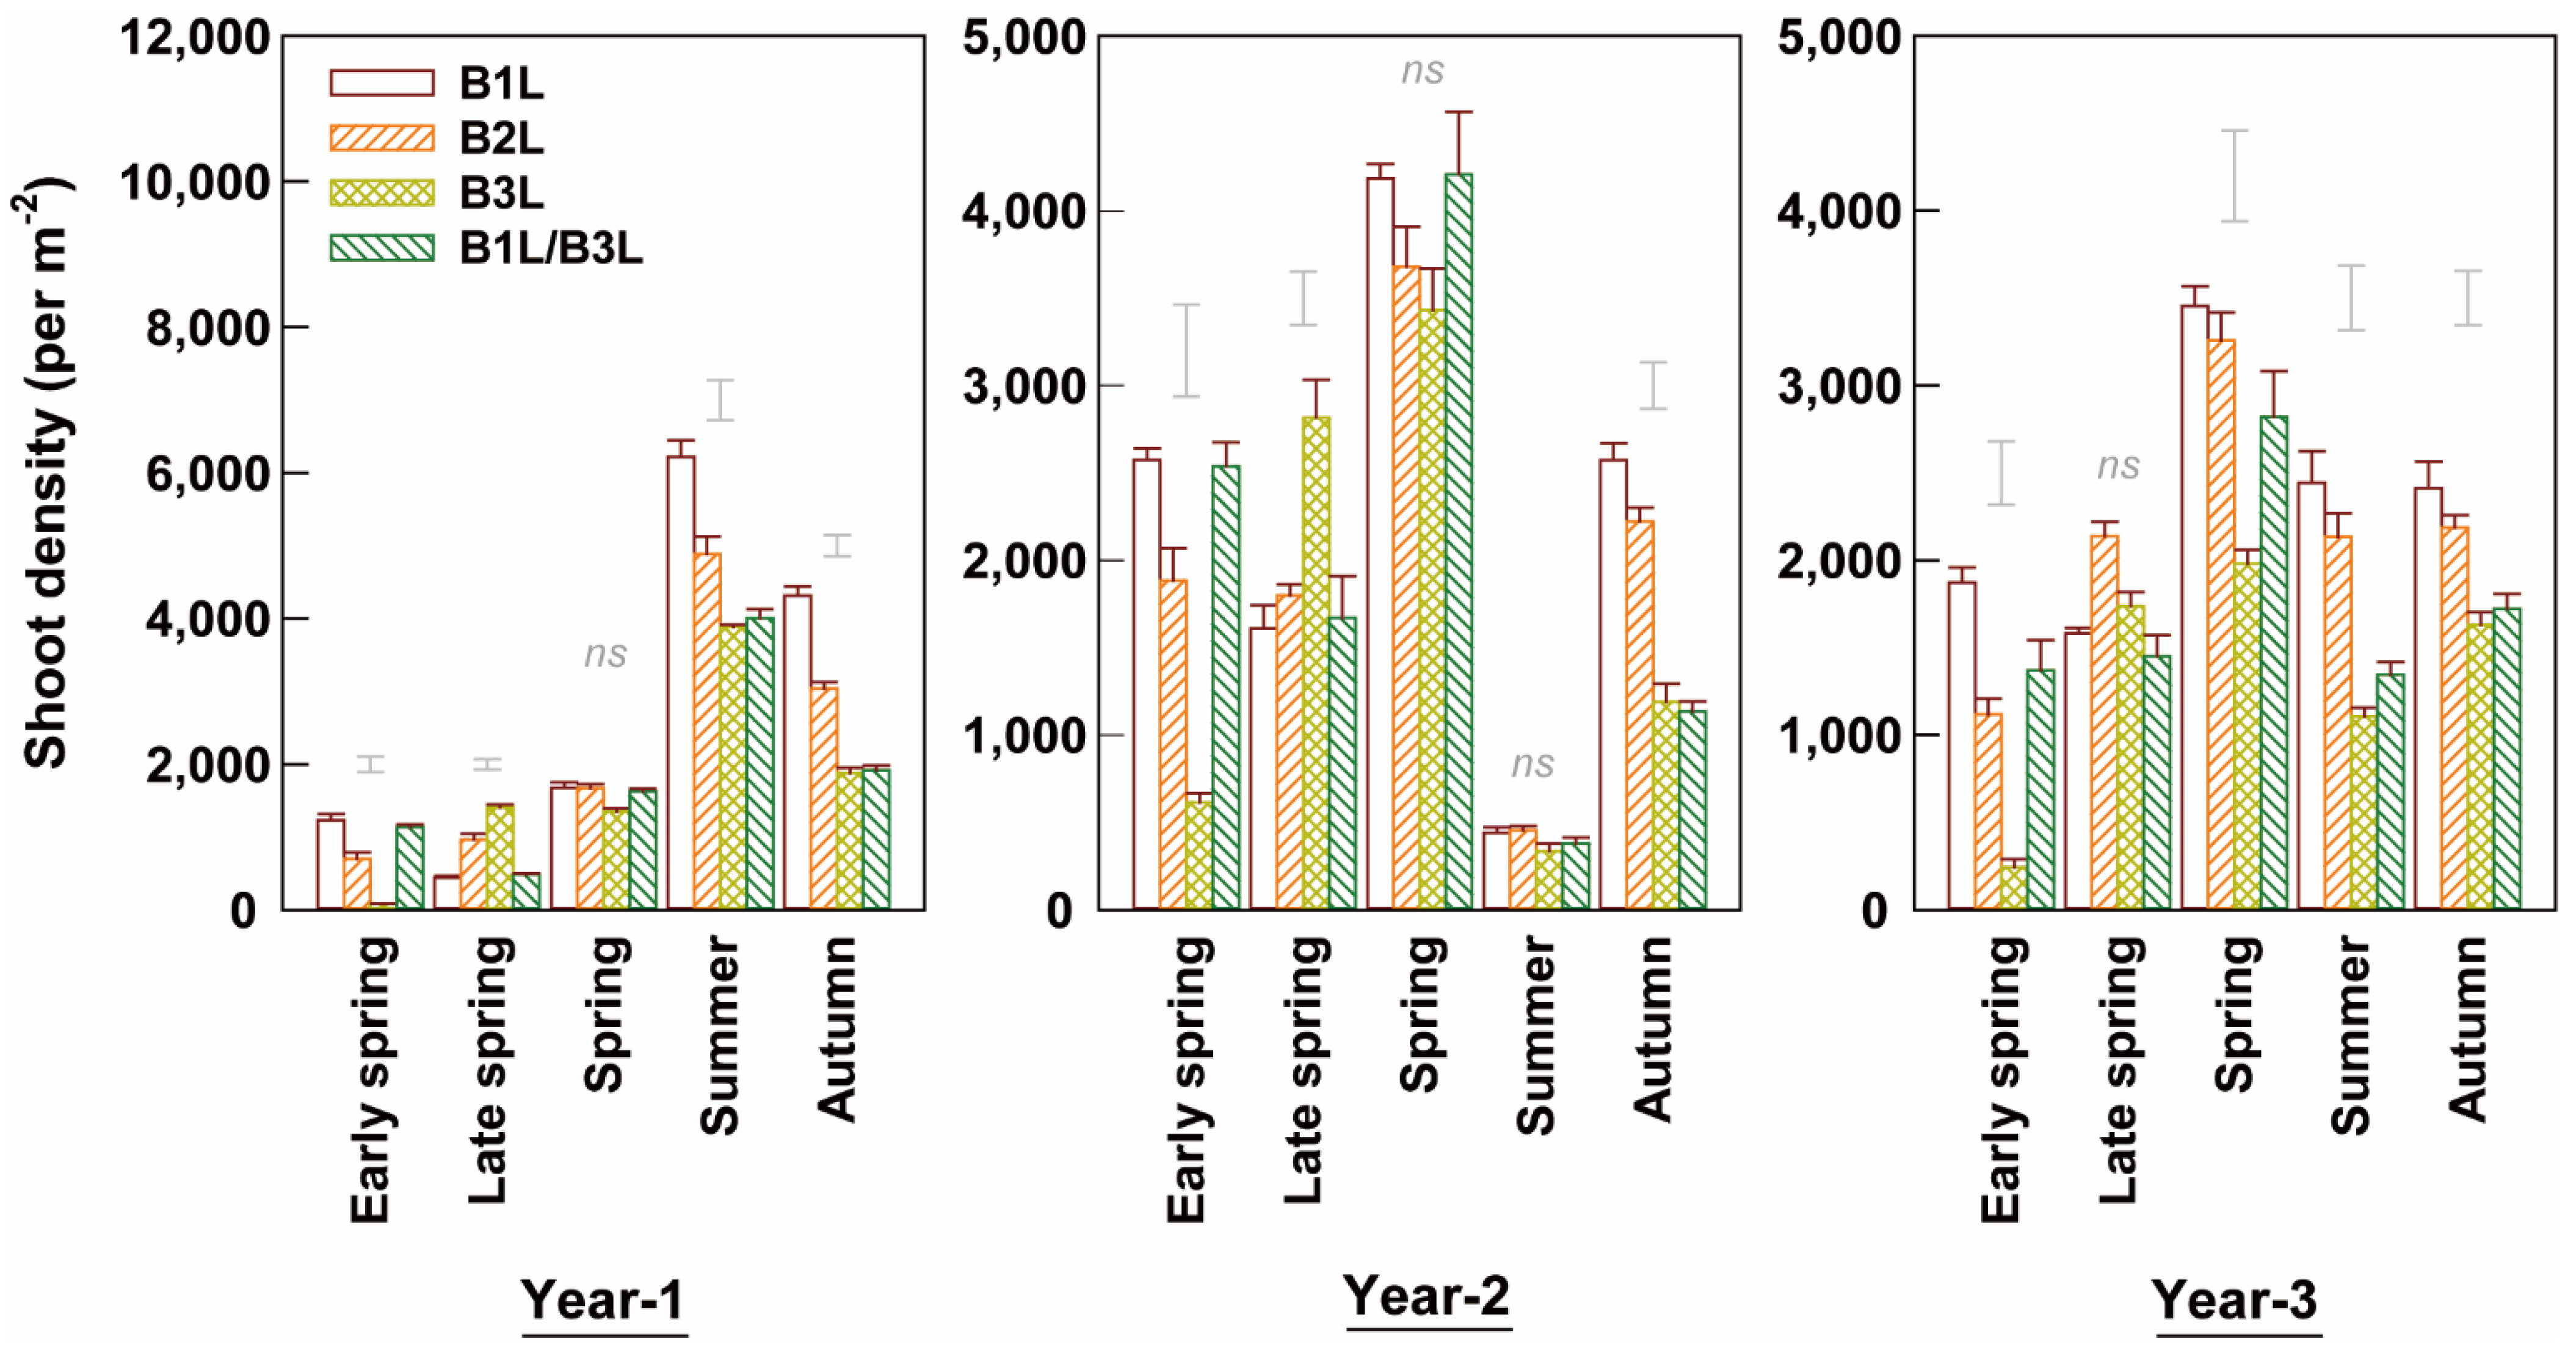
3.2. Young Shoot Density
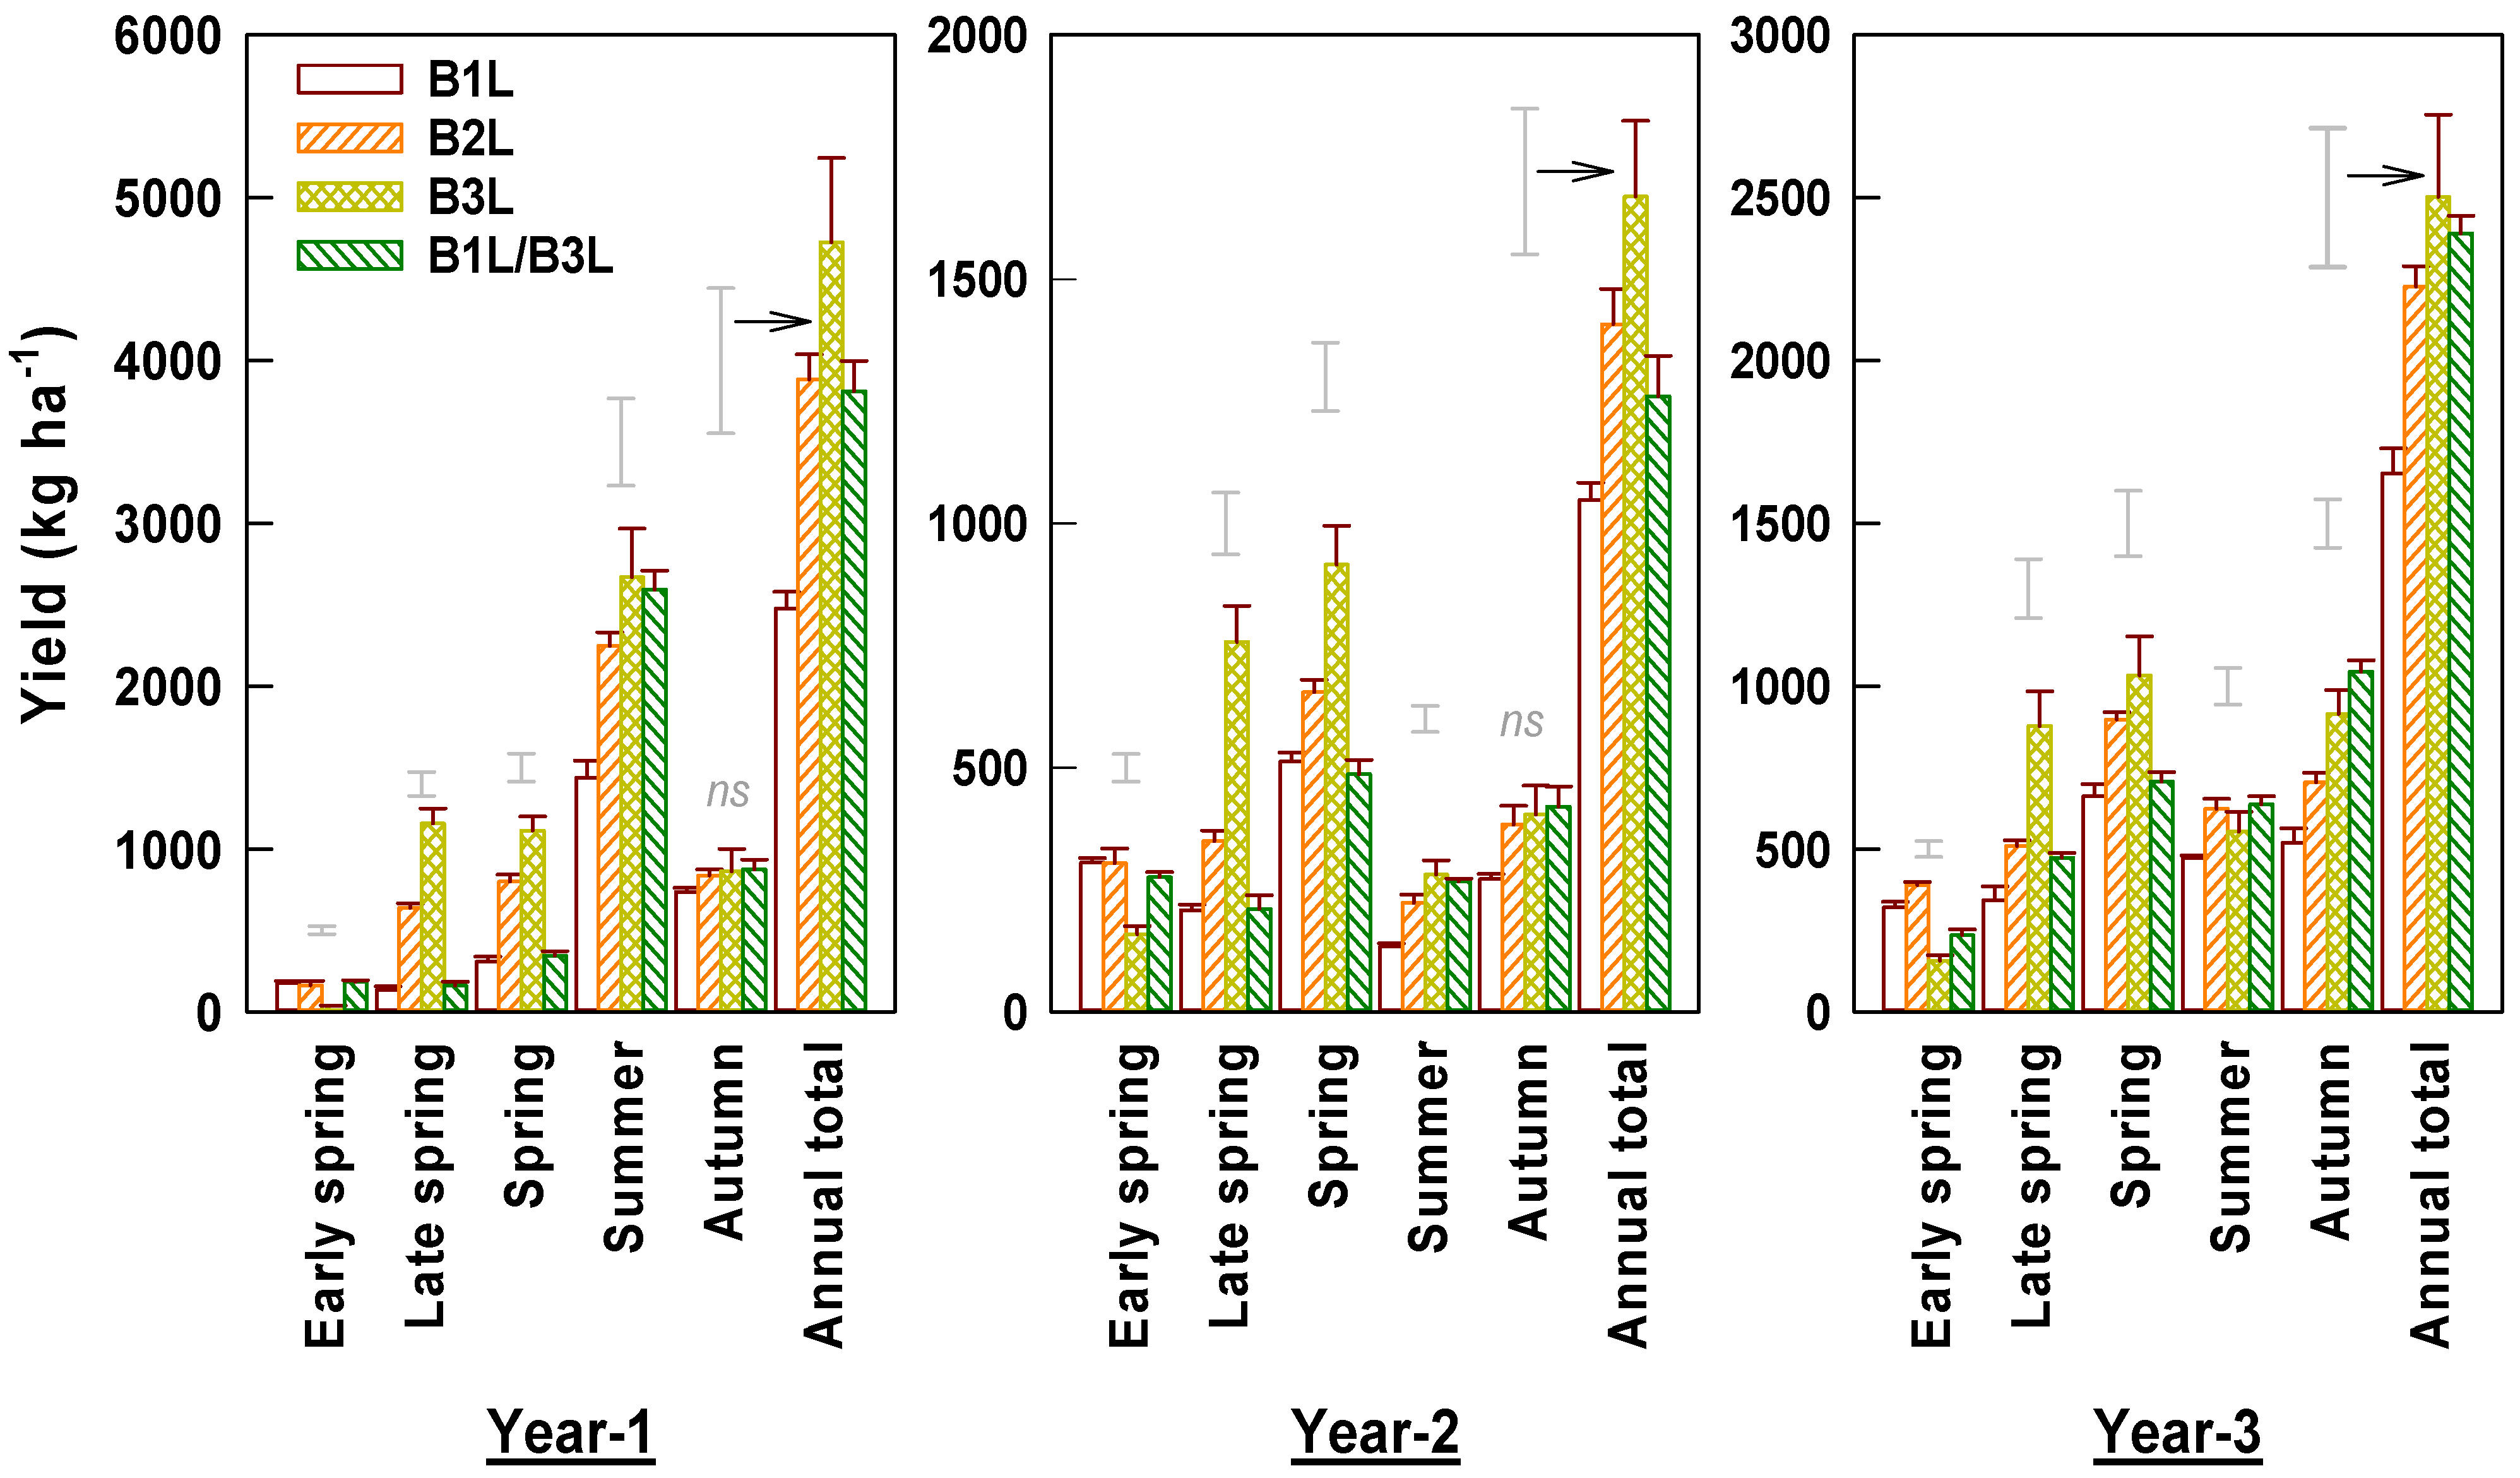
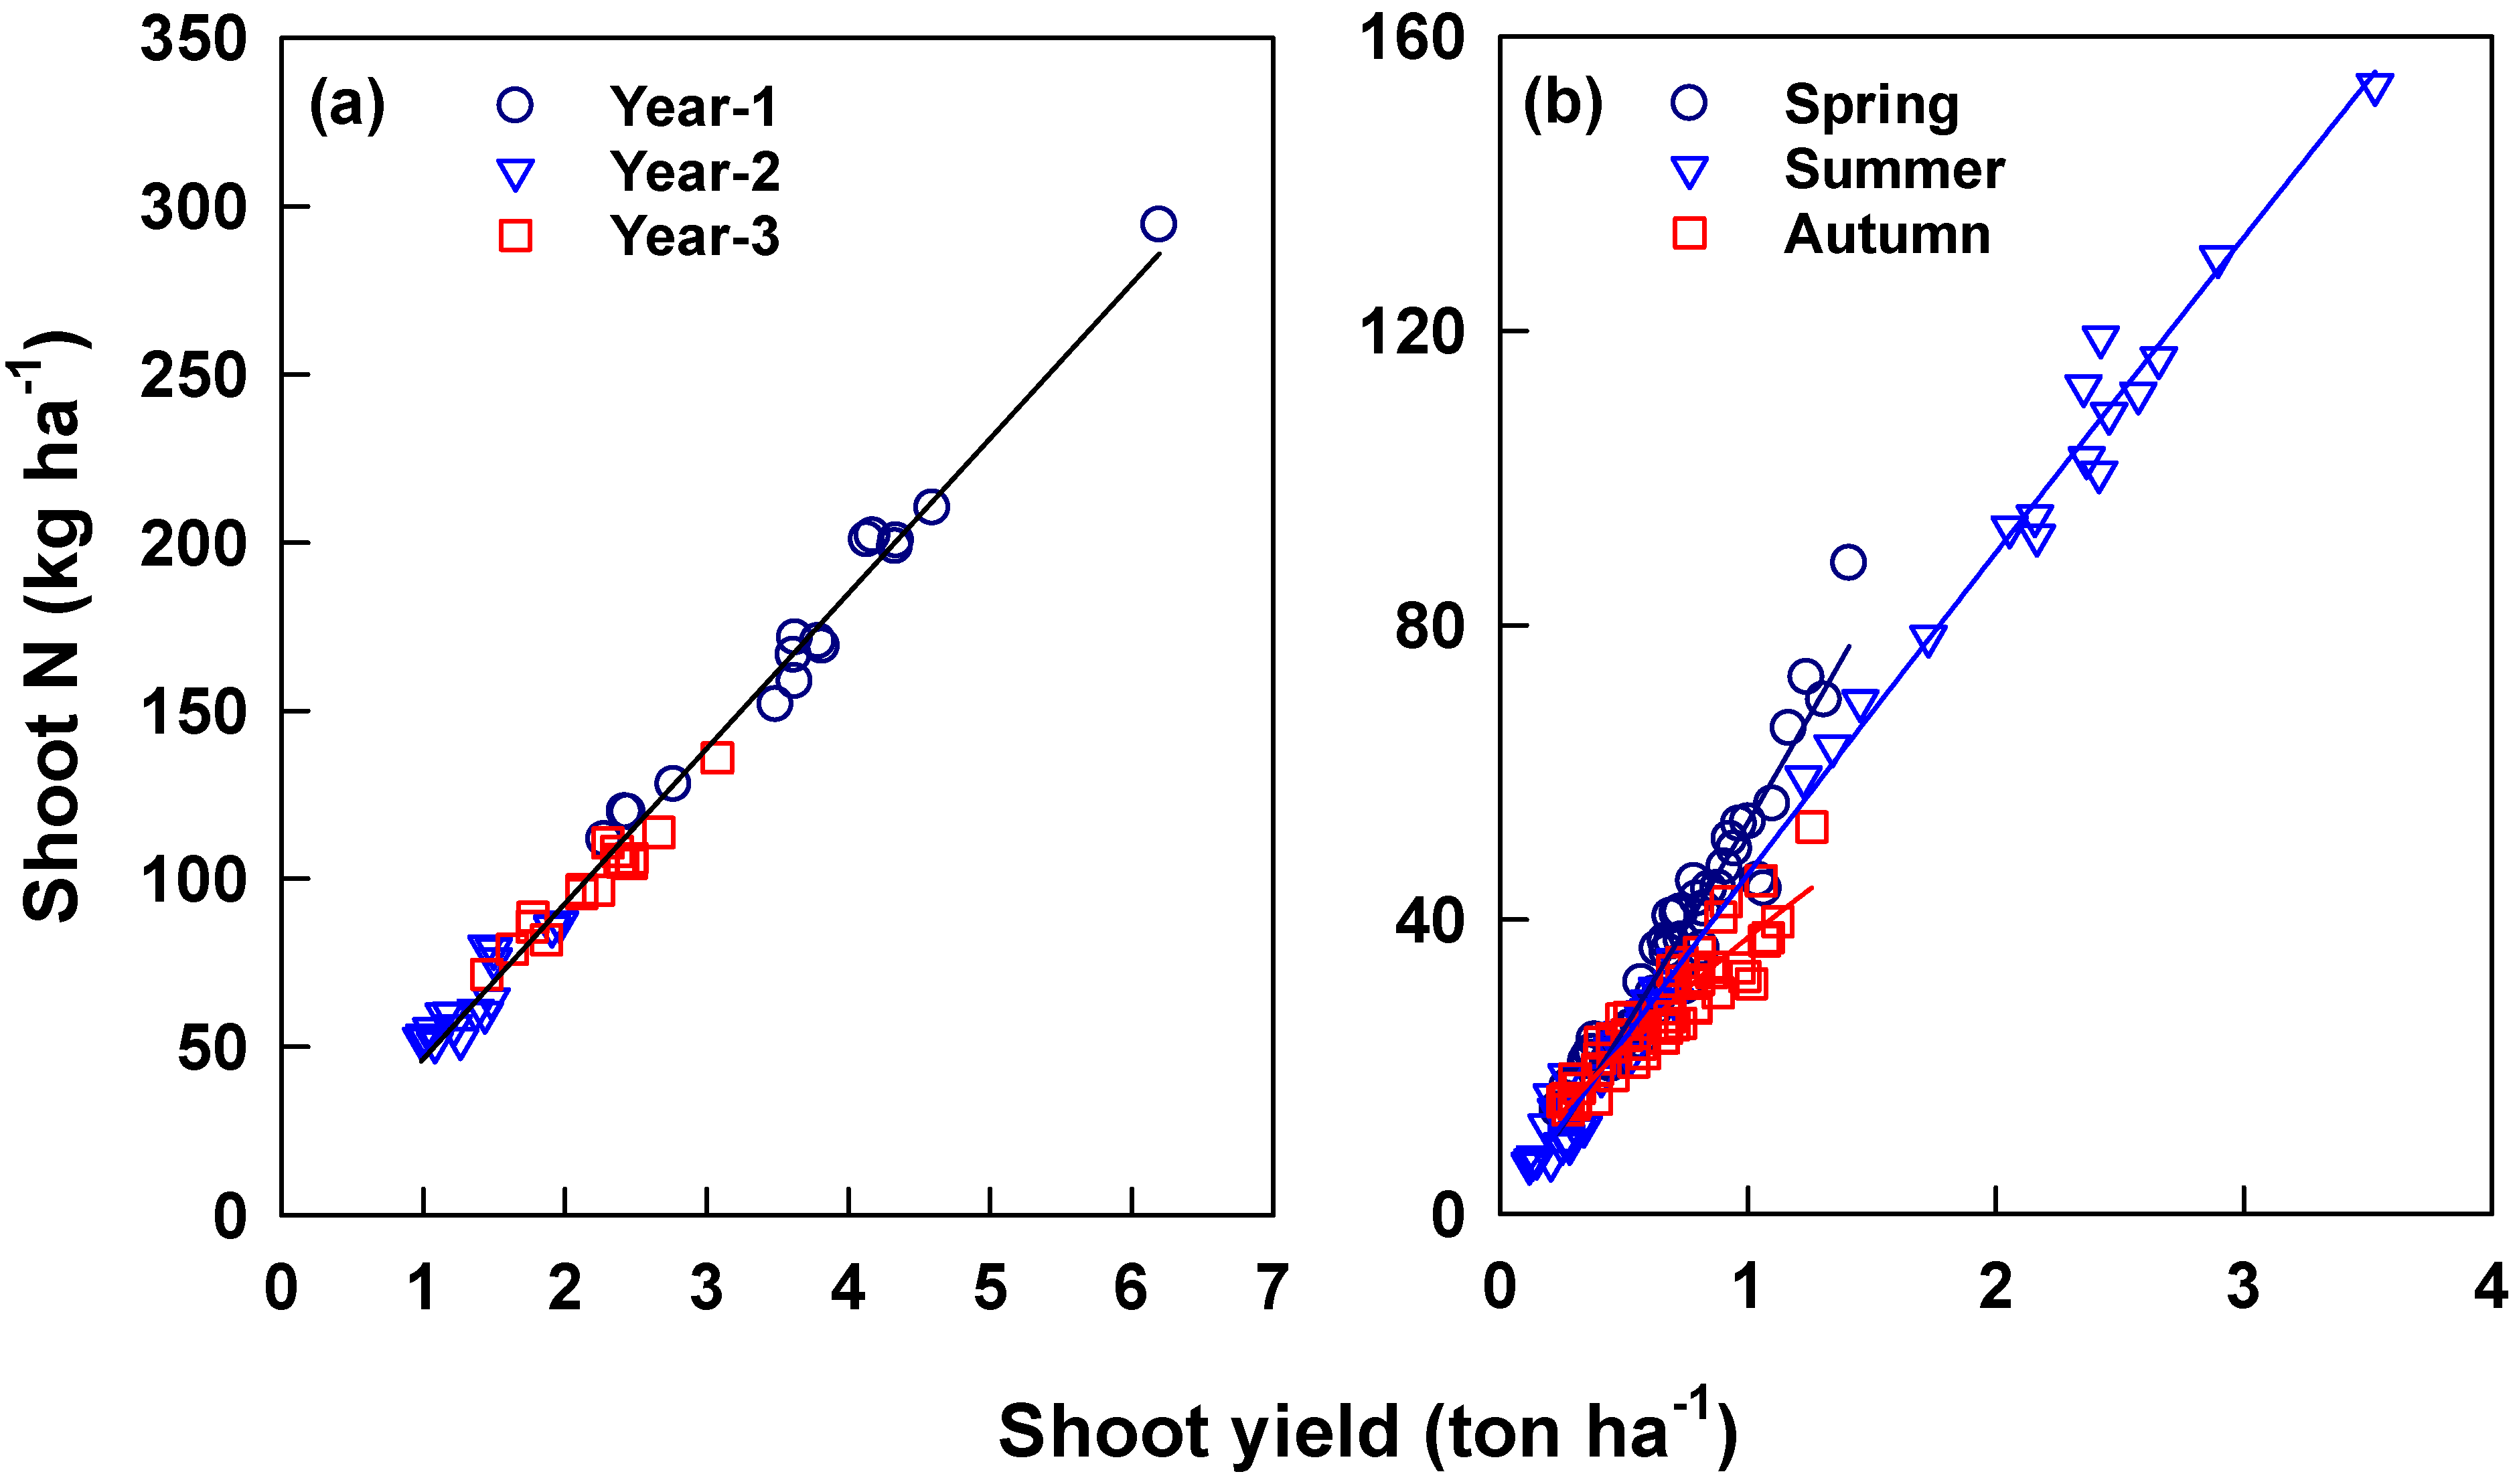
The density of young shoots varied yearly and seasonally (Figure 2). The shoot density was the highest in the summer in year 1 and in the spring in the other two years. The young shoot density in the summer in year 2 was low because the plants were deeply pruned at the end of spring. The shoot density decreased with the harvest standard in the following order for spring, summer, and autumn: B1L > B2L > B3L. B2L and B3L had 15% and 39% fewer annual shoots than B1L. The combination harvest (B1L/B3L) had shoot numbers comparable to that of B1L in the spring and to B3L in the summer and autumn, giving higher annual density values than B3L and lower than B2L. The number and distribution of shoot densities in the early and late spring were significantly affected by the harvest standard (Figure 2). In the early spring, B1L and B1L/B3L had significantly higher (4- to 14-fold) shoot densities than B3L. In contrast, in the late spring, B2L and B3L had higher shoot densities than B1L. The shoot density negatively correlated with the weight per shoot in early spring, summer, and autumn teas (Figure 3a,c,d).

3.3. Shoot Yield

Shoot yield values varied markedly yearly and seasonally (Figure 4). The yields were low in the summer and autumn in year 2 due to deep pruning and subsequent recovery. Yields differed significantly among harvest standards. The harvest at B1L resulted in 34–48% (mean 42%) lower annual yield than B3L and 25–36% (mean 31%) lower annual yield than B2L. The yield for the combination harvest was comparable to B1L in the spring and to B3L in the summer and autumn, and it gave a similar annual yield to B2L. Spring tea yields of B1L, B2L, and B3L accounted for 28.6%, 31.3%, and 35.4% of the annual total yield, respectively. B3L had the lowest yield and the other treatments had similar yields in early spring (Figure 4). B3L and B2L had higher late spring yields than early spring yields. For B1L, the early spring tea yield accounted for 54% of the total spring yield. The corresponding proportions for B2L was 31% and for B3L was 9%, respectively. For B1L/3L, the early spring tea yield accounted for 45% of the total spring yield. Yield significantly and positively correlated with shoot density in early, late spring, and summer teas (Figure 3). On the other hand, yield correlated with weight per shoot negatively in early spring but positively in late spring and autumn teas.

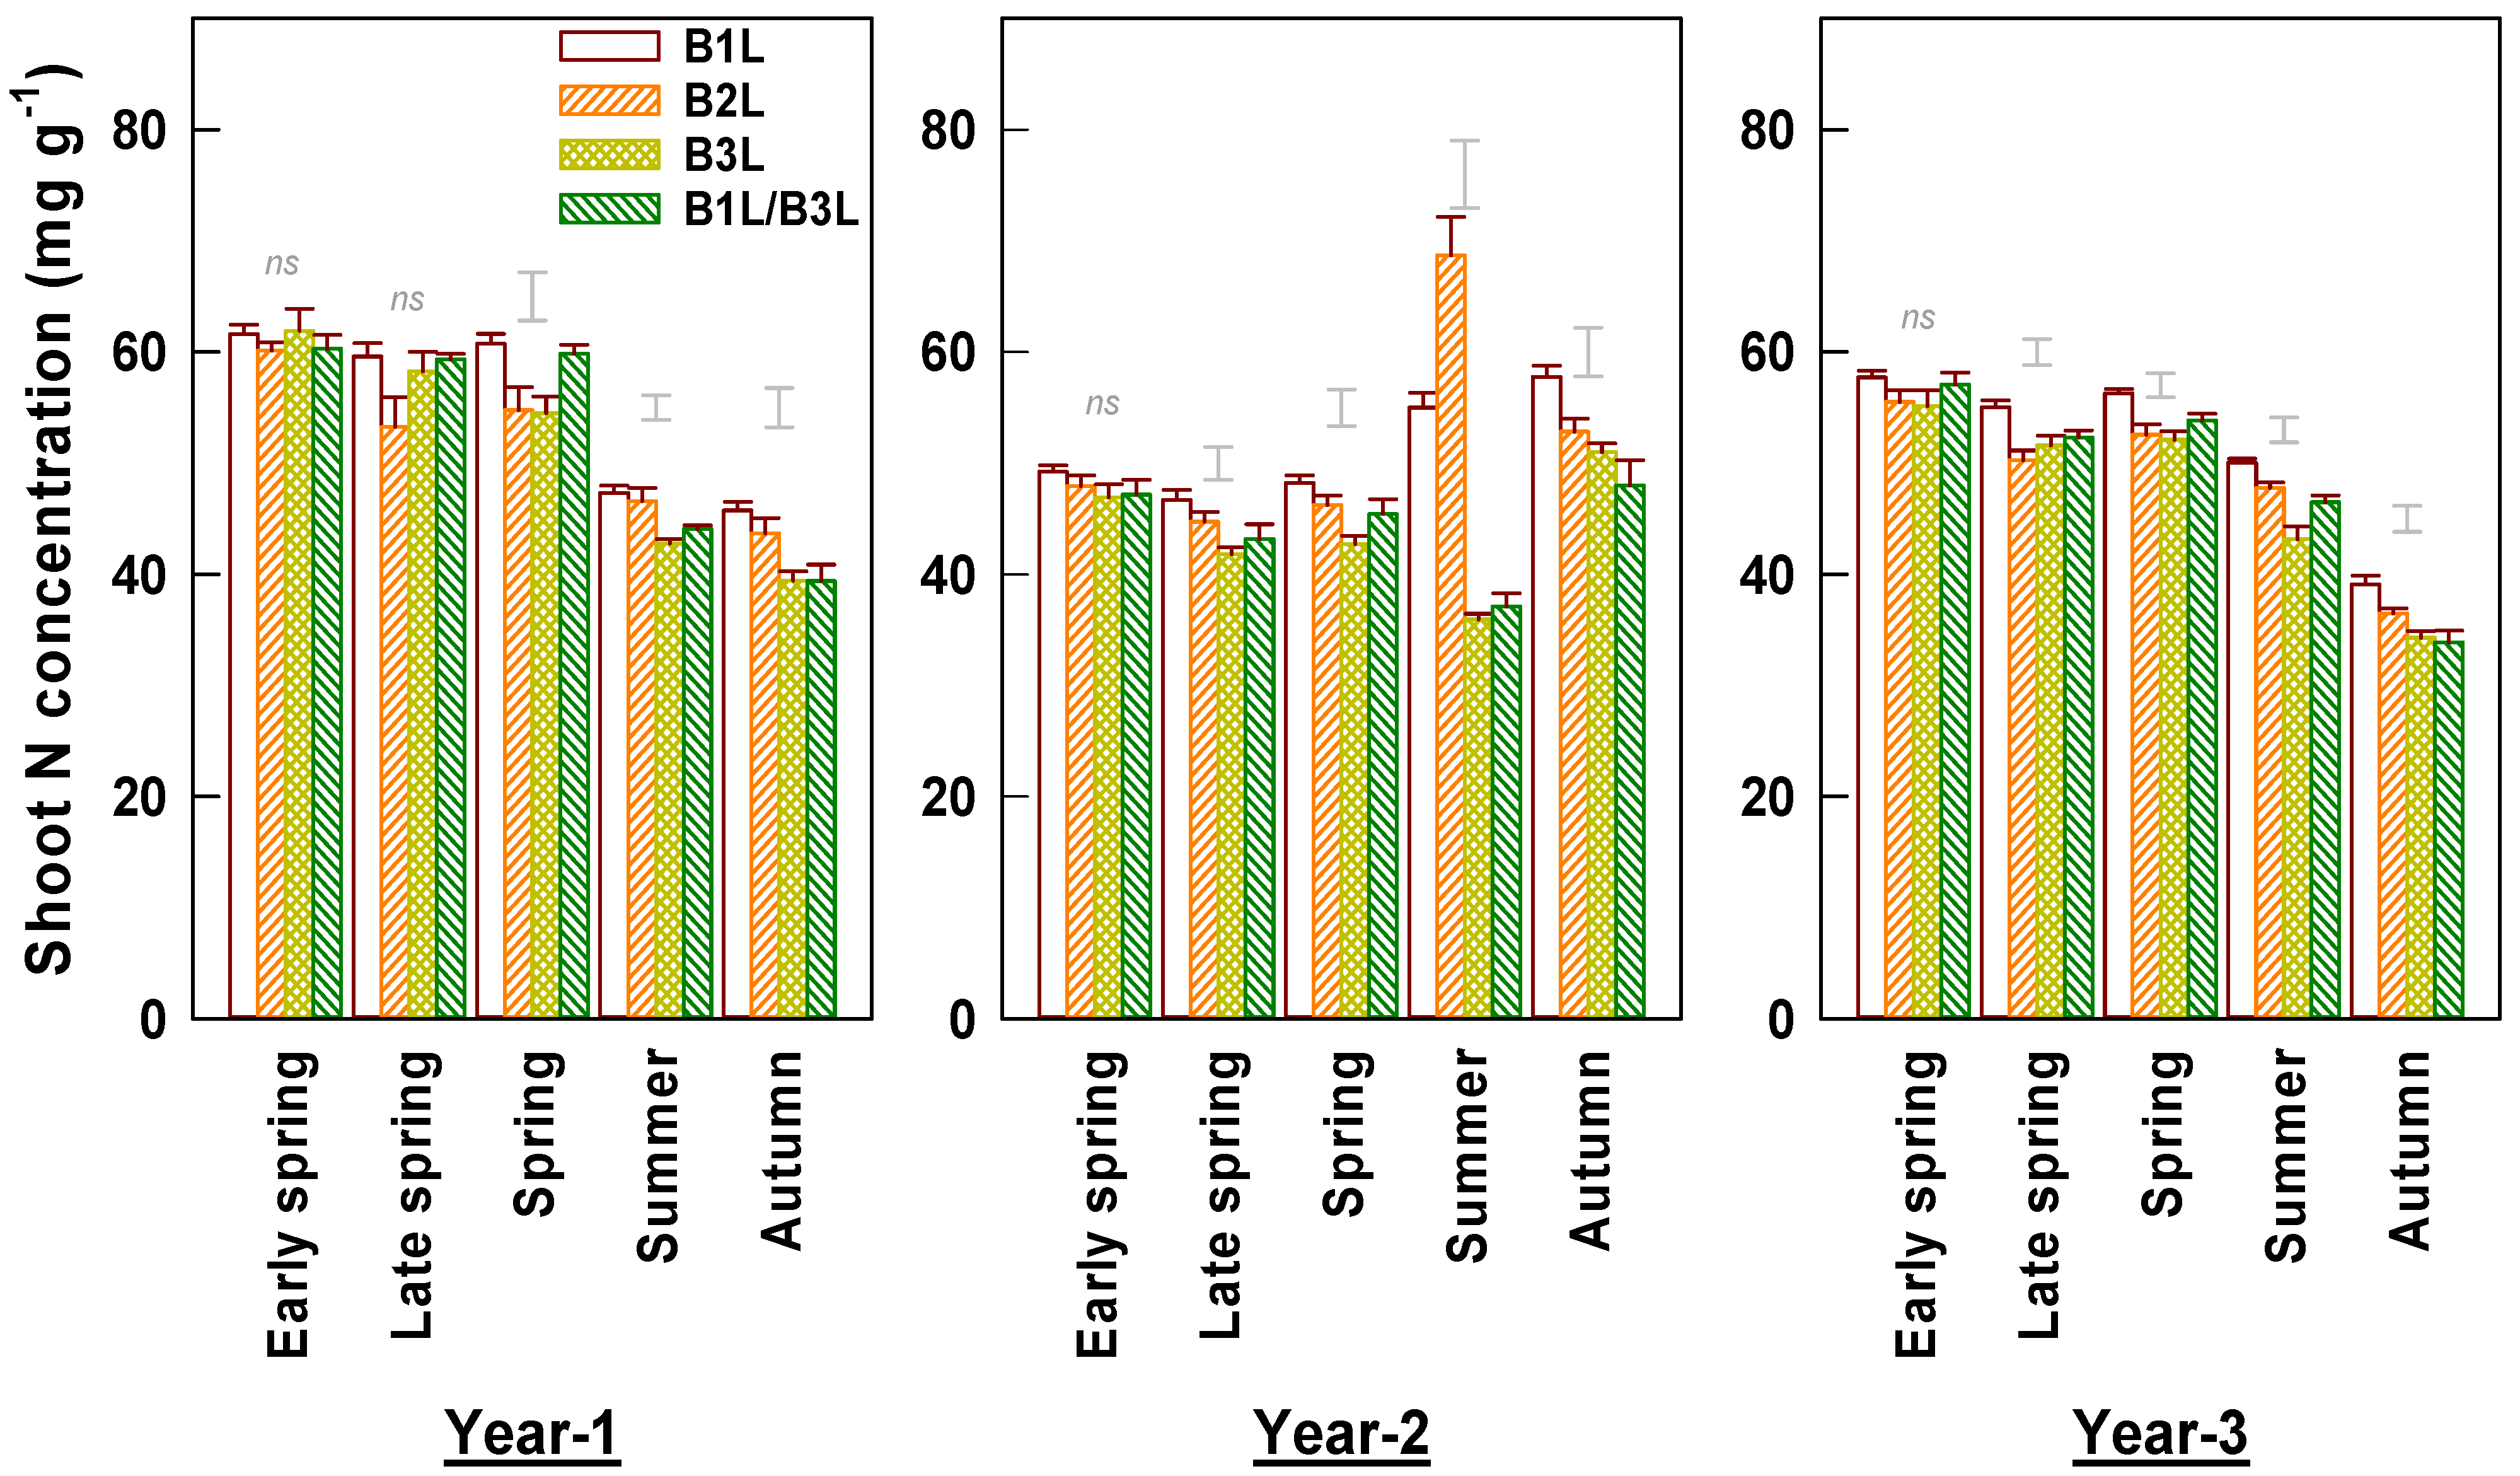
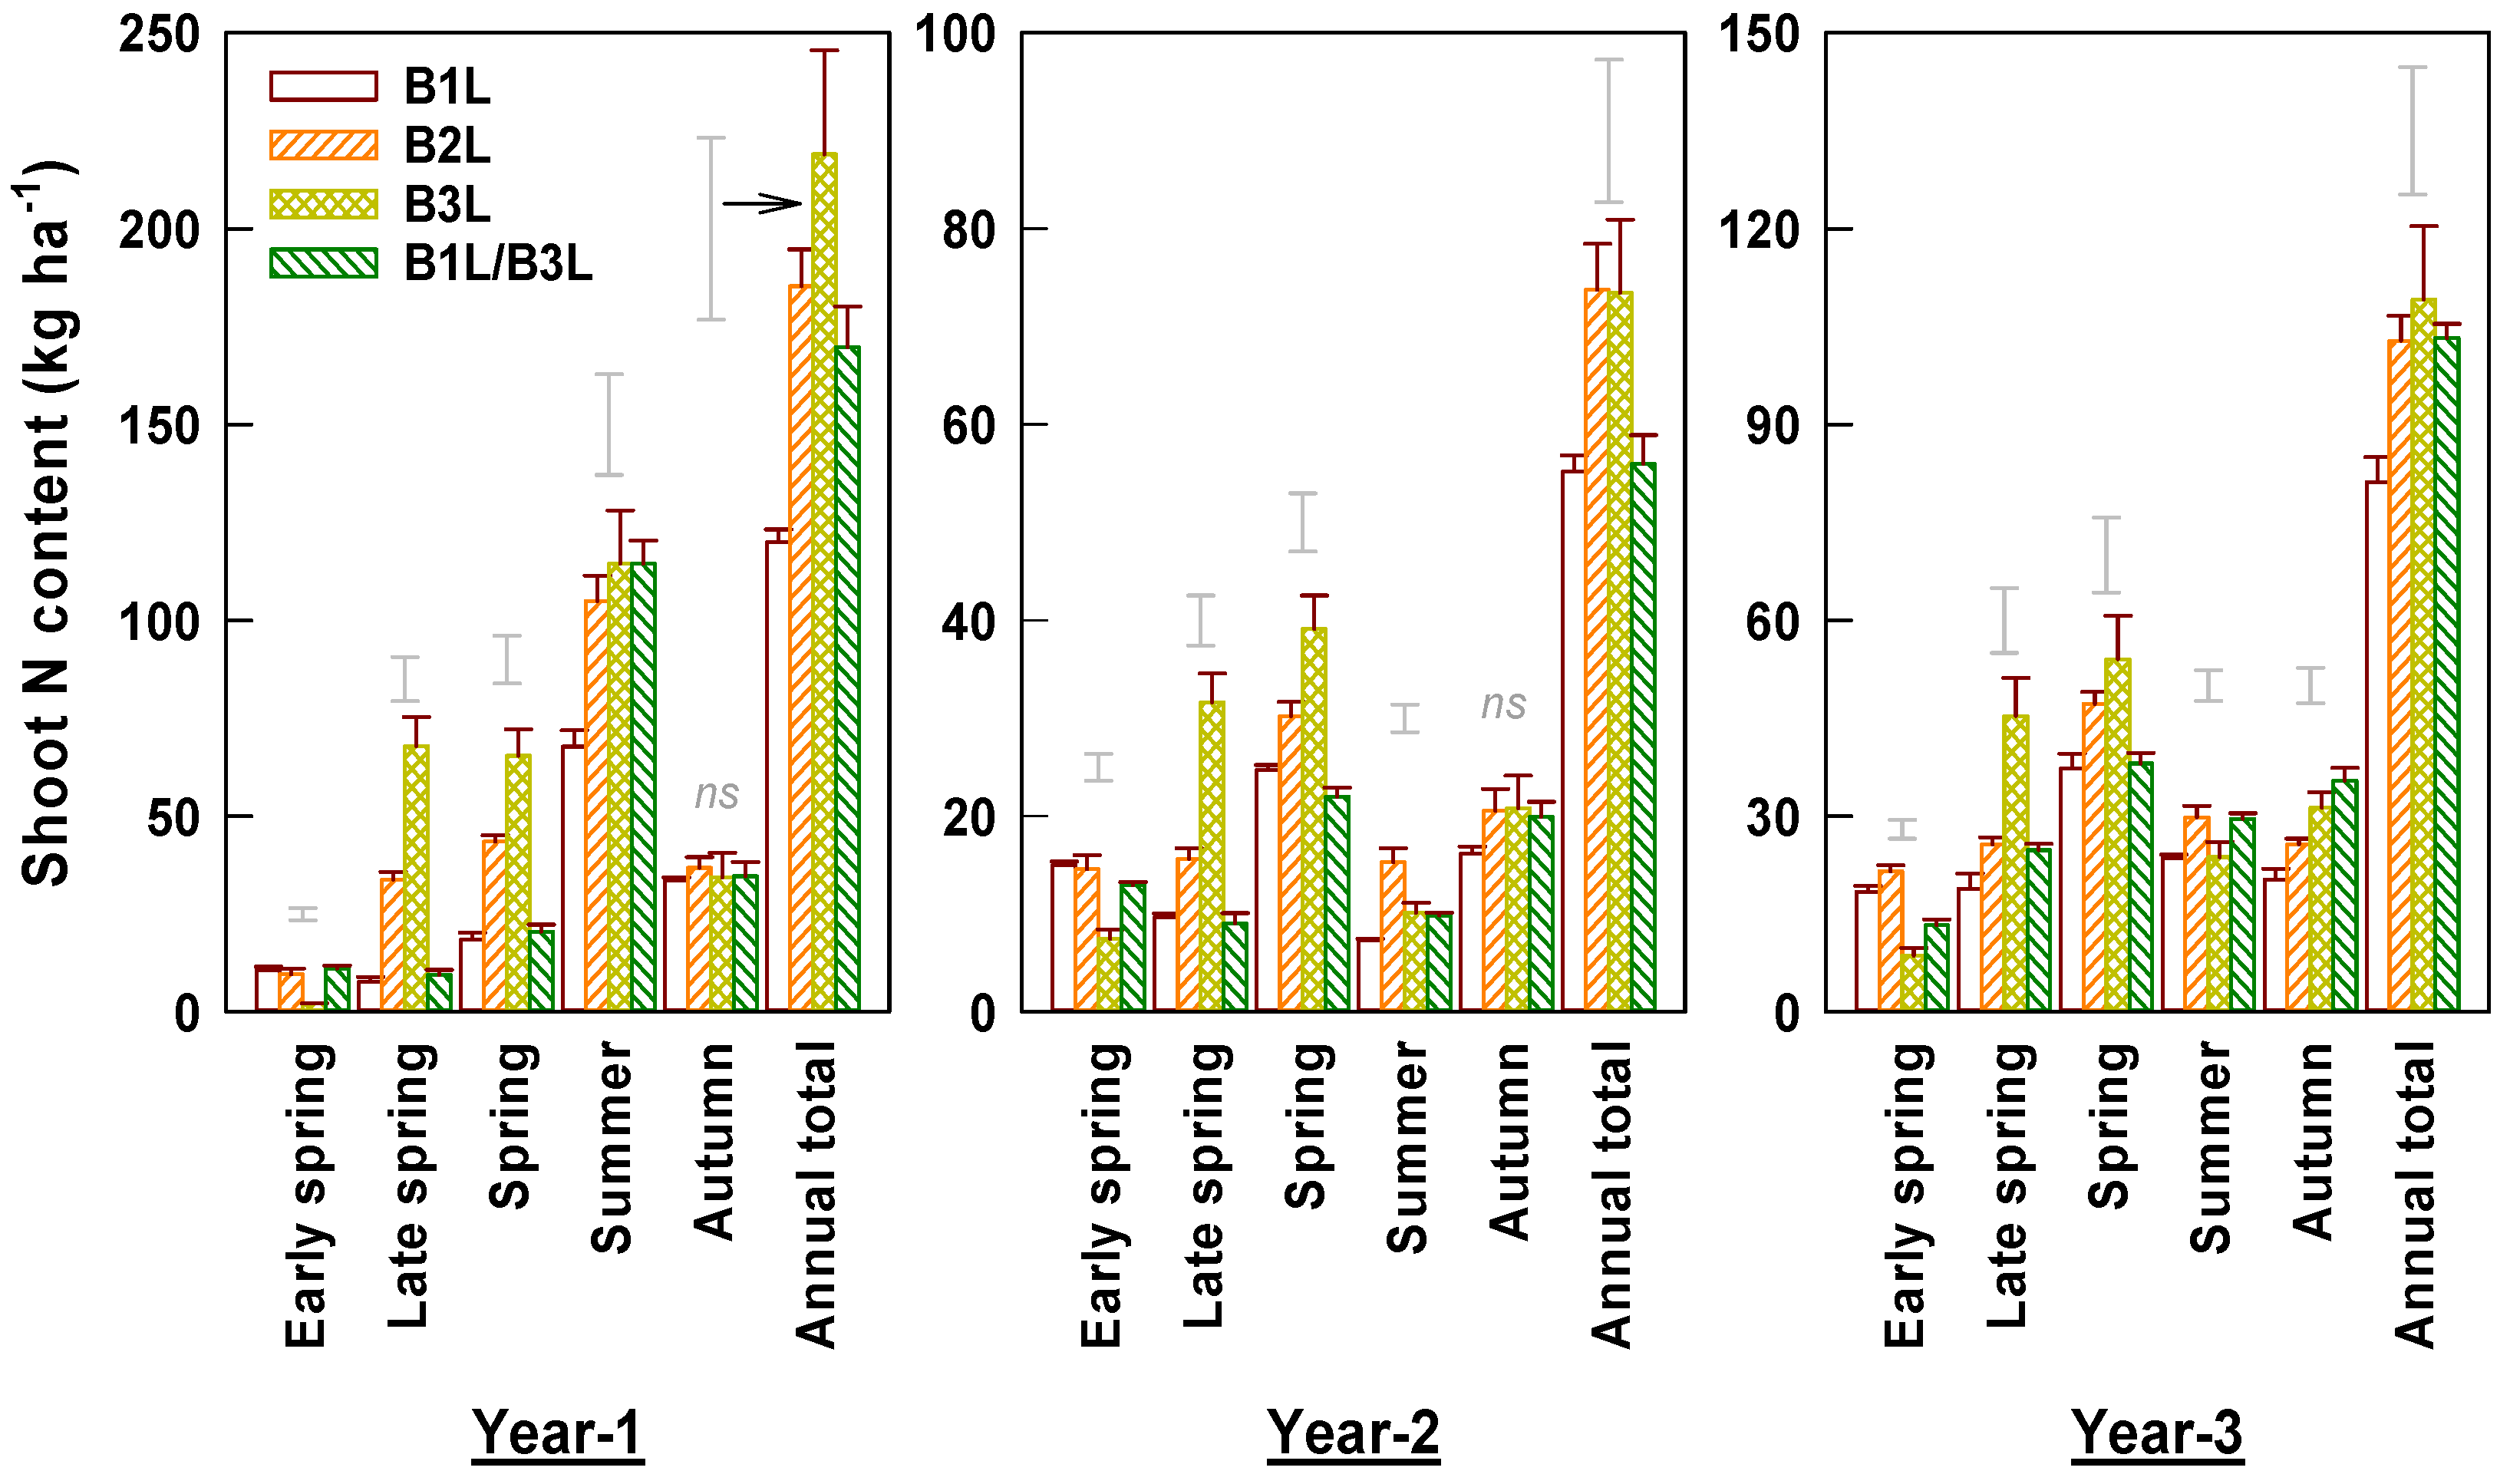
3.4. Shoot N Concentrations and N Contents
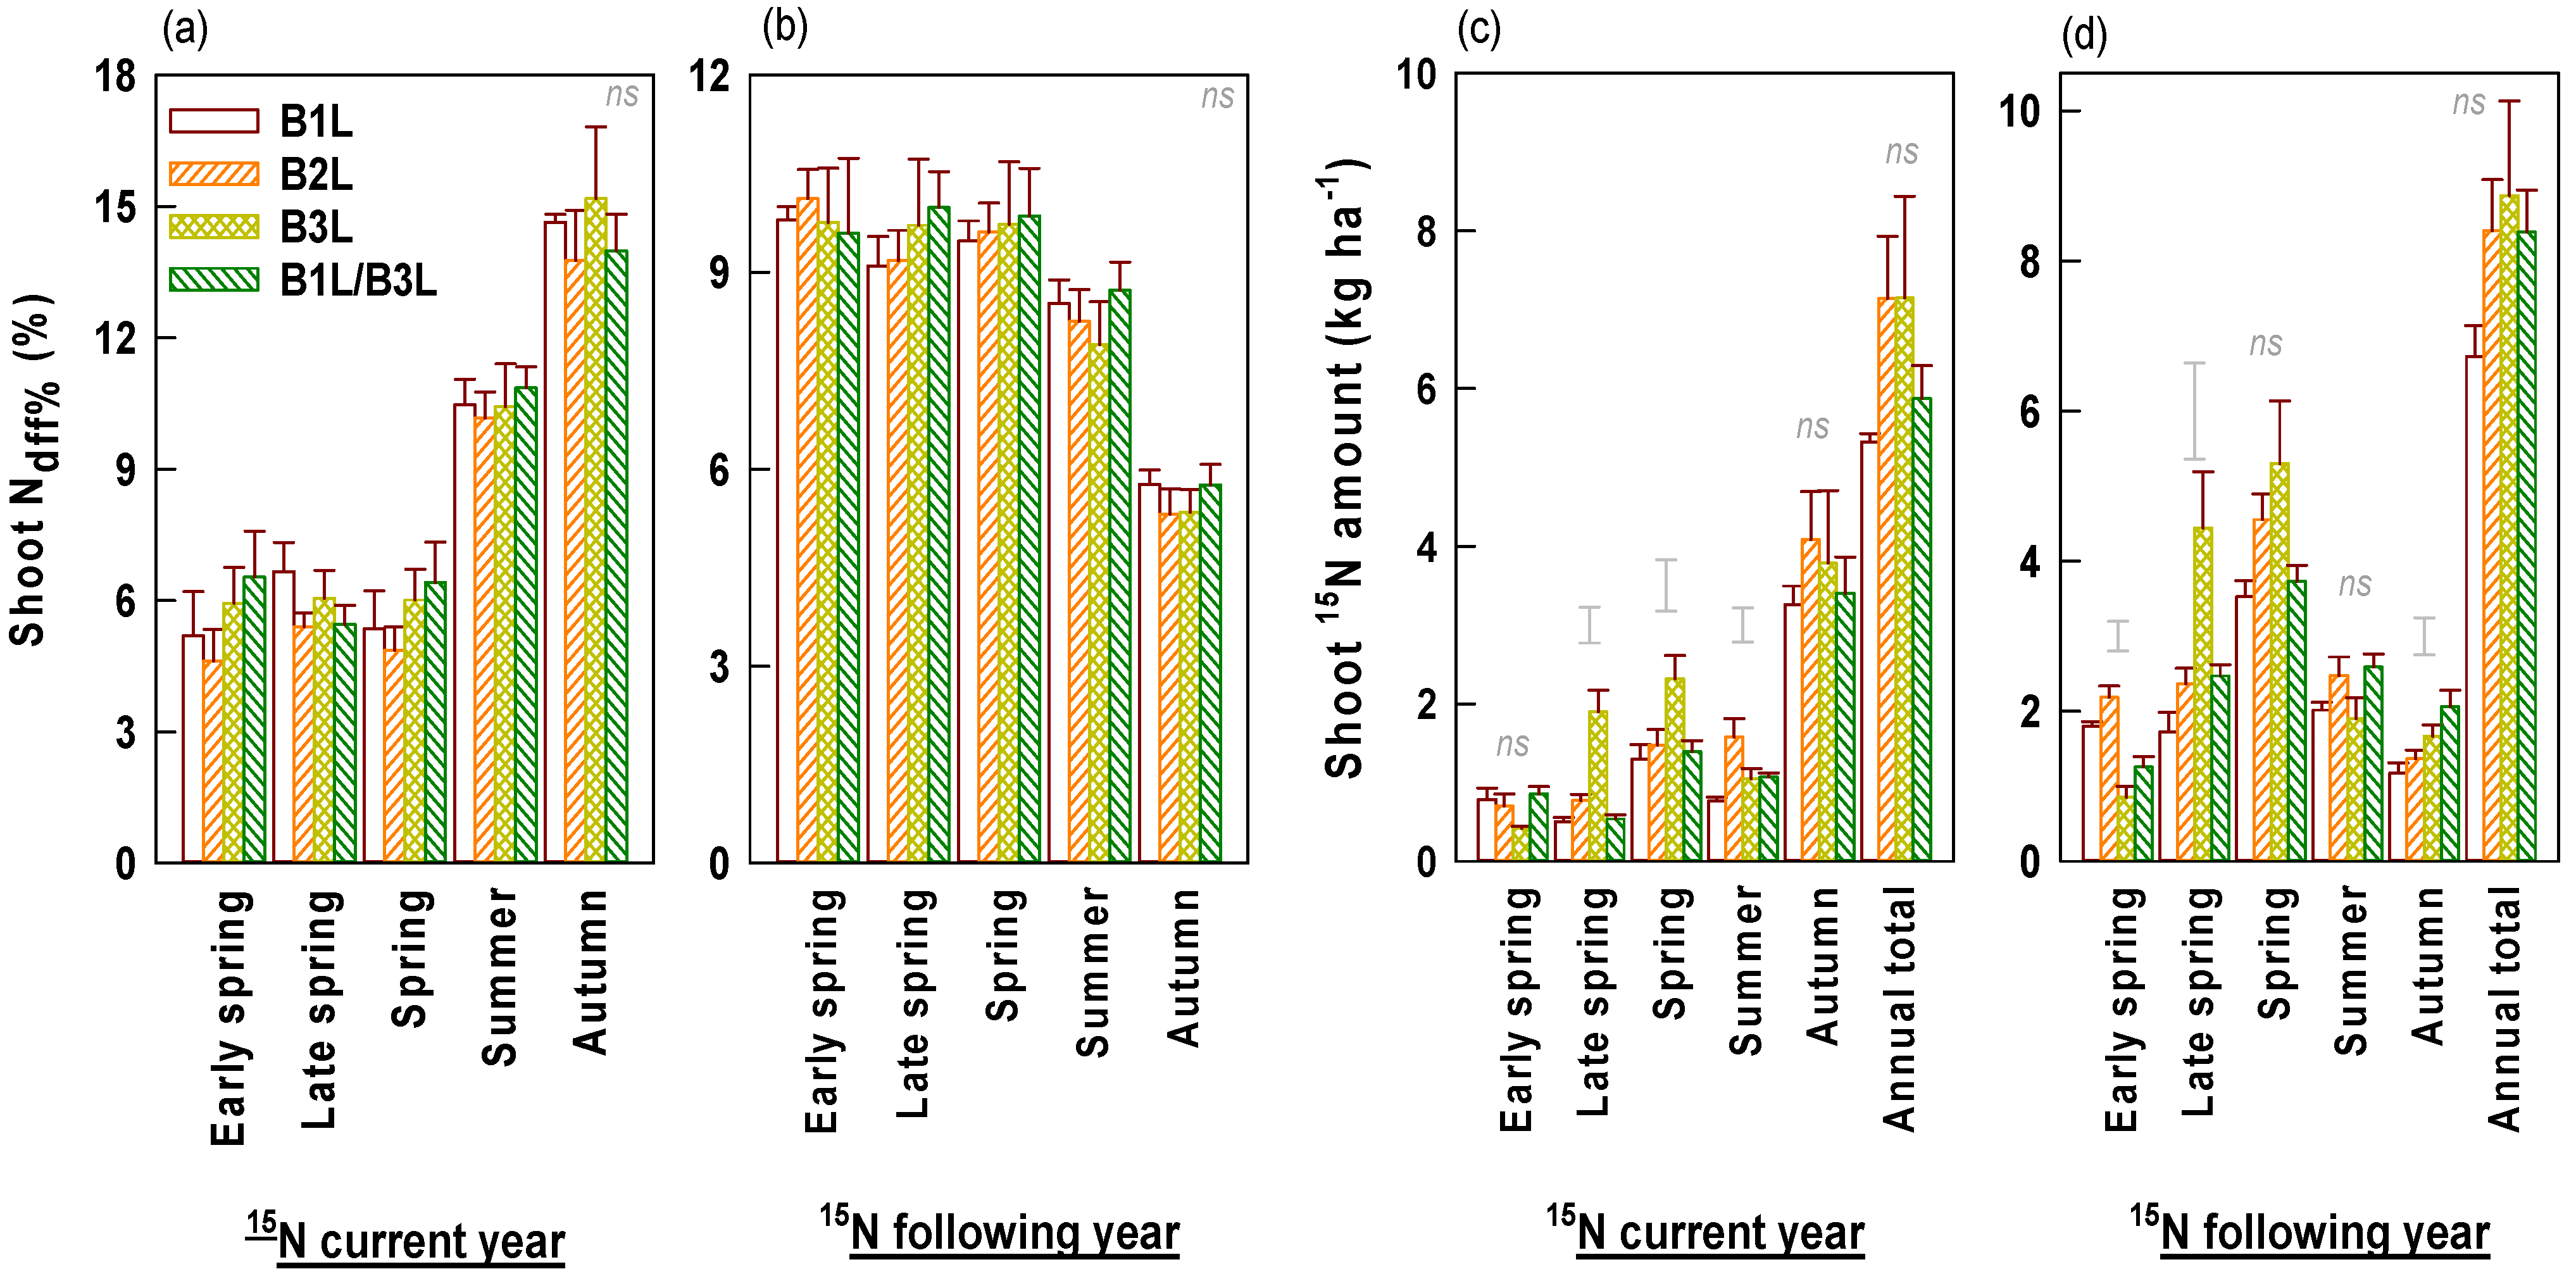
N concentrations in harvested young shoots varied greatly among the three years (Figure 5). In year 1 and year 3, spring teas had much higher N concentrations than summer and autumn teas. In year 2, we observed higher N concentrations in autumn teas and particularly high concentrations in summer B1L and B2L teas. In early spring, the shoot N concentrations were not significantly different among harvest standards. However, in other seasons B1L generally had the highest N concentration. The annual mean N concentrations decreased among treatments in the following order: B1L > B2L > B3L. Shoot N concentration negatively correlated with shoot density in early and late spring, negatively with weight per shoot in summer and autumn, and negatively with yield in early spring and autumn (Figure 3).
The annual shoot N contents varied greatly among years and seasons, ranging from 55 to 219 kg ha−1 (Figure 6). The annual shoot N content was the highest in year 1 and lowest in year 2 as a result of deep pruning. The young shoot N contents also differed largely among harvest standards. B1L had the lowest shoot N content, which was 37% and 30% lower than those of B3L and B2L, respectively. The combination harvest had similar but a slightly lower shoot N content than that of B2L. The shoot N content of B1L in the early spring was 2.0–4.9-fold higher than that of B3L but it was only 11.4–38.0% higher than that of B3L in the late spring. The early spring shoot N content accounted for 55%, 32%, and 9% of the total spring content for B1L, B2L, and B3L, respectively. Shoot N content correlated positively with shoot density in early spring and summer (Figure 3). Shoot N content correlations with weight per shoot differed, being negative in early spring but positive in later spring. Surprisingly, shoot N content negatively correlated with shoot N concentration in autumn tea.
The relationship between annual shoot N content (Nys) and yield (Yys) was termed the N dilution curve [29] and is described well by the empirical formula Nys = a × Yysb (R2 = 0.986, p < 0.0001) (Figure 7). A single regression described the data collected in the three experimental years with a coefficient b value close to 1.0 (Table 2). For different seasons, the relationship was described by different regressions (R2 = 0.921–0.993, p < 0.0001). The coefficients a and b were larger for spring tea than for summer and autumn teas (Table 2).

3.5. 15N Absorption

From spring to autumn, Ndff% values of young shoots increased in the current year but decreased in the following year of 15N fertilizer application (Figure 8a,b). Harvest standards had no significant impact on young shoot Ndff%. In the current year of 15N fertilization (year 2), 15N amounts of young shoots were higher in autumn than in other seasons (Figure 8c). In the following year of 15N fertilization (year 3), spring tea had the highest shoot 15N amount (Figure 8d). Total shoot 15N amounts were unaffected but those of different seasons were significantly affected by harvest standards. B3L had significantly higher 15N amounts of young shoots in late spring but lower in early spring than B1L and B2L. The annual 15N amounts in young shoots in the following year (6.76–8.9 kg ha−1) were slightly higher than those in the current year (5.3–7.2 kg ha−1), even though 15N fertilizer had been applied at the end of year 1. By combining the two years, 15N amounts in young shoots were the highest in spring tea.

3.6. Young Shoot Harvest Index (Shi) and N Harvest Index (NHI)

In the final experimental year, tea plants were uprooted and their biomass (DM) and 15N amounts were measured. The biomass amounts of whole plants ranged between 60.2 and 65.2 (mean 62.9) ton ha−1, with 24.8–41.1% (mean 35.7%) biomass in roots (Table 3). The harvest standard had no statistically significant effect on above-ground, fibrous root, and whole plant biomasses. However, tea plants harvested at B3L showed significantly less brown root biomass production, and the biomass of brown roots accounted for a smaller share of the whole plant as well, giving B3L plants a lower root/above-ground ratio. The annual young shoot harvest index (SHI) was estimated based on young shoot yields from the previous three years, the pruning biomass, and final plant biomass (Table 3). SHI values varied from 0.046 to 0.061 and were the lowest for B1L and highest for B3L.
The 15N amounts remaining in the plants at the end of the experiment were in the range of 25.0–33.1 kg ha−1 (Table 3). The total 15N amounts taken up by plants, including those in young shoots (12.0–16.0 kg ha−1) and prunings (1.9–2.5 kg ha−1), within two experimental years were in the range of 42.5–49.5 kg ha−1. The 15N amounts in the final plants and those in young shoots accounted for 58.2–66.9% (mean 62.3%) and 29.0–36.8% (mean 33.1%) of the total plant 15N absorption, respectively. None of these 15N amounts were significantly affected by the harvest standard. The annual 15N harvest index (NHI) was calculated as the ratio between young shoot 15N and total above-ground 15N (the sum of 15N in young shoots, prunings, and the above-ground part of the final plant). The annual NHI values ranged between 0.18 and 0.23 and did not differ among harvest standards. NHI significantly correlated with shoot yield (r = 0.52, p < 0.05).

4. Discussion

4.1. Characteristics of Shoot Populations under Different Harvest Standards

The shoot weights were heavier in the summer and autumn than in the spring (Figure 1). The greater slope (coefficient-b) of the linear regression likely reflected larger weight per leaf and longer internodes in the summer and autumn teas (Table 1). This was explained by the higher temperature, which was the most influential factor determining weight per shoot among seasons [19,30]. However, the weight per shoot was the lowest in spring in year 2 and was also low in autumn in year 1. This was related to an excessively intensive harvest the previous summer, as indicated by the extremely high yield (Figure 3). Nevertheless, the shoot density was still high and there was a highly significant negative correlation between the weight per shoot and shoot density. These findings suggest that the provision of photo-assimilates to support the growth of young shoots might have been limited as the result of an excessively intensive harvest, leading to insufficient maintenance foliage in the canopy and limited photosynthetic capacity [31,32]. The canopy activity was rejuvenated and the sink–source relation was improved by a deep pruning after the spring tea season in April in year 2, resulting in larger shoot weights the following summer and autumn. Deep pruning also increased shoot N concentrations, and the effect was evident in autumn teas and even continued further to spring and summer teas in year 3 (Figure 5).
Shoot density exhibited great seasonal variations. An earlier work on a tropical tea plantation demonstrated that the shoot density was higher in the warm–dry season than in the cool–dry season [19]. In the present work, the shoot density showed no uniform seasonal distribution. Spring tea had the highest shoot density in year 2 and year 3 and the lowest shoot density in year 1 (Figure 2). On the other hand, the harvest standard greatly affected the shoot density and seasonal distribution. The B1L standard had the largest young shoot density in the spring, summer, and autumn teas (Figure 2). It takes a longer time for young shoots to expand their leaves. Therefore, the B1L resulted in an earlier start to the spring harvest. Meanwhile, B1L removed bud dominance more frequently than others and possibly had much stronger effects in stimulating lateral bud growth.

4.2. Biomass Allocation and Young Shoot Yields under Different Harvest Standards

Shoot yields were significantly affected by harvest standards. Expectedly, harvest at B3L gave the highest annual yield with the largest weight per shoot, regardless of having the lowest density, suggesting that less density had been compensated for by the larger shoot weight. However, the seasonal yield distribution was significantly affected by the harvest standards. B1L had the highest yield in early spring, which was mainly contributed by the high shoot density due to its high correlation with yield (r = 0.881). Nevertheless, B3L had the highest yield in late spring due to its greater shoot weight (with a yield correlation coefficient of r = 0.811). Consequently, the density and weight of young shoots had different contributions to early and late spring tea yields. Therefore, increasing the density of young shoots appears to be a promising approach to promote the production of premium tea in early spring.
The biomass of the whole plant in the present study (60.2–65.2 t/ha, Table 3) was comparable to results found in tea agroforestry in Assam, India [33], but much lower for tea plantations in Kenya (91–155 t/ha) [34] and Sri Lanka (81–90 t/ha) [31]. Nevertheless, the proportions of root dry matter were much higher in the present study (27.3–41.5%) than in previous studies (10–15% in [34], 13–16% in [31]). This difference may be related to different varieties, ages, spacing of plants, and growth conditions [33,34,35,36]. In the present study, the tea variety was a medium-small leaf species, while the varieties in Kenya and Sri Lanka were large-leaf species. The plant age (9 years) in the present work was much younger than those in the previous studies (14, 30, and 76 years) [21,31].
The whole plant biomass at the end of experiment was unaffected by harvest standards, which might be explained by the fact that the plant sizes (canopy height) had been controlled by pruning them to a uniform harvest table. However, the harvest at B3L significantly reduced the biomass of brown roots and the ratio against the above-ground biomass (Table 3), suggesting that the partitioning of photosynthetic assimilates between young shoots (above-ground) and roots had been regulated by the harvest standard. In most cases, shoots and roots compete for photosynthetic assimilates and it is believed that young shoots act as a carbon sink during the stage of stem extension and leaf expansion [37,38]. Harvest at B3L resulted in much higher shoot biomass and decreased the allocation of carbon to the root system. In contrast, harvest at B1L and B2L when shoots were removed before they reached maximum biomass led to a limited sink for carbon and maintained a higher supply of assimilates to roots [31]. We estimated the young shoot harvest index (SHI) values based on the yields of young shoots, the biomass of plants, and prunings, without measuring the net annual increment in dry matter production. The SHI values were greater in the present work (0.046–0.061) than the re-calculated values (0.023–0.043) from the previous studies in Kenya [21,34,39].

4.3. N Absorption and Allocation under Different Harvest Standards

Harvest standards had no significant effect on shoot Ndff%, likely suggesting that 15N was uniformly distributed to young shoots regardless of the developmental stage. Young shoot Ndff% increased from early spring to autumn, indicating steady but sluggish absorption and accumulation of 15N in tea trees and partitioning to young shoots, as 15N-urea application started much before the spring tea period (in October of year 1). Shoot Ndff% decreased from spring to autumn in the following year due to continual removal by harvesting and depletion of the supply of 15N from the soil as a result of leaching loss. At the whole plant scale within the two experimental years, shoot 15N accounted for 29–37% of the total plant absorption. In contrast, a larger amount of 15N (58.2–66.9% of the total absorption) remained in the plants at the end of the experiment, which could be used by young shoots in the following years. The amounts of young shoot 15N in spring tea in the following year were even larger than in the current year, suggesting the process of storage remobilization within the plants [27] and prolonging the residual effect of N fertilization in the soil for perennial tea trees. In cereal crops, the nitrogen harvest index (NHI) is defined as the ratio between N in grain only and in grain plus straw [40]. The NHI provides important information on the N retranslocation efficiency of absorbed N from vegetative plant parts to grain. Only vegetative growing young shoots were harvested in tea plants and there was no such process of N translocation between vegetative and reproductive organs. However, in perennial trees such as tea trees, N is frequently retranslocated from storage organs (e.g., mature leaves, roots) to fast-growing young shoots [41]. The NHI could be a useful indicator for measuring N allocation and the efficiency of the production of young shoots. There is little information regarding the N harvest index for tea plants under field conditions due to difficulty in estimating whole plant uptake [42]. In the present experiment, we measured whole plant uptake by means of 15N tracers. Our results showed that annual NHI values ranged between 0.18 and 0.23, which was relatively low range compared to grain crops (0.44–0.88 in beans, 0.52–0.65 in rice [40]). NHI values were not significantly affected by the harvest standard, which might be attributed to the fact that sufficient N was applied. NHI closely correlated with yield, similarly to other findings in other crops [40]. These results suggest that NHI estimated within short durations might not correctly reflect real situations of long-lasting N fertilizer effects for perennial tea plants.
Total N concentrations were generally higher in spring tea than in summer and autumn teas in year 1 and year 3. We also observed higher N concentrations (p < 0.001) in early spring tea than in late spring tea. These results corresponded well to previous findings showing that spring teas, especially early spring teas, had much greater amino acid contents and were of better quality [9,10,11]. The effects of harvest standards on shoot N concentrations were dependent on the season—no significant difference was observed among the different standards in the early spring but significantly lower values were observed in B3L in late spring, summer, and autumn teas. The significant negative correlations of shoot N concentration with yield and shoot density are possibly an indication of the dilution effect caused by growth.
Shoot N contents showed dynamic changes similar to those of yields and were significantly different among harvest standards. Lemaire et al. (2007) found that soil N supply and biomass accumulation co-regulated crop N uptake; they developed a robust model to describe the relationship between N uptake and biomass production, taking the leaf area expansion into account [28]. In the present work, young shoots of different harvest standards provided an ideal case with which to test such a relationship. The coefficient-a values ranged from 37.536 to 53.216 for seasonal teas and reached 46.435 when annual data were combined (Figure 3, Table 2). These values were slightly lower than the reported ranges of 53.2–54.7 in Kenya [21] and 48–52 kg N ha−1 for field crops of C3 species [43]. The coefficient-b value was slightly greater than 1.0 for spring tea, suggesting that the growth rate of young spring shoots was surpassed by N supply. The high N uptake rate in (early) spring was not anticipated, as air and soil temperatures were relatively low. The higher N concentration in the (early) spring tea was the result of immediate uptake superimposed with intensive N remobilization of the stored N pool in other plant organs [11,41,44]. Furthermore, because of the cool spring temperatures, relatively low rates of young shoot extension and leaf expansion were expected. Sufficient N supply to young spring shoots from the mature leaves and roots facilitates the formation of N metabolites such as amino acids [20,45]. For summer and autumn teas, the coefficient-b values were less than 1.0, implying a dilution effect of quick growth when temperatures were high or N supply was temporarily inadequate. The shoot N dilution curve provides important information on the N status in teas from different seasons [29]. On the other hand, B1L had a much higher shoot N share in early spring, suggesting earlier N demands for the harvest of younger shoots. The green tea quality is closely related to the total N concentration, highlighting the importance of a timely and sufficient supply of N nutrition [14,16]. Our recent works indicated that N absorption and utilization by early spring tea were sensitive to the timing of N fertilization during the period of autumn–winter [27,44].

5. Conclusions

The present work demonstrated that the young shoot density, weight per shoot, yield, harvest index, and seasonal distribution results were greatly dependent on the harvest standards. The shoot N uptake and its seasonal dynamics were also altered by different harvest standards. The shoot N dilution curves differed markedly among spring, summer, and autumn teas, suggesting different plant N statuses among seasons. The allocation rate of 15N to young shoots was relatively low compared to the large proportion in the plants at the end of experiment. The results highlight the importance of N nutrition management in tea being finely tuned to specific harvest standards and seasonal N demands.

Supplementary Materials

The following supporting information can be downloaded at: https://www.mdpi.com/article/10.3390/horticulturae8040275/s1, Figure S1: The weather (temperature and precipitation) of individual month during the experimental years.

Author Contributions

Conceptualization and experimental design, J.R.; field investigation, sample collection, preparation, and analysis Y.S. and L.M.; data curation, J.R. and L.L.; writing of the manuscript, J.R. and L.L.; funding acquisition, J.R. All authors have read and agreed to the published version of the manuscript.

Funding

This study was financially supported by the National Key Research and Development Project (2021YFD1601100), the Earmarked Fund for China Agriculture Research System (CARS 19), and the Agricultural Science and Technology Innovation Program of the Chinese Academy of Agricultural Sciences (CAAS-ASTIP-TRICAAS).

Institutional Review Board Statement

Not applicable.

Informed Consent Statement

Not applicable.

Data Availability Statement

The data presented in this study are available on request from the corresponding author.

Conflicts of Interest

The authors declare no conflict of interest.

References

  1. Lee, J.E.; Lee, B.J.; Hwang, J.A.; Ko, K.S.; Chung, J.O.; Kim, E.H.; Lee, S.J.; Hong, Y.S. Metabolic dependence of green tea on plucking positions revisited: A metabolomic study. J. Agric. Food Chem. 2011, 59, 10579–10585. [Google Scholar] [CrossRef] [PubMed]
  2. Wu, L.-Y.; Fang, Z.-T.; Lin, J.-K.; Sun, Y.; Du, Z.-Z.; Guo, Y.-L.; Liu, J.-H.; Liang, Y.-R.; Ye, J.-H. Complementary iTRAQ proteomic and transcriptomic analyses of leaves in tea plant (Camellia sinensis L.) with different maturity and regulatory network of flavonoid biosynthesis. J. Proteome Res. 2019, 18, 252–264. [Google Scholar] [CrossRef] [PubMed]
  3. Samanta, T.; Kotamreddy, J.N.R.; Ghosh, B.C.; Mitra, A. Changes in targeted metabolites, enzyme activities and transcripts at different developmental stages of tea leaves: A study for understanding the biochemical basis of tea shoot plucking. Acta Physiol. Plant. 2016, 39, 11. [Google Scholar] [CrossRef]
  4. Jiang, X.; Liu, Y.; Li, W.; Zhao, L.; Meng, F.; Wang, Y.; Tan, H.; Yang, H.; Wei, C.; Wan, X.; et al. Tissue-specific, development-dependent phenolic compounds accumulation profile and gene expression pattern in tea plant [Camellia sinensis]. PLoS ONE 2013, 8, e62315. [Google Scholar] [CrossRef] [PubMed]
  5. Amiri, M.; Asil, M. Determination of optimum harvestable length of shoots in tea (Camellia sinensis L.) based on the current shoot growth, rather than interval plucking. J. Food Agric. Env. 2007, 5, 122–124. [Google Scholar]
  6. Cloughley, J.B. Effects of harvesting policy and nitrogen application rates on the production of tea in Central Africa. II. Quality and total value of the crop. Exp. Agric. 1983, 19, 47–54. [Google Scholar] [CrossRef]
  7. Owuor, P.O.; Ng’etich, W.K.; Obanda, M. Quality response of clonal black tea to nitrogen fertilizer, plucking interval and plucking standard. J. Sci. Food Agric. 2000, 80, 439–446. [Google Scholar] [CrossRef]
  8. Mouli, M.R.; Onsando, J.M.; Corley, R.H. Intensity of harvesting in tea. Exp. Agric. 2007, 43, 41–50. [Google Scholar] [CrossRef]
  9. Xu, W.; Song, Q.; Li, D.; Wan, X. Discrimination of the production season of Chinese green tea by chemical analysis in combination with supervised pattern recognition. J. Agric. Food Chem. 2012, 60, 7064–7070. [Google Scholar] [CrossRef]
  10. Dai, W.; Qi, D.; Yang, T.; Lv, H.; Guo, L.; Zhang, Y.; Zhu, Y.; Peng, Q.; Xie, D.; Tan, J.; et al. Nontargeted analysis using ultraperformance liquid chromatography–quadrupole time-of-flight mass spectrometry uncovers the effects of harvest season on the metabolites and taste quality of tea (Camellia sinensis L.). J. Agric. Food Chem. 2015, 63, 9869–9878. [Google Scholar] [CrossRef]
  11. Liu, J.W.; Zhang, Q.F.; Liu, M.Y.; Ma, L.F.; Shi, Y.Z.; Ruan, J.Y. Metabolomic analyses reveal distinct change of metabolites and quality of green tea during the short duration of a single spring season. J. Agric. Food Chem. 2016, 64, 3302–3309. [Google Scholar] [CrossRef] [PubMed]
  12. Guan, X.; Yang, J.; Xie, X.; Lin, C. Over-supply of tea in China—A marketing analysis. Acta Tea Sinica 2017, 58, 75–79. [Google Scholar]
  13. Ruan, J.Y.; Gerendas, J. Absorption of foliar-applied urea-N-15 and the impact of low nitrogen, potassium, magnesium and sulfur nutritional status in tea (Camellia sinensis L.) plants. Soil Sci. Plant Nutr. 2015, 61, 653–663. [Google Scholar] [CrossRef] [Green Version]
  14. Chen, P.-A.; Lin, S.-Y.; Liu, C.-F.; Su, Y.-S.; Cheng, H.-Y.; Shiau, J.-H.; Chen, I.-Z. Correlation between nitrogen application to tea flushes and quality of green and black teas. Sci. Hortic. 2015, 181, 102–107. [Google Scholar] [CrossRef]
  15. Dutta, R.; Stein, A.; Smaling, E.M.A.; Bhagat, R.M.; Hazarika, M. Effects of plant age and environmental and management factors on tea yield in Northeast India. Agron. J. 2010, 102, 1290–1301. [Google Scholar] [CrossRef]
  16. Ruan, J.Y.; Gerendas, J.; Hardter, R.; Sattelmacher, B. Effect of root zone pH and form and concentration of nitrogen on accumulation of quality-related components in green tea. J. Sci. Food Agric. 2007, 87, 1505–1516. [Google Scholar] [CrossRef]
  17. Ruan, J.Y.; Gerendas, J.; Hardter, R.; Sattelmacher, B. Effect of nitrogen form and root-zone pH on growth and nitrogen uptake of tea (Camellia sinensis) plants. Ann. Bot. 2007, 99, 301–310. [Google Scholar] [CrossRef] [Green Version]
  18. Stephens, W.; Carr, M.K. Responses of tea (Camellia sinensis) to irrigation and fertilizer. III. Shoot extension and development. Exp. Agric. 1993, 29, 323–339. [Google Scholar] [CrossRef]
  19. Stephens, W.; Carr, M.K. Responses of tea (Camellia sinensis) to irrigation and fertilizer. IV. Shoot population density, size and mass. Exp. Agric. 1994, 30, 189–205. [Google Scholar] [CrossRef]
  20. Ruan, J.Y.; Haerdter, R.; Gerendas, J. Impact of nitrogen supply on carbon/nitrogen allocation: A case study on amino acids and catechins in green tea [Camellia sinensis (L.) O. Kuntze] plants. Plant Biol. 2010, 12, 724–734. [Google Scholar] [CrossRef]
  21. Kamau, D.M.; Spiertz, J.H.J.; Oenema, O.; Owuor, P.O. Productivity and nitrogen use of tea plantations in relation to age and genotype. Field Crops Res. 2008, 108, 60–70. [Google Scholar] [CrossRef]
  22. Stephens, W.; Carr, M.K. Responses of tea (Camellia sinensis) to irrigation and fertilizer. I. Yield. Exp. Agric. 1991, 27, 177–191. [Google Scholar] [CrossRef]
  23. Möller, M.; Weatherhead, E.K. Evaluating drip irrigation in commercial tea production in Tanzania. Irrig. Drain. Syst. 2007, 21, 17–34. [Google Scholar] [CrossRef]
  24. Venkatesan, S.; Murugesan, S.; Ganapathy, M.N.K.; Verma, D.P. Long-term impact of nitrogen and potassium fertilizers on yield, soil nutrients and biochemical parameters of tea. J. Sci. Food Agric. 2004, 84, 1939–1944. [Google Scholar] [CrossRef]
  25. Cloughley, J.B.; Grice, W.J.; Ellis, R.T. Effects of harvesting policy and nitrogen application rates on the production of tea in Central Africa. I. Yield and crop distribution. Exp. Agric. 1983, 19, 33–46. [Google Scholar] [CrossRef]
  26. Mehlich, A. Mehlich 3 soil test extractant: A modification of Mehlich 2 extractant. Commun. Soil Sci. Plant Anal. 1984, 15, 1409–1416. [Google Scholar] [CrossRef]
  27. Ma, L.; Jiang, S.; Deng, M.; Lv, L.; Xu, Z.; Ruan, J. Thermo condition determines the uptake of autumn and winter applied nitrogen and subsequent utilization in spring tea (Camellia sinensis L.). Horticulturae 2021, 7, 544. [Google Scholar] [CrossRef]
  28. Lemaire, G.; Oosterom, E.v.; Sheehy, J.; Jeuffroy, M.H.; Massignam, A.; Rossato, L. Is crop N demand more closely related to dry matter accumulation or leaf area expansion during vegetative growth? Field Crops Res. 2007, 100, 91–106. [Google Scholar] [CrossRef]
  29. Lemaire, G.; Jeuffroy, M.H.; Gastal, F. Diagnosis tool for plant and crop N status in vegetative stage theory and practices for crop N management. Eur. J. Agron. 2008, 28, 614–624. [Google Scholar] [CrossRef]
  30. Balasuriya, J. Shoot population density and shoot weight of clonal tea (Camellia sinensis) at different altitudes in Sri Lanka. Eur. J. Agron. 1999, 11, 123–130. [Google Scholar] [CrossRef]
  31. De Costa, W.A.J.M.; Navaratne, D.M.S.; Anandacoomaraswamy, A. Physiological basis of yield variation of tea (Camellia sinensis) during different years of the pruning cycle in the central highlands of Sri Lanka. Exp. Agric. 2009, 45, 429–450. [Google Scholar] [CrossRef]
  32. Madamombe, G.; Tesfamariam, E.; Taylor, N. Yield decline in mechanically harvested clonal tea (Camellia sinensis (L.) O. Kuntze) as influenced by changes in source/sink and radiation interception dynamics in the canopy. Sci. Hortic. 2015, 194, 286–294. [Google Scholar] [CrossRef] [Green Version]
  33. Kalita, R.M.; Das, A.K.; Sileshi, G.W.; Nath, A.J. Ecosystem carbon stocks in different aged tea agroforestry systems: Implications for regional ecosystem management. Trop. Ecol. 2020, 61, 203–214. [Google Scholar] [CrossRef]
  34. Kamau, D.M.; Spiertz, J.H.J.; Oenema, O. Carbon and nutrient stocks of tea plantations differing in age, genotype and plant population density. Plant Soil 2008, 307, 29–39. [Google Scholar] [CrossRef] [Green Version]
  35. Li, S.; Wu, X.; Xue, H.; Gu, B.; Cheng, H.; Zeng, J.; Peng, C.; Ge, Y.; Chang, J. Quantifying carbon storage for tea plantations in China. Agric. Ecosyst. Envrion. 2011, 141, 390–398. [Google Scholar] [CrossRef]
  36. Zhang, M.; Chen, Y.; Fan, D.; Zhu, Q.; Pan, Z.; Fan, K.; Wang, X. Temporal evolution of carbon storage in Chinese tea plantations from 1950 to 2010. Pedosphere 2017, 27, 121–128. [Google Scholar] [CrossRef]
  37. Ahmed, A.; de Costa, W.A.J.M.; Wijeratne, M.A. Effect of different plucking systems on yield and root starch reserve in two cultivars of tea (Camellia sinensis L.). J. Environ. Sci. Nat. Resour. 2016, 9, 91–95. [Google Scholar] [CrossRef] [Green Version]
  38. Botwright, T.L.; Menary, R.C.; Brown, P.H. Photosynthesis and assimilate partitioning during rhythmic growth of green tea (Camellia sinensis var sinensis). J. Hortic. Sci. Biotechnol. 1998, 73, 806–811. [Google Scholar] [CrossRef]
  39. Magambo, M.J.; Cannell, M.G. Dry matter production and partition in relation to yield of tea. Exp. Agric. 1981, 17, 33–38. [Google Scholar] [CrossRef]
  40. Fageria, N.K. Nitrogen harvest index and its association with crop yields. J. Plant Nutr. 2014, 37, 795–810. [Google Scholar] [CrossRef]
  41. Fan, K.; Zhang, Q.; Tang, D.; Shi, Y.; Ma, L.; Liu, M.; Ruan, J. Dynamics of nitrogen translocation from mature leaves to new shoots and related gene expression during spring shoots development in tea plants (Camellia sinensis L.). J. Plant Nutr. Soil Sci. 2020, 183, 180–191. [Google Scholar] [CrossRef]
  42. Zhu, F.; Dai, L.; Hobbie, E.A.; Qu, Y.; Huang, D.; Gurmesa, G.A.; Zhou, X.; Wang, A.; Li, Y.; Fang, Y. Quantifying nitrogen uptake and translocation for mature trees: An in situ whole tree paired 15N labeling method. Tree Physiol. 2021, 41, 2109–2125. [Google Scholar] [CrossRef] [PubMed]
  43. Gastal, F.; Lemaire, G. N uptake and distribution in crops: An agronomical and ecophysiological perspective. J. Exp. Bot. 2002, 53, 789–799. [Google Scholar] [CrossRef] [PubMed] [Green Version]
  44. Ma, L.F.; Shi, Y.Z.; Ruan, J.Y. Nitrogen absorption by field-grown tea plants (Camellia sinensis) in winter dormancy and utilization in spring shoots. Plant Soil 2019, 442, 127–140. [Google Scholar] [CrossRef]
  45. Dong, F.; Hu, J.; Shi, Y.; Liu, M.; Zhang, Q.; Ruan, J. Effects of nitrogen supply on flavonol glycoside biosynthesis and accumulation in tea leaves (Camellia sinensis). Plant Physiol. Biochem. 2019, 138, 48–57. [Google Scholar] [CrossRef]
Figure 1. Weight per shoot for plants harvested under different standards in early and late spring, summer, and autumn over three experimental years (means ± standard errors, n = 4). Single bars without data points located above columns are LSD values indicative of significant (p < 0.05) differences between harvest standards in the specified season.
Horticulturae 08 00275 g001
Figure 2. Density levels of young shoots harvested at different standards in early and late spring, summer, and autumn over three experimental years (means ± standard errors, n = 4). Single bars without data points located above columns are LSD values indicative of significant (p < 0.05) differences between harvest standards in the specified season. The symbol ‘ns’ above columns indicates no significant difference between four harvest standards.
Horticulturae 08 00275 g002
Figure 3. Pearson’s correlation coefficients among weight per shoot, shoot density, N concentration (N conc), N content (N cont), and yield (n = 48) values in early spring (a), late spring (b), summer (c), and autumn (d). Red and green colors indicate significantly positive and negative correlations, respectively. Significance level: *, p < 0.05; **, p < 0.01; ***, p < 0.001; ****, p < 0.0001.
Horticulturae 08 00275 g003
Figure 4. Yields of young shoots harvested under different standards in early and late spring, summer, and autumn over three experimental years (means ± standard errors, n = 4). Single bars without data points located above columns are LSD values indicative of significant (p < 0.05) differences between harvest standards in the specified season. The symbol ‘ns’ above columns indicates no significant difference between four harvest standards.
Horticulturae 08 00275 g004
Figure 5. Concentrations of nitrogen in young shoots harvested at different standards in early and late spring, summer, and autumn over three experimental years (means ± standard errors, n = 4). Single bars without data points located above columns are LSD values indicative of significant (p < 0.05) differences between harvest standards in the specified season. The symbol ‘ns’ above columns indicates no significant difference between four harvest standards.
Horticulturae 08 00275 g005
Figure 6. Contents of nitrogen in young shoots harvested under different standards in early and late spring, summer, and autumn over three experimental years (means ± standard errors, n = 4). Single bars without data points located above columns are LSD values indicative of significant (p < 0.05) differences between harvest standards in the specified season. The symbol ‘ns’ above columns indicates no significant difference between four harvest standards.
Horticulturae 08 00275 g006
Figure 7. Relationships between annual (a) and seasonal (b) N contents (Nys) with yields (Yys) of young shoots harvested under different standards across the three experimental years. Coefficients of regression (Nys = a × Yysb) are presented in Table 2.
Horticulturae 08 00275 g007
Figure 8. Seasonal Ndff% (a,b) and 15N (c,d) amounts in young shoots harvested under different standards in the current and following year of 15N application (means ± standard errors, n = 4). Single bars without data points located above columns are LSD values indicative of significant (p < 0.05) differences among harvest standards. The symbol ‘ns’ above columns indicates no significant difference between four harvest standards.
Horticulturae 08 00275 g008
Table 1. Linear regression of the mean dry weight per shoot (mg) values against the numbers of young and expanding leaves (shoot weight = a + b × leaf number, n = 16).
SeasonabR2SE of Estimate
Early spring0.1941.6000.942 ***0.339
Late spring0.8401.9260.914 ***0.505
Spring0.6261.7760.966 ***0.285
Summer−0.2263.3300.825 ***1.306
Autumn−0.3802.5060.950 ***0.489
Significance level: ***, p < 0.001.
Table 2. Regression coefficients of annual and seasonal N contents (Nys) against yields (Yys) according to the empirical formula (Nys = a × Yysb) (n = 48).
SeasonabR2SE of Estimate
Spring tea53.2161.0850.925 ****4.364
Summer tea46.1570.9620.993 ****3.396
Autumn tea37.5360.7250.845 ****3.467
Whole year46.4350.9970.986 ****6.300
Significance level: ****, p < 0.0001.
Table 3. Biomass amounts of tea plants at the end of the experiment and harvest index values of shoot (SHI) and shoot 15N (NHI) under different harvest standards (means ± standard errors, n = 4).
OrganHarvest Standard
B + 1LB + 2LB + 3LB + 1L/3L
Plant biomass (ton ha−1)60.2 ± 3.762.5 ± 3.563.6 ± 8.165.2 ± 4.1
Fibrous root biomass (ton ha−1)1.6 ± 0.42.5 ± 0.42.1 ± 0.72.9 ± 0.3
Brown root biomass (ton ha−1)23.1 ± 2.2 b19.9 ± 1.0 b15.2 ± 1.7 a22.5 ± 2.9 b
Root/above-ground ratio0.71 ± 0.06 b0.56 ± 0.02 b0.38 ± 0.03 a0.64 ± 0.07 b
Shoot harvest index (SHI) (%)0.046 ± 0.0040.058 ± 0.0020.061 ± 0.0060.058 ± 0.002
Total 15N absorption (kg ha−1)42.4 ± 5.443.0 ± 5.143.0 ± 2.949.5 ± 4.1
Shoot 15N (kg ha−1)12.0 ± 0.315.5 ± 1.416.0 ± 2.414.3 ± 0.9
Share of shoot 15N in total 15N absorption (%)29.7 ± 3.436.8 ± 2.937.1 ± 4.529.0 ± 1.1
15N in final plant (kg ha−1)27.8 ± 5.325.1 ± 3.625.0 ± 2.833.1 ± 3.4
Share of final plant 15N in total 15N absorption (%)63.8 ± 4.957.9 ± 1.858.3 ± 4.966.5 ± 1.8
N harvest index (NHI)0.19 ± 0.020.23 ± 0.020.22 ± 0.020.18 ± 0.01
Different letters following data within the same line indicate significant (p < 0.05) differences among harvest standards as assessed by LSD test.
Publisher’s Note: MDPI stays neutral with regard to jurisdictional claims in published maps and institutional affiliations.

