Abstract
Chitosan oligosaccharides (COS) has been abundantly studied for its application on regulating plant growth of many horticultural and agricultural crops. We presented here the effect of COS on tea plant growth and yield by physiological and transcriptomic checking. The results showed that COS treatment can enhance the antioxidant activity of superoxide dismutase (SOD) and peroxidase (POD) and increase the content of chlorophyll and soluble sugar in tea plants. The field trail results show that COS treatment can increase tea buds’ density by 13.81–23.16%, the weight of 100 buds by 15.94–18.15%, and the yield by 14.22–21.08%. Transcriptome analysis found 5409 COS-responsive differentially expressed genes (DEGs), including 3149 up-regulated and 2260 down-regulated genes, and concluded the possible metabolism pathway that responsible for COS promoting tea plant growth. Our results provided fundamental information for better understanding the molecular mechanisms for COS’s acting on tea plant growth and yield promotion and offer academic support for its practical application in tea plant.
1. Introduction
Natural biostimulants, such as glycoproteins hydrolysates, seaweed extracts, and microbial fermentation, have practical importance in cultivation systems and crops production [1,2,3]. Among them, chitosan oligosaccharides (COS) are the degraded products of chitin or chitosan that are obtained by physical, enzymatic, or chemical hydrolysis [4,5]. COS refers to the oligosaccharides of D-glucosamine linked by β-1.4 glycosidic bonds, which are natural biostimulants of polysaccharides made by treating shrimp and other crustacean shells with the alkali, sodium hydroxide [6,7], along with many merits like low viscosity, good water-solubility [8], non-toxicity [9], hydrophilicity, biocompatibility and biodegradability [10].
COS has been proved versatile for agricultural purposes [11,12,13,14,15,16,17,18,19]. For example, COS was reported to be effective on yield, components, and crop production [12,13]. As a natural bioactive elicitor, COS has been largely investigated for its physiological function such as stimulating seed germination [14], improving chlorophyll and soluble sugar contents [15,16], enhancing the activities of antioxidant enzymes [17,18], and inducing salt and drought tolerance [15,18]. Additionally, COS has been reviewed for its function as a plant disease vaccine [19].
The function of COS on crop innate immunity has been genetically studied. For example, COS triggered innate immunity of oilseed rape resistance against Sclerotinia sclerotiorum by eliciting the jasmonic acid-ethylene (JA/ET) signal pathway [20]. It was also found that, by induced Ca2+ influx and stimulated defensing response of tobacco plants, COS can suppress the propagation of tobacco mosaic virus (TMV) [21]. Gene expression in Brassica napus treated with oligochitosan elicitor was analyzed by cDNA microarray and found that COS activate the expression of Ca2+-dependent protein kinase, plant chelate peptide synthase, and JA/ET signaling pathway-related groups [22]. These results indicated that COS possess broad practical application in agriculture and take various genetic effects on plants.
The tea (Camellia sinensis (L.) O. Kuntze) plant is an important economic crop that has been planted in China for nearly 2000 years [23]. We have reported that the COS can elicit tea plant adapting response to cold stress [24]. However, the mode of action of COS in inducing the growth of tea plants is not clear. Therefore, this experiment studied the effect of exogenous COS on the growth mechanism of tea plants. The introduction of “omics” technologies makes exploring biological interactions possible by integrating gene, proteins, and other regulatory elements. In the present research, the integrative analysis of physiological and transcriptomic analysis was expected to provide fundamental information for understanding the mechanism of COS regulating the tea plant growth and development.
2. Materials and Methods
2.1. Plant Material and Growth Conditions
We conducted the field test at three tea gardens in Meitan, Ziyun and Pingtang in Guizhou Province, China, at geographical coordinates of 106–107 degrees north (N) and 26–28 degrees east (E) with an altitude of 1100 m and an average annual temperature of 15.09 °C and annual relative humidity 70%. The tested tea plants were around 13 years old, and the cultivar was Camellia sinensis var. sinensis, Fuding Dabai.
2.2. Treatments and Field Test Design
In March 2019 (before tea germination), 5% COS agent (purchased from Hainan Zhengye Zhongnong High-tech Co., Ltd., Haikou, China) was applied on tea plant in accordance with the provisions of the ratio of dilution of the instructions. An electrostatic sprayer with the volume of 16 kg was used. Every 40 mL commercial agent was 800 times diluted in volume with water consumption 32 kg/667 m2. Clean water (CK) served as control. The spraying was conducted once every five days and total three times in 15 days. The plot size was set as 50 m × 20 m and the tea plant row spacing was approximately one meter. Three replicates in randomized complete block for every spraying application in tea garden.
2.3. Yield Determination
In April 2019, after spraying COS, the number of buds in each of 0.1 m2 (0.33 m × 0.33 m) was randomly counted with three different plot repeats in the center of the field to evaluate the bud density per square meter.
In addition, the tea shoot tips (with one heat and a second leaf) every 200 m2 (20 m × 10 m) are picked in the center field plot. The obtained tea buds were randomly selected and measured for the weight of 100 buds. The tea picking and measure in the experimental group and the control group were performed, respectively, and the tea output or yield were evaluated. All the measurements were repeated 3 times, and finally the fresh tea picked in each region were quickly frozen with liquid nitrogen and stored in a refrigerator at −80 °C for further use.
2.4. Determation of Activity of Antioxident Enzymes (SOD, POD) and Content of Chlorophyll and Soluble Sugar
The tea leaves (0.2 g) were grounded with 1mL stilled water for both the control and COS treatment group. Additionally, the homogenate was then transferred into a centrifuge tube and centrifuged at 8000 g for 10 min at 4 °C. The supernatant was subjected to a spectrophotometer, which analyzes the liquid by measuring the amount of light that is absorbed by it [25,26]. Thus, the enzyme activity, soluble sugar and chlorophyll content were accordingly obtained by following provisions in bioassay kits as reported [24]. The involved bioassay kits were purchased from Solarbio, Beijing, China and the Cat. No. was BC0175, BC0095, BC0995, BC0035, respectively.
2.5. RNA-Seq Analysis on 5% COS Promoting Tea Plant Growth
2.5.1. RNA Isolation, Library Preparation and Sequencing
RNA-Seq analysis were taken on samples from control and COS treatment group. The extraction of total RNAs were done using TRIzol (Invitrogen, Carlsbad, CA, USA) [27]. The concentration of isolated RNA was determined by NanoDrop TM OneC spectrophotometer (Thermo Fisher Scientific Inc, Carlsbad, CA, USA). The quality and integrity of RNA were checked by running 1.5% agarose gel. The cDNA synthesis was finished by using 2 ug DNAse-treated RNA using cDNA synthesis kit (Thermo Fisher Scientific Inc., Carlsbad, CA, USA). The mRNA libraries were generated using KC-DigitalTM stranded mRNA library prep kit for Illumina® (Catalog NO. DR08502, Seqhealth Technology Co., Ltd., Wuhan, China) and the library quality was assessed on the Agilent Bioanalyzer 2100 system. The kit eliminates duplication bias in PCR and sequencing steps, by using a unique molecular identifier (UMI) of 8 random bases to label the pre-amplified cDNA molecules. The library products corresponding to 200–500 bps were enriched, quantified, and finally sequenced on Illumina Novaseq 6000 (Illumina, San Diego, CA, USA). RNA extraction, library preparation and data analysis of high-throughput sequencing were completed by Kangce Technology Co., Ltd. in Wuhan, China.
2.5.2. RNA-Seq Data Analysis
Raw sequencing data was first filtered by Trimmomatic (version 0.36), low-quality reads were discarded [28], and the reads contaminated with adaptor sequences were trimmed, then clean reads were mapped to the reference genome of Camellia sinensis using STATR software (version 2.5.3a) [29]. Estimation of gene expression level using Fragments Per Kilobase Million (FPKM) method [30].
2.5.3. Screening of DEGs
Reads mapped to the exon regions of each gene were counted by feature Counts (Subread-1.5.1; Bioconductor) and then Reads Per Kilobase Million (RPKMs) were calculated [31]. Genes differentially expressed between groups were identified using the edge R package (version 3.12.1) [32]. After the read count data obtained from gene expression level analysis is standardized, the hypothesis test probability (p-value) is calculated and corrected by multiple hypothesis test to obtain the false discovery rate (FDR) value [33]. In the analysis, DEGs were defined as genes with p-value < 0.05 and a logarithm two-fold change |log2FC| > 1.
2.5.4. Gene Ontology (GO) and Kyoto Encyclopedia of Genes and Genomes (KEGG) Pathway Analysis
Firstly, the function of DEGs was annotated through GO database (http://www.geneontology.org/) and KEGG (http://www.genome.jp/kegg/) database (accessed on 29 October 2019), and then the GO and KEGG pathway are enriched and analyzed by KOBAS (version: 2.1.1) software with p-value < 0.05 to judge statistically significant enrichment [34].
2.5.5. RT-qPCR Verification
Eight unigenes (Table S1) were chosen to confirm their involvement in the response to grows using RT-qPCR method and was conducted on ABI ViiATM 7 Real-Time PCR System (Applied Biosystems, Foster, CA, USA) using GoTaq® qPCR Master Mix Promega, Madison, WI, USA). The PCR amplification was initially denatured at 95 °C for 3 min, followed by 40 cycles amplification at 95 °C for 15 s, 60 °C for 30 s, and then 72 °C for 30 s. Gene expression was normalized using the glyceraldehyde-3-phosphate dehydrogenase (GADPH) as an internal. All RT-qPCR experiments were repeated in three biological replications.
2.6. Statistical Analysis
Data were expressed as the mean ± standard error, and the data were subjected to one-way analysis of variance (ANOVA) (p < 0.05) followed by a significant difference test (LSD) using SPSS statistics v17.0 (SPSS Inc., Chicago, IL, USA).
3. Results
3.1. Effect of Application of 5% COS on Tea Yield
3.1.1. Effect on Bud Density and 100-Bud Weight
Bud density and 100-bud weight are important indicators for tea yield. As shown in Figure 1, 5% COS promote the emergence of new and tender leaves and effectively increase the bud density and 100-bud weight.
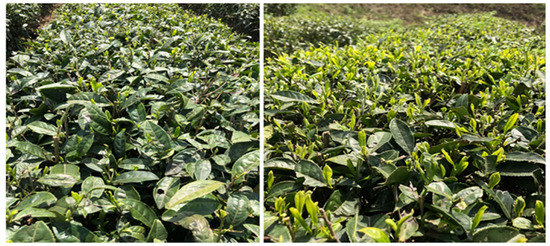
Figure 1.
Tea plants treated by 5% COS bearing more new shoots (left: CK; right: COS-treated).
The bud dentistry in three different area were detected as shown in Figure 2 with average numbers of buds 1433.33, 1263.33 and 1843.33, respectively, which were increased by 18.46%, 13.81% and 23.16% when comparing with the CK. The average weight of 100-buds was 7.75 g, 8.64 g and 6.52 g, respectively, which increased by 16.23%, 18.15% and 15.94% compared with the CK.
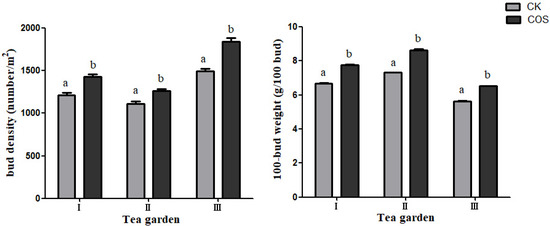
Figure 2.
The effect of COS on bud density and 100-bud weight. The data represent the means ± SD of three replicates samples. Different letters indicate significant differences at p < 0.05. I, II and III represent three teagardens in Meitan County, Ziyun County, and Pingtang County, respectively.
3.1.2. Effect of COS on Actual Production of Tea
Actual production of tea in field test indicated that spraying 5% COS at dose of 40 mL/667 m2 can effectively increase the yield of tea. Among those field test areas, I, II and III, the average actual tea plucking production in per square meter were 7.98 g, 8.43 g and 7.82 g, respectively, which increased by 14.22%, 19.63% and 21.08%, respectively, compared with the control (CK) (Figure 3).
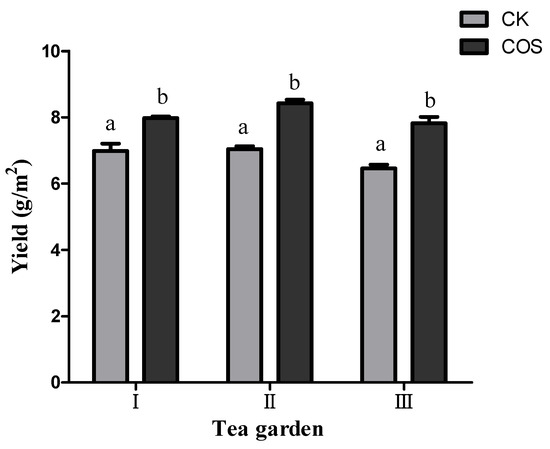
Figure 3.
Effect of application of COS on tea yields. The data represent the means ± SD of three replicates samples. Different letters indicate s-ignificant differences at p < 0.05. I, II and III represent three teagardens in Meitan County, Ziyun County, and Pingtang county, respectively.
3.2. Physiological and Biochemical Indexes Change of Tea Plant Regulated by COS
The contents of SOD, POD enzyme activity, chlorophyll and soluble sugar in tea leaves were evaluated in response to COS treatment. A significant increase in COS group were shown in comparison to control group (Figure 3). In tea plants, the SOD activity in control group was calculated to be 147.23 U/g FW, however, in the COS group its activity was 262.94 U/g and increased by 69.32% (Figure 4A). Similarly, the POD activity in the control group was 91.80 U/g FW and the enzyme activity in COS increased by 48.45% and reached 136.28 (Figure 4B). Likewise, chlorophyll content in control was 0.35 mg/g FW and increased by 10.27% after application of COS (Figure 4C). Additionally, soluble sugar content was calculated to be 38.37 mg/g FW in control and was promoted to 56.95 mg/g FW in COS treatment and increased by 48.42% (Figure 4D). It is obvious that application of 5% COS systematically promoted the activity of SOD and POD and the content of soluble sugar and chlorophyll in the tea plant compared with the CK.
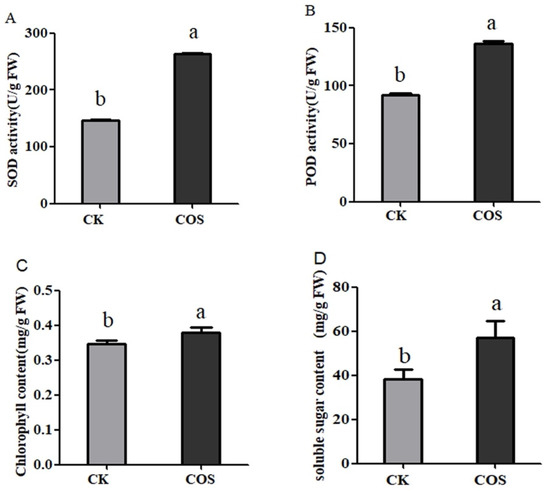
Figure 4.
COS affecting on physiological parameters of tea leaves. (A) chlorophyll content; (B) soluble sugar content; (C) SOD activity; and (D) POD activity. The data represent the means ± SD of three replicates samples. Different letters indicate significant differences at p < 0.05.
3.3. RNA-Seq Analysis of COS Promoting Tea Plant Growth
3.3.1. Transcription Analysis
Transcriptomic analysis between samples from both control and COS-treated plants by RNA-Seq with three replicates were done to understand the mechanism of COS promoting tea plant growth. In total, 53.75–70.30 million raw reads in control (ConT3_1/2/3) and 90.15–97.52 million raw reads in the COS-treatment group (TreT3_1/2/3) were obtained (Table 1), and the clean reads were limited to 50.30–6.89 million and 84.67-91.58 million, respectively. Of these clean reads, the GC content was 46.70–47.22% and the Q30 values were over 99.20%. The ratio of total mapped reads between the control and COS-treatment groups was 95.07–95.24% and 95.28–95.43% for Camellia sinensis according to the Genome Database. Unique mapped reads were 90.37–92.37% in the control group and 90.95–92.23% in the COS-treatment group (Table 1).

Table 1.
Statistical analyses and mapping results of RNA sequencing reads.
3.3.2. DEGs Analysis
Through the correlation analysis of samples, it was found that the Pearson’s correlation coefficient R2 between samples was more than 0.92, indicating that the biological repeatability of samples was good (Figure 5). Genes with p-value < 0.05 and |log2(Foldchange)| > 1 were defined as DEGs between control and COS. Through expression analysis, there were identified 5409 DEGs between the control and COS, including 3149 up-regulated and 2260 down-regulated genes (Figure 6 and Table S2).
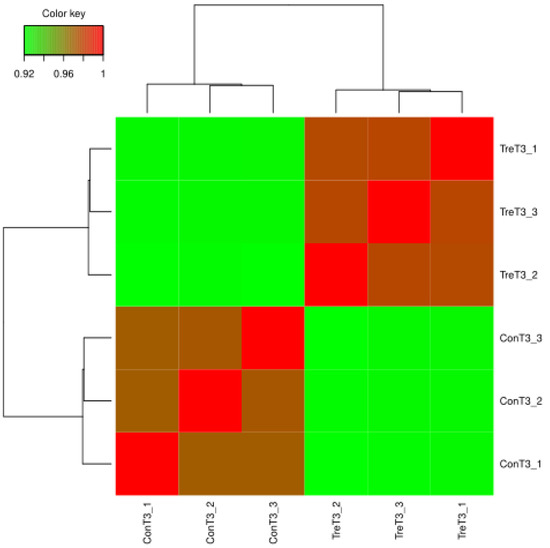
Figure 5.
Correlation heat map analysis.
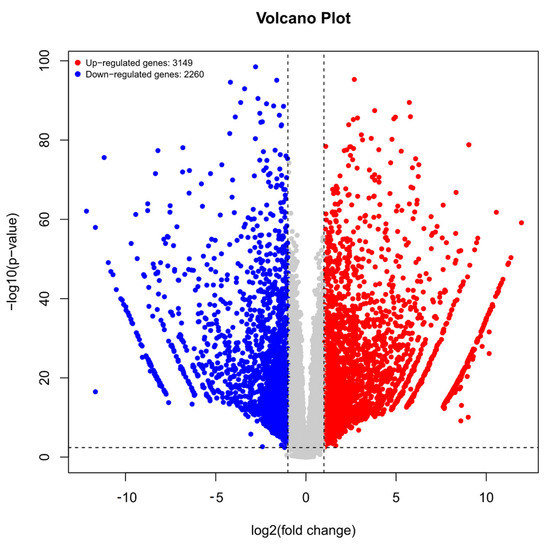
Figure 6.
Volcano plot of DEGs between control and COS treatment. Red dots represent differentially up-regulated genes; blue dots represent differentially down-regulated genes, and gray dots represent genes with no significant difference.
3.3.3. GO Annotation
With identification of DEGs, GO analysis for COS treatment in tea plant were classified inters of biological process, cellular components, and molecular function and the most enriched GO terms were displayed on Figure 7. The DEGs were mostly enriched in biological process and functional enrichment mainly belong to metabolic processes and biosynthetic process, including single-organism metabolic process, organonitrogen compound biosynthetic process, and carbohydrate derivative metabolic process. The molecular functional categorization showed that the COS-induced DEGs were grouped into 268 groups (Table S3) including the expression of transmembrane transporters and isomerase enzyme-related genes, such as substrate-specific transporter activity and isomerase activity.
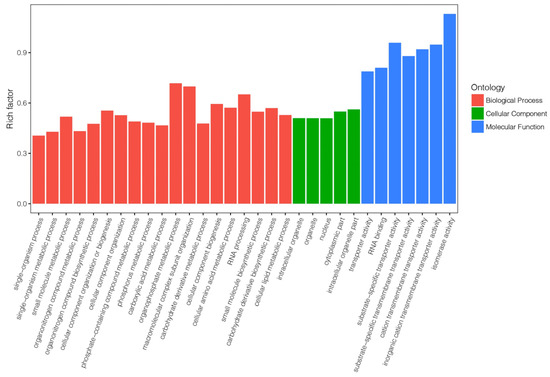
Figure 7.
GO classification of the DEGs induced by COS in tea leaves.
3.3.4. KEGG Pathway Annotation
To obtain more biological information regarding the molecular and biochemical responses of tea plant induced by COS, we conduct KEGG pathway enrichment analysis on DEGs based on the terms of richness factor, p-value, and the number of genes in the pathway (Figure 8, Table S4). In total, 47 KEGG terms were enriched (Table S4) and the 20 most significantly enriched KEGG terms were displayed (Figure 8). It revealed that the COS-induced genes in tea plant primarily participated in metabolic pathways, photosynthesis, carbon metabolism, and plant–pathogen interaction.
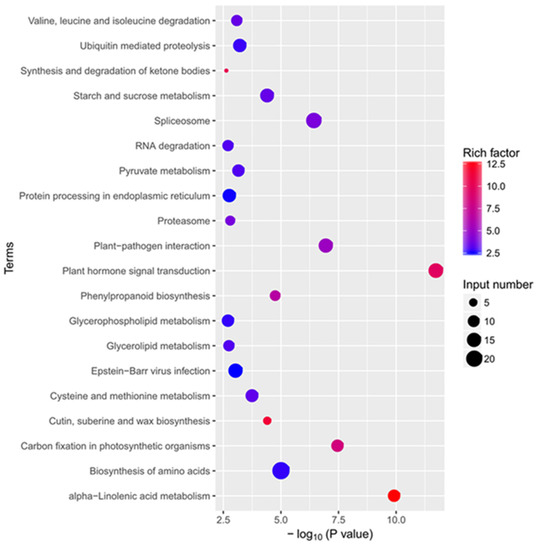
Figure 8.
KEGG enrichment analysis of DEGs response to COS treatment.
Comparing to the control group, a total of 48 genes were assigned to the plant hormone signal transduction pathway, including 35 genes that were up-regulated in jasmonates, auxin, Indole-3-acetic acid, Gretchen Hagen-3 (Table S5). There was a total of 26 genes that were deferentially expressed in the alpha-Linolenic acid metabolism pathway, including 25 up-regulated and 1 down-regulated (Table S6). These results indicated that COS treatment had complex effects on the biological process of tea plants.
3.3.5. qRT-PCR Verification
To corroborate the obtained RNA-Seq data, we performed qRT-PCR analysis on eight transcripts of DEGs (Figure 9). Of them, seven were consistent with RNA-seq results (Table S1) including up-regulated DEGs LOC114319469, LOC114283520, LOC 114268500 and LOC114312375 and down regulated LOC114279513, LOC114292261, and LOC114292883. Only LOC114289957 showed reverse correlation with. The results revealed that the expression trend of these genes by q-RT PCR was consistent with the trend of RNA levels results and the transcriptome data were reliable.
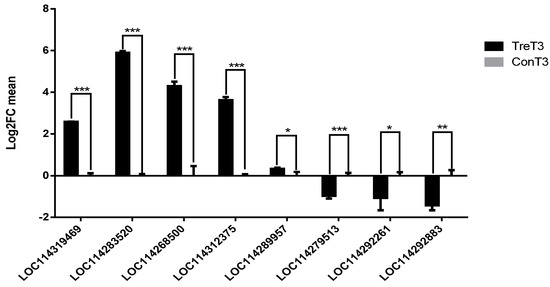
Figure 9.
qRT-PCR verification of DEGs. Notes: 1. TreT3(black bar) represents the treatment group and ConT3 (gray bar) represents the control group which DEGs was set to 0. Positive value of the vertical axis represents DEGs up-regulation and negative one represents DEGs down-regulation. 2. * means p < 0.05 is statistically different, ** means p < 0.01 is considered to have significant statistical difference, and *** means p < 0.001 is considered to have extremely significant statistical difference. Means p refers to the p-value obtained by the significance T-test method.
4. Discussion
Little research has been taken to study the effect of COS on tea plant. After investigating its action on alleviating cold stress on tea plants [27], we reported here the function of COS on tea plant growth and yield promotion by integrating the physiological, biochemical, and transcriptomic investigation.
We revealed that COS treatment can promote tea plant growth and production, with tea buds’ density increased by 13.81–23.16% (Figure 2) and the 100-bud-weight increased by 15.94–18.15% (Figure 2). The total tea leave yield was improved by 14.22–21.08% (Figure 3). The enhancing in yield could be directly manifested in denser germination and heavier bud weight.
We here found that COS application significantly increased the contents of SOD and POD enzyme of tea leaves (Figure 4C,D) comparing to control group. Those antioxidant enzymes can catalytically remove peroxides or superoxide and reduce their oxidative stress and damage to plant cell structures, such as protein, DNA and membrane lipids [14,35]. This function might enhance immune system of tea plant and promotes the growth and development of tea plant.
Additionally, the application of COS increased the content of chlorophyll and soluble sugar in tea leaves (Figure 4A,B), which is consistent with the research results that COS in wheat promotes the accumulation of chlorophyll and soluble sugar [16,36,37]. Chlorophyll is an extremely important biomolecule, critical in photosynthesis, which allows plants to absorb energy and nutrients, promote growth [15]. Soluble sugar can participate in many metabolic processes [18]. COS application in tea field promoted the growth of tea plants and increases the yield of tea production. It might be concluded that COS can positively affect these physiological responses of tea plants and promote the growth and development of tea plants.
Transcriptomic check revealed that COS significantly altered the mRNA level of gene expression involved in plant hormone signal transduction and alpha-Linolenic acid metabolism. Naturally, plant growth and response to environmental cues are largely governed by phytohormones [38] like quick response to auxin [39]. In the present report, enriched genes in plant hormone signal transduction pathway including Jasmonate ZIM-domain (JAZ), BRI1-associated kinase 1 (BAK1), Indole-3-acetic acid (IAA), Gretchen Hagen-3 (GH3), and MYC2 were up-regulated (Table S5). Jasmonates (JA), as an important phytohormone, regulates diverse aspects of plant development. JAZ proteins play a central role within the JA signaling cascades [40]. BRI1-associated kinase 1 (BAK1) is a multifunctional receptor-like kinase. It can interact with BRI1 to regulate plant hormone brassinolide signals [41], thereby affecting plant growth and development, cell death and immune signals [42,43,44]. GH3 is an important response gene of auxin-responsive protein (IAA) and can encode a class of IAA-amido synthetases and play an important role in IAA-regulated plant growth and development [45]. MYC2 is the initial transcription factor of JA response genes [46,47]. When a JA response occurs, JAZs are induced, and the induced JAZs inhibits the MYC2 transcription factor activity again, thereby blocking the JA response. This regulation process is like feedback regulation, so that the plant body will not produce an overly violent JA response and avoid plants. Excessive consumption of body energy regulates plant growth and development [48,49]. Studies have reported that JA-mediated changes in the transcription level of JAZs are related to growth hormone (IAA) [50], brassinosteroids (BRs) [51] and other hormone signals. All above indictors were found up-regulated in COS treatment and may imply an activated crosstalk network and response of signaling events occurs in tea plants, which ultimately regulated tea plant growth and development.
In COS treatment, the alpha-Linolenic acid metabolism pathway involved 25 significantly up-regulated of genes including DAD1, ADH1, LOXs, and AOC (Table S6). Among them, DAD1 (defending against death 1) plays an important role in protein N-glycosylation (a core subunit of oligosaccharide transferase (OST) complex) and negatively related to gene of programmed cell death (PCD) and can affect plant growth [52,53]. Plant lipoxygenases (LOXs) can catalytic oxidation of polyunsaturated fatty acids in lipids and products of LOXs are involved in diverse cell functions in plant physiology including growth and development [54,55]. These various DEGs and regulations indicate that COS may promote plant growth and development through alpha-Linolenic acid metabolism pathway.
5. Conclusions
In summary, our study revealed that COS can promote the growth of tea plant and improve the yield of tea production by regulating physiological function like accumulating antioxidant enzyme activities, chlorophyll content and soluble sugar content. Transcriptome sequencing and DEGs analysis showed that various gene and pathway primarily involved in COS treatment and plant hormone signal transduction and alpha-Linolenic acid metabolism pathway might play a dominant role in promoting the growth and development of tea plants. The results can provide a step for understanding the molecular regulation mechanism of COS on tea plant growth.
Supplementary Materials
The following are available online at https://www.mdpi.com/article/10.3390/horticulturae8010068/s1, Table S1: Verification of differential gene table by RT qPCR. Table S2: The list of deferent expression genes. Table S3: GO enrichment list of different expression genes. Table S4: KEGG pathway enrichment list of different expression genes. Table S5: Differentially expressed genes in plant hormone signal transduction pathway. Table S6: Deferentially expressed genes in alpha-Linolenic acid metabolism pathway.
Author Contributions
L.O. conducted the experiments and with X.Z wrote the manuscript; L.O., Q.Z. and D.J. designed and performed the experiments; X.Z., L.O. and Y.L. analyzed the data. L.J. conceived and supervised the project. All authors have read and agreed to the published version of the manuscript.
Funding
This research was funded by science and technology project of Guizhou province ([2015]5020) and scientific research projects of major agricultural industries of Guizhou province ([2019]006).
Institutional Review Board Statement
Not applicable.
Informed Consent Statement
Not applicable.
Data Availability Statement
Not applicable.
Conflicts of Interest
The authors declare no conflict of interest.
References
- Kazem, S.M.; Mojgan, B. Biostimulation effects of rosemary essential oil on growth and nutrient uptake of tomato seedlings. Entia Hortic. 2019, 243, 472–476. [Google Scholar]
- Ebrahimi, M.; Souri, M.K.; Mousavi, A.; Sahebani, N. Biochar and vermicompost improve growth and physiological traits of eggplant (solanum melongena l.) under deficit irrigation. Chem. Biol. Technol. Agric. 2021, 8, 19. [Google Scholar] [CrossRef]
- Brown, P.; Saa, S. Biostimulants in agriculture. Front. Plant Sci. 2015, 6, 671. [Google Scholar] [CrossRef] [PubMed] [Green Version]
- Benchamas, G.; Huang, G.; Huang, S.; Huang, H. Preparation and biological activities of chitosan oligosaccharides. Trends Food Sci. Technol. 2021, 107, 38–44. [Google Scholar] [CrossRef]
- Naveed, M.; Phil, L.; Sohail, M.; Hasnat, M.; Baig, M.; Ihsan, A.U.; Shumzaid, M.; Kakar, M.U.; Khan, T.M.; Akabar, M.; et al. Chitosan oligosaccharide (COS): An overview. Int. J. Biol. Macromol. 2019, 129, 827–843. [Google Scholar] [CrossRef] [PubMed]
- Muanprasat, C.; Wongkrasant, P.; Satitsri, S.; Moonwiriyakit, A.; Pongkorpsakol, P.; Mattaveewong, T.; Pichyangkura, R.; Chatsudthipong, V. Activation of AMPK by chitosan oligosaccharide in intestinal epithelial cells: Mechanism of action and potential applications in intestinal disorders. Biochem. Pharmacol. 2015, 96, 225–236. [Google Scholar] [CrossRef]
- Yuan, X.; Zheng, J.; Jiao, S.; Cheng, G.; Feng, C.; Du, Y.; Liu, H. A review on the preparation of chitosan oligosaccharides and application to human health, animal husbandry and agricultural production. Carbohydr. Polym. 2019, 220, 60–70. [Google Scholar] [CrossRef]
- de Farias, B.S.; Grundmann, D.D.R.; Rizzi, F.Z.; Martins, N.S.S.; Sant’Anna Cadaval Junior, T.R.; de Almeida Pinto, L.A. Production of low molecular weight chitosan by acid and oxidative pathways: Effect on physicochemical properties. Food Res. Int. 2019, 123, 88–94. [Google Scholar] [CrossRef] [PubMed]
- Shukla, S.; Jadaun, A.; Arora, V.; Sinha, R.K.; Biyani, N.; Jain, V.K. In vitro toxicity assessment of chitosan oligosaccharide coated iron oxide nanoparticles. Toxicol. Rep. 2014, 2, 27–39. [Google Scholar] [CrossRef] [Green Version]
- Unsoy, G.; Yalcin, S.; Khodadust, R.; Gunduz, G.; Gunduz, U. Synthesis Optimization and Characterization of Chitosan-Coated Iron Oxide Nanoparticles Produced for Biomedical Applications. J. Nanoparticle Res. 2012, 14, 964. [Google Scholar] [CrossRef]
- Mesa Ospina, N.; Ospina Alvarez, S.P.; Escobar Sierra, D.M.; Rojas Vahos, D.F.; Zapata Ocampo, P.A.; Ossa Orozco, C.P. Isolation of chitosan from Ganoderma lucidum mushroom for biomedical applications. J. Mater. Sci.-Mater. Med. 2015, 26, 135. [Google Scholar] [CrossRef]
- Wang, M.Y.; Chen, Y.C.; Zhang, R.; Wang, W.X.; Zhao, X.M.; Du, Y.G.; Yin, H. Effects of chitosan oligosaccharides on the yield components and production quality of different wheat cultivars (Triticum aestivum L.) in Northwest China. Field Crops Res. 2015, 172, 11–20. [Google Scholar] [CrossRef]
- Chatelain, P.G.; Pintado, M.E.; Vasconcelos, M.W. Evaluation of chitooligosaccharide application on mineral accumulation and plant growth in Phaseolus vulgaris. Plant Sci. 2014, 215–216, 134–140. [Google Scholar] [CrossRef]
- Kananont, N.; Pichyangkura, R.; Chanprame, S.; Chadchawan, S.; Limpanavech, P. Chitosan specificity for the in vitro seed germination of two Dendrobium orchids (Asparagales: Orchidaceae). Sci. Hortic. 2010, 124, 239–247. [Google Scholar] [CrossRef]
- Dzung, N.A.; Khanh, V.T.P.; Dzung, T.T. Research on impact of chitosan oligomers on biophysical characteristics, growth, development and drought resistance of coffee. Carbohydr. Polym. 2011, 84, 751–755. [Google Scholar] [CrossRef]
- Zou, P.; Tian, X.Y.; Dong, B.; Zhang, C.S. Size effects of chitooligomers with certain degrees of polymerization on the chilling tolerance of wheat seedlings. Carbohydr. Polym. 2017, 160, 194–202. [Google Scholar] [CrossRef]
- Ma, L.J.; Li, Y.Y.; Yu, C.M.; Wang, Y.; Li, X.M.; Li, N.; Chen, Q.; Bu, N. Alleviation of exogenous oligochitosan on wheat seedlings growth under salt stress. Protoplasma 2012, 249, 393–399. [Google Scholar] [CrossRef] [PubMed]
- Zou, P.; Li, K.C.; Liu, S.; Xing, R.G.; Qin, Y.K.; Yu, H.H.; Zhou, M.M.; Li, P.C. Effect of chitooligosaccharides with different degrees of acetylation on wheat seedlings under salt stress. Carbohydr. Polym. 2015, 126, 62–69. [Google Scholar] [CrossRef]
- Yin, H.; Zhao, X.; Du, Y. Oligochitosan: A plant diseases vaccine—A review. Carbohydr. Polym. 2010, 82, 1–8. [Google Scholar] [CrossRef]
- Yin, H.; Li, Y.; Zhang, H.Y.; Wang, W.X.; Lu, H.; Grevsen, K. Chitosan oligosaccharides-triggered innate immunity contributes to oilseed rape resistance against Sclerotinia sclerotiorum. Plant Sci. 2013, 174, 722–732. [Google Scholar] [CrossRef]
- Lu, H.; Zhao, X.M.; Wang, W.X.; Yin, H.; Xu, J.G.; Bai, X.F.; Du, Y.G. Inhibition effect on tobacco mosaic virus and regulation effect on calreticulin of oligochitosan in tobacco by induced Ca2+ influx. Carbohydr. Polym. 2010, 82, 136–142. [Google Scholar] [CrossRef]
- Yin, H.; Li, S.; Zhao, X.; Du, Y.; Ma, X. cDNA microarray analysis of gene expression in Brassica napus treated with oligochitosan elicitor. Plant Physiol. Biochem. 2006, 44, 910–916. [Google Scholar] [CrossRef]
- Li, J.; Yang, Y.; Sun, K.; Chen, Y.; Chen, X.; Li, X. Exogenous melatonin enhances cold, salt and drought stress tolerance by improving antioxidant defense in tea plant (Camellia sinensis (L.) O. Kuntze). Molecules 2019, 24, 1826. [Google Scholar] [CrossRef] [Green Version]
- Li, Y.Y.; Zhang, Q.Q.; Ou, L.N.; Ji, D.Z.; Liu, T.; Lan, R.M.; Li, X.Y.; Jin, L.H. Response to the Cold Stress Signaling of the Tea Plant (Camellia sinensis) Elicited by Chitosan Oligosaccharide. Agronomy 2020, 10, 915. [Google Scholar] [CrossRef]
- Yin, F.L.; Zeng, Y.L.; Ji, J.Y.; Wang, P.J.; Zhang, Y.F.; Li, W.H. The Halophyte Halostachys caspica AP2/ERF Transcription Factor HcTOE3 Positively Regulates Freezing Tolerance in Arabidopsis. Front. Plant Sci. 2021, 12, 681. [Google Scholar] [CrossRef]
- Wang, Y.N.; Liang, C.Z.; Meng, Z.G.; Li, Y.Y.; Abid, M.A.; Askari, M.; Wang, P.L.; Wang, Y.; Sun, G.Q.; Cai, Y.P. Leveraging Atriplex hortensis choline monooxygenase to improve chilling tolerance in cotton. Environ. Exp. Bot. 2019, 162, 364–373. [Google Scholar] [CrossRef]
- Chomzynski, P.; Sacchi, N. Single-step method of RNA isolation by acid guanidinium thiocyanate-phenol-chloroform extraction. Anal. Biochem. 1987, 162, 156–159. [Google Scholar] [CrossRef]
- Bolger, A.M.; Lohse, M.; Usadel, B. Trimmomatic: A flexible trimmer for Illumina sequence data. Bioinformatics 2014, 30, 2114–2120. [Google Scholar] [CrossRef] [PubMed] [Green Version]
- Dobin, A.; Davis, C.A.; Schlesinger, F.; Drenkow, J.; Zaleski, C.; Jha, S.; Batut, P.; Aisson, M.; Gingeras, T.R. STAR: Ultrafast universal RNA-seq aligner. Bioinformatics 2013, 29, 15–21. [Google Scholar] [CrossRef]
- Trapnell, C.; Williams, B.A.; Pertea, G.; Mortazavi, A.; Kwan, G.; Van Baren, M.J.; Salzberg, S.L.; Wold, B.J.; Pachter, L. Transcript assembly and quantification by RNA-Seq reveals unannotated transcripts and isoform switching during cell differentiation. Nat. Biotechnol. 2010, 28, 511–515. [Google Scholar] [CrossRef] [Green Version]
- Liao, Y.; Smyth, G.K.; Shi, W. Feature counts: An efficient general-purpose program for assigning sequence reads to genomic features. Bioinformatics 2014, 30, 923–930. [Google Scholar] [CrossRef] [Green Version]
- McCarthy, D.J.; Chen, Y.; Smyth, G.K. Differential expression analysis of multifactor RNA-Seq experiments with respect to biological variation. Nucleic Acids Res. 2012, 40, 4288–4297. [Google Scholar] [CrossRef] [PubMed] [Green Version]
- Anders, S.; Huber, W. Differential expression analysis for sequence count data. Genome Biol. 2010, 11, R106. [Google Scholar] [CrossRef] [Green Version]
- Wu, J.; Mao, X.; Cai, T.; Luo, J.; Wei, L. KOBAS server: A web-based platform for automated annotation and pathway identification. Nucleic Acids Res. 2006, 34, W720–W724. [Google Scholar] [CrossRef]
- Zhang, X.Q.; Li, K.C.; Xing, R.G.; Liu, S.; Chen, X.L.; Yang, H.Y.; Li, P.C. Mirna and mrna expression profiles reveal insight into chitosan-mediated regulation of plant growth. J. Agric. Food Chem. 2018, 66, 3810–3822. [Google Scholar] [CrossRef]
- Ahmad, P.; Jaleel, C.A.; Sharma, S. Antioxidant defense system, lipid peroxidation, proline-metabolizing enzymes, and biochemical activities in two morus alba genotypes subjected to nacl stress. Russ. J. Plant Physiol. 2010, 57, 509–517. [Google Scholar] [CrossRef]
- Parvaiz, A.; Satyawati, S. Salt stress and phyto-biochemical responses of plants—A review. Plant Soil Environ. 2008, 54, 89. [Google Scholar] [CrossRef]
- Asada, K. The water-water cycle in chloroplasts: Scavenging of active oxygens and dissipation of excess photons. Annu. Rev. Plant Biol. 1999, 50, 601–639. [Google Scholar] [CrossRef]
- Gupta, K.J.; Stoimenova, M.; Kaiser, W.M. In higher plants, only root mitochondria, but not leaf mitochondria reduce nitrite to NO, in vitro and in situ. J. Exp. Bot. 2005, 56, 2601–2609. [Google Scholar] [CrossRef]
- Subrahmanyam, D.; Subash, N.; Haris, A.; Sikka, A.K. Influence of water stress on leaf photosynthetic characteristics in wheat cultivars differing in their susceptibility to drought. Photosynthetica 2006, 44, 125–129. [Google Scholar] [CrossRef]
- Shang, Y.; Dai, C.; Lee, M.M.; Kwak, J.M.; Nam, K.H. BRI1-associated receptor kinase 1 regulates guard cell ABA signaling mediated by open stomata 1 in Arabidopsis. Mol. Plant 2016, 9, 447–460. [Google Scholar] [CrossRef] [PubMed] [Green Version]
- Zhang, X.Q.; Li, K.C.; Liu, S.; Xing, R.G.; Yu, H.H.; Chen, X.L.; Li, P.C. Size effects of chitooligomers on the growth and photosynthetic characteristics of wheat seedlings. Carbohydr. Polym. 2015, 138, 27–33. [Google Scholar] [CrossRef]
- Woodward, A.W.; Bartel, B. Auxin: Regulation, action, and interaction. Ann. Bot.-Lond. 2005, 95, 707–735. [Google Scholar] [CrossRef] [PubMed] [Green Version]
- Chandler, J.W. Auxin response factors. Plant Cell Environ. 2016, 39, 1014–1028. [Google Scholar] [CrossRef] [Green Version]
- Paciorek, T.; Friml, J. Auxin signaling. J. Cell Sci. 2006, 119, 1199–1202. [Google Scholar] [CrossRef] [Green Version]
- Berger, S.; Bell, E.; Mullet, J.E. Two methyl jasmonate-insensitive mutants show altered expression of AtVsp in response to methyl jasmonate and wounding. Plant Physiol. 1996, 111, 525–531. [Google Scholar] [CrossRef] [Green Version]
- Lorenzo, O.; Chico, J.M.; Sánchez-Serrano, J.J.; Solano, R. Jasmonate-insensitive1 encodes a myc transcription factor essential to discriminate between different jasmonate-regulated defense responses in arabidopsis. Plant Cell 2004, 16, 1938–1950. [Google Scholar] [CrossRef] [Green Version]
- Figueroa, P. The Arabidopsis JAZ2 promoter contains a G-box and thymidine-rich module that are necessary and sufficient for jasmonate-dependent activation by MYC transcription factors and repression by JAZ proteins. Plant Cell Physiol. 2012, 53, 330–343. [Google Scholar] [CrossRef] [Green Version]
- Leon, J. Role of plant peroxisomes in the production of jasmonic acid-based signals. Subcell. Biochem. 2013, 69, 299–313. [Google Scholar] [PubMed]
- Tiryaki, I.; Staswick, P.E. An arabidopsis mutant defective in jasmonateresponse is allelic to the auxin-signaling mutant axrl. Plant Physiol. 2002, 30, 887–894. [Google Scholar] [CrossRef] [PubMed] [Green Version]
- Ren, C.M.; Han, C.Y.; Peng, W.; Huang, Y.; Peng, Z.H.; Xiong, X.Y.; Zhu, Q.; Gao, B.D.; Xie, D.X. A leaky mutation in DWARF4 reveals an antagonistic role of brassinosteroid in the inhibition of root growth by jasmonate in arabidopsis. Plant Physiol. 2009, 151, 1412–1420. [Google Scholar] [CrossRef] [Green Version]
- Moharikar, S.; D'Souza, J.S.; Rao, B.J. A homologue of the defender against the apoptotic death gene (dad1) in UV-exposed chlamydomonas cells is downregulated with the onset of programmed cell death. J. Biosci. 2007, 32, 261–270. [Google Scholar] [CrossRef] [PubMed]
- Yamada, T.; Takatsu, Y.; Kasumi, M.; Marubashi, W.; Ichimura, K. A homolog of the defender against apoptotic death gene (DAD1) in senescing gladiolus petals is downregulated prior to the onset of programmed cell death. J. Plant Physiol. 2004, 161, 1281–1283. [Google Scholar] [CrossRef] [PubMed]
- Hwang, I.S.; Hwang, B.K. The pepper 9-lipoxygenase gene calox1 functions in defense and cell death responses to microbial pathogens. Plant Physiol. 2010, 152, 948–967. [Google Scholar] [CrossRef] [Green Version]
- Kolomiets, M.V.; Hao, C.; Gladon, R.J.; Hannapel, B.D.J. A leaf lipoxygenase of potato induced specifically by pathogen infection. Plant Physiol. 2000, 124, 1121–1130. [Google Scholar] [CrossRef] [Green Version]
Publisher’s Note: MDPI stays neutral with regard to jurisdictional claims in published maps and institutional affiliations. |
© 2022 by the authors. Licensee MDPI, Basel, Switzerland. This article is an open access article distributed under the terms and conditions of the Creative Commons Attribution (CC BY) license (https://creativecommons.org/licenses/by/4.0/).