Article

Integrative Effects of CO2 Concentration, Illumination Intensity and Air Speed on the Growth, Gas Exchange and Light Use Efficiency of Lettuce Plants Grown under Artificial Lighting

1
Institute of Environment and Sustainable Development in Agriculture, Chinese Academy of Agricultural Sciences, Beijing 100081, China
2
Department of Agricultural Engineering and Modern Technologies, Faculty of Agriculture, Food and Environment, Sana’a University, Sana’a 13020, Yemen
*
Author to whom correspondence should be addressed.
Horticulturae 2022, 8(3), 270; https://doi.org/10.3390/horticulturae8030270
Submission received: 2 February 2022 / Revised: 14 March 2022 / Accepted: 16 March 2022 / Published: 20 March 2022
(This article belongs to the Section Vegetable Production Systems)

Abstract

:
This study investigates and quantifies the integrative effects of CO2 concentration (500, 1000 and 1500 µmol mol−1), illumination intensity (100, 200 and 300 μmol m−2 s−1) and air speed (0.25, 0.50 and 0.75 m s−1) on the growth, gas exchange and light use efficiency of lettuce plants (Lactuca sativa L.) grown under artificial lighting. The results show that lettuce growth and gas exchange are closely related to CO2 concentration and illumination intensity, while air speed enhances CO2 transport during photosynthesis. The most influential two-way interactions were observed between CO2 concentration and illumination intensity on the fresh and dry weights of lettuce shoots with effect sizes of 34% and 32%, respectively, and on the photosynthesis, transpiration and light use efficiency, with effect sizes of 52%, 47% and 41%, respectively. The most significant three-way interaction was observed for the photosynthetic rate, with an effect size of 51%. In general, the fresh and dry weights of lettuce plants increased by 36.2% and 20.1%, respectively, with an increase in CO2 concentration from 500 to 1500 µmol mol−1 and by 48.9% and 58.6%, respectively, with an increase in illumination intensity from 100 to 300 μmol m2 s−1. The photosynthetic rate was found to be positively correlated with CO2 concentration, illumination intensity and air speed. The transpiration rate and stomatal conductance increased by 34.9% and 42.1%, respectively, when the illumination intensity increased from 100 to 300 μmol m−2 s−1. However, as CO2 concentration increased from 500 to 1500 μmol mol−1 and air speed increased from 0.25 to 0.75 m s−1, the transpiration rate decreased by 17.5% and 12.8%, respectively. With the quantified data obtained, we were able to adequately determine how CO2 concentration, illumination intensity and air speed interact with their combined effects on the growth of lettuce plants grown in indoor cultivation systems with artificial lighting.

1. Introduction

As a typical indoor production system, the primary objective of producing leafy vegetables in plant factories has always been to improve the growth and quality of plants with high input resource-use efficiencies [1,2,3,4]. Therefore, plant growth, plant quality and input resource-use efficiencies are important criteria for evaluating the performance of plant factories. Among all the input resources, the cost of electrical energy consumed by artificial lighting ranges from 24 to 30% of the total operation cost [5,6]. Moreover, current light use efficiency is approximately 30% of the theoretical value [6]. As a result, the commercial use of plant factories for leafy vegetable production is limited.
The optimal control of environmental variables can significantly improve the growth of indoor lettuce plants as well as the efficiency of lighting use [5,7]. Light environment, CO2 concentration and air speed are the most important factors that directly influence the growth and development rates of lettuce plants grown under artificial light [8,9,10,11]. The light environment is crucial for plant growth because it provides the energy and signals needed for photosynthesis [12,13]. To improve plant growth and light use efficiency by regulating the light environment, light-emitting diodes (LEDs) were gradually used for indoor plant production. This type of artificial lighting systems is distinguished by its high performance, low power consumption, a wide range of wavelengths and low thermal radiation emissions [5]. Among the wide spectrum of light provided by LEDs, red and blue wavelengths are the most effective combination for indoor plant growth, including lettuce [14,15,16]. Many studies found that the combination of red and blue LEDs effectively promotes the growth and light use efficiency of lettuce plants grown under artificial light [17,18]. The ratio between 5–20% blue light was reported to be the optimal ratio for growth improvement, light use efficiency, photosynthetic and transpiration rates of lettuce plants produced in plant factories [7,19,20]. A photoperiod of 16–20 h d−1 was reported by Lee and Kim [10] and Ahmed et al. [7] as an optimal duration for high yield and low electric-energy consumption in plant factories. According to Sago [21], increasing the illuminating intensity from 150 to 300 μmol m−2 s−1 increased the fresh and dry weights of the shoot, relative growth rate, and leaf number of butterhead lettuce plants grown in a plant factory. Kang et al. [22] found that an illumination intensity of 290 μmol m−2 s−1 resulted in the tallest plant height, and the highest fresh and dry weights of lettuce shoots. Despite the positive results of previous studies to improve plant growth and quality by regulating the light environment, high electricity consumption and low light use efficiency remain a challenge in plant factories. The optimal control of CO2 concentration and air speed should therefore be taken into account in the improvement of plant growth and light use efficiency.
Light environment interacts significantly with air speed, in particular, their combined effect on photosynthesis and transpiration, as well as stomatal conductance [7,23,24]. Photosynthetic and transpiration rates increase with the increase in air speed [25,26,27]. During photosynthesis and transpiration, the transport of CO2 and H2O through the leaf boundary layer is dramatically influenced by air speed [24,28]. Air speed increases plant growth by facilitating the transport of water and nutrients to plant leaves during transpiration [24,29,30]. To date, air speed ranges between 0.5 and 0.7 m s−1 have been identified as an optimum range for the growth of many leafy vegetables produced in indoor cultivation systems [7,30]. The relationship between air speed and plant growth, on the other hand, is not always linear and tends to a maximum or optimum level [31], which, in turn, confirms the importance of determining the optimal air speed under different levels of illumination intensity and CO2 concentration.
CO2 concentration interacts significantly with the light environment [32] and air speed [28], particularly their combined effects on plant growth and gas exchange rates. The stomatal opening is stimulated by high levels of illumination and low levels of CO2 concentration. As a result, photosynthesis rates increase. Conversely, even at a high illumination intensity, high levels of CO2 concentration cause stomatal closure [23]. Additionally, optimal air speed can improve the distribution of CO2 concentration in the plant canopy and reduce leaf boundary layer resistance [33], resulting in an increase in the canopy photosynthetic rate [7,34].
Many previous studies focused on the impact of the light environment on the growth of indoor plants. However, plant growth in indoor cultivation systems is the result of the interaction of many environmental factors. The interaction between CO2 concentration, illumination intensity and air speed is one of the most influential interactions affecting plant growth. Thus, the determination and quantification of these interactions and their effect sizes provide a valuable insight into improving the growth and light use efficiency of lettuce plants produced in plant factories. Therefore, the integrative effects of CO2 concentration, illumination intensity and air speed on lettuce growth, gas exchange and light use efficiency are investigated in this study. The main objective is to quantify the optimal level of the main environmental factors and to evaluate the combined effects of various combinations of CO2 concentration, illumination intensity and air speed on the growth, gas exchange and light use efficiency of lettuce plants grown under artificial light. The size of the significant effect of each variable, their interactions and their correlations with lettuce growth, gas exchange and light use efficiency are determined.

2. Materials and Methods

2.1. Experimental Treatments and Setup

The experiments were performed in a plant factory (4 × 2.2 × 2.5 m) with artificial lighting, at the Institute of Environment and Sustainable Development in Agriculture, CAAS, Beijing, China. The plant factory has four basic modules (1.5 × 0.7 × 2.4 m), each with three layers (culture beds). Each culture bed has a light-emitting diode (LED) panel that can be moved vertically (Dongguan Bio-lighting Sciences and Technology Co., Ltd., Beijing, China). The air temperature and relative humidity inside the plant factory were controlled by a heat pump with a cooling capacity of 14 kW (HFW-75-2, Beijing Zhongke Shiheng Technology Co., Ltd., Beijing, China) [35].
A total of 27 treatments were designed under different combined levels of CO2 concentration of 500, 1000 and 1500 μmol mol−1, an illumination intensity of 100, 200 and 300 μmol m−2 s−1 and air speed of 0.25, 0.50 and 0.75 m s−1. CO2 was supplied using a CO2 gas cylinder. An infrared CO2 controller (ZFP, Fuji Electric Co. Ltd., Tokyo, Japan) was used to monitor the CO2 level. Red and blue LEDs with maximum wavelengths of 660 nm and 450 nm, respectively, were used as light sources. A DC power supply (PKU-MS605D, Dongguan Bio-lighting Sciences and Technology Co. Ltd., Beijing, China) was used to adjust the illumination intensity, with a lighting ratio of 4:1 for the red and blue lights, respectively. Airflow was supplied using a multi-fan system consisting of seven small fans (AUB0912VH, Delta Electronics, INC, Bangkok, Thailand) to generate the airflow from two opposite horizontal directions [36]. The air speed was adjusted by controlling the operating capacity of the multi-fan system at 20%, 40% and 60% to achieve air speeds of 0.25 ± 0.10, 0.50 ± 0.15 and 0.75 ± 0.21 m s−1, respectively. The air speed was calculated as the average of 14 points measured along the length and width of each cultural layer [35].

2.2. Plant Materials and Growing Environment

Lettuce seeds (Lactuca sativa cv. ‘Tiberius’) were germinated in sponge cubes and incubated for 2 days in a growth chamber (GLED250PY; Beijing Luxi Technology Co., Ltd., Beijing, China) in the dark at 20 °C. Seedlings on the third day were transferred to the plant factory and fluorescent lamps (TL-D56W, Osram, Guangzhou, China) with an illumination intensity of 150 µmol m−2 s−1 were used as a light source (photoperiod of 16 h d−1). Uniform-sized seedlings on day 15 were transplanted on a floating Styrofoam board with a spacing distance of 0.12 m and a planting density of 32 plants/m2. An air temperature of 24 ± 0.5 °C, relative humidity in the range of 60–70%, and a photoperiod of 16 h d−1 were maintained for the entire experimental period of 21 days. Yamasaki nutrition solution (EC of 1.1 dS m−1 and pH of 5.8) was applied for the plant growth. The circulation system was set to run automatically for one hour per day [35].

2.3. Experimental Measurements

2.3.1. Plant Measurements

Fresh and dry weights of shoots and roots, total leaf area, number of leaves per plant and plant height were measured on day 21 after transplantation. The fresh weights of shoots and roots were measured using an electronic scale (Si-234; Denver Instrument, New York, NY, USA). Shoots and roots were dried in an oven (VS-120203; Vision Scientific, Daejeon, Korea) at 80 °C for 72 h, and the dry weights were also measured. The leaf area was measured using a leaf area meter (LI-3100C, Li-Cor Inc., Lincoln, NE, USA) [35].

2.3.2. Gas Exchange Measurements

The photosynthetic rate, transpiration rate and stomatal conductance were measured on day 21 after transplantation using a portable infrared gas analyzer equipped with a leaf cuvette fluorometer (LI-6400, LI-COR, Lincoln, NE, USA). Five plants were chosen at random for each treatment and measurements were taken on fully expanded and mature leaves. The CO2 concentration, illumination intensity and air speed inside the leaf cuvette were all kept at the same levels as in the experimental treatments. The air temperature and relative humidity were set to 24 °C and 70%, respectively. The vapor pressure deficit was kept under 1 kPa. After 10 min, when the stomatal conductance and photosynthetic rate had reached a steady state, the measurements were taken [35].

2.4. Light Use Efficiency

Light use efficiency (LUE) is the ratio of chemical energy accumulated in the plant to light energy received by the plant canopy. The LUE was calculated using the equation reported by Kozai [37] as follows:
L U E = D × S × f × D W W
where D is the planting density (32 plants/m2), S is the planting area (1 m2), f is a conversion coefficient between the dry weight and chemical energy (20 kJ g−1), DW is the average value of the dry weight of the shoots and roots (g) and W is the light energy received by the plant canopy (J m−2).

2.5. Statistical Analysis

The SPSS 11.0 statistics software (SPSS Inc., Chicago, IL, USA) was used to analyze the data. Mean separation was performed using LSD’s multi-range test with p ≤ 0.05. The correlation between the independent variables (CO2 concentration, illumination intensity and air speed) and dependent variables (lettuce growth, gas exchange and light use efficiency) was described using Pearson’s correlation coefficient test. The effect size of each independent variable and their interactions (two- and three-way interactions) were described using effect size test. The effect sizes were expressed as follows: trivial-effect size for values less than 10%, small-effect size for values from 10% to 30%, medium-effect size for values from 30% to 50%, and large-effect size for values greater than 50% [35,38].

3. Results

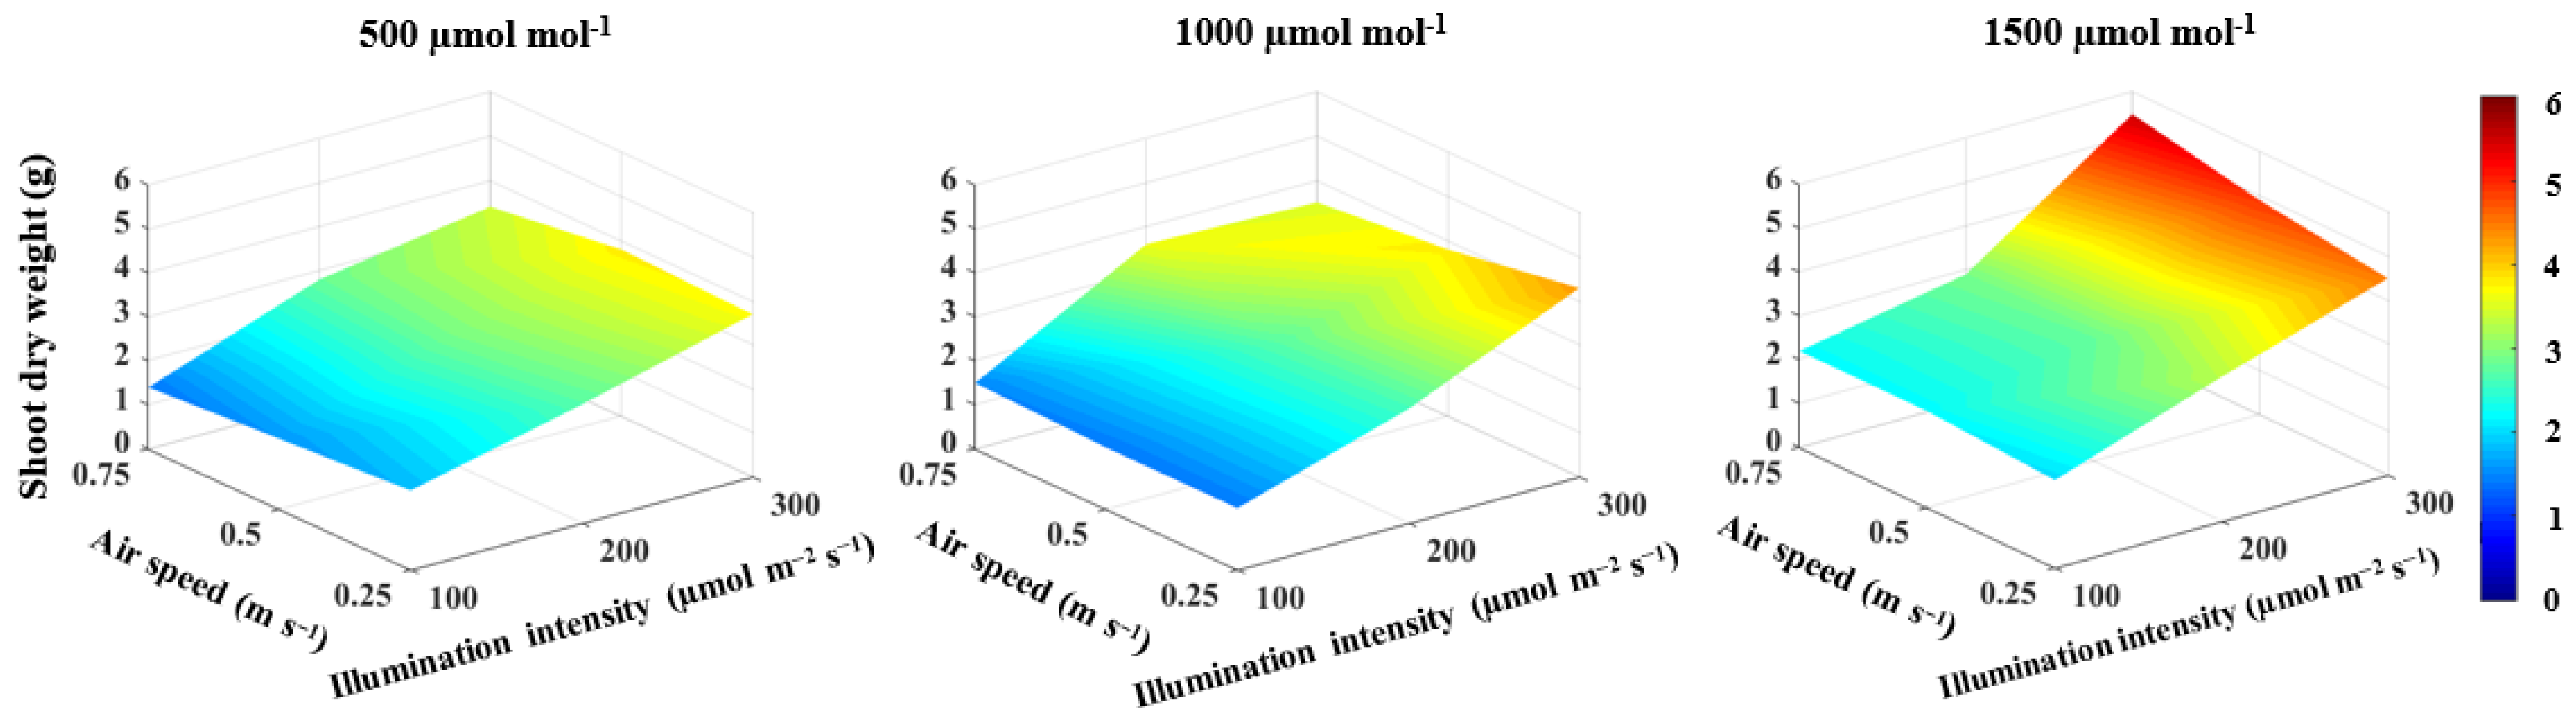
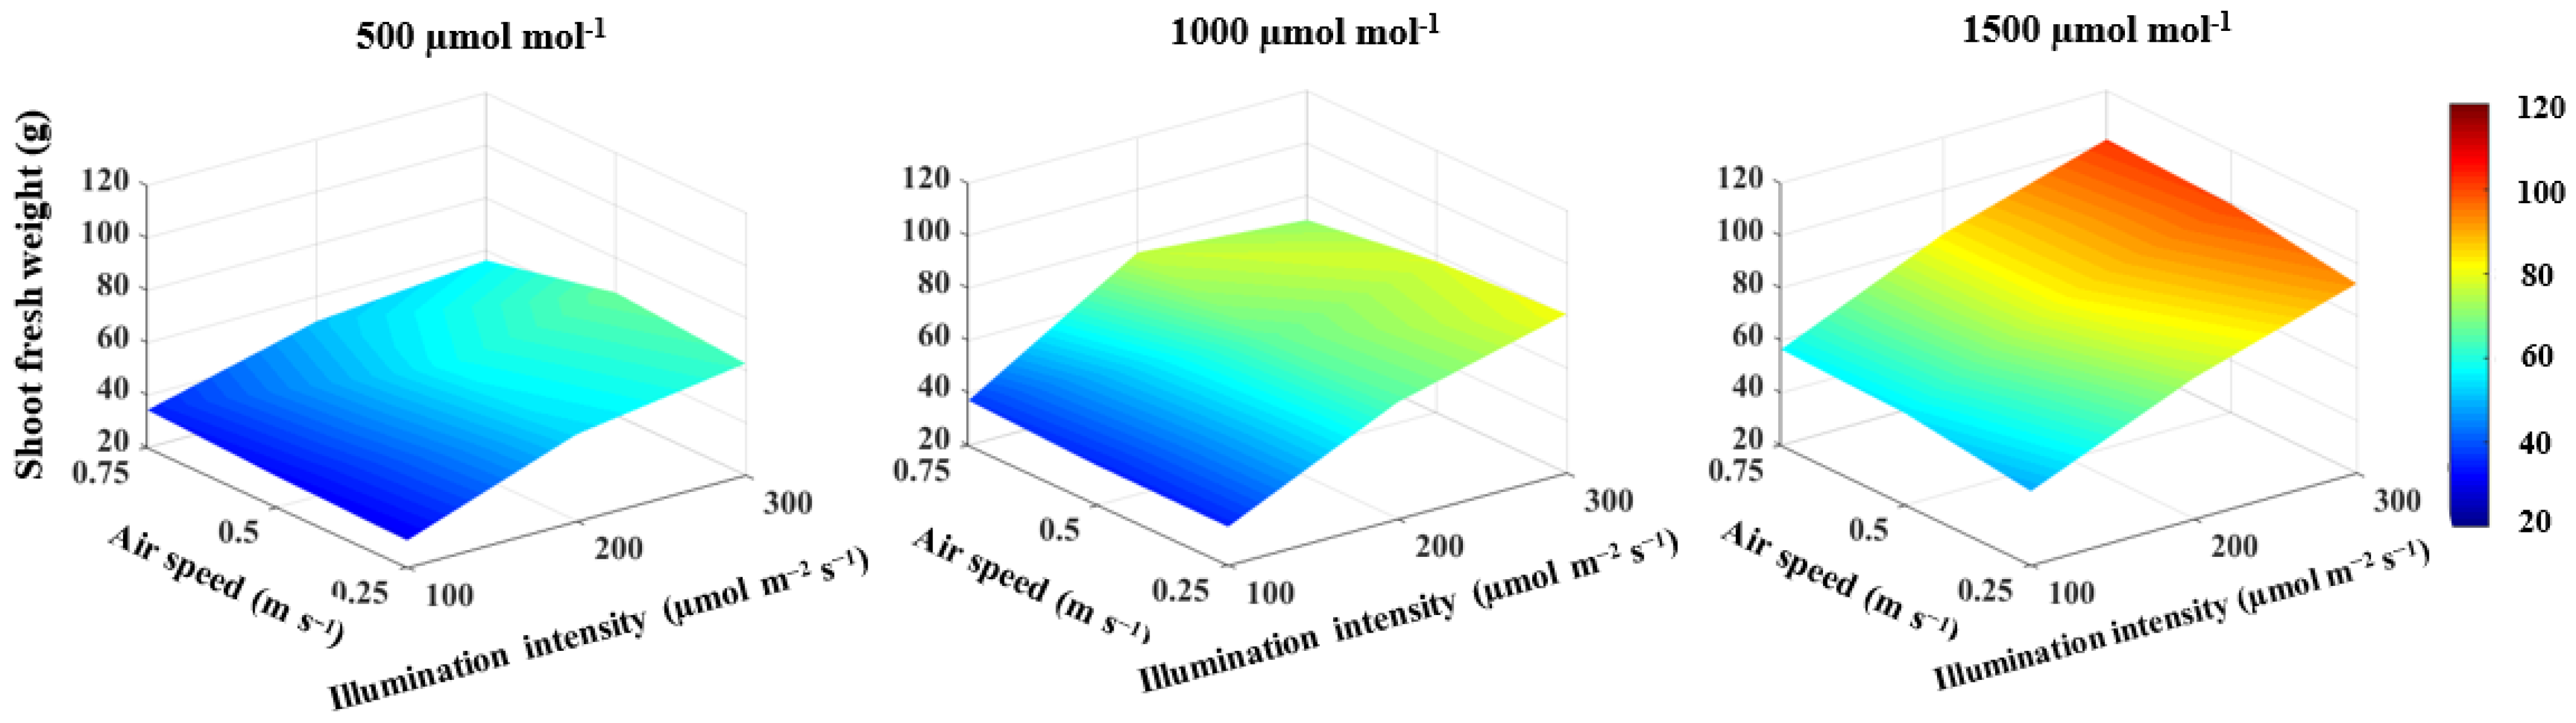
3.1. Lettuce Shoot Growth

As shown in Table 1, the growth of lettuce shoot is closely related to the CO2 concentration and illumination intensity. Shoot fresh weight, shoot dry weight, total leaf area and number of leaves were all positively correlated and significantly influenced by CO2 concentration and illumination intensity (Table 1).
With an increase in CO2 concentration from 500 to 1500 μmol mol−1, the shoot fresh weight, shoot dry weight, total leaf area and the number of leaves increased by 36.2% (Figure 1), 20.1% (Figure 2), 31.6% and 22.5% (Table 2), respectively, and by 48.9% (Figure 1), 58.6% (Figure 2), 32.8% and 14.7% (Table 2), respectively, as illumination intensity increased from 100 to 300 μmol m−2 s−1. The plant height increased with increasing CO2 concentration and the correlation had a positive coefficient (Table 1). The increase in illumination intensity, on the other hand, was accompanied by a decrease in plant height. However, an increase in illumination intensity had a small effect size of 22% on decreasing plant height and their correlation was not significant (Table 1). The non-significant correlation between the lettuce shoot growth and air speed demonstrated that there was no direct effect of air speed on lettuce shoot growth (Table 1). In general, regardless of the air speed, the highest shoot fresh weight of 101.8 g/plant (Figure 1), shoot dry weight of 5.5 g/plant (Figure 2), total leaf area of 1430.3 cm2 and number of leaves of 27 leaf/plant (Table 2) were observed under a CO2 concentration of 1500 μmol mol−1 and an illumination intensity of 300 μmol m−2 s−1.
CO2 concentration and illumination intensity had a significant two-way interaction effect on the lettuce shoot growth, with larger effect sizes of 34% and 32% on shoot fresh and dry weights, respectively (Table 3). Furthermore, there was a three-way interaction with effect sizes of 18% and 31% on the shoot fresh and dry weights, respectively (Table 3).

3.2. Lettuce Root Growth

The fresh and dry weights of lettuce roots were positively correlated with and significantly affected by CO2 concentration and illumination intensity, with a larger effect size of illumination intensity (Table 1). Although CO2 concentration and illumination intensity had a significant effect on the root length, their correlations with root length were not significant (Table 1). There was no direct effect of air speed on the fresh and dry weights of lettuce roots. However, an increased air speed was accompanied by an increase in root length, with a 20% effect size (Table 1). The fresh and dry weights of lettuce roots increased by 32.0 and 11.9%, respectively, in response to an increase in CO2 concentration from 500 to 1500 μmol mol−1 and by 62.0 and 61.2%, respectively, in response to an increase in illumination intensity from 100 to 300 mol m−2 s−1 (Table 4).
A significant 2-way interaction was found between the CO2 concentration and illumination intensity on lettuce root fresh weight and length, with effect sizes of 24% and 21%, respectively (Table 3). Air speed, on the other hand, interacted significantly with CO2 concentration on the root length, with an effect size of 22%, and with illumination intensity on the root fresh weight and root length, with effect sizes of 16% and 14%, respectively (Table 3). Furthermore, there was a 3-way interaction with effect sizes of 19% and 32% on the root fresh weight and root length, respectively (Table 3). According to the results, the highest root fresh weight of 8.5 g/plant, root dry weight of 0.41 g/plant and root length of 19.6 cm were observed under a CO2 concentration of 1500 μmol mol−1, an illumination intensity of 300 μmol m−2 s−1 and an air speed of 0.75 m s−1 (Table 4).

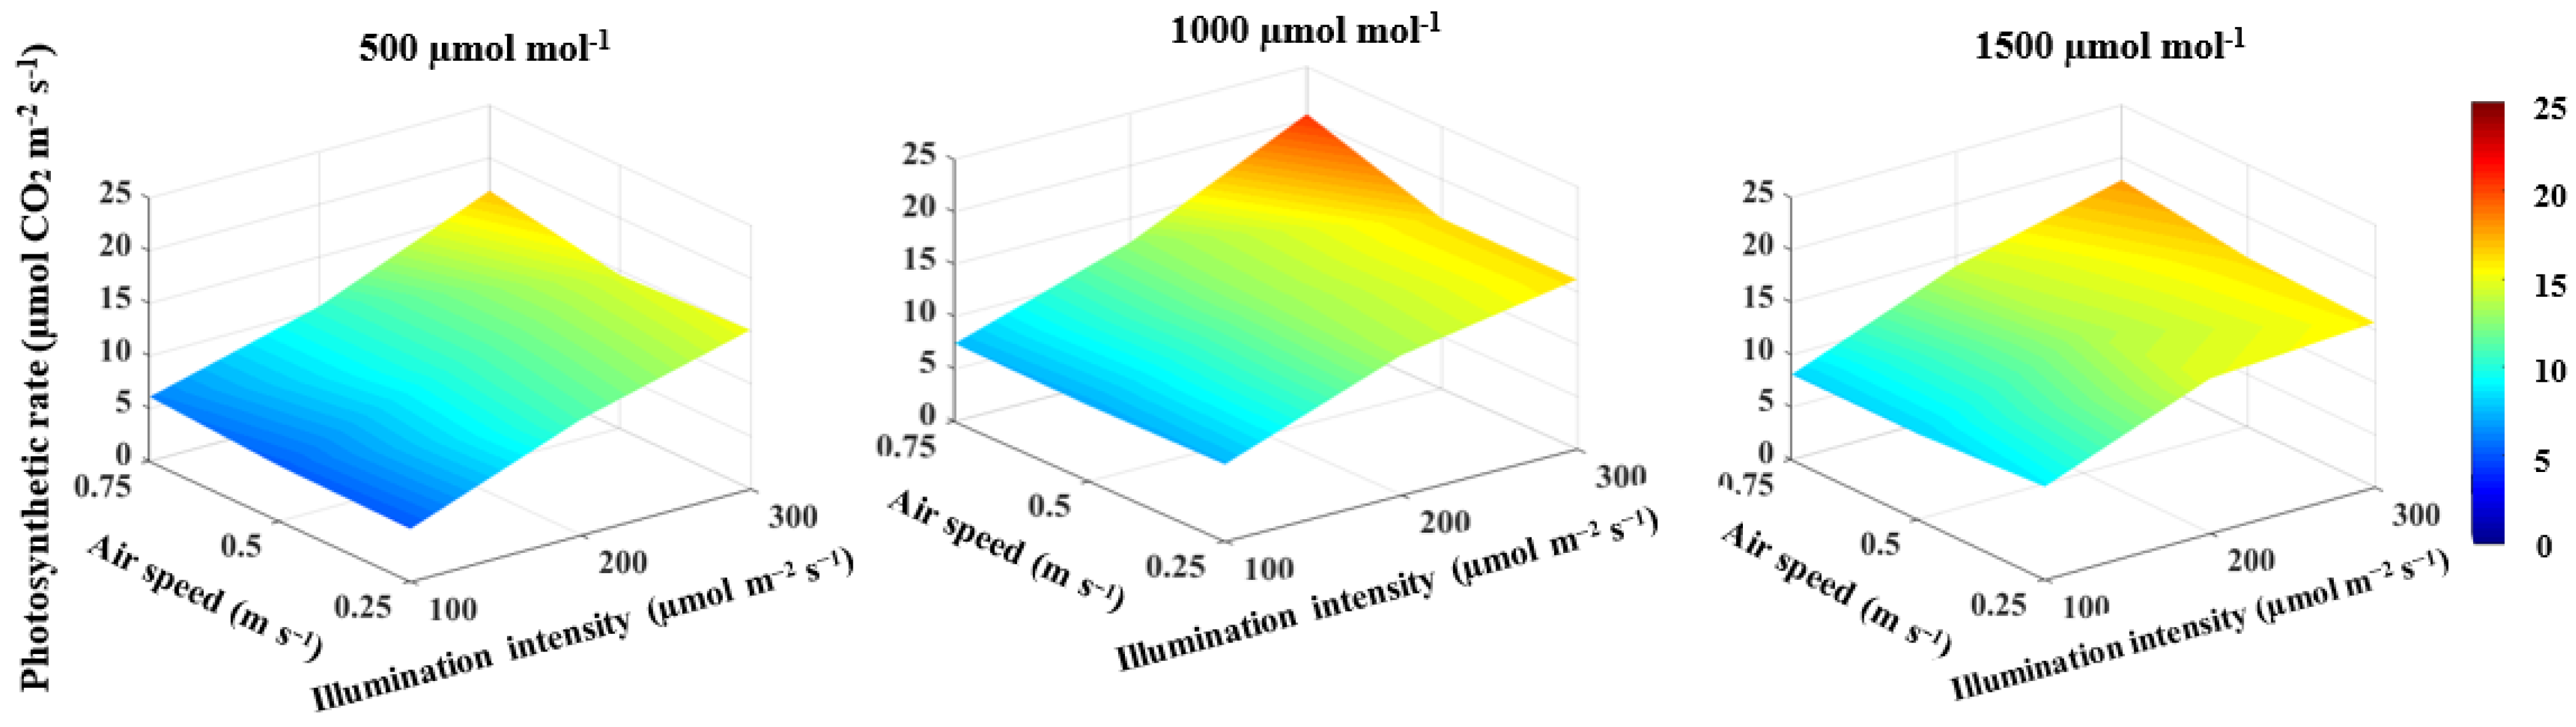
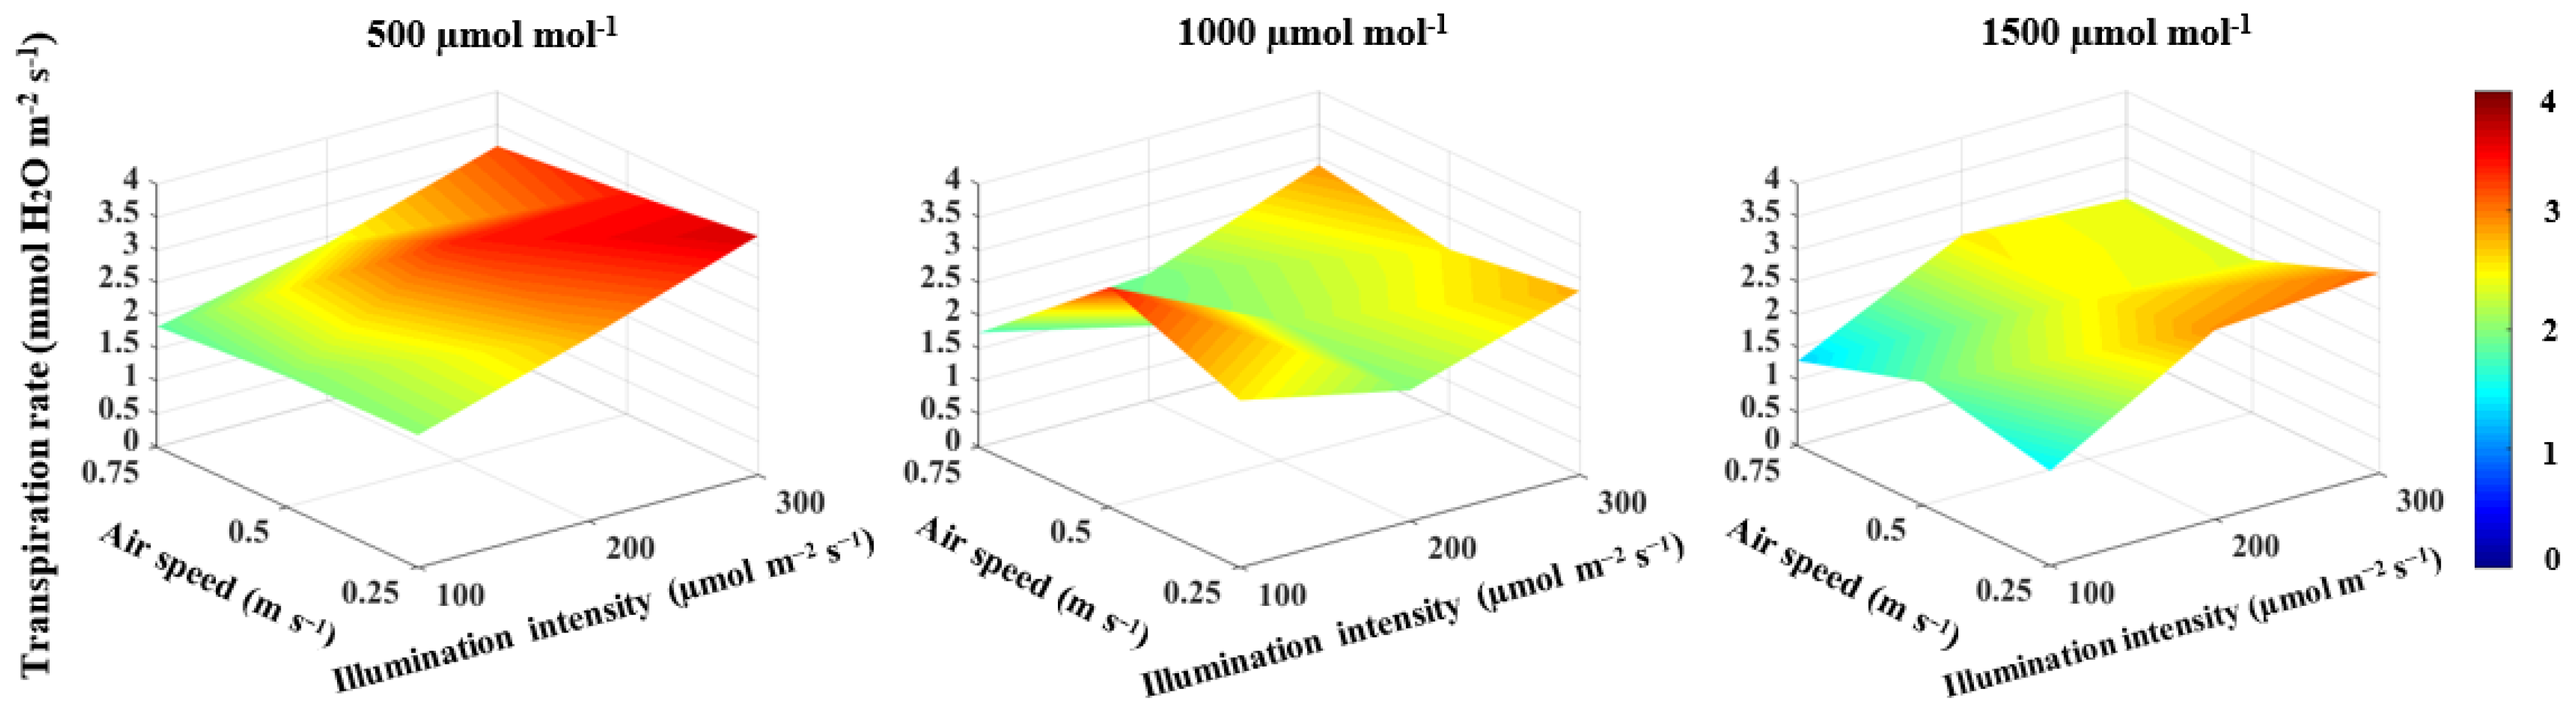
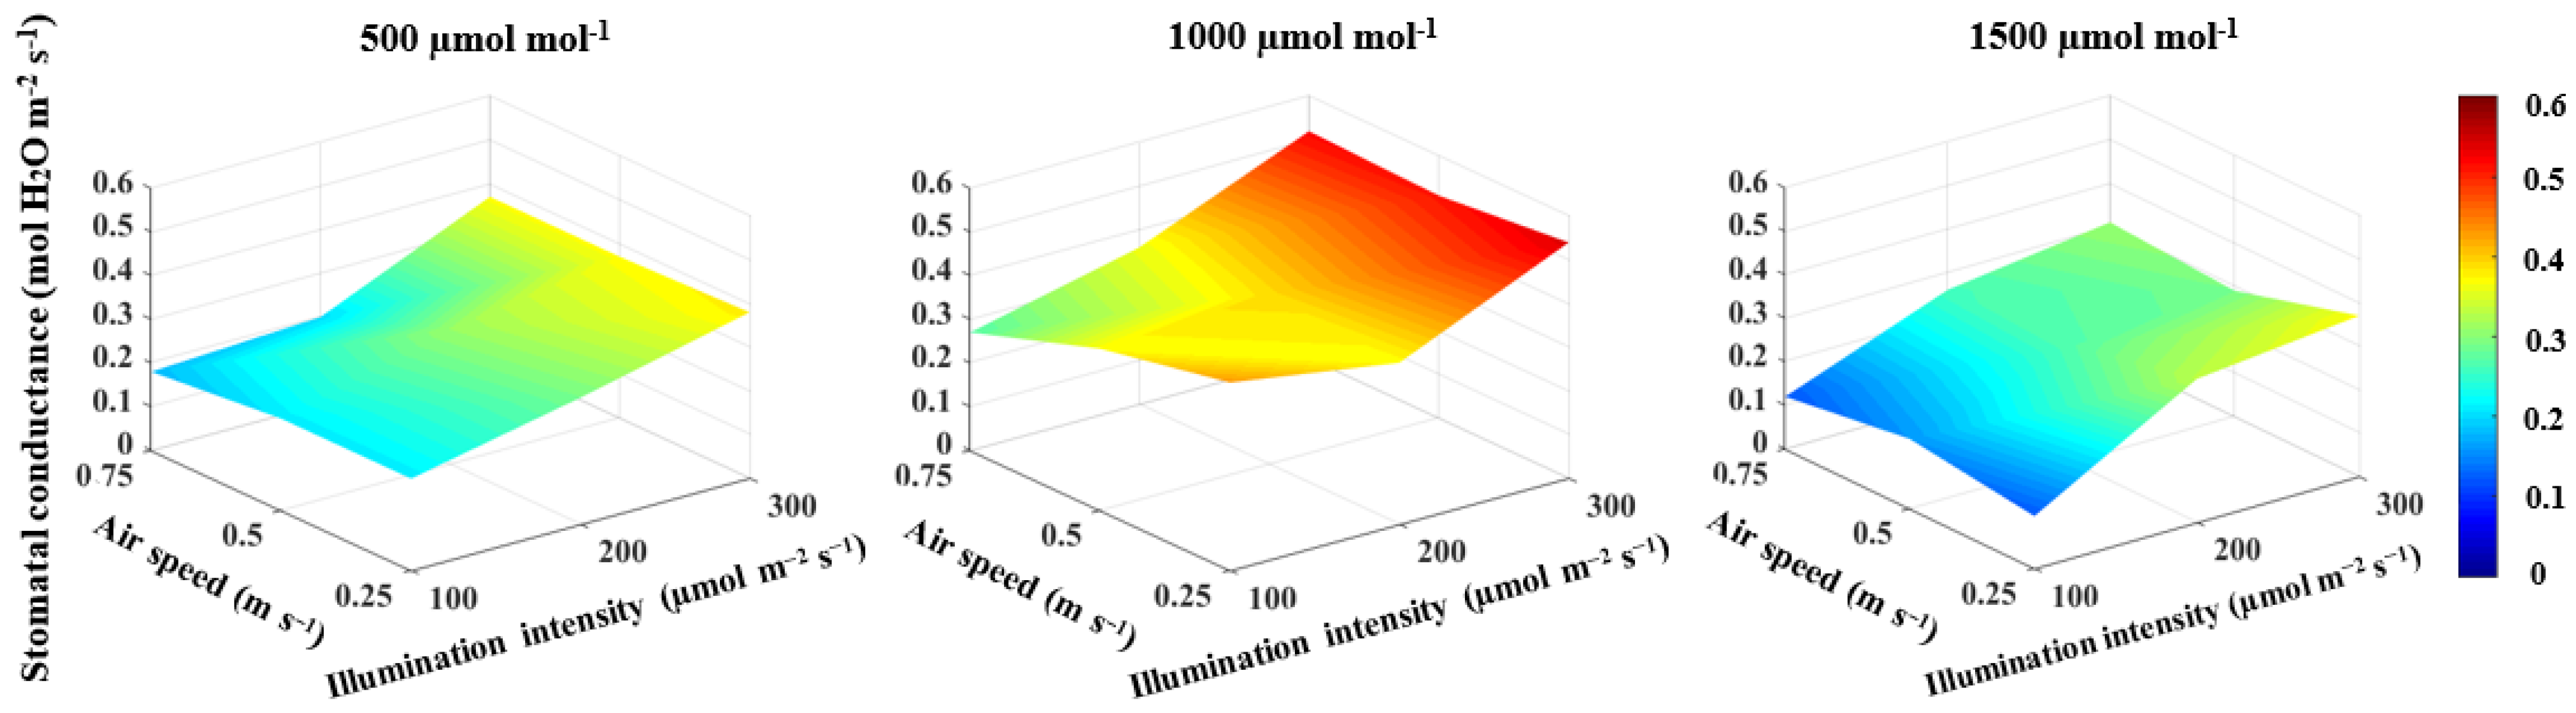
3.3. Photosynthesis, Transpiration and Stomatal Conductance

CO2 concentration, illumination intensity and air speed all had positive correlations and large effect sizes on the photosynthetic rate (Table 1). The photosynthetic rate increased by 19.3% when the CO2 concentration increased from 500 to 1000 μmol mol−1, 58.5% when illumination intensity increased from 100 to 300 μmol m−2 s−1 and by 8.5% when the air speed increased from 0.25 to 0.75 m s−1 (Figure 3). The highest photosynthetic rate of 20.6 μmol CO2 m−2 s−1 was found with a CO2 concentration of 1000 μmol mol−1, an illumination intensity of 300 μmol m−2 s−1 and an air speed of 0.75 m s−1 (Figure 3).
The correlation between the illumination intensity and transpiration rate and between illumination intensity and stomatal conductance was found to be positive (Table 1). Furthermore, the illumination intensity had a large effect size on both the transpiration rate and stomatal conductance (Table 1). The increase in illumination intensity from 100 to 300 μmol m−2 s−1 increased the transpiration rate and stomatal conductance by 34.9% (Figure 4) and 42.1% (Figure 5), respectively. The transpiration rate and stomatal conductance were negatively correlated with CO2 concentration and air speed (Table 1). The transpiration rate decreased by 17.5% when CO2 concentration increased from 500 to 1500 μmol mol−1 and by 12.8% when the air speed increased from 0.25 to 0.75 m s−1 (Figure 4). In general, the highest transpiration rate of 3.6 μmol H2O m−2 s−1 was observed at a CO2 concentration of 500 μmol mol−1, an illumination intensity of 300 μmol m−2 s−1 and an air speed of 0.25 m s−1 (Figure 4). Stomatal conductance increased by 33.5% when CO2 concentration increased from 500 to 1000 μmol mol−1, then decreased by 41.4% when CO2 concentration increased from 1000 to 1500 μmol mol−1 (Figure 5). An increased air speed from 0.25 to 0.75 m s−1 reduced the stomatal conductance by 15.3% (Figure 5). In comparison to the effect of CO2 concentration, increasing air speed had a small effect size on reducing stomatal conductance (Table 1). The highest stomatal conductance of 0.54 mol H2O m−2 s−1 was found at a CO2 concentration of 1000 μmol mol−1, an illumination intensity of 300 μmol m−2 s−1 and an air speed of 0.25 m s−1 (Figure 5). All two-way interactions were significant (Table 3). The most influential interactions were found in the photosynthetic rate. The effect size of the interaction between CO2 concentration and illumination intensity was 52%, while the effect size of the interaction between the illumination intensity and air speed was 67% (Table 3). Furthermore, there was a 3-way interaction on the photosynthetic rate, transpiration rate and stomatal conductance, with effect sizes of 51%, 26% and 13%, respectively (Table 3).

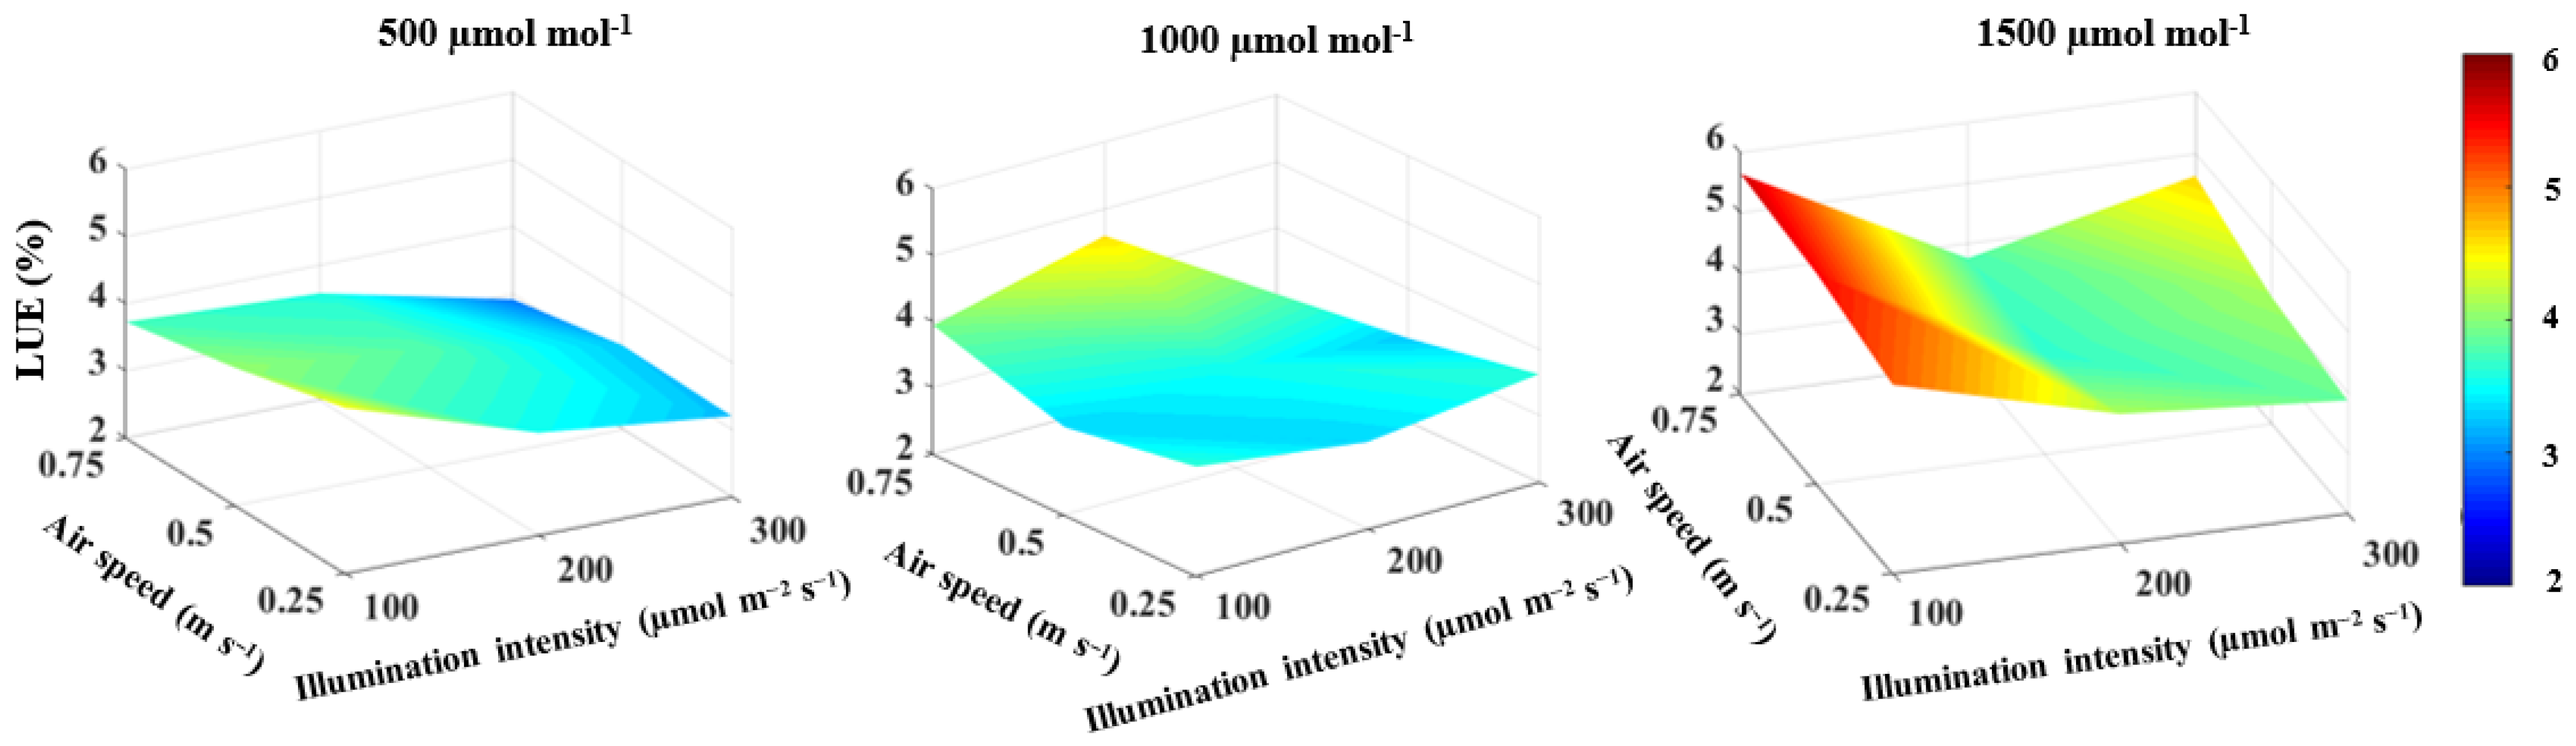
3.4. Light Use Efficiency

Light use efficiency was found to be significantly related to CO2 concentration and illumination intensity (Table 1). Light use efficiency increased by 19.6% with increasing CO2 concentrations from 500 to 1500 µmol mol−1, while it decreased by 19.1% with increasing illumination intensity from 100 to 300 µmol m−2 s−1 (Figure 6). There was no significant effect of air speed on the light use efficiency (Table 1).
A significant interaction between CO2 concentration and illumination intensity on light use efficiency was found, with an effect size of 41% (Table 3). Additionally, there was a significant 3-way interaction with an effect size of 29% (Table 3). The highest light use efficiency of 5.6% was observed under a CO2 concentration of 1500 μmol mol−1, an illumination intensity of 100 µmol m−2 s−1 and an air speed of 0.75 m s−1 (Figure 6).

4. Discussion

4.1. The Effects of CO2 Concentration, Illumination Intensity and Air Speed on Lettuce Growth

Plant growth is the result of the interaction of various environmental factors. In an indoor cultivation system, the most important factors that directly influence plant growth and development are CO2 concentration, light environment and air speed [7]. CO2 is a necessary raw material for photosynthesis and has an impact on many physiological processes associated with plant growth [39,40]. Light is the only source of energy and signals needed for photosynthesis [12]. During photosynthesis and transpiration, air speed provides a mechanism for the transport of CO2 and H2O through the leaf’s boundary layer [25,36].
Our results show that CO2 concentration and illumination intensity have a significant effect on the growth of lettuce plants (Table 1). The increased growth of lettuce plants in response to increasing CO2 concentration and illumination intensity can be attributed to the critical roles of both variables in photosynthesis improvement [41,42]. Many previous studies discussed the positive effects of CO2 concentration and illumination intensity on the growth and productivity of lettuce plants grown under artificial light [2,4,43,44,45,46]. Illumination intensity is the most important factor in regulating plant biosynthesis as it plays an important role in the photochemical reaction that converts CO2 into carbohydrates [13]. Carbohydrates are the most easily available form of energy in plants because hormone metabolism depends on the supply of carbohydrates. High carbohydrate production may result in higher hormone concentrations, which may improve plant growth [47]. Our results agree with those of Chang et al. [48] and Sago [21], who found that an illumination intensity of 300 µmol m−2 s−1 increased the growth of lettuce plants grown under artificial lighting. Furthermore, it is widely known that CO2 enrichment stimulates the growth and productivity of lettuce plants [32]. Zhang et al. [49] found that increasing CO2 concentration to 1000 μmol mol−1 increased the production of Italian lettuce by 21%.
While there was a significant effect of air speed on lettuce growth (Table 1), it was small in size and all of the correlations between air speed and lettuce growth were not significant (Table 1). This result indicates that air speed has an indirect effect on lettuce growth. The effect of air speed on lettuce shoot growth was found to be related to CO2 concentration. Under a CO2 concentration of 500 μmol mol−1 and illumination intensities of 200 and 300 μmol m−2 s−1, the shoot fresh weight decreased as air speed increased to 0.75 m s−1 (Figure 1). This result can be explained by the fact that as the air speed increases, the CO2 concentration in the leaf boundary layer decreases [7]. A similar effect was observed with a CO2 concentration of 1000 μmol mol−1 and an illumination intensity of 300 μmol m−2 s−1. (Figure 1). In this case, the decrease in lettuce fresh weight is attributed to the negative effect of high illumination intensity and high air speed on lettuce seedlings’ growth during the first week. Therefore, high illumination intensity and high air speed are not recommended for lettuce seedling growth during the first days of transplant. Chen [50] reported that high air speed reduced lettuce yields and resulted in smaller plants with fewer leaves. Therefore, the air speed should be gradually increased as the growth rate of lettuce increases. During the first week of growth, an air speed of 0.25 m s−1 was found to be sufficient for lettuce seedlings, and 0.75 m s−1 has been reported as a sufficient rate for improving air movement within the canopy of fully grown lettuce plants [29,30,36].
In terms of two-way interactions (Table 3), the most influential interactions were observed between CO2 concentration and illumination intensity (Table 3). Both CO2 concentration and illumination intensity are important in photo assimilation, which improves carbohydrate production and the growth of lettuce plants [47]. Lee and Park [41] also found that the growth and productivity of lettuce plants grown in a plant factory increased as the illumination intensity and CO2 concentration increased. The significant interaction between CO2 concentration and air speed can be explained by the low resistance in the leaf boundary layer caused by increased air speed over the lettuce canopy, which facilitated CO2 transport into the stomatal cavity during photosynthesis [25,51]. On the other hand, the significant interaction between illumination intensity and air speed can be explained by the two variables directly affecting the conductance of heat and water transfer through the leaf boundary layer [36]. The significant three-way interaction on the shoot fresh and dry weights confirms the critical role of CO2 concentration, illumination intensity, and air speed in the heat and gas exchange processes of lettuce plants with their surroundings.
The root system substantially influences plant growth and improves water and nutrient uptake from the growing media [7,15]. Our results reveal that the growth of lettuce roots is significantly affected by CO2 concentration and illumination intensity (Table 1) as well as their interactions (Table 3). However, the effect size of illumination intensity is found to be higher than that of CO2 concentration (Table 1). Illumination intensity may, therefore, be the most effective factor in the growth and development of lettuce roots. The dominant effect of light environment on the development of lettuce roots was discussed by Lin et al. [15]. In their study, the normal shape and dense morphology of lettuce plant roots treated with red, blue and white LEDs were found. Johkan et al. [52] reported that the highest root dry weight was observed under an illumination intensity of 300 µmol m−2 s−1. Additionally, Yue et al. [47] investigated the effect of CO2 enrichment on the root development of tomato seedlings grown under artificial lighting. The results show that increasing the CO2 concentration to 800 μmol mol−1 increases the root fresh and dry weights, total root length, root surface area, root-tip numbers and root diameter, all of which are conducive to the formation of a strong root system. The results obtained in this study are also consistent with those obtained by Park et al. [32] who found that the fresh and dry weights, as well as the length of the roots of lettuce plants grown under red, blue and white LEDs with an illumination intensity of 140 µmol m−2 s−1, increased as the CO2 concentration increased from 350 to 1000 µmol mol−1. In this study, lettuce growth showed similar responses in some treatments due to the interaction of CO2 concentration, illumination intensity and air speed. As a result, more research into the economic costs of lettuce production under various environmental factors is needed.

4.2. The Effects of CO2 Concentration, Illumination Intensity and Air Speed on Lettuce Gas Exchange

The interactive control of CO2 concentration, illumination intensity and air speed had a significant effect on lettuce gas exchange (Table 1). Our results show that increasing the intensity of illumination is associated with an increase in photosynthetic rate, transpiration rate and stomatal conductance. The red and blue light emitting diodes used as a light source in this study are effective in promoting photosynthesis by increasing chlorophyll absorption [3,15,16,53]. Furthermore, among the various factors influencing stomatal conductance, the light environment is the most influential [3,18,23]. Illumination intensity affects stomatal conductance by increasing proton driving force [53] and the development of stomata is related to illumination intensity [54].
Many studies have also shown that CO2 concentration is a limiting factor for photosynthesis and growth in many indoor cultured crops [34,39,46]. According to Park et al. [32], the photosynthetic rate increased significantly as CO2 concentration increased. The negative correlation between CO2 concentration and transpiration rate (Table 1) indicates that as CO2 concentration increases, transpiration rate decreases. This finding can be attributed to an increase in CO2 concentration, which causes a decrease in stomatal conductance (Figure 5). Yasutake et al. [55] found that an increase in CO2 significantly increased the rate of photosynthesis, whereas the rate of transpiration and stomatal conductance decreased.
Manipulating air speed in indoor cultivation systems is essential to improve CO2 and H2O transport through the boundary layer of the leaf. According to the results, increasing air speed is associated with increased photosynthesis (Table 1). This result can be explained by an increase in the diffusion of CO2 through the leaf boundary layer as the air speed increases [27]. Conversely, both transpiration rate and stomatal conductance were negatively correlated with air speed. However, air speed in the range of 0.25–0.75 m s−1 had a small effect size in reducing transpiration and stomatal conductance (Table 1). Kitaya [56] found that at a low air speed, the reduction in transpiration rate was greater than the reduction in photosynthetic rate. Kitaya et al. [25], Yabuki [26] and Ahmed et al. [36] also reported that air speed in the range between 0 and 0.8 m s−1 showed a limited effect on reducing stomatal conductance.
All two-way interaction effects on photosynthesis, transpiration and stomatal conductance were significant (Table 3). Under constant illumination intensity, an increase in CO2 concentration was accompanied by an increase in photosynthetic rate and a decrease in transpiration rate and stomatal conductance. High illumination intensity and low CO2 concentration induce stomatal opening, while high illumination intensity and high CO2 concentration induce stomatal closure [23]. However, increasing CO2 concentration from 1000 to 1500 μmol mol−1 resulted in a decrease in transpiration rate (Figure 4) and stomatal conductance (Figure 5), whereas increasing CO2 concentration from 500 to 1000 μmol mol−1 increased the photosynthetic rate, transpiration rate and stomatal conductance. This result is consistent with that of Park et al. [32], who found that photosynthesis, transpiration and stomatal conductance significantly increased as the CO2 concentration increased from 350 to 1000 µmol mol−1.
The interaction between illumination intensity and air speed had a large effect on photosynthesis, but a small effect on transpiration and stomatal conductance (Table 3). Under constant illumination intensity, increased photosynthesis and decreased stomatal conductance were accompanied by increased air speed. Accordingly, stomatal conductance does not control the photosynthetic rate of lettuce plants, except when the resistance in the boundary layer is very high [27]. Additionally, the small effect size of the interaction between illumination intensity and air speed on transpiration and stomatal conductance indicates that illumination intensity was the most influential factor [54].
The results in Table 3 also show a significant interaction between air speed and CO2 concentration in photosynthesis, but the effect size is small. These findings indicate that the low resistance in the boundary layer caused by increased air speed over the lettuce canopy improves CO2 transport during photosynthesis. The findings reported above are also consistent with those reported by Kitaya et al. [25], who investigated the effect of air speed ranging from 0.1 to 0.8 m s−1 and CO2 concentrations ranging from 400 to 800 μmol mol−1 on the photosynthetic rate of tomato transplants. The results showed that the photosynthetic rate was 1.2 times higher at a CO2 concentration of 800 μmol mol−1 than at a concentration of 400 μmol mol−1. In contrast, the photosynthetic rate was 1.3 times higher when the air speed was 0.4 m s−1 than when the air speed was 0.1 m s−1.
In terms of three-way interactions, the results in Table 3 show a significant interaction effect on photosynthesis, transpiration and stomatal conductance. These interactions confirm that the integrative effects of CO2 concentration, illumination intensity and air speed have a significant impact on the gas exchange of lettuce plants grown under artificial lighting.

4.3. The Effects of CO2 Concentration, Illumination Intensity and Air Speed on Lettuce Light Use Efficiency

Light use efficiency is an important factor in evaluating the performance of lighting systems [10]. The cost of electrical energy consumed by artificial lighting is one of the main challenges that limit the usage of indoor cultivation systems in the commercial production of leafy vegetables [6]. Previous studies focused on the effect of the lighting environment on light use efficiency [2,4,44,57]. However, little attention has been paid to the integrative effect of CO2 concentration, illumination intensity and air speed on light use efficiency. The results show that light use efficiency is strongly affected by and positively correlated with CO2 concentration (Table 1). This finding could be explained by an increase in the dry weight of lettuce plants as the CO2 concentration increased. Light use efficiency, on the other hand, was negatively related to illumination intensity (Figure 6), indicating that high consumption of electrical energy reduces light use efficiency in plants. These results are consistent with those reported by Zhang et al. [2]. Generally, the various combinations of CO2 concentration, illumination intensity and air speed showed similar effects on the light use efficiency in some treatments (Figure 6). For example, light use efficiency obtained under a CO2 concentration of 1500 μmol mol−1, an illumination intensity of 200 μmol m−2 s−1 and an air speed of 0.50 m s−1 was also achieved under a CO2 concentration of 1000 μmol mol−1, an illumination intensity of 300 μmol m−2 s−1 and an air speed of 0.25 m s−1, indicating that electrical energy consumption can be reduced drastically with the optimal control of CO2 concentration, illumination intensity and air speed in a plant factory with artificial lighting.

5. Conclusions

The integrative effects of CO2 concentration, illumination intensity and air speed on the growth, gas exchange and light use efficiency of lettuce plants grown in a plant factory were investigated. The interaction between CO2 concentration and illumination intensity substantially affected the growth and development of indoor lettuce plants. Furthermore, under the interaction of CO2 concentration and illumination intensity, many positive effects related to lettuce gas exchange and light use efficiency were observed. During the first days after transplantation, a CO2 concentration of 1000 μmol mol−1, an illumination intensity of 200 μmol m−2 s−1 and an air speed of 0.25 m s−1 were sufficient for the growth of indoor lettuce seedlings. To maximize lettuce growth during the last days of transplantation, a CO2 concentration of 1000 μmol mol−1, an illumination intensity of 300 μmol m−2 s−1 and an air speed of 0.75 m s−1 are recommended. A decrease in stomatal conductance with an increase in CO2 concentration or air speed had no negative effect on the photosynthesis of fully-grown lettuce plants. Although the effect of air speed on lettuce growth was small, it had a noticeable effect on photosynthesis. Based on the results of this experiment, similar responses in the growth of indoor lettuce plants and light use efficiency were observed due to the three-way interaction between CO2 concentration, illumination intensity and air speed. Thus, further research on the analysis of the economic costs of lettuce production under different environmental conditions is needed to maximize the economic benefits of indoor cultivation systems.

Author Contributions

Conceptualization, H.A.A. and Y.T.; methodology, H.A.A. and Y.T.; software, H.A.A.; formal analysis, H.A.A.; investigation, H.A.A. and Y.T.; resources, H.A.A., Y.T., L.L., S.Q.S., A.M.A. and R.C.; data curation, H.A.A. and L.L.; writing—original draft preparation, H.A.A.; writing—review and editing, H.A.A., Y.T., S.Q.S. and A.M.A.; visualization, H.A.A., Y.T., L.L., S.Q.S., A.M.A. and R.C.; supervision, Y.T. and R.C.; project administration, Y.T.; funding acquisition, Y.T. All authors have read and agreed to the published version of the manuscript.

Funding

This work was financially supported by the National Key Research and Development Program, Ministry of Science and Technology of China (No. 2020YFE0203600) and Hebei introducing foreign intelligences program.

Data Availability Statement

Data supporting the reported results will be available and provided upon request.

Acknowledgments

The authors would like to thank Mohammad S. Salaam, Ibb University, Department of Plant Production, Yemen for proofreading and editing the manuscript.

Conflicts of Interest

The authors declare that they do not have any conflicts of interest.

References

  1. Kozai, T.; Niu, G.; Takagaki, M. Plant Factory: An Indoor Vertical Farming System for Efficient Quality Food Production; Academic Press: San Diego, CA, USA, 2015. [Google Scholar]
  2. Zhang, X.; He, D.; Niu, G.; Yan, Z.; Song, J. Effects of environment lighting on the growth, photosynthesis, and quality of hydroponic lettuce in a plant factory. Int. J. Agric. Biol. Eng. 2018, 11, 33–40. [Google Scholar] [CrossRef]
  3. Wang, J.; Lu, W.; Tong, Y.; Yang, Q. Leaf Morphology, Photosynthetic Performance, Chlorophyll Fluorescence, Stomatal Development of Lettuce (Lactuca sativa L.) Exposed to Different Ratios of Red Light to Blue Light. Front. Plant Sci. 2016, 7, 250. [Google Scholar] [CrossRef] [PubMed] [Green Version]
  4. Fu, W.; Li, P.; Wu, Y. Effects of different light intensities on chlorophyll fluorescence characteristics and yield in lettuce. Sci. Hortic. 2012, 135, 45–51. [Google Scholar] [CrossRef]
  5. Kozai, T. Improving Light Energy Utilization Efficiency for a Sustainable Plant Factory with Artificial Light. In Proceedings of the Green Lighting Shanghai Forum, Shanghai, China, 11 May 2011. [Google Scholar]
  6. Tong, Y.; Yang, Q.; Shimamura, S. Analysis of Electric-Energy Utilization Efficiency in a Plant Factory with Artificial Light for Lettuce Production. In International Symposium on New Technologies for Environment Control, Energy-Saving and Crop Production in Greenhouse and Plant; Springer: Berlin/Heidelberg, Germany, 2014; Volume 1037, pp. 277–284. [Google Scholar] [CrossRef]
  7. Ahmed, H.A.; Tong, Y.-X.; Yang, Q.-C. Optimal control of environmental conditions affecting lettuce plant growth in a controlled environment with artificial lighting: A review. S. Afr. J. Bot. 2020, 130, 75–89. [Google Scholar]
  8. Goto, E. Effects of Light Quality on Growth of Crop Plants under Artificial Lighting. Environ. Control Biol. 2003, 41, 121–132. [Google Scholar] [CrossRef] [Green Version]
  9. Kitaya, Y.; Shibuya, T.; Kozai, T.; Kubota, C. Effects of light intensity and air velocity on air temperature, water vapor pressure, and CO2 concentration inside a plant canopy under an artificial lighting condition. Life Support Biosph. Sci. Int. J. Earth Space 1998, 5, 199–203. [Google Scholar]
  10. Lee, H.I.; Kim, Y.H. Utilization Efficiencies of Electric Energy and Photosynthetically Active Radiation of Lettuce Grown under Red LED, Blue LED and Fluorescent Lamps with Different Photoperiods. J. Biosyst. Eng. 2013, 38, 279–286. [Google Scholar] [CrossRef]
  11. Tian, L.; Meng, Q.; Wang, L.; Dong, J. A Study on Crop Growth Environment Control System. Int. J. Control Autom. 2014, 7, 357–374. [Google Scholar] [CrossRef]
  12. Bayat, L.; Arab, M.; Aliniaeifard, S.; Seif, M.; Lastochkina, O.; Li, T. Effects of growth under different light spectra on the subsequent high light tolerance in rose plants. AoB Plants 2018, 10, ply052. [Google Scholar] [CrossRef]
  13. Bian, Z.H.; Yang, Q.C.; Liu, W.K. Effects of light quality on the accumulation of phytochemicals in vegetables produced in controlled environments: A review. J. Sci. Food Agric. 2015, 95, 869–877. [Google Scholar] [CrossRef]
  14. Kim, H.-H.; Goins, G.D.; Wheeler, R.M.; Sager, J.C. Green-light Supplementation for Enhanced Lettuce Growth under Red- and Blue-light-emitting Diodes. HortScience 2004, 39, 1617–1622. [Google Scholar] [CrossRef] [PubMed] [Green Version]
  15. Lin, K.-H.; Huang, M.-Y.; Huang, W.-D.; Hsu, M.-H.; Yang, Z.-W.; Yang, C.-M. The effects of red, blue, and white light-emitting diodes on the growth, development, and edible quality of hydroponically grown lettuce (Lactuca sativa L. var. capitata). Sci. Hortic. 2013, 150, 86–91. [Google Scholar] [CrossRef]
  16. Piovene, C.; Orsini, F.; Bosi, S.; Sanoubar, R.; Bregola, V.; Dinelli, G.; Gianquinto, G.P. Optimal red:blue ratio in led lighting for nutraceutical indoor horticulture. Sci. Hortic. 2015, 193, 202–208. [Google Scholar] [CrossRef]
  17. Bantis, F.; Smirnakou, S.; Ouzounis, T.; Koukounaras, A.; Ntagkas, N.; Radoglou, K. Current status and recent achievements in the field of horticulture with the use of light-emitting diodes (LEDs). Sci. Hortic. 2018, 235, 437–451. [Google Scholar] [CrossRef]
  18. Kang, W.H.; Park, J.S.; Park, K.S.; Son, J.E. Leaf photosynthetic rate, growth, and morphology of lettuce under different fractions of red, blue, and green light from light-emitting diodes (LEDs). Hortic. Environ. Biotechnol. 2016, 57, 573–579. [Google Scholar] [CrossRef]
  19. Naznin, M.T.; Lefsrud, M.; Gravel, V.; Azad, O.K. Blue Light added with Red LEDs Enhance Growth Characteristics, Pigments Content, and Antioxidant Capacity in Lettuce, Spinach, Kale, Basil, and Sweet Pepper in a Controlled Environment. Plants 2019, 8, 93. [Google Scholar] [CrossRef] [Green Version]
  20. Tang, Y.K.; Guo, S.S.; Ai, W.D.; Qin, L.F. Effects of Red and Blue Light Emitting Diodes (LEDs) on the Growth and Development of Lettuce (var. Youmaicai); SAE Technical Paper Series; SAE: Warrendale, PA, USA, 2009. [Google Scholar] [CrossRef]
  21. Sago, Y. Effects of Light Intensity and Growth Rate on Tipburn Development and Leaf Calcium Concentration in Butterhead Lettuce. HortScience 2016, 51, 1087–1091. [Google Scholar] [CrossRef]
  22. Kang, J.H.; KrishnaKumar, S.; Atulba, S.L.S.; Jeong, B.R.; Hwang, S.J. Light intensity and photoperiod influence the growth and development of hydroponically grown leaf lettuce in a closed-type plant factory system. Hortic. Environ. Biotechnol. 2013, 54, 501–509. [Google Scholar] [CrossRef]
  23. Kim, H.-H.; Goins, G.D.; Wheeler, R.M.; Sager, J.C. Stomatal Conductance of Lettuce Grown Under or Exposed to Different Light Qualities. Ann. Bot. 2004, 94, 691–697. [Google Scholar] [CrossRef] [Green Version]
  24. Shibata, T.; Iwao, K.; Takano, T. Effect of Vertical Air Flowing on Lettuce Growing in a Plant Factory. Greenh. Environ. Control Autom. 1994, 399, 175–182. [Google Scholar] [CrossRef]
  25. Kitaya, Y.; Shibuya, T.; Yoshida, M.; Kiyota, M. Effects of air velocity on photosynthesis of plant canopies under elevated CO2 levels in a plant culture system. Adv. Space Res. 2004, 34, 1466–1469. [Google Scholar] [CrossRef]
  26. Yabuki, K. Photosynthetic Rate and Dynamic Environment; Springer Science and Business Media LLC: Berlin/Heidelberg, Germany, 2004. [Google Scholar]
  27. Kitaya, Y.; Tsuruyama, J.; Shibuya, T.; Yoshida, M.; Kiyota, M. Effects of air current speed on gas exchange in plant leaves and plant canopies. Adv. Space Res. 2003, 31, 177–182. [Google Scholar] [CrossRef]
  28. Shibuya, T.; Tsuruyama, J.; Kitaya, Y.; Kiyota, M. Enhancement of photosynthesis and growth of tomato seedlings by forced ventilation within the canopy. Sci. Hortic. 2006, 109, 218–222. [Google Scholar] [CrossRef]
  29. Lee, J.G.; Choi, C.S.; Jang, Y.A.; Jang, S.W.; Lee, S.G.; Um, Y.C. Effects of air temperature and air flow rate control on the tipburn occurrence of leaf lettuce in a closed-type plant factory system. Hortic. Environ. Biotechnol. 2013, 54, 303–310. [Google Scholar] [CrossRef]
  30. Zhang, Y.; Kacira, M.; An, L. A CFD study on improving air flow uniformity in indoor plant factory system. Biosyst. Eng. 2016, 147, 193–205. [Google Scholar] [CrossRef]
  31. Korthals, R.; Knight, S.; Christianson, L.; Spomer, L. Chambers for studying the effects of airflow velocity on plant growth. Biotronics 1994, 23, 113–119. [Google Scholar]
  32. Park, Y.G.; Park, J.E.; Hwang, S.J.; Jeong, B.R. Light source and CO2 concentration affect growth and anthocyanin content of lettuce under controlled environment. Hortic. Environ. Biotechnol. 2012, 53, 460–466. [Google Scholar] [CrossRef]
  33. Kim, Y.; Kozai, T.; Kubota, C.; Kitaya, Y. Effects of Air Current Speeds on The Microclimate of Plug Stand under Artificial Lighting. In International Symposium on Plant Production in Closed Ecosystems; Springer: Berlin/Heidelberg, Germany, 1996; Volume 440, pp. 354–359. [Google Scholar] [CrossRef]
  34. Thongbai, P.; Kozai, T.; Ohyama, K. CO2 and air circulation effects on photosynthesis and transpiration of tomato seedlings. Sci. Hortic. 2010, 126, 338–344. [Google Scholar] [CrossRef]
  35. Ahmed, H.A.; Li, Y.; Shao, L.; Tong, Y.-X. Effect of light intensity and air velocity on the thermal exchange of indoor-cultured lettuce. Hortic. Environ. Biotechnol. 2022, 1–16. [Google Scholar] [CrossRef]
  36. Ahmed, H.A.; Tong, Y.-X.; Yang, Q.-C. Lettuce plant growth and tipburn occurrence as affected by airflow using a multi-fan system in a plant factory with artificial light. J. Therm. Biol. 2020, 88, 102496. [Google Scholar] [CrossRef]
  37. Kozai, T. Resource use efficiency of closed plant production system with artificial light: Concept, estimation and application to plant factory. In Proceedings of the Japan Academy, Series B; Japan Academy: Tokyo, Japan, 2013; Volume 89, pp. 447–461. [Google Scholar]
  38. Cohen, J. Statistical Power Analysis for the Behavioral Sciences, 2nd ed.; Lawrence Erlbaum Associates: Hillsdale, NJ, USA, 1988; ISBN 978-0-8058-0283-2. [Google Scholar]
  39. Ryu, D.; Kang, S.; Ngo, V.-D.; Chung, S.; Choi, J.; Park, S.; Kim, S.-J. Control of Temperature, Humidity, and Co2 Concentration in Small-Sized Experimental Plant Factory. Acta Hortic. 2014, 1037, 477–484. [Google Scholar] [CrossRef]
  40. Xu, S.; Zhu, X.; Li, C.; Ye, Q. Effects of CO2 enrichment on photosynthesis and growth in Gerbera jamesonii. Sci. Hortic. 2014, 177, 77–84. [Google Scholar] [CrossRef]
  41. Lee, Y.; Park, M. Effects of CO2 Concentration, Light Intensity and Nutrient Level on Growth of Leaf Lettuce in a Plant Factory. In International Symposium on Growing Media and Hydroponics; Springer: Berlin/Heidelberg, Germany, 1999; Volume 548, pp. 377–384. [Google Scholar] [CrossRef]
  42. Muneer, S.; Kim, E.J.; Park, J.S.; Lee, J.H. Influence of Green, Red and Blue Light Emitting Diodes on Multiprotein Complex Proteins and Photosynthetic Activity under Different Light Intensities in Lettuce Leaves (Lactuca sativa L.). Int. J. Mol. Sci. 2014, 15, 4657–4670. [Google Scholar] [CrossRef] [PubMed] [Green Version]
  43. Loconsole, D.; Cocetta, G.; Santoro, P.; Ferrante, A. Optimization of LED Lighting and Quality Evaluation of Romaine Lettuce Grown in an Innovative Indoor Cultivation System. Sustainability 2019, 11, 841. [Google Scholar] [CrossRef] [Green Version]
  44. Urrestarazu, M.; Nájera, C.; Gea, M.D.M. Effect of the Spectral Quality and Intensity of Light-emitting Diodes on Several Horticultural Crops. HortScience 2016, 51, 268–271. [Google Scholar] [CrossRef] [Green Version]
  45. Li, M.; Kozai, T.; Ohyama, K.; Shimamura, S.; Gonda, K.; Sekiyama, S. Estimation of hourly CO2 assimilation rate of lettuce plants in a closed system with artificial lighting for commercial production. Eco-Eng. 2012, 24, 77–83. [Google Scholar] [CrossRef]
  46. Becker, C.; Kläring, H.-P. CO2 enrichment can produce high red leaf lettuce yield while increasing most flavonoid glycoside and some caffeic acid derivative concentrations. Food Chem. 2016, 199, 736–745. [Google Scholar] [CrossRef] [Green Version]
  47. Wang, Y.; Du, S.-T.; Li, L.L.; Huang, L.-D.; Fang, P.; Lin, X.-Y.; Zhang, Y.-S.; Wang, H.-L. Effect of CO2 elevation on root growth and its relationship with indole acetic acid and ethylene in tomato seedlings. Pedosphere 2009, 19, 570–576. [Google Scholar] [CrossRef]
  48. Choi, C.S.; Lee, J.G.; Jang, Y.A.; Lee, S.G.; Oh, S.S.; Lee, H.J.; Um, Y.C. Effect of Artificial Light Sources on Growth and Quality Characteristics of Leaf Lettuce in Closed Plant Factory System. J. Agric. Life Sci. 2013, 47, 23–32. [Google Scholar] [CrossRef] [Green Version]
  49. Zhang, R.; Liu, T.; Ma, J. Plant factory: A new method for reducing carbon emissions. In Proceedings of the AIP Conference; AIP Publishing: Melville, NY, USA, 2017; Volume 1820, p. 040016. [Google Scholar]
  50. Chen, G.-Y.S. Effect of Airflow and Carbon Dioxide on Growth, Yield, and Gas Exchange of Lettuce. Ph.D. Thesis, University of Illinois at Urbana-Champaign, Champaign, IL, USA, 1996. [Google Scholar]
  51. Chintakovid, W.; Kubota, C.; Bostick, W.M.; Kozai, T. Effect of Air Current Speed on Evapotranspiration Rate of Transplant Canopy under Artificial Light. Shokubutsu Kojo Gakkaishi 2002, 14, 25–31. [Google Scholar] [CrossRef]
  52. Johkan, M.; Shoji, K.; Goto, F.; Hahida, S.; Yoshihara, T. Effect of green light wavelength and intensity on photomorphogenesis and photosynthesis in Lactuca sativa. Environ. Exp. Bot. 2012, 75, 128–133. [Google Scholar] [CrossRef]
  53. Hattori, T.; Sonobe, K.; Inanaga, S.; An, P.; Tsuji, W.; Araki, H.; Eneji, A.E.; Morita, S. Short term stomatal responses to light intensity changes and osmotic stress in sorghum seedlings raised with and without silicon. Environ. Exp. Bot. 2007, 60, 177–182. [Google Scholar] [CrossRef]
  54. Lee, S.-H.; Tewari, R.K.; Hahn, E.-J.; Paek, K.-Y. Photon flux density and light quality induce changes in growth, stomatal development, photosynthesis and transpiration of Withania somnifera (L.) Dunal. plantlets. Plant Cell Tissue Organ Cult. (PCTOC) 2007, 90, 141–151. [Google Scholar] [CrossRef]
  55. Yasutake, D.; Miyauchi, K.; Mori, M.; Kitano, M.; Ino, A.; Takahashi, A. Multiple Effects of CO 2 Concentration and Humidity on Leaf Gas Exchanges of Sweet Pepper in the Morning and Afternoon. Environ. Control Biol. 2016, 54, 177–181. [Google Scholar] [CrossRef]
  56. Kitaya, Y. Importance of air movement for promoting gas and heat exchanges between plants and atmosphere under controlled environments. In Plant Responses to Air Pollution and Global Change; Springer: Berlin/Heidelberg, Germany, 2005; pp. 185–193. [Google Scholar]
  57. Son, K.-H.; Jeon, Y.-M.; Oh, M.-M. Application of supplementary white and pulsed light-emitting diodes to lettuce grown in a plant factory with artificial lighting. Hortic. Environ. Biotechnol. 2016, 57, 560–572. [Google Scholar] [CrossRef]
Figure 1. Effect of CO2 concentration, illumination intensity and air speed on shoot fresh weight of lettuce plants grown under artificial lighting.
Horticulturae 08 00270 g001
Figure 2. Effect of CO2 concentration, illumination intensity and air speed on shoot dry weight of lettuce plants grown under artificial light.
Horticulturae 08 00270 g002
Figure 3. Effect of CO2 concentration, illumination intensity and air speed on the photosynthetic rate of lettuce plants grown under artificial lighting.
Horticulturae 08 00270 g003
Figure 4. Effect of CO2 concentration, illumination intensity and air speed on the transpiration rate of lettuce plants grown under artificial lighting.
Horticulturae 08 00270 g004
Figure 5. Effect of CO2 concentration, illumination intensity and air speed on the stomatal conductance of lettuce plants grown under artificial lighting.
Horticulturae 08 00270 g005
Figure 6. Effect of CO2 concentration, illumination intensity and air speed on light use efficiency (LUE) of lettuce plants grown under artificial lighting.
Horticulturae 08 00270 g006
Table 1. Correlation and effect size of CO2 concentration, illumination intensity and air speed on the growth, gas exchange and light use efficiency of lettuce plants grown under artificial lighting.
Dependent VariableCO2 ConcentrationIllumination IntensityAir Speed
Correlation (%)Effect Size (%)Correlation (%)Effect Size (%)Correlation (%)Effect Size (%)
Shoot fresh weight55 **88 *76 **94 *512 *
Shoot dry weight24 *46 *87 **90 *21
Leaf area60 **88 *56 **85 *713 *
Number of leaves70 **74 *44 **52 *1511 *
Plant height76 **86 *−1122 *21
Roots fresh weight37 **66 *85 **91 *11
Roots length−119 *−108 *30 **20 *
Roots dry weight24 *20 *87 **91 *28 *
Photosynthesis23 **79 *90 **98 *10 **51 *
Transpiration−30 **38 *64 **71 *−21 **21 *
Stomatal conductance−11 **67 *56 **63 *−17 **14 *
Light use efficiency46 **57 *−44 **47 *53
** and * indicate that the correlation coefficient and effect-size ratio are significant at p ≤ 0.01 and 0.05, respectively. The values of the effect size represent the trivial effect size for values less than 10%, small effect size for values ranging from 10% to 30%, medium effect size for values ranging from 30% to 50%, and large effect size for values greater than 50%.
Table 2. Total leaf area, number of leaves and plant height of lettuce plants as affected by CO2 concentration, illumination intensity and air speed.
CO2 Concentration (μmol mol−1)Illumination Intensity (μmol m−2 s−1)Air Speed
(m s−1)
Total Leaf Area (cm2)Number of Leaves per Plant (−)Plant Height (cm)
5001000.25578.0 ± 67.1 d16.3 ± 1.5 c14.5 ± 1.7 bc
0.50662.0 ± 93.8 d18.5 ± 0.6 ab15.5 ± 1.6 ab
0.75673.9 ± 74.8 d17.6 ± 1.1 bc16.4 ± 0.5 a
2000.25870.1 ± 68.0 c18.5 ± 1.0 ab15.9 ± 1.0 ab
0.50980.7 ± 87.2 ab19.5 ± 1.3 a16.5 ± 1.5 a
0.75895.1 ± 61.9 bc19.0 ± 0.8 ab16.4 ± 1.3 a
3000.25919.0 ± 88.4 abc19.5 ± 0.6 a15.4 ± 0.9 abc
0.501014.4 ± 35.9 a19.8 ± 1.0 a15.9 ± 1.0 ab
0.75819.9 ± 81.8 c18.8 ± 1.7 ab13.8 ± 0.6 c
10001000.25572.0 ± 58.6 d18.5 ± 1.0 d15.1 ± 0.6 ab
0.50580.0 ± 62.9 d20.3 ± 1.0 cd14.6 ± 1.3 ab
0.75622.3 ± 51.0 d20.3 ± 1.5 cd15.0 ± 0.8 ab
2000.25849.3 ± 70.3 c20.8 ± 0.5 bc16.9 ± 0.6 a
0.50917.8 ± 27.7 bc20.8 ± 0.5 bc16.3 ± 0.5 ab
0.751066.3 ± 70.2 a24.8±0.5 a16.8 ± 0.6 a
3000.251012.3 ± 88.9 ab23.3 ± 2.1 a16.4 ± 0.5 b
0.50905.0 ± 80.6 c22.8 ± 3.2 ab15.4 ± 0.5 ab
0.75897.3 ± 72.3 c22.8 ± 1.3 ab15.9 ± 0.5 ab
15001000.25911.9 ± 34.6 d21.8 ± 0.5 c22.4 ± 0.3 a
0.50962.5 ± 57.5 d21.3 ± 1.0 c21.9 ± 0.9 ab
0.75992.2 ± 90.4 d22.5 ± 1.3 bc22.5 ± 0.4 a
2000.251131.4 ± 97.8 c21.5 ± 1.7 c21.4 ± 0.9 ab
0.501302.3 ± 100.2 b23.5 ± 1.7 bc21.1 ± 1.3 b
0.751346.4 ± 83.5 ab25.0 ± 0.8 ab22.1 ± 0.6 ab
3000.251394.5 ± 111.5 ab27.0 ± 3.2 a21.6 ± 1.1 ab
0.501430.3 ± 46.3 a27.0 ± 2.2 a19.1 ± 0.3 c
0.751358.9 ± 37.4 ab26.5 ± 2.5 a19.5 ± 0.6 c
Means and their standard deviations of five replicates (n = 5). Means within columns followed by different letters are significantly different using the LSD test, p 0.05. Statistical grouping for each CO2 concentration was performed separately.
Table 3. Effect size of the two- and three-way interactions between CO2 concentration, illumination intensity and air speed on the growth, gas exchange and light use efficiency of lettuce plants grown under artificial lighting.
Dependent VariableC × I (%)C × A (%)I × A (%)C × I × A (%)
Shoot fresh weight34 *20 *14 *18 *
Shoot dry weight32 *8331 *
Leaf area19 *15 *27 *10
Number of leaves19 *716 *10
Plant height15 *8417 *
Roots fresh weight24 *716 *19 *
Roots length21 *22 *14 *32 *
Roots dry weight59119
Photosynthesis52 *28 *67 *51 *
Transpiration47 *6 *14 *26 *
Stomatal conductance20 *5 *7 *13 *
Light use efficiency41 *14 *429 *
* indicates that the effect sizes of the two- and three-way interactions are significant at p ≤ 0.05. C, I, A indicate CO2 concentration, illumination intensity and air speed, respectively. The values in the table represent the trivial effect size for values less than 10%, small effect size for values ranging from 10% to 30%, medium effect size for values ranging from 30% to 50%, and large effect size for values greater than 50%.
Table 4. Fresh and dry weights of roots and roots length of lettuce plants as affected by CO2 concentration, illumination intensity and air speed.
CO2 Concentration (μmol mol−1)Illumination Intensity (μmol m−2 s−1)Air Speed
(m s−1)
Root Fresh Weight (g)Root Dry Weight (g)Root Length (cm)
5001000.251.8 ± 0.4 c0.13 ± 0.03 c18.5 ± 0.6 b
0.501.8 ± 0.4 c0.11 ± 0.02 c17.4 ± 0.5 bcd
0.752.3 ± 0.2 c0.14 ± 0.01 c17.6 ± 0.4 bcd
2000.253.9 ± 0.7 b0.25 ± 0.06 b17.1 ± 0.9 cd
0.504.1 ± 0.3 b0.25 ± 0.01 b18.4 ± 0.8 bc
0.753.5 ± 0.2 b0.24 ± 0.03 b20.1 ± 1.7 a
3000.255.8 ± 0.5 a0.38 ± 0.04 a17.0 ± 1.4 d
0.505.2 ± 0.3 a0.33 ± 0.01 a18.0 ± 0.8 bcd
0.755.1 ± 1.1 a0.33 ± 0.07 a18.6 ± 0.5 b
10001000.252.5 ± 0.3 c0.13 ± 0.02 c17.8 ± 0.5 ab
0.502.7 ± 0.3 c0.14 ± 0.03 c17.3 ± 1.0 ab
0.752.5 ± 0.2 c0.13 ± 0.01 c18.3 ± 0.5 a
2000.254.5 ± 0.6 b0.24 ± 0.03 b17.8 ± 0.5 ab
0.504.6 ± 0.4 b0.25 ± 0.03 b18.0 ± 0.8 ab
0.755.2 ± 0.5 b0.27 ± 0.03 b17.0 ± 0.8 b
3000.257.2 ± 0.8 a0.35 ± 0.03 a15.5 ± 0.6 c
0.505.4 ± 1.2 b0.33 ± 0.03 a17.8 ± 1.0 ab
0.756.4 ± 0.4 a0.36 ± 0.04 a15.8 ± 1.5 c
15001000.252.6 ± 0.2 d0.13 ± 0.01 d17.5 ± 0.6 cd
0.503.2 ± 0.4 d0.17 ± 0.03 d17.4 ± 1.1 cd
0.752.7 ± 0.6 d0.17 ± 0.02 d18.1 ± 0.6 bc
2000.255.7 ± 0.6 c0.24 ± 0.03 c16.9 ± 0.6 d
0.505.9 ± 0.4 c0.25 ± 0.03 c17.5 ± 0.6 cd
0.755.2 ± 0.7 c0.31 ± 0.03 b18.6 ± 0.5 ab
3000.257.6 ± 0.8 ab0.41 ± 0.03 a17.8 ± 1.0 bcd
0.507.4 ± 0.9 b0.35 ± 0.05 b16.9 ± 0.6 d
0.758.5 ± 1.0 a0.41 ± 0.06 a19.6 ± 0.8 a
Means and their standard deviations of five replicates (n = 5). Means within columns followed by different letters are significantly different using the LSD test, p 0.05. Statistical grouping for each CO2 concentration was performed separately.
Publisher’s Note: MDPI stays neutral with regard to jurisdictional claims in published maps and institutional affiliations.

