Article

The Investigation of Phenylalanine, Glucosinolate, Benzylisothiocyanate (BITC) and Cyanogenic Glucoside of Papaya Fruits (Carica papaya L. cv. ‘Tainung No. 2’) under Different Development Stages between Seasons and Their Correlation with Bitter Taste

by
Irvan Prawira Julius Jioe
1,
Huey-Ling Lin
2 and
Ching-Chang Shiesh
2,*
1
Department of Biotechnology, TransWorld University, Douliu 640, Taiwan
2
Department of Horticulture, National Chung Hsing University, Taichung 402, Taiwan
*
Author to whom correspondence should be addressed.
Horticulturae 2022, 8(3), 198; https://doi.org/10.3390/horticulturae8030198
Submission received: 2 February 2022 / Revised: 20 February 2022 / Accepted: 21 February 2022 / Published: 24 February 2022
(This article belongs to the Section Postharvest Biology, Quality, Safety, and Technology)

Abstract

:
Papaya fruit is one of economic crops in Taiwan, mostly eaten as table fruits. In some Asian countries, unripe papaya fruit is eaten as salad and this led to trends in Taiwan as well. However, unripe papaya fruit may taste bitter during cool seasons. Glucosinolate and cyanogenic glucoside are among the substances that cause bitter taste in many plants, which can also be found in papaya. However, there is still no report about the relationship between seasons and bitter taste in papaya fruits. Thus, the purpose of this study is to investigate the glucosinolate biosynthesis and its correlation between bitterness intensity during cool and warm seasons. The bitterness intensity was highest at the young fruit stage and decreased as it developed. In addition, the bitterness intensity in cool season fruits is higher than in warm season fruits. Cyanogenic glucoside and BITC content showed negative correlation with bitterness intensity (r = −0.54 ***; −0.46 ***). Phenylalanine showed positive correlation with bitterness intensity (r = 0.35 ***), but its content did not reach the bitterness threshold concentration, which suggested that phenylalanine only acts as cyanogenic glucoside and glucosinolate precusors. Glucosinolate content showed positive correlation with bitterness intensity at different developmental stages (r = 0.805 ***). However, the correlation value in different lines/cultivars decreased (0.44 ***), suggesting that glucosinolate was not the only substance that caused bitter taste in immature papaya fruits.

1. Introduction

Papaya is a short growing tropical fruit that can be harvested continuously at 8–9 months after sowing seeds [1,2]. In Taiwan, Carica papaya cv. ‘Tainung No. 2’ is the main cultivar planted in Taiwan, covering about 90% of total cultivated area, mostly in the southern part of Taiwan such as Pingtung, Gaoshiung, Tainan and Yunlin provinces [3]. Papaya is usually eaten as table fruits. In some Asian countries, unripe papaya can also be consumed [4,5], usually as a salad or cooked dish [6]. Nowadays, unripe papaya cuisine has begun to become popular in Taiwan, but it can taste bitter randomly during the cool season. Therefore, field inspection was needed for further understanding. During the inspection, it was found that the growers usually harvest the fruits when the pulp is still white in color. Furthermore, during harvesting of the fruits, they harvested casually and did not clearly mark at which stage of fruit development their harvest was. Hence, the bitter taste is thought to have a close relationship with the fruit development.
Glucosinolate is a sulfur-rich compound mainly found in the Brassicaceae and Caricae family such as Carica papaya [7]. In the plant order Brassicales, glucosinolate is one of the subtstances that cause bitter taste [7,8]. In papaya, Glucotrapeolin is a major glucosinolate in papaya and is a stable form due to glucose binding. After the glucose was hydrolyzed by myrosinase, it formed antibactericida [9] and anticarcinogenic substances [10], benzylisothiocyante (BITC) [11]. According to literature research, glucosinolate accumulation could be affected by many factors, for example, watercress grown under long days (16 h) and low temperature (10° and 15 °C) had higher gluconastuitiin [12]. Furthermore, Brassica oleracea observation during fall and spring seasons found that glucosinolate accumulation had a close relationship with temperature and day length rather than light intensity [13]. Furthermore, Rosetto et al. [14] showed different glucosinolate and BITC content in each fruit’s development stage. However, there is no information about their changes in different seasons and relationship with bitter taste.
According to Bennett et al. [15] research in glucosinolate biosynthesis showed that phenylalanine, which is also known as bitter amino acid [16], through several conversion by CYP79A2 and CYP83B1 became benzylglucosinolate [17,18]. Phenylalanine could also convert into cyanogenic glucoside. Cyanogenic glucoside are plant defense compounds and could be found in more than 3000 plant species including some of the economic plants [19]. Almond, cassava, and bamboo investigation found that cyanogenic glucoside content had positive correlation with bitter taste [20,21,22]. Cyanogenic glucoside accumulation is affected by many factors, for example, seasons in white clover [23], and low temperature storage in apple seeds [24]. In addition, Ping et al.’s [25] research in apricot showed that cyanogenic glucoside accumulated during fruit development. Furthermore, cyanogenic glucoside in papaya was found in leaves and tap root [15,26,27], but until now there is no report in fruits under different fruit development stages. Moreover, there is still no study about the relationship between seasons and bitter taste in papaya fruits
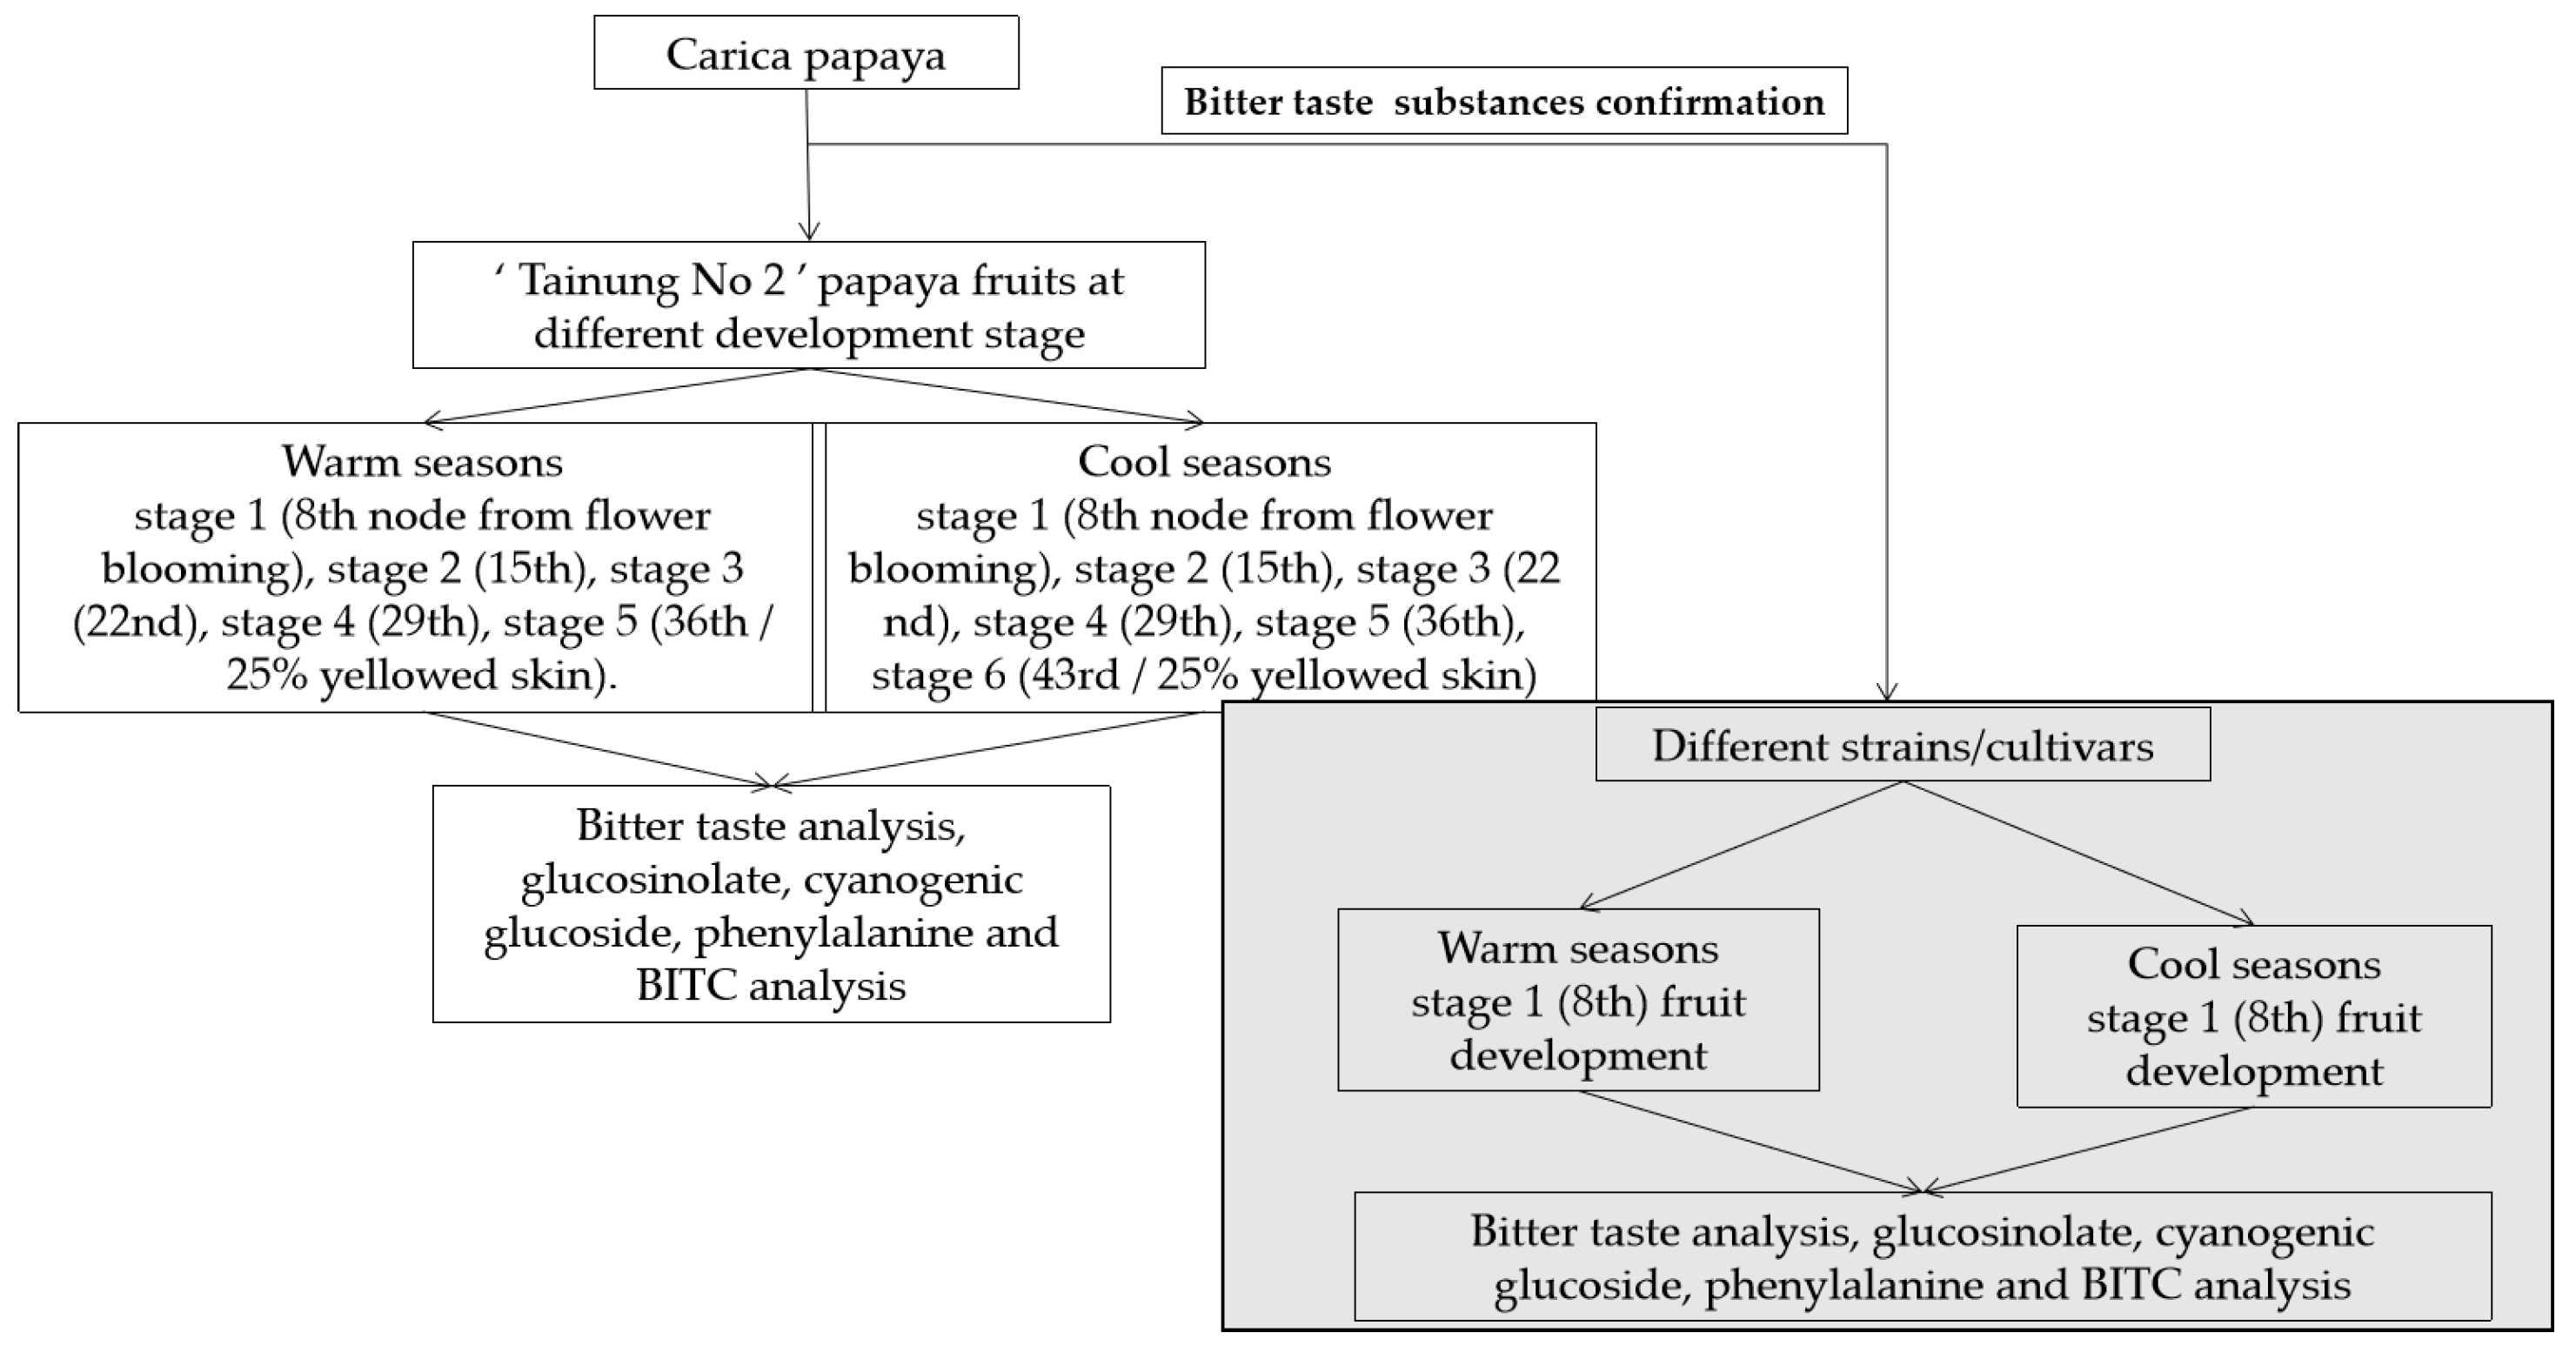
Therefore, the aim of this study is to observe phenylalanine, glucosinolate, benzylisothiocyanate, and cyanogenic glucoside and their correlation with bitter taste during cool and warm seasons (Figure A1) and provided basic information for growers.

2. Materials and Methods

2.1. Different Development Stage ‘Tainung No. 2’ Papaya Fruits

‘Tainung No. 2’ papayas were cultured in net house and started to harvest at the 8th node from flower blooming at Gaoshu Township, Pingtung County (22°49′32″ N 120°36′5″ E), Taiwan. In the cool season (25 February and 22 April), papayas were divided into 6 development stages: stage 1 (8th), stage 2 (15th), stage 3 (22nd), stage 4 (29th), stage 5 (36th), stage 6 (43rd/25% yellowed skin). In the warm season (20 August and 24 October), papayas had 5 development stages: stage 1 (8th), stage 2 (15th), stage 3 (22nd), stage 4 (29th), stage 5 (36th/25% yellowed skin). Each development stage had 4 replicates for bitter taste investigation and bitter compound analysis.

2.2. Different Papaya Fruit Lines and Cultivars

‘ML × PPI’, ‘23’, ‘TN-2’ (net house), ‘Ekso’, ‘Thai’, ‘TN-10’, ‘Mex × ekso’, ‘TN-2’ (plastic house), ‘X-2’, and ‘4-14’ papaya lines/cultivars were harvested at 2 seasons: warm season (6 October) and cool season (6 January) at stage 1 development stage (8th node from flower blooming). All of the papayas were cultured in net house except ‘TN-2’, which was divided into two groups: net house and plastic house. Each strain/cultivar had 4 replicates for their bitter taste and bitter compound investigation.

2.3. Phenylalanine Analysis

The phenylalanine measurements were based on Ambrose’s [28] method. A quantity of 0.5 g dry samples were grounded and extracted twice with 80% ethanol 80 °C for 30 min. Supernatant was obtained by centrifuge 16,000× g and added distilled water until 1 mL. The extractions were diluted in 0.06 N trichloroacetic acid (TCA) with ratio 2:5 and separated into 2 groups. For the sample, 1 mL ninhydrin-peptide mixture was added to 0.5 mL sample. For the serum blank, 1 mL peptide control mixture was added to 0.5 mL sample and 1 mL ninhydrin-peptide mixture to 0.5 mL 0.06 N TCA for blank. Samples were heated 85 °C for 16 min then cooled at 30 °C for 10 min. After cooling, we added 6 mL pyrophosphate reagent containing 55.76 g of sodium pyrophosphate and 100 mL copper reagent (CuSO4·5H2O, 600 mg/L and NaKC4H4O6·4H2O, 677 mg/L) in 1 L at pH 7.2 into sample and 6 mL double distilled water for blank. Samples were mixed and closed the tube, left for 30 min at 30 °C, then heated again at 85 °C for exactly 6 min and cooled at 30 °C. After 15 min, samples were measured with fluorometer with 360 nm activation and 495 nm emission. A volume of 1.65 mg phenylalanine/100 mL of 0.06 N TCA was set as the standard. Unit: mg/100 g DW. Each treatment had 4 replicates.

2.4. Glucosinolate Analysis

The measurement was based on Doorn et al. [29] with some modification: 0.2 g dried sample was ground and added to 4 mL boiling distilled water, then incubated at 90 °C for 30 min and shaken at 150 rpm (test tube was closed with aluminum foil). The samples were filtered with Whatman 2# and cooled with ice. For the analysis, 0.25 mL of sample was added with 0.275 mL distilled water and were filtered through 0.5 cm thick DEAE Sephadex A25 column (DEAE Sephadex A25 needed to immerse with distilled water before being put into the column). After passing through the DEAE Sephadex A25 column, the sample was added with 3 mL phosphate buffer pH 6.6 and 0.5mL myrosinase (0.1 unit/mL), the tube was closed, and reacted for 12 h at 37 °C. A 1 mL sample was added with 1 mL glucose assay reagent and reacted for 15 min at 30 °C, then incubated at 100 °C to stop the reaction and measured at 340 nm. A volume of 0.5 μmol/mL glucose was set as the standard. Unit: Glucose release mmol/g DW. Each treatment had 4 replicates.

2.5. Benzylisothiocyanate (BITC) Analysis

The measurement was based on Zhang et al. [30]: 5 g of fresh papaya was ground with 5 mL cooled methanol (−20 °C), centrifuged for 20 min 20,000 rpm at 4 °C, and filtered with miracloth to collect the supernatant. The aliquots were separated into 2 groups: control and reaction. For control, 0.5 mL aliquots were added with 0.5 mL cooled methanol and 1 mL TRIS-HCl buffer pH 7.5. For reaction, 0.5 mL aliquots were added with 0.5 mL cooled methanol containing 13 mM benzene dithiol and 1 mL TRIS-HCl buffer pH 7.5. All the samples were incubated at 65 °C for 1 h, centrifuged at 5000 rpm, and measured at 365 nm. A volume of 20 μM BITC in methanol was set as the standard. Unit: μmol BITC/g FW. Each treatment had 4 replicates.

2.6. Cyanogenic Glucoside Analysis

The measurement method followed Bradbury et al. [31]: 0.2 g sample was ground and added with 5 mL 0.1 M phosphoric acid (stop enzyme) then filtrated with miracloth or centrifuge. A 2 mL sample was added with 2 mL 4 M H2SO4, sealed and boiled for 50 min, cooled with ice water, and added with 5 mL 3.6 M NaOH wait for 5 min. Then, 1 mL of sample was added with 7 mL of 0.2 M acetate buffer pH 5 and 0.4 mL Chloramine-T, left for 5 min, then added with 1.6 mL isonicotinic acid/barbituric acid and left for 1 h at room temperature. The cyanide content was measured at 600nm. A volume of 1 mM of KCN was set as the standard. Unit: Cn mmol/g DW. Each treatment had 4 replicates.

2.7. Bitter Taste Analysis

All of the treatments of the papaya fruit were cut into 1 cm3 size. The bitterness analysis was held at the Department of Horticulture (Postharvest group), National Chung Hsing University. Ten panelists (4 women and 6 men, average age 20–25 years old) took part in this study and recorded the levels of the bitter taste of the fruits. The bitterness level was divided into 5: 0 (no bitterness); 1 (mildly bitter); 2 (bitter); 3 (very bitter); 4 (extremely bitter). Each treatment had 4 replicates.
The bitter taste was calculated using the following equation:
( bitter   taste   level × number   of   people   chose   the   bitter   taste   level ) total   people

2.8. Statistical Analysis

Determination of bitterness level, papaya flesh colors, firmness, and total soluble solids content in papaya fruits were performed in quadruplicate, and the mean values were calculated. The data were subjected to analysis of variance and Duncan’s test were used to assess differences between means. A significant difference was presumed at a level of p < 0.05. The correlation between chemical compound and bitter taste as *: p < 0.05, **: p < 0.01, ***: p < 0.001, ns: not significant.

3. Results

3.1. The Bitterness Intensity of ‘Tainung No. 2’ Papaya Fruit under Different Development Stage during Warm and Cool Seasons

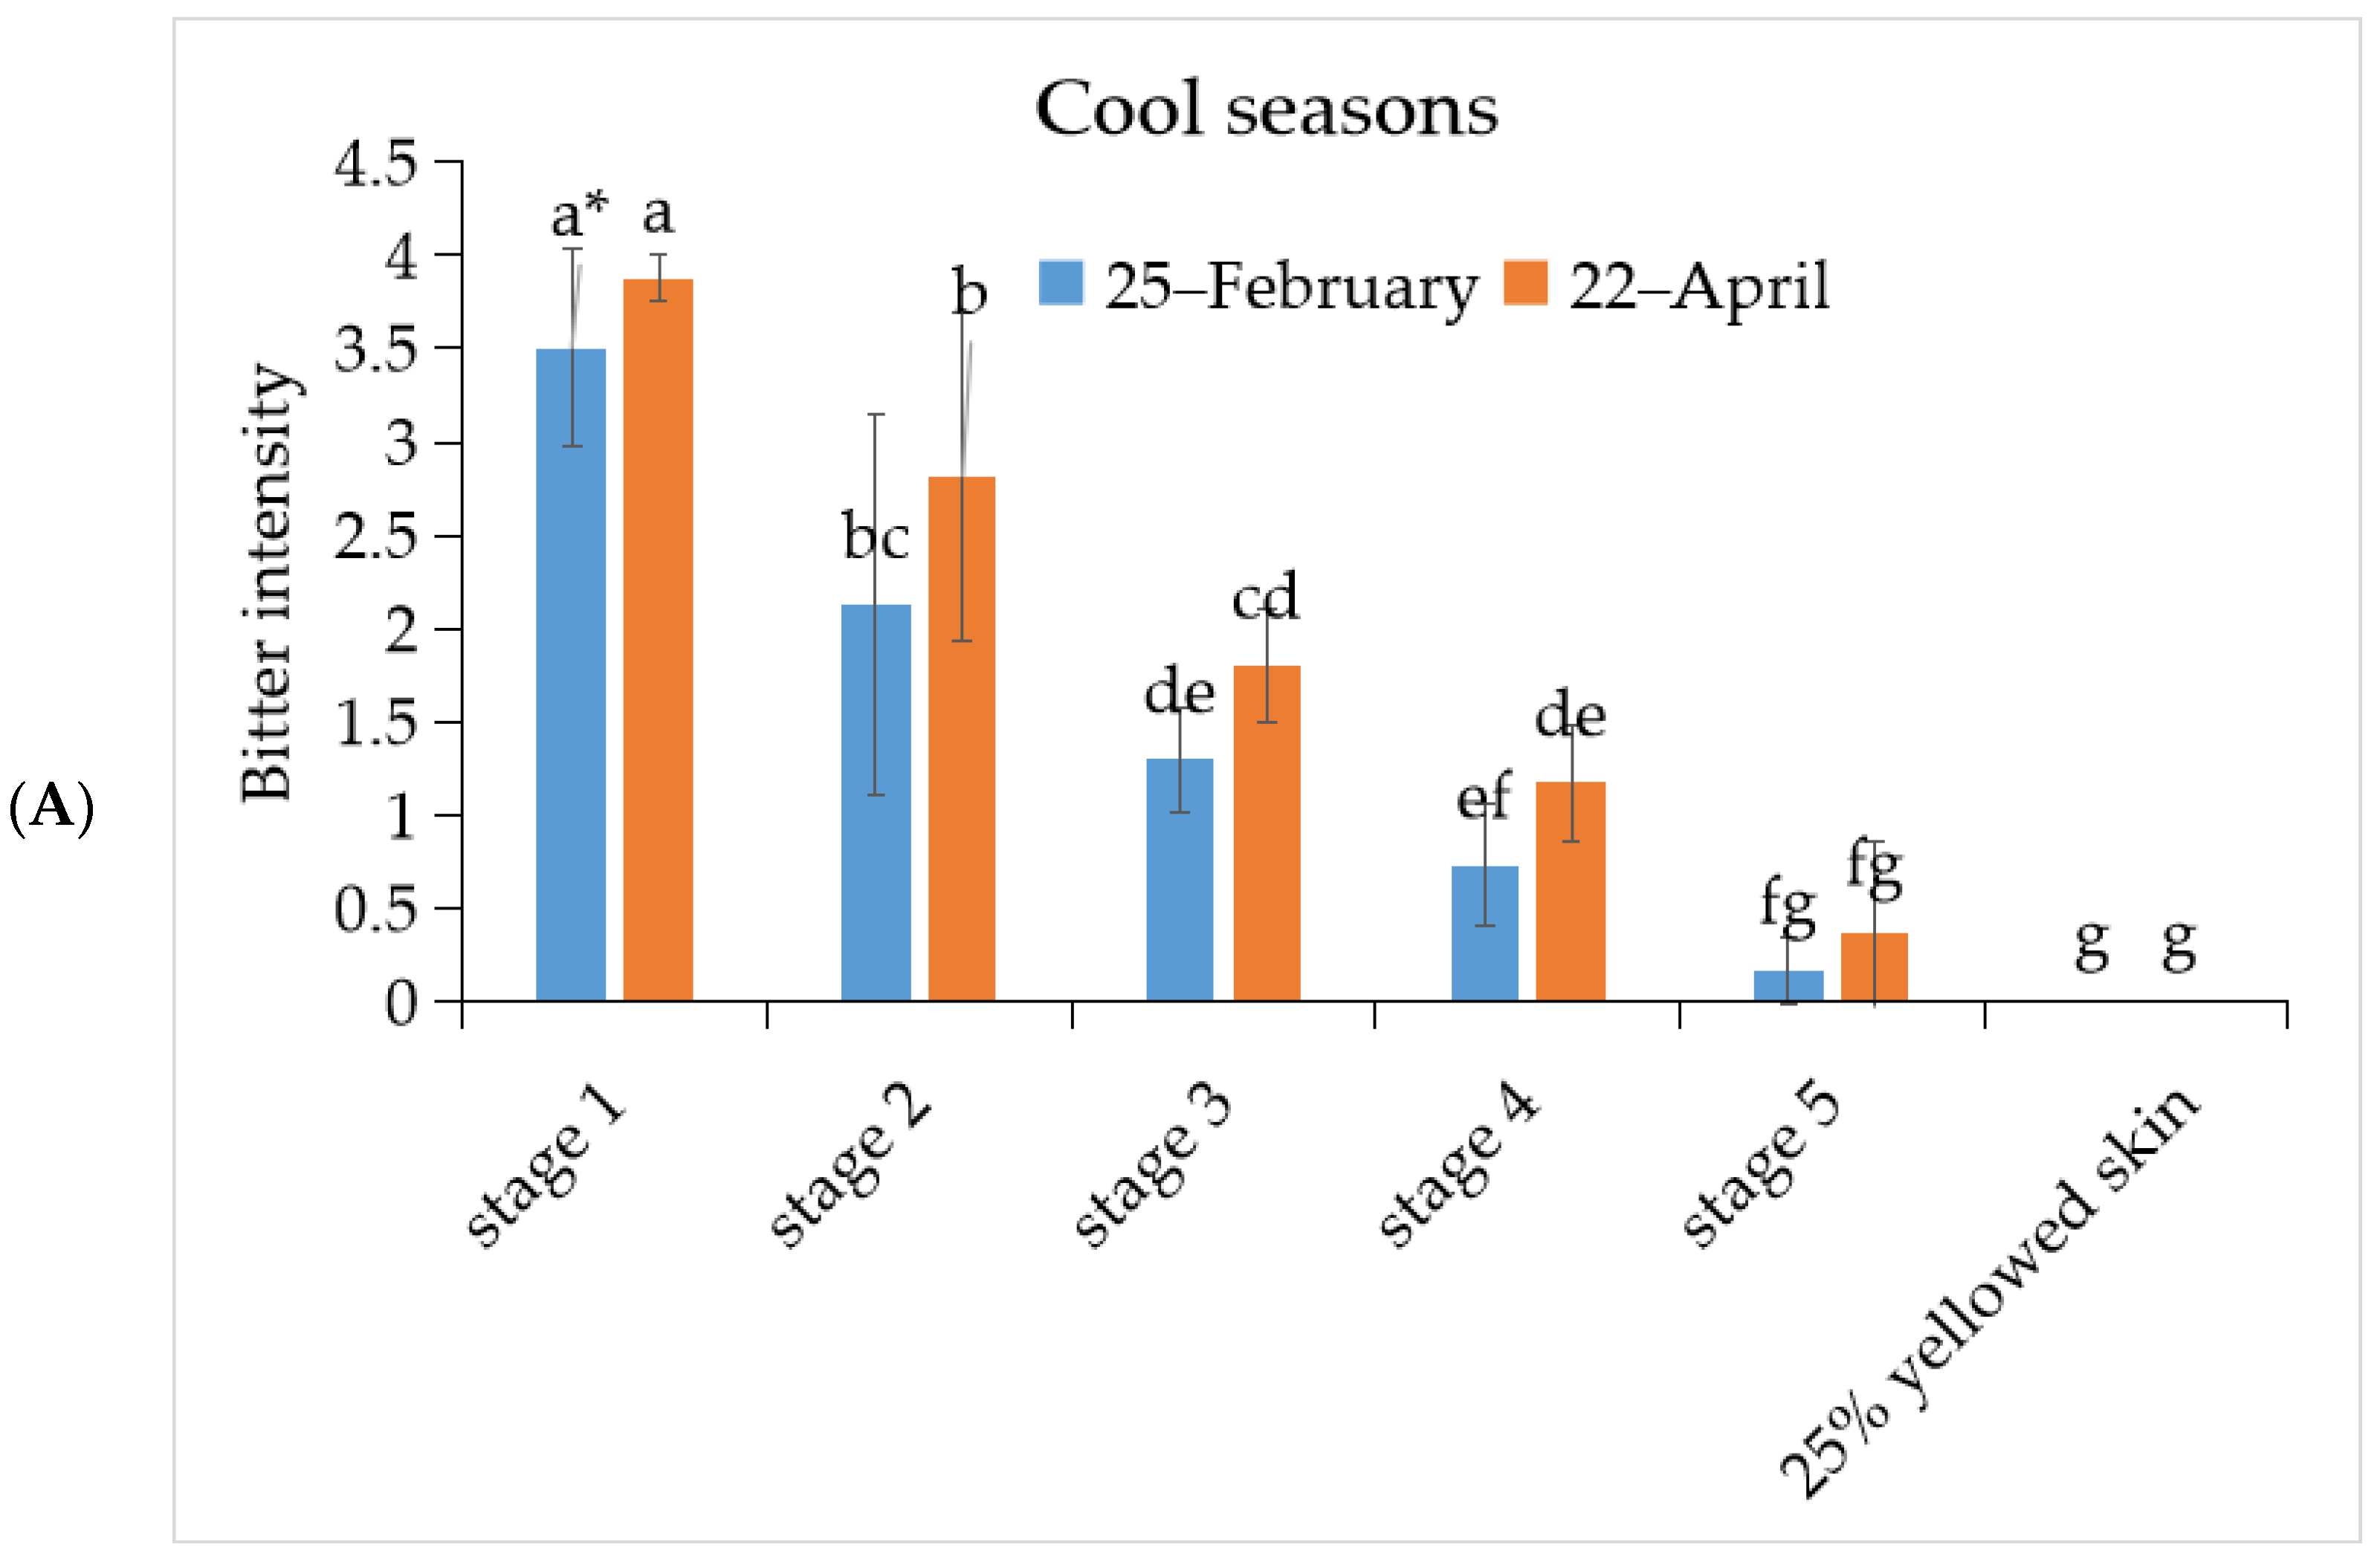
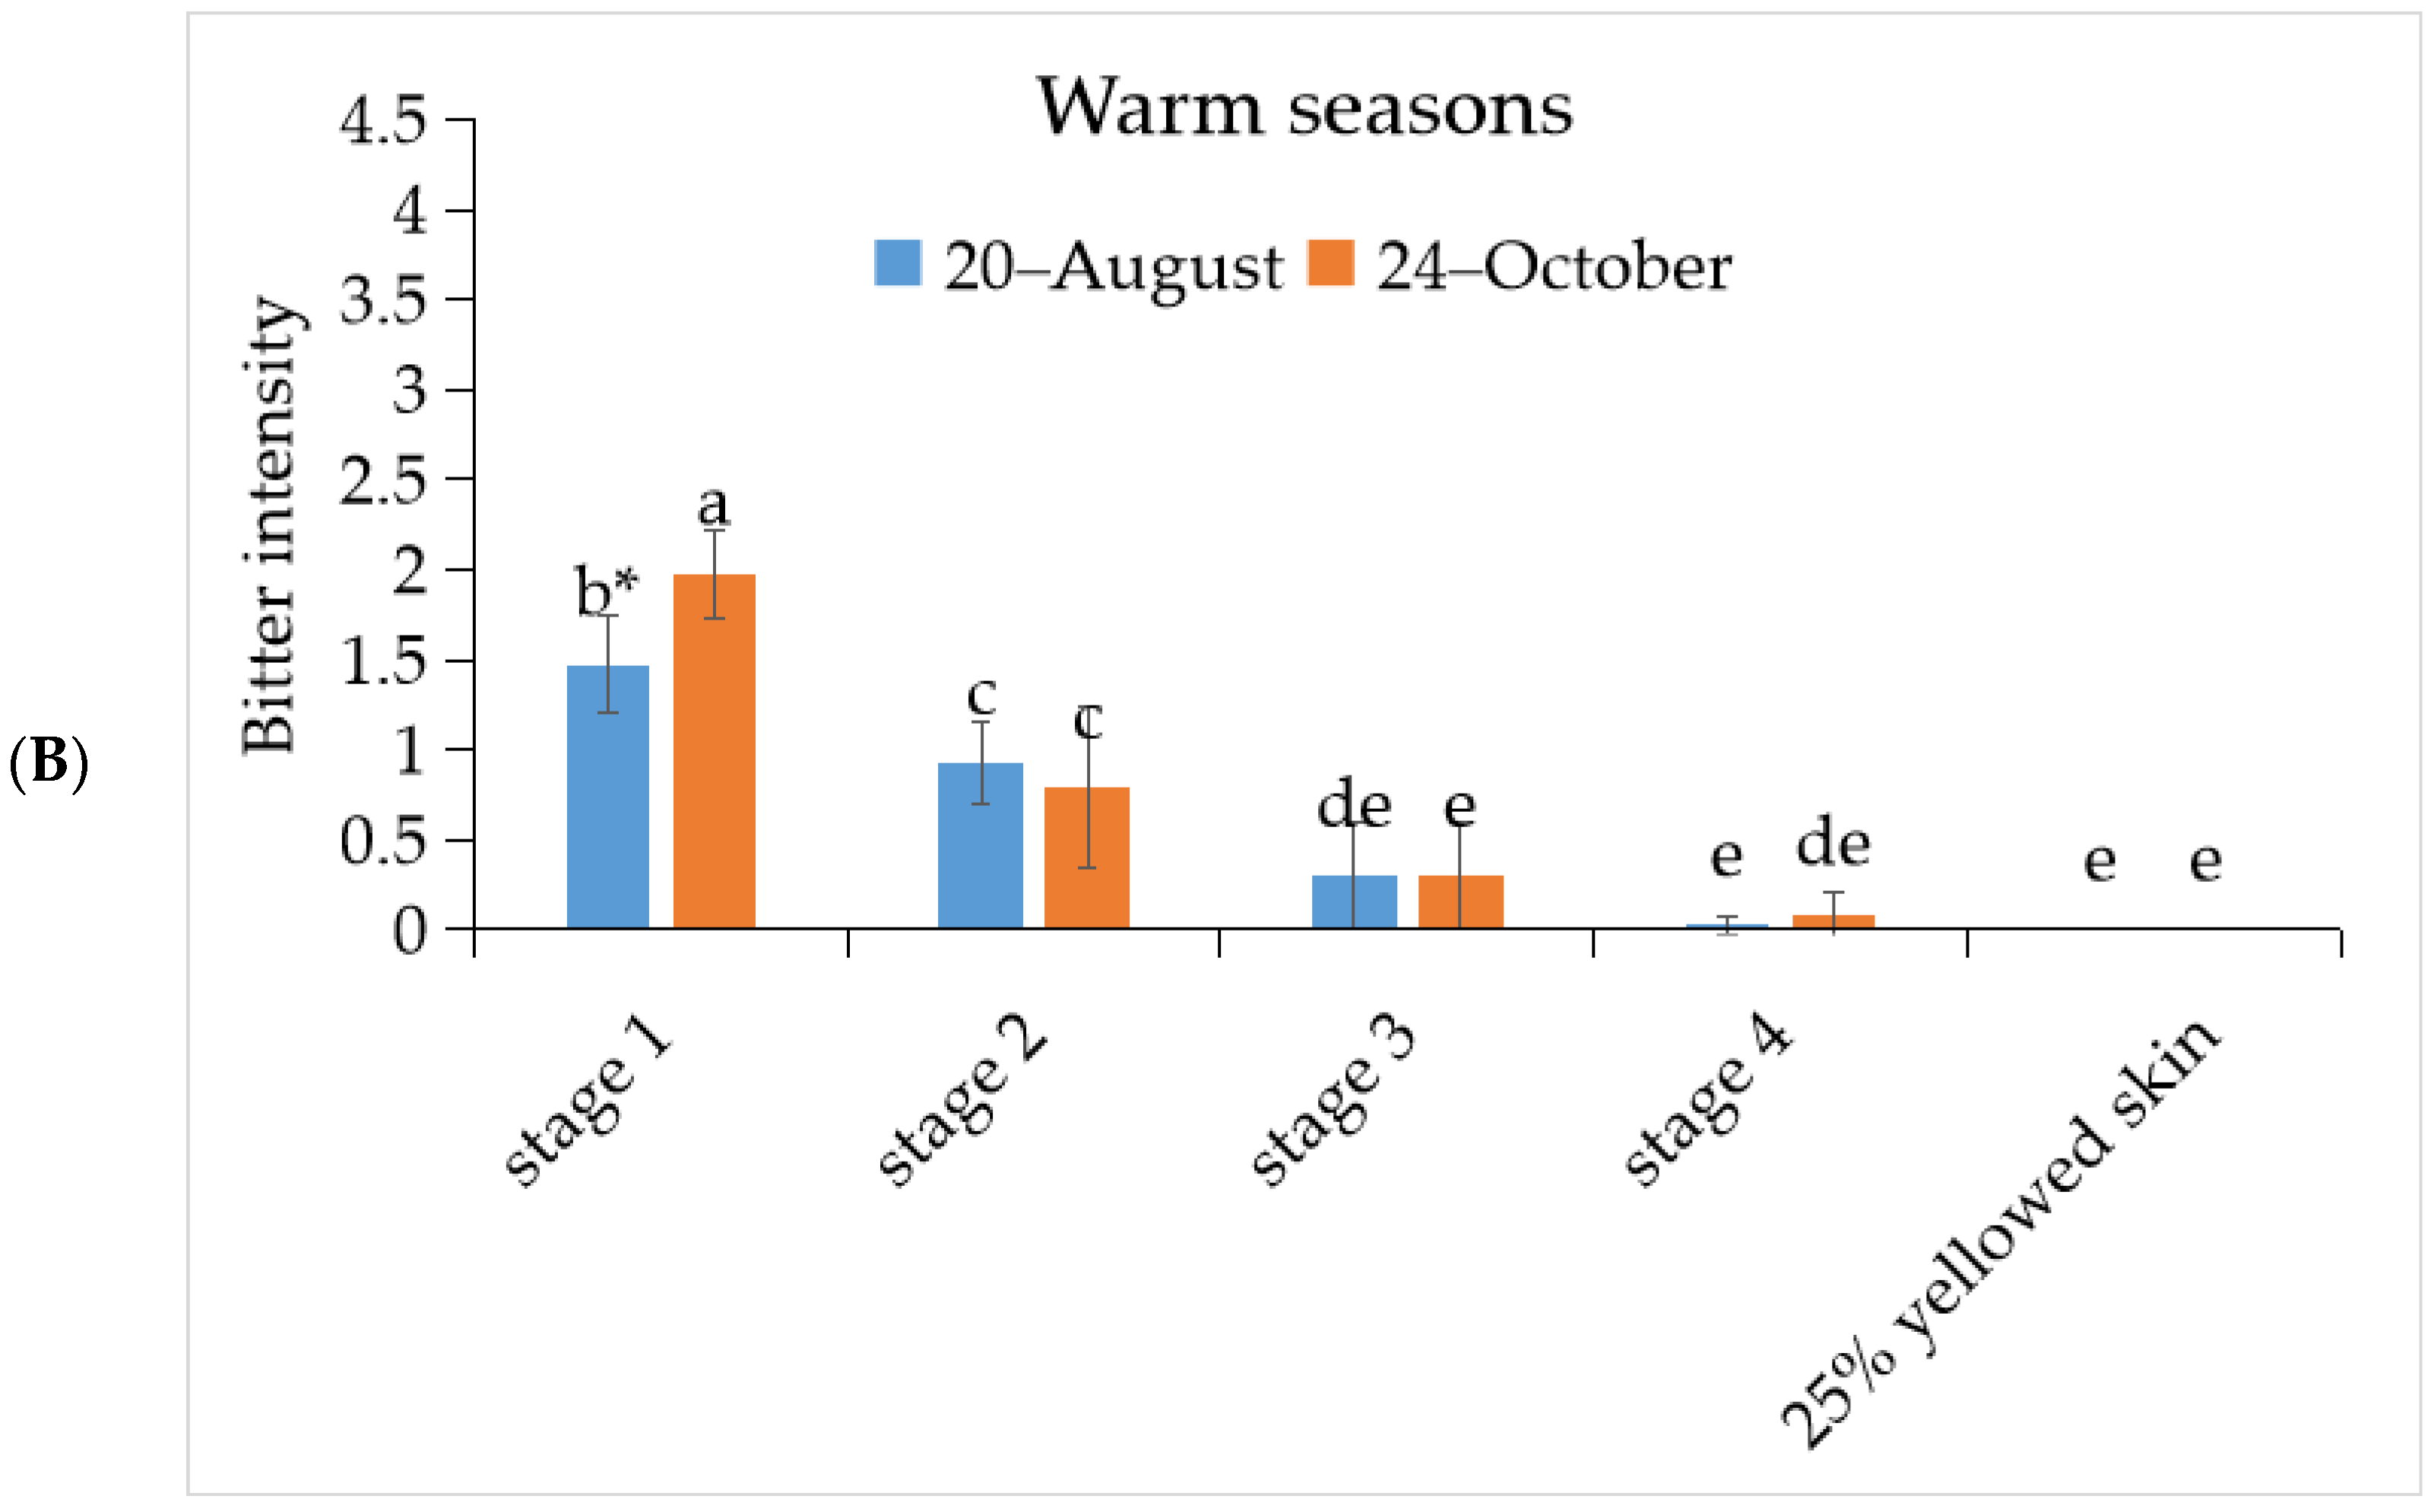
In Figure 1 the results showed that the warm season had less 7 node fruits than the cool season. In the bitterness intensity investigation, the results found that both warm and cool season fruits decreased in bitterness when the fruits were mature. Furthermore, the strongest bitterness intensity was found in stage 1 fruits, in which warm season fruits were around 1.5–1.9 and cool season fruits were around 3.5–3.9. In addition, when comparing the bitterness intensity between seasons, it showed that cool season fruits presented the strongest bitterness intensity. In warm the season, the bitterness intensity value in stage 1 fruit development (1.5–1.9) was equal to stage 3 fruits in the cool season (1.3–1.8). Papaya fruits in the 25% yellowed skin development stage, both in warm and cool seasons, showed no bitter taste.

3.2. The Investigation of Phenylalanine and Cyanogenic Glucoside Content in ‘Tainung No. 2’ Papaya Fruit under Different Development Stage during Warm and Cool Seasons

The observation of phenylalanine content in both seasons found that phenylalanine content was decreased in the first three stages and slightly increased at the fourth stage and decreased again (Figure 1A,B). The highest phenylalanine content was found at first fruit development stage (7.74–10.3 mg/g DW) in the cool season (Figure 2A), while in warm season the highest phenylalanine content was found in stage four development (5.2–5.95 mg/g DW) (Figure 2B). Overall, phenylalanine content and bitterness intensity both in warm and cool seasons showed similar tendencies (Figure 2A,B).
In contrast, cyanogenic glucoside content in the cool season showed the highest level at 25% yellowed skin fruit (0.015–0.017 Cn mmole/g DW) (Figure 2C), while in the warm season it showed the highest content at stage 3 and 4 fruit development (0.0156–0.018 Cn mmole/g DW) (Figure 2D). The lowest content was found in stage 1 fruit development in both seasons and showed opposite tendency with bitterness intensity (Figure 2C,D).

3.3. The Investigation of Glucosinolate and BITC Content in ‘Tainung No. 2’ Papaya Fruit under Different Development Stage during Warm and Cool Seasons

The results in Figure 3A,B reveal that the investigation of glucosinolate content showed higher content in the cool season than in the warm season in every development stage. Besides this, its content in both seasons also showed the highest in stage 1 fruit development and decreased when the fruits were mature, and showed similar tendency with bitterness intensity (Figure 1A,B).
In glucosinoltae derivatives, Benzylisothiocyanate (BITC) content showed the opposite tendency with glucosinolate (Figure 3). In addition, their content in each development stage showed no big difference in the cool season (0.03–0.039 μmole/g FW), while the BITC content in the warm season showed a slight inclined when the fruits were mature (0.035–0.052 μmole/g FW) (Figure 3C,D).

3.4. The Investigation of Bitterness Intensity and Glucosinolate Content in Different Lines/Cultivars of Papaya Fruit at First Stage Fruit Development in Warm and Cool Seasons

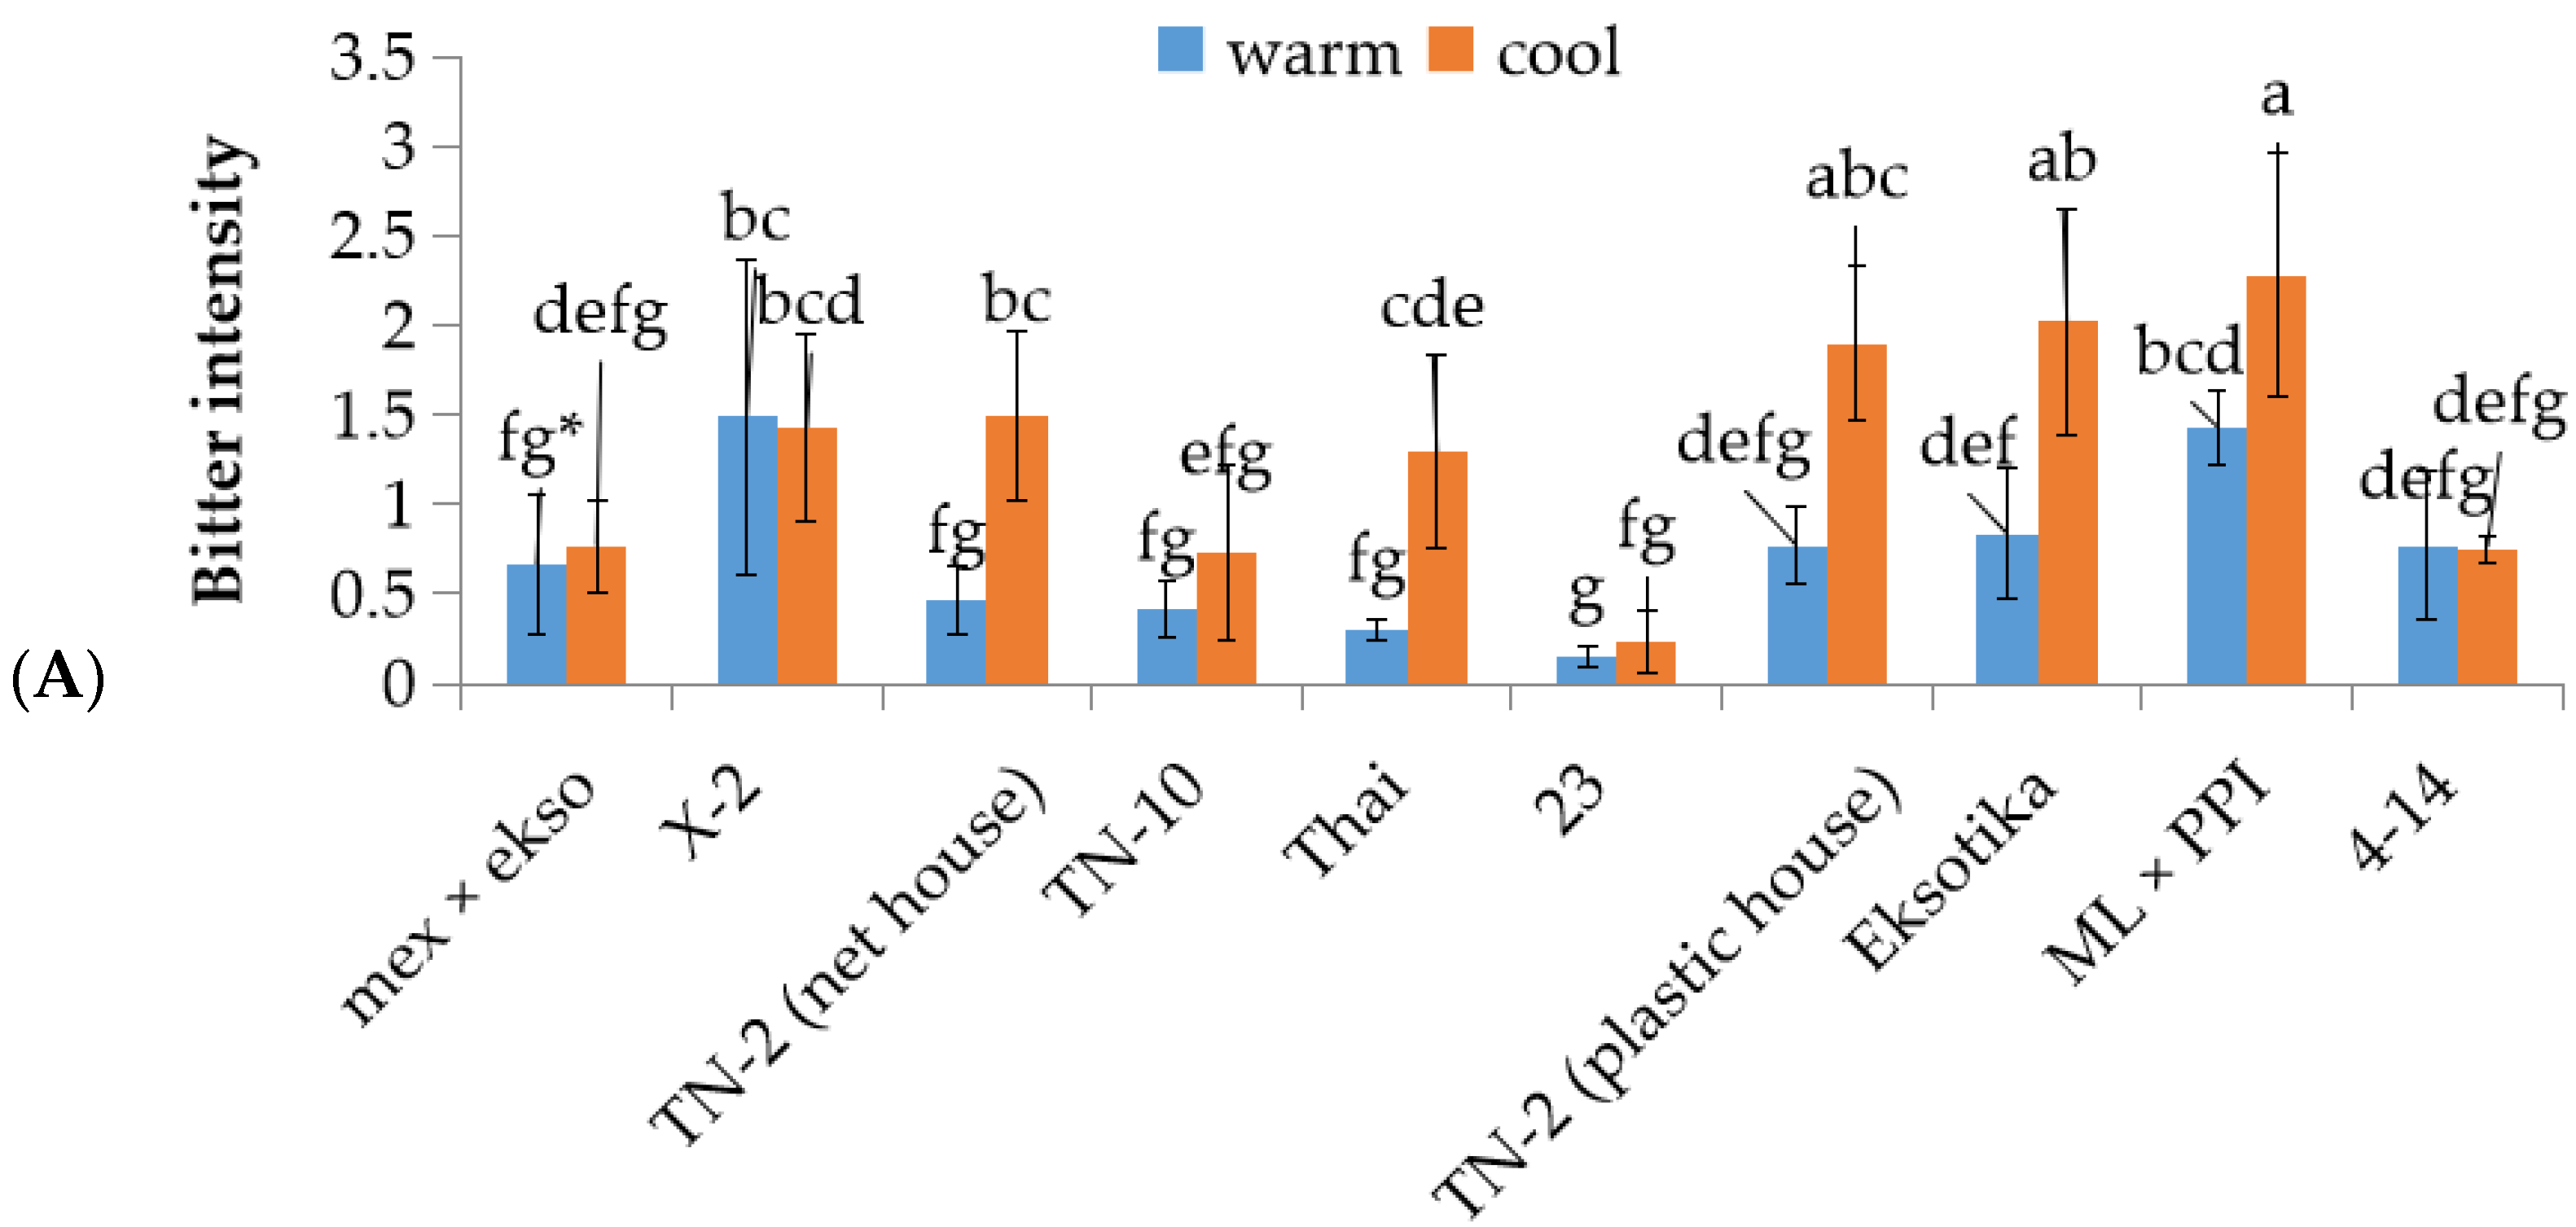
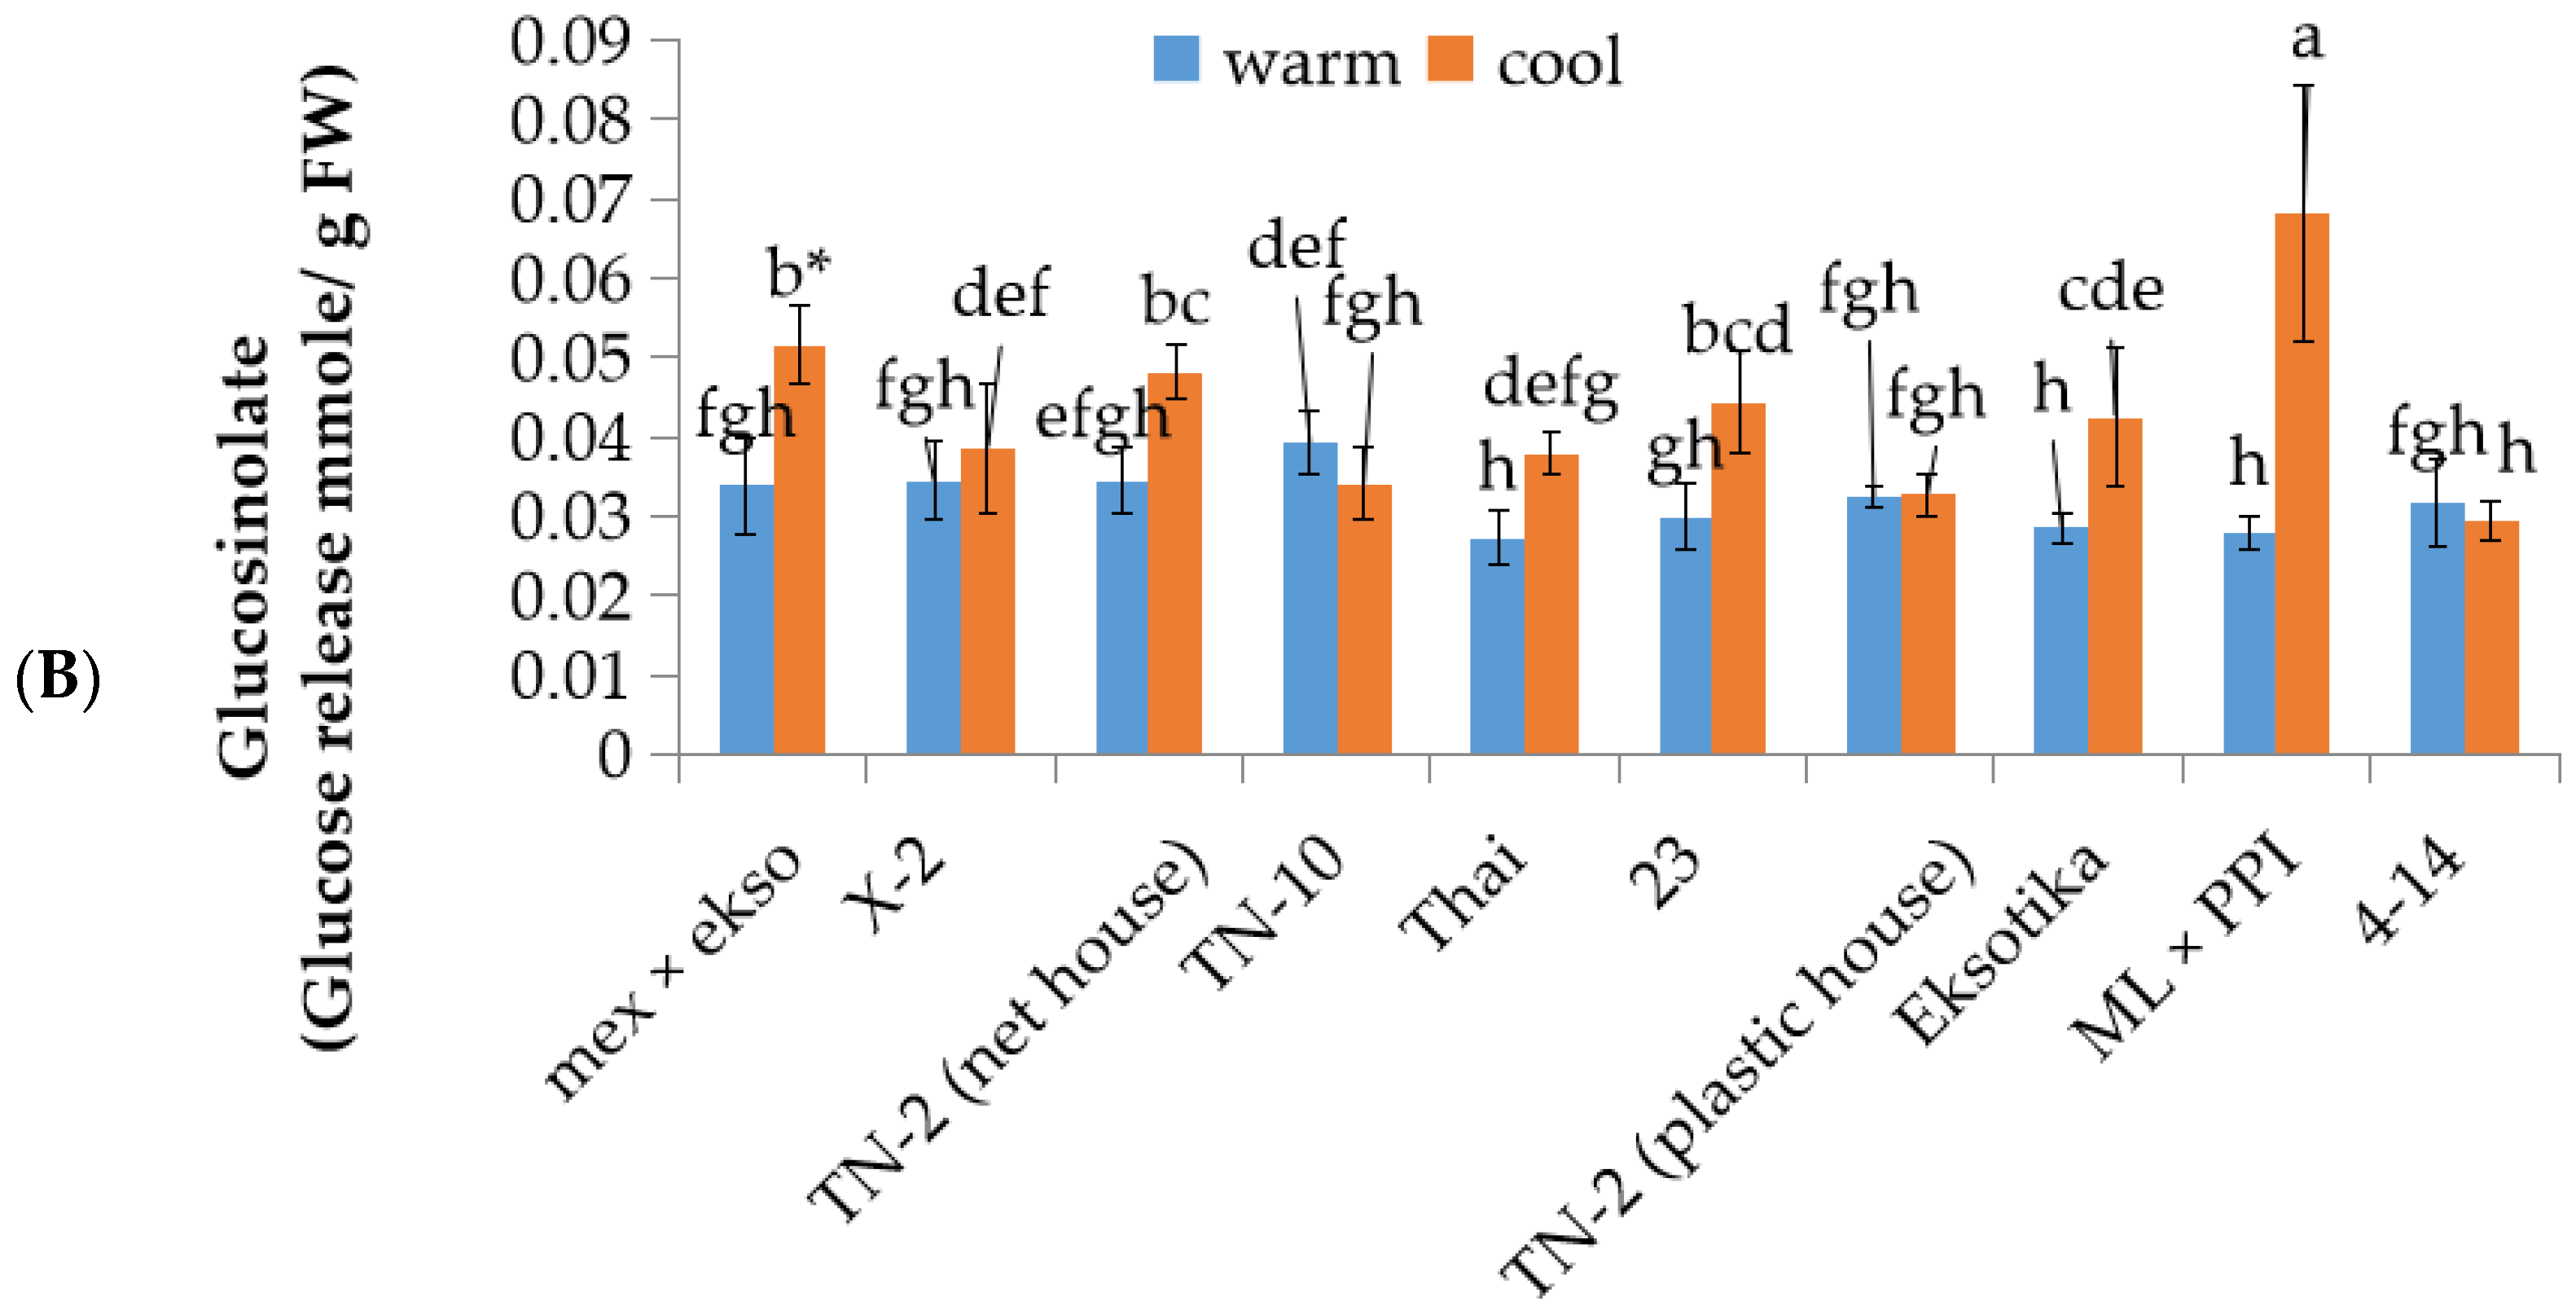
The results of Figure 4A present the investigation of bitter taste in different papaya lines/cultivars, in which ‘X-2’, ’23’, and ‘4-14’ showed no differences in between seasons while other lines/cultivars showed higher bitterness intensity in the cool season. However, glucosinolate content investigation found that all of the lines/cultivars showed similar tendency with bitter taste, except ‘TN-2’ (plastic house) where the bitter taste was higher in the cool season than the warm season but its glucosinolate content showed no differences between seasons (Figure 4A,B). Some papaya lines/cultivars such as ‘mex × ekso’, ‘TN-10’ and ‘23’ had low bitterness intensity but had high glucosinolate content.

3.5. Correlation between Bitterness Intensity of Papaya Fruits with Phenylalanine, Cyanogenic Glucoside, Glucosinolate, and BITC Content

The correlation between bitterness intensity with bitter substances is shown in Table 1. Both cyanogenic glucoside and BITC showed negative correlation with bitterness intensity (−0.54 *** and −0.46 ***), which meant the higher the content of both substances, the weaker the bitterness intensity. The phenylalanine content showed a positive correlation with correlation value of about 0.35 ***. In glucosinolate observation, the high correlation value was found in papaya fruits under different development stages (0.85 ***). However, when comparing the glucosinolate content between lines/cultivars with bitterness intensity, the correlation value decreased to 0.44 *** but still showed positive correlation to bitter taste.

4. Discussion

Based on Kunisuke et al.’s [16] and Scharbert and Hofmann’s [32] research, phenylalanine is also one of the substances that could cause bitter taste in products. In addition, according to literature research, the bitter taste threshold of phenylalanine was about 0.69 mg/mL water [16] and 0.95 mg/mL water [32] and phenylalanine content in this research was around 0.22–1.03 mg/g FW (Figure 2A,B) which correlated with bitter taste (r = 0.35 ***) (Table 1). Though phenylalanine content had positive correlation with bitter taste, only the fruits that were harvested on April 22nd reached the threshold concentration (Figure 2A). Moreover, their tendencies in different seasons showed slightly increased at stage 4 fruit development (Figure 2A,B). Therefore, phenylalanine content played a minor role in papaya’s bitter taste and probably acted as precursor to bitter substances: glucosinolate and cyanogenic glucoside [15].
Cyanogenic glucoside investigation showed an opposite tendency with bitterness intensity, where mature fruits had higher content than immature fruits (Figure 2C,D). Furthermore, the comparison of its contents in different seasons showed minor differences, where cool season fruits’ content were about 1.01–1.74 Cn µmole/g FW and warm season fruits’ were about 1.12–1.82 Cn µmole/g FW (Figure 2C,D). Though it is one of the bitterness factors in almonds [20], cassava [21], and bamboo [33], the analysis showed negative correlation with bitter taste (Table 1) in this research. These results imply that cyanogenic glucoside may be not the factor that causes bitter taste in fruit.
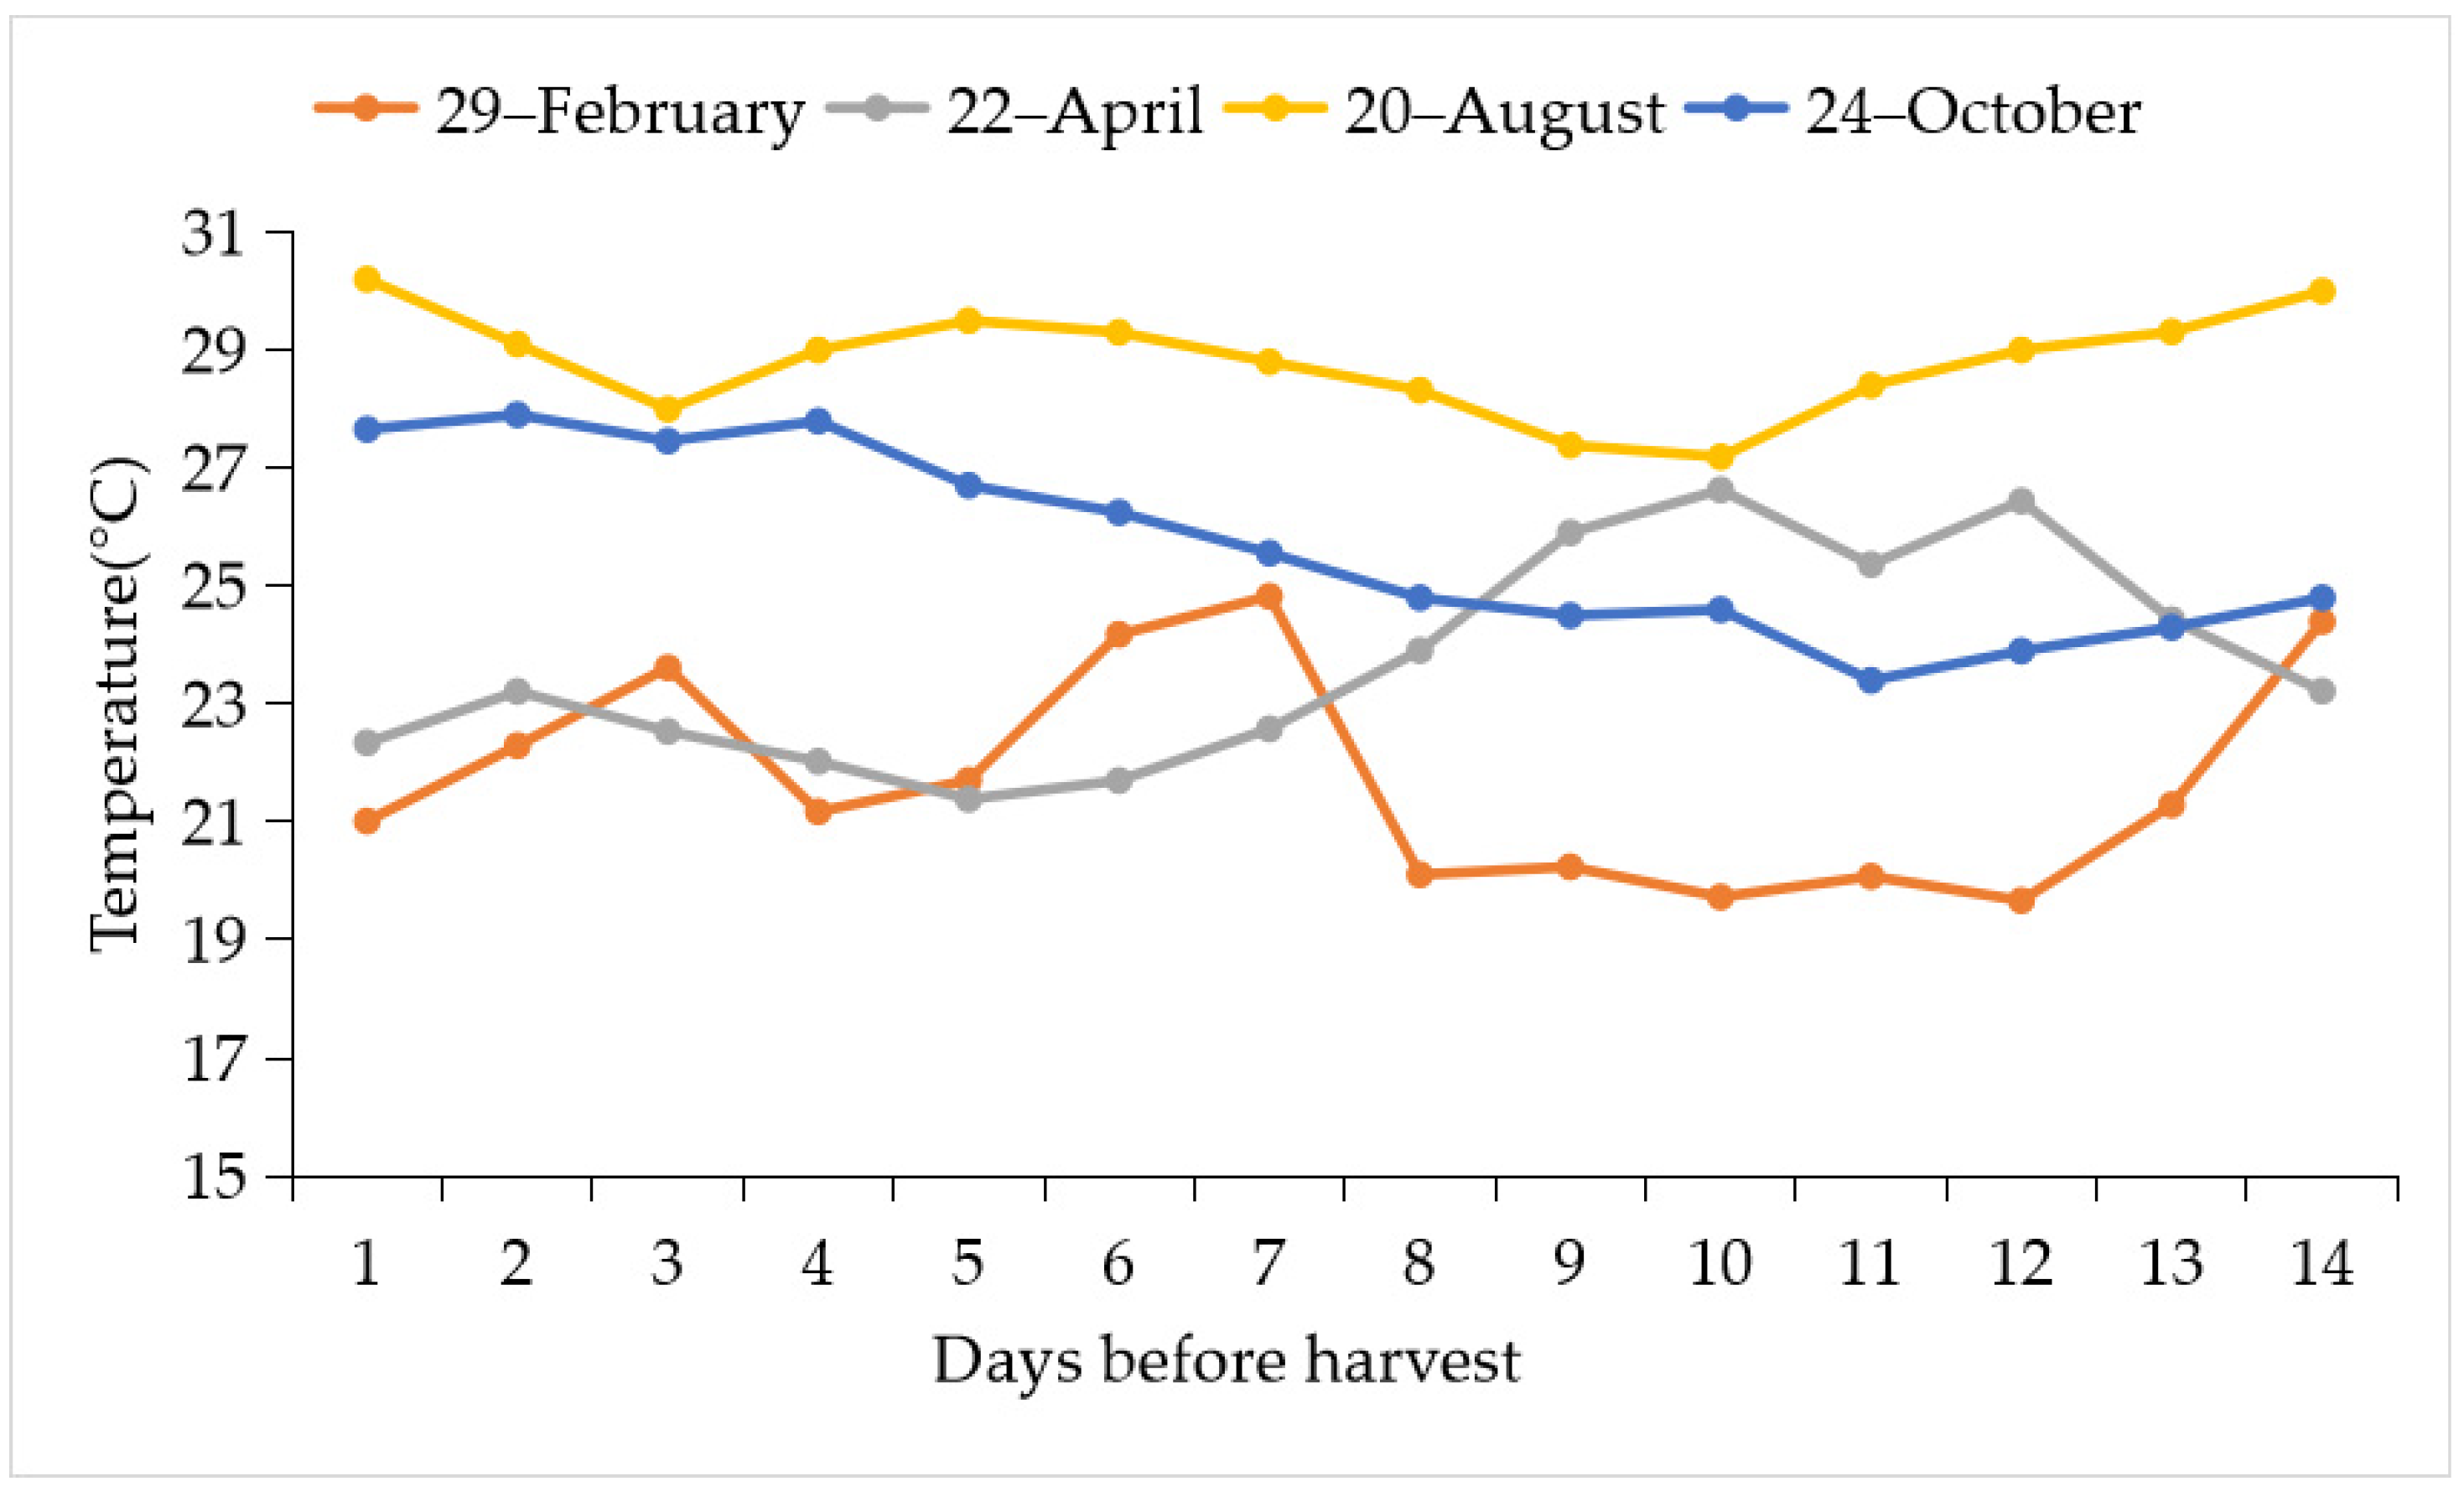
Glucosinolate is one of the factors that causes bitterness in plants of Brassicaceae such as Brassica oleracea [34], Diplotaxis tenuifolia and Eruca sativa [35], and brussels sprouts [8]. During investigation of glucosinolate content of papaya fruits under different development stages, it showed the highest content at the first development stage and decreased when the fruits were matured (Figure 3A,B) and showed positive correlation with bitterness intensity (r = 0.805 ***) (Table 1). In addition, the glucosinolate content in cool season fruits were also higher than warm season fruits and consistent with their bitter intensity (Figure 1), which is concomitant with Hodges et al. [34], Hansen et al. [36], and Chowdhury et al. [37], where low temperature could enhance glucosinolate accumulation. Moreover, Charron et al.’s [13] research about the correlation between glucosinolate content with temperature in ten cultivars of B. oleracea also had a positive relationship and showed similar results with this research (Figure A2).
The investigation of glucosinolate content in different lines/cultivars also had positive correlation with bitterness intensity (Table 1). However, some of the lines/cultivars showed that glucosinolate had no correlation with bitter taste, for example, ‘Mex × ekso’, ‘23’, ‘4-14’, and ‘TN-2’ (plastic house) (Figure 4). This suggested that glucosinolate might not be the only one that causes bitter taste in papaya fruit. Moreover, this assumption could also be proved in development stage investigation, where the bitterness intensity in stage 1 and 2 increased to 41% but the glucosinolate content only increased to 8.5% (Figure 1 and Figure 3). In addition, the glucosinolate accumulation seemed affected not only by the temperature. This result can be seen in ‘TN-2’ that was cultured in different greenhouses (plastic house and net house) (Figure 4), suggesting that light also could affect the glucosinolate accumulation (data not recorded). Similar results have also been found in other plants such as watercress, where glucosinolate content was enhanced under red light [12]; broccoli sprouts under UV light [38]; and Brassica rapa exposed under long light [39]. However, there have also been contradictions about the glucosinolate accumulation in low temperature. In Justen and Fritz’s research [40], BrMYB transcription factors investigation in turnip also showed that high temperature induced glucosinolate content. Furthermore, Pereira et al.’s [41] investigation showed that higher glucosinolate content of broccoli occurred at 33.1° and 11.3 °C constant temperature.
Glucosinolate degrading compounds, BITC content was slightly (0.035–0.052 μmole/g FW) higher in the warm season than the cool season (0.03–0.039 μmole/g FW) (Figure 2C,D). This suggests that low temperature inhibited the BITC accumulation [42]. Besides this, BITC content showed negative correlation with bitter taste (Table 1), which confirmed that BITC was not the factor that caused the bitter taste in papaya fruits. Instead, BITC seemed to relate with pungency [35].

5. Conclusions

To conclude, the investigation of cyanogenic glucoside and BITC content showed negative correlation with bitter taste (r = −0.54 *** and −0.46 ***). In phenylalanine analysis, though it showed positive correlation with bitter intensity (r = 0.35 ***), only the fruits harvested on April 22nd reached the bitter taste threshold concentration. Moreover, phenylalanine content increased at the third stage of fruit development but the bitterness intensity decreased, suggesting that phenylalanine only played a minor role in papaya bitterness and mainly acted as cyanogenic glucoside and glucosinolate precursors. In glucosinolate investigation in different development stages, it showed high positive correlation with bitterness intensity (r = 0.805 ***). However, the r value in papaya lines/cultivars correlation decreased (0.44 ***). These results suggest that glucosinolate was not the only bitter substance that caused bitter taste in immature papaya fruits.

Author Contributions

C.-C.S., H.-L.L. and I.P.J.J. conceived and designed the research. I.P.J.J., H.-L.L. and C.-C.S. performed the experiments and analyzed all of the data. I.P.J.J., H.-L.L. and C.-C.S. wrote the paper. All authors have read and agreed to the published version of the manuscript.

Funding

This research received no external funding.

Institutional Review Board Statement

Not applicable.

Informed Consent Statement

Not applicable.

Data Availability Statement

The data presented in this study are available on request from the corresponding author. The data are not publicly available due to privacy.

Conflicts of Interest

The authors declare no conflict of interest.

Appendix A

Figure A1. Graphical scheme of study approach.
Horticulturae 08 00198 g0a1
Figure A2. Fourteen days of average temperature of papaya fruits before harvest.
Horticulturae 08 00198 g0a2

References

  1. Gonsalves, D. Transgenic papaya: Development, release, impact and challenges. Adv. Virus Res. 2006, 67, 317–354. [Google Scholar] [PubMed]
  2. Paull, R.E.; Nishijima, W.; Reyes, M.; Cavaletto, C. Postharvest handling and loss during marketing of papaya (Carica papaya L.). Postharvest Biol. Technol. 1997, 11, 165–179. [Google Scholar] [CrossRef]
  3. Wang, R.H. ‘Kaoshiung No 9’ papaya: A new cultivar for papaya production. Res. Bull. Kdares. 2014, 24, 2. [Google Scholar]
  4. Mendoza, E.M.T. Development of functional foods in the Philippines. Food Sci. Technol. Res. 2007, 13, 179–186. [Google Scholar] [CrossRef] [Green Version]
  5. Mano, R.; Ishida, A.; Ohya, Y.; Todoriki, H.; Takishita, S. Dietary intervention with Okinawan vegetables increased circulating endothelial progenitor cells in healthy young woman. Atherosclerosis 2009, 204, 544–548. [Google Scholar] [CrossRef]
  6. Sone, T.; Sakamoto, N.; Suga, K.; Imai, K.; Nakachi, K.; Sonlkin, P.; Sonklin, P.; Lipigorngoson, S.; Limtrakul, P.; Suttajit, M. Comparison of diets among elderly female residents in two suburban districts in Chiang Mai Provence, Thailand, in dry season-survey on high- and low-risk district of lung cancer incidence. Appl. Hum. Sci. 1998, 17, 49–56. [Google Scholar] [CrossRef] [Green Version]
  7. Fahey, J.W.; Zalcmann, A.T.; Talalay, P. The chemical diversity and distribuition of glucosinolates and isothiocyanates among plants. Phytochemistry 2001, 56, 5–51. [Google Scholar] [CrossRef]
  8. Doorn, H.E.; Kruk, G.C.V.D.; Holst, G.J.V.; Riujs, N.C.M.E.R.; Postma, E.; Groeneweg, B.; Jongen, W.H.F. The glucosinolates sinigrin and progoitrin are important determinants for taste preference and bitterness of brussels sprouts. J. Sci. Food Agric. 1998, 78, 30–38. [Google Scholar] [CrossRef]
  9. Lazzeri, L.; Leoni, O.; Manici, L.M. Biocidal plant dried pellets for biofumigation. Ind. Crop Prodt. 2004, 20, 59–65. [Google Scholar] [CrossRef]
  10. Zhao, B.; Seow, A.; Lee, E.J.D.; Poh, W.T.; Teh, M.; Eng, P.; Wang, Y.T.; Tan, W.C.; Yu, M.C.; Lee, H.P. Dietary isothiocyanates, glutathione S-transferase-M1, -T1 polymorphisms and lung cancer risk among Chinese women in Singapore. Cancer Epidemiol. Biomarkers Prev. 2001, 10, 1063–1067. [Google Scholar]
  11. William, D.J.; Pun, S.; Chaliha, M.; Scheelings, P.; O’Hare, T. An unusual combination in papaya (Carica papaya): The good (glucosinolates) andthe bad (cyanogenic glycosides). J. Food Comp. Anal. 2003, 29, 82–86. [Google Scholar] [CrossRef]
  12. Engelen-Eigles, G.; Holden, G.; Cohen, J.D.; Gardner, G. The effect of temperature, photoperiod, and light quality on gluconasturtiin concentration in watercress (Nasturtium officinale R. Br.). J. Agric Food Chem. 2006, 54, 328–334. [Google Scholar] [CrossRef] [PubMed]
  13. Charron, C.S.; Saxton, A.M.; Sams, C.E. Relationship of climate and genotype to seasonal variation in the glucosinolate-myrosinase system. I. Glucosinolate content in ten cultivars of Brassica oleracea grown in fall and spring seasons. J. Sci. Food Agric. 2005, 85, 671–681. [Google Scholar] [CrossRef]
  14. Rossetto, M.R.M.; Nascimento, J.R.O.D.; Purgatto, E.; Fabi, J.P.; Lajolo, F.M.; Cordenunsi, B.R. Benzylglucosinolate, benzylisothiocyanate, and myrosinase activity in papaya fruit during development and ripening. J. Agric. Food Chem. 2008, 56, 9592–9599. [Google Scholar] [CrossRef]
  15. Bennett, R.N.; Kiddle, G.; Wallsgrove, R.M. Biosynthesis of benzylglucosinolate, cyanogenic glucoside, and phenylpropanoids in Carica papaya. Phytochemistry 1997, 45, 59–66. [Google Scholar] [CrossRef]
  16. Kunisuke, I.; Amino, Y.; Kohmura, M.; Ueda, Y.; Kuroda, M. Human-interactions-taste. Compr. Nat. Prod. II 2010, 4, 631–671. [Google Scholar]
  17. Nafisi, M.; Sonderby, I.E.; Hansen, B.G.; Flores, F.G.; Eldin, H.H.N.; Norholm, M.H.H.; Jensen, N.B.; Li, J.; Halkier, B.A. Cytochromes P450 in the biosynthesis of glucosinolate and indole alkaloids. Phytochem. Rev. 2006, 5, 331–346. [Google Scholar] [CrossRef]
  18. Modhi, O.A.; Khamis, G.; AbdElgawad, H.; Mohammed, A.E.; Sheteiwy, M.S.; Elobeid, M.M.; Saleh, A.M. 2021-Lepidium sativum sprouts grown under elevated CO2 hyperaccumulate glucosinolates and antioxidants and exhibit enhanced biological and reduced antinutritional properties. Biomolecules 2021, 11, 1174. [Google Scholar]
  19. Gleadow, R.M.; Møller, B.L. Cyanogenic glycosides: Synthesis, physiology, and phenotypic plasticity. Annu. Rev. Plant Biol. 2014, 65, 155–185. [Google Scholar] [CrossRef]
  20. Dicenta, F.; Martinez-Gomez, P.; Grane, N.; Martin, M.L.; Leon, A.; Canovas, J.A.; Berenguer, V. Relationship between cyanogenic compounds in kernels, leaves, and roots of sweet and bitter kernelled almonds. J. Agric. Food Chem. 2002, 50, 2149–2152. [Google Scholar] [CrossRef]
  21. Linley, C.K.; Brimer, L.; Saka, J.D.K.; Mhone, A.R.; Mkumbira, J.; Johansson, L.; Bokanga, M.; Mahungu, N.M.; Rosling, H. Bitter taste in cassava roots correlates with cyanogenic glucoside levels. Sci. Food Agric. 2004, 84, 581–590. [Google Scholar]
  22. Gao, Q.; Jiang, H.; Tang, F.; Cao, H.Q.; Wu, X.W.; Qi, F.F.; Sun, J.; Yang, J. Evaluation of the bitter components of bamboo shoots using a metabolomics approach. Food Funct. 2019, 10, 90–98. [Google Scholar] [CrossRef]
  23. Anna, S.; Oleszek, W. Changes of cyanogenic glucosides in white clover (Trifolium repens L.) during the growing season. J. Agric. Food Chem. 1997, 45, 4333–4336. [Google Scholar]
  24. Mateja, S.; Stampar, F.; Veberic, R.; Petkovsek, M.M. Cyanogenic glycosides and phenolics in apple seeds and their changes during long term storage. Sci. Hortic. 2019, 255, 30–36. [Google Scholar]
  25. Ping, D.; Cui, B.; Zhu, H.; Phommakoun, B.; Zhang, D.; Li, Y.; Zhao, F.; Zhao, Z. Accumulation pattern of amygdalin and prunasin and its correlation with fruit and kernel agronomic characteristics during apricot (Prunus armeniaca L.) kernel development. Foods 2021, 10, 397. [Google Scholar]
  26. Seigler, D.S.; Pauli, G.F.; Nahrstedt, A.; Leen, R. Cyanogenic allosides and glucosides from Passiflora edulis and Carica papaya. Phytochemistry 2002, 60, 873–882. [Google Scholar] [CrossRef]
  27. Elin, S.O.; Jorgensen, L.B.; Jaroszewski, J.W. Cyanogenesis in glucosinolate producing plants: Carica papaya and Carica quercifolia. Phytochemistry 2002, 60, 269–273. [Google Scholar]
  28. Ambrose, J.A. A shortened method for the fluorometric determination of phenylalanine. Clin. Chemi. 1969, 15, 15–23. [Google Scholar] [CrossRef]
  29. Doorn, H.E.V.; Kruk, G.C.V.D.; Holst, G.J.V. Large scale determination of glucosinolates in brussels sprouts samples after degradation of endogenous glucose. J. Agric. Food Chem. 1999, 47, 1029–1034. [Google Scholar] [CrossRef]
  30. Zhang, Y.; Cho, C.C.; Posner, G.H.; Talalay, P. Spectroscopic quantitation of organic isothiocyanates by cyclocondensation with vicinal dithiols. Anal. Biochem. 1992, 205, 100–107. [Google Scholar] [CrossRef]
  31. Bradbury, J.H.; Bradbury, M.G.; Egan, S.V. Comparison of methods of analysis of cyanogens in cassava. Acta Hort. 1994, 375, 87–96. [Google Scholar] [CrossRef]
  32. Scharbert, S.; Hofmann, T. Molecular definition of black tea taste by means of quantitative studies, taste reconstitution, and omission experiments. J. Agric. Food Chem. 2005, 53, 5377–5384. [Google Scholar] [CrossRef]
  33. Akihiro, I.; Fierro, F.; Chaney, M.E.; Lauterbur, M.E.; Hayakawa, T.; Tosi, A.T.; Niv, M.Y.; Imai, H. Lowered sensitivity of bitter taste receptors to β-glucosidase in bamboo lemurs: An instance of parallel and adaptive functional decline in TAS2R1. Proc. R. Soc. B 2021, 288, 20210346. [Google Scholar]
  34. Hodges, D.M.; Munro, K.D.; Forney, C.F.; McRae, K.B. Glucosinolate and free sugar content in cauliflower (Brassica oleracea var. botrytis cv. Freemont) during controlled-atmosphere storage. Postharvest Biol. Technol. 2006, 40, 123–132. [Google Scholar] [CrossRef]
  35. Bell, L.; Lignou, S.; Wagstaff, C. High glucosinolate content in rocket leaves (Diplotaxis tenuifolia and Eruca sativa) after multiple harvests is associated with increased bitterness, pungency, and reduced consumer liking. Foods 2020, 9, 1799. [Google Scholar] [CrossRef] [PubMed]
  36. Hansen, M.; Moller, P.; Sorensen, H.; de Trejo, M.C. Glucosinolates in broccoli stored under controlled atmosphere. J. Amer. Soc. Hort. Sci. 1995, 120, 1069–1074. [Google Scholar] [CrossRef] [Green Version]
  37. Chowdhury, M.; Kiraga, S.; Islam, N.; Ali, M.; Reza, N.; Lee, W.H.; Chung, S.O. Effects of temperature, relative humidity, and carbon dioxide concentration on growth and glucosinolate content of kale grown in a plant factory. Foods 2021, 10, 1524. [Google Scholar] [CrossRef] [PubMed]
  38. Melissa, M.R.; Nair, V.; Benavides, J.; Zevallos, L.C.; Velazquez, D.A.J. UVA, UVB light doses and harvesting time differentially tailor glucosinolate and phenolic profiles in broccoli sprouts. Molecules 2017, 22, 1065. [Google Scholar]
  39. Park, J.E.; Kim, J.; Purevdorj, E.; Son, Y.J.; Nho, C.W.; Yoo, G. Effects of long light exposure and drought stress on plant growth and glucosinolate production in pak choi (Brassica rapa subsp. chinensis). Food Chem. 2021, 340, 128167. [Google Scholar] [CrossRef]
  40. Justen, V.L.; Fritz, V.A. Temperature-induced glucosinolate accumulation is associated with expression of BrMYB transcription factors. HortScience 2013, 48, 47–52. [Google Scholar] [CrossRef] [Green Version]
  41. Pereira, F.M.V.; Rosa, E.; Fahey, F.W.; Stephenson, K.K.; Carvalho, R.; Aires, A. Influence of temperature and ontogeny on the levels of glucosinolates in broccoli (Brassica oleracea var. italica) sprouts and their effect on the induction of mammalian phase 2 enzymes. J. Agric. Food Chem. 2002, 50, 6239–6244. [Google Scholar] [CrossRef] [PubMed]
  42. Kosson, R.; Horbowicz, M. Effect of long term storage on some nutritive component and isothiocyanate content in roots of two horseradish types. Veg. Crops Res. Bull. 2008, 69, 155–164. [Google Scholar] [CrossRef] [Green Version]
Figure 1. Bitterness intensity in different maturity of papaya fruit: (A) Cool season (B) Warm season. Data are mean ± SD, n = 4. * Mean statistical data within a column were obtained by Duncan’s test at the 5% level (same letters means no significance).
Horticulturae 08 00198 g001aHorticulturae 08 00198 g001b
Figure 2. The correlation of phenylalanine content (A,B) and cyanogenic glucoside content (C,D) with bitterness intensity in different maturity stages of papaya fruit during cool season and warm season. Data are mean ± SD, n = 4. * Mean statistical data within a column were obtained by Duncan’s test at the 5% level (same letters means no significance).
Horticulturae 08 00198 g002aHorticulturae 08 00198 g002b
Figure 3. The correlation of glucosinolate content (A,B) and BITC content (C,D) with bitterness intensity in different maturity stages of papaya fruit during cool and warm seasons. Data are mean ± SD, n = 4. * Mean statistical data within a column were obtained by Duncan’s test at the 5% level (same letters means no significannce).
Horticulturae 08 00198 g003aHorticulturae 08 00198 g003b
Figure 4. Bitterness intensity (A) and glucosinolate content (B) in different lines/cultivars of papaya fruit at first stage fruit development in the warm season and cool season. Data are mean ± SD, n = 4. * Mean statistical data within a column were obtained by Duncan’s test at the 5% level (same letters means no significance).
Horticulturae 08 00198 g004aHorticulturae 08 00198 g004b
Table 1. Correlation of bitterness intensity with phenylalanine, cyanogenic glucoside, glucosinolate, and BITC.
Bitter SubstancesBitterness Intensity (r)
Phenylalanine0.35 ***
Glucosinolate0.805 ***
Cyanogenic glucoside−0.54 ***
BITC−0.46 ***
Glucosinolate in different lines and cultivars0.44 ***
(***: p < 0.001).
Publisher’s Note: MDPI stays neutral with regard to jurisdictional claims in published maps and institutional affiliations.