Article

Development of Loop-Mediated Isothermal Amplification Assay for Rapid Detection and Analysis of the Root-Knot Nematode Meloidogyne hapla in Soil

by
Zahra Saad Omer
1,*,
Ann-Charlotte Wallenhammar
2 and
Maria Viketoft
3
1
Rural Economy and Agricultural Society, HS Konsult AB, R & D, P.O. Box 412, SE-751 06 Uppsala, Sweden
2
Rural Economy and Agricultural Society, HS Konsult AB, R & D, Gamla vägen 5G, SE-702 22 Örebro, Sweden
3
Department of Ecology, Swedish University of Agricultural Sciences (SLU), P.O. Box 7044, SE-750 07 Uppsala, Sweden
*
Author to whom correspondence should be addressed.
Horticulturae 2022, 8(2), 87; https://doi.org/10.3390/horticulturae8020087
Submission received: 16 December 2021 / Revised: 11 January 2022 / Accepted: 13 January 2022 / Published: 19 January 2022

Abstract

:
Soil analysis is crucial for estimating the risk of crop damage by the root-knot nematode Meloidogyne hapla. Here, we developed an analysis assay based on Loop-mediated Isothermal Amplification (LAMP). The LAMP primers were verified for specificity against 10 different nematode species. A manual soil DNA extraction, referred to as SKMM, was developed and compared with a FastDNA kit followed by DNA purification. DNA was extracted with both methods from artificially inoculated soils as well as from naturally infested soil collected from farm fields. The primers exclusively amplified DNA from M. hapla with both colorimetric and real-time LAMP. The detection limit was 193 gene copies and 0.0016 juveniles (12 pg µL−1) per reaction. DNA concentrations and purity (A260/A230) were significantly higher using the SKMM procedure compared with the kit. From the field samples collected in 2019, DNA was amplified from 16% of samples extracted with SKMM and from 11% of samples using the kit. Occurrence of M. hapla DNA was confirmed in soil samples from two out of six field soils in 2020 using both real-time LAMP and qPCR. In conclusion, the developed real-time LAMP is a fast and specific assay for detection and quantification of M. hapla DNA in soil.

1. Introduction

Root-knot nematodes (RKN) (Meloidogyne spp.) are an increasing problem in vegetable production and account for more than USD 100 billion annually in terms of yield loss worldwide [1]. While the RKN species Meloidogyne incognita, M. arenaria and M. javanica are the most prevalent species in southern Europe, other species such as M. hapla, M. chitwoodi and M. fallax are more adapted to temperate climates [2]. In Sweden, the northern root-knot nematode M. hapla is considered as the most predominant species, causing serious damage in vegetables, especially carrots [3]. The infected roots become deformed and unsaleable at the consumer level; therefore growers prefer to cultivate carrots in a root-knot nematode free soil. Carrot production is an important part of the Swedish horticulture industry accounting for 10% of the production value of horticultural crops [4]. Most carrots are grown in the southern parts of Sweden, especially in the provinces Scania and Gotland [4]. Potatoes, sugar beets and vegetables such as onions and lettuce are also host plants for M. hapla and are usually grown in the same crop rotation as carrots, consequently, M. hapla is constantly reproducing in soil [3]. In the last three years, M. chitwoodi and M. fallax were reported for the first time in Sweden in potato crops in southern Sweden (Swedish Board of Agriculture, Jönköping, Sweden). Both species are classified as quarantine pests by the European Plant Protection Organization (EPPO), which implies serious restrictions by the Swedish Board of Agriculture. To identify the presence of M. hapla and differentiate it from M. chitwoodi and M. fallax, it is important to have access to a reliable plant and soil analysis method.
Control strategies against RKNs in Swedish vegetable production rely mostly on crop rotation and weed control. Most weed species occurring in Sweden that have been tested as host plants for RKNs have been found to be susceptible [5]. To achieve a successful control strategy, soil analysis stands out as an extremely important measure to know when there is a need for management actions to keep nematode populations below the tolerance level. In practice, fields that can be cultivated with carrots without jeopardizing yield and quality, can only be selected based on soil analysis in autumn or before carrot cultivation in spring the following year. The patchy occurrence of M. hapla in fields suggests that it is better to take multiple soil samples instead of a pooled sample, to evaluate the nematode occurrence more accurately in a specific field.
For decades, identification of RKNs was based on nematode extraction from soil using methods such as the Baermann funnel method [6], followed by morphological identification [7]. This process, though useful, is time consuming, has low capacity, requires nematode expertise and focuses mostly on analyzing motile stages, which may under-estimate the nematode population in soil [8,9]. Protein-based techniques such as isozyme phenotypes are also used worldwide [10]. Recently, DNA-based techniques have been developed and are used for accurate identification of RKNs using PCR, real-time qPCR and random-amplified polymorphic DNA (RAPD) [11,12]. These techniques require highly pure DNA for downstream molecular identification of RKNs, especially when DNA is directly extracted from soil samples [13]. Loop-mediated Isothermal Amplification (LAMP) is a robust nucleic acid amplification technique initially developed for rapid diagnosis of bacteria, viruses, fungi and parasites in clinical samples [14]. LAMP is based on the amplification and specific detection of nucleic acids using four to six primers and a polymerase with auto-displacement activity under isothermal conditions. Simple detection can be achieved in LAMP by observing the turbidity of the solution resulting from accumulation of the byproduct, magnesium pyrophosphate [14]. Amplicons can also be visualized by adding DNA intercalating dyes, metal or pH indicators, which provide simple in-tube detection [15,16]. Recent advances in this technique facilitated performing real-time reactions with the possibility of on-site diagnosis and monitoring of plant pests and pathogens [17,18]. Being less sensitive to DNA inhibitors from samples [19], crude DNA extracts have been used in LAMP assays to analyze microbial DNA in plant and soil samples [20,21]. A few LAMP assays have so far been developed for detecting plant parasitic nematodes including Bursaphelenchus xylophilus, M. chitwoodi and M. fallax [22,23]. When it comes to M. hapla, a LAMP assay was developed based on RKN group-specific primers to detect DNA from M. hapla, but also M. incognita, M. arenaria and M. javanica [24]. Another LAMP assay was developed using M. hapla species-specific primers, however, specificity towards the closely related species M. chitwoodi and M. fallax was not investigated [25].
DNA extraction is the first step in molecular identification of nematodes in soil and usually follows two approaches, direct lysis of nematodes in the soil matrix [26] or an indirect approach where nematodes are first recovered from soil and then subjected to lysis [27]. Obtaining sufficiently pure DNA by direct extraction from soil is a real challenge due to risk of contamination with different soil substances that may co-purify with the DNA and inhibit downstream applications. LAMP is reported to be tolerant to impurities from soil [28], therefore, simple DNA extraction procedures can be satisfactory for DNA analysis in LAMP assays [21]. The aims of this study were to develop: (1) a simple and effective DNA extraction procedure to minimize the overall cost of the soil analysis for Swedish vegetable growers, and (2) a reliable soil analysis assay for M. hapla based on LAMP technology.

2. Materials and Methods

A soil analysis was developed based on a LAMP assay and a modified DNA extraction procedure. The sensitivity and specificity of the designed primers were tested against other nematode species with colorimetric and real-time LAMP and were compared to previously published LAMP primers for M. hapla. The DNA extraction procedure was optimized using naturally infested soil. The performance of the DNA extraction procedure was compared to commercial kits; one extraction kit followed by two purification kits, on artificially and naturally infested soils.

2.1. Nematodes and DNA Samples

Second-stage juveniles (J2s) of M. hapla were purchased from HZPC, Joure, the Netherlands, in 2016 and these have since then been kept in pots with tomato plants (cv. Moneymaker) in a climate chamber at the Ecology Center, Swedish University of Agricultural Sciences (SLU), Uppsala, Sweden. Juveniles to be used in the study were extracted by placing tomato roots chopped in approx. 1 cm-pieces on Whitehead and Hemming trays [29]. Similarly, root-lesion nematodes (Pratylenchus penetrans) for testing the specificity of primers were originally bought from Plant Research International Wageningen, Wageningen, the Netherlands, and kept in culture on maize and were collected in the same way as M. hapla [29]. The other nematode species for the specificity test were obtained from the Hushållningssällskapet Nematode Laboratory (HS NL), Lomma Alnarp, Sweden; juveniles of cyst nematodes Globodera spp. and Heterodera schachtii, the free-living nematodes Trichodorus spp. and Longidorus spp., and juveniles of the root-knot nematode M. chitwoodi (frozen). Individuals from each nematode species were hand-picked with a needle under a stereomicroscope and added into 200 µL PCR tubes with 10 µL of MQ water. The samples were analyzed directly or stored at −20 °C until use. DNA aliquots of M. arenaria, M. incognita and M. javanica were provided by Prof. Nicole Viaene, Instituut voor Landbouw-, Visserij- en Voedingsonderzoek (ILVO), Merelbeke, Belgium, and DNA of M. chitwoodi and M. fallax was provided by Intertek ScanBi Diagnostics (ISD), Lomma, Sweden (http://www.scanbidiagnostics.com, accessed on 10 January 2022).

2.2. The Design of LAMP Primers

DNA nucleotide sequences of M. hapla in GenBank at NCBI (National Center for Biotechnology Information, Bethesda, MD, USA) were investigated and compared with DNA homologous regions of the closely related species M. arenaria, M. chitwoodi, M. fallax, M. incognita, M. minor and M. naasi to identify potential target genomic regions. Among those, the nucleotide sequences of the alpha elongation factor gene (EF1-α), Heat shock protein 90 gene (Mh-hsp 90), parasitism protein 16D10 gene and Actin gene (Crt-1) were used for designing the primers. The DNA sequences were saved in FASTA format and the Multiple Sequence Alignment was performed with Clustal Omega (https://www.ebi.ac.uk/Tools/msa/clustalo, accessed on 5 January 2022). A LAMP primer set was designed from each gene using LAMP Designer software (PREMIER Biosoft, San Francisco, CA, USA) (http://www.premierbiosoft.com, accessed on 10 January 2022). The BLAST®-algorithm function was used for searching the GenBank for matches with other DNA sequences. One primer set was selected for further studies, LAMP-HSP (Table S1), and the aligned sequences are shown in Figure S1.

2.3. DNA Extraction from Second-Stage Juveniles

DNA used for testing the specificity of the HSP primers and generating standard curves for real-time LAMP (rt-LAMP) was prepared according to the reported method [30]. Meloidogyne hapla juveniles were collected in 0.2 mL sterile PCR tubes containing 5 μL of MQ water, 4 μL of 10× LAMP buffer (NEB, Ipswich, MA, USA), and 1 μL of proteinase K (1 mg/mL) (Thermo Scientific, Vilnius, Lithuania). The tubes were incubated at 65 °C for 60 min and consecutively at 95 °C for 10 min to inactivate proteinase K. The DNA samples were stored at −20 °C until use.

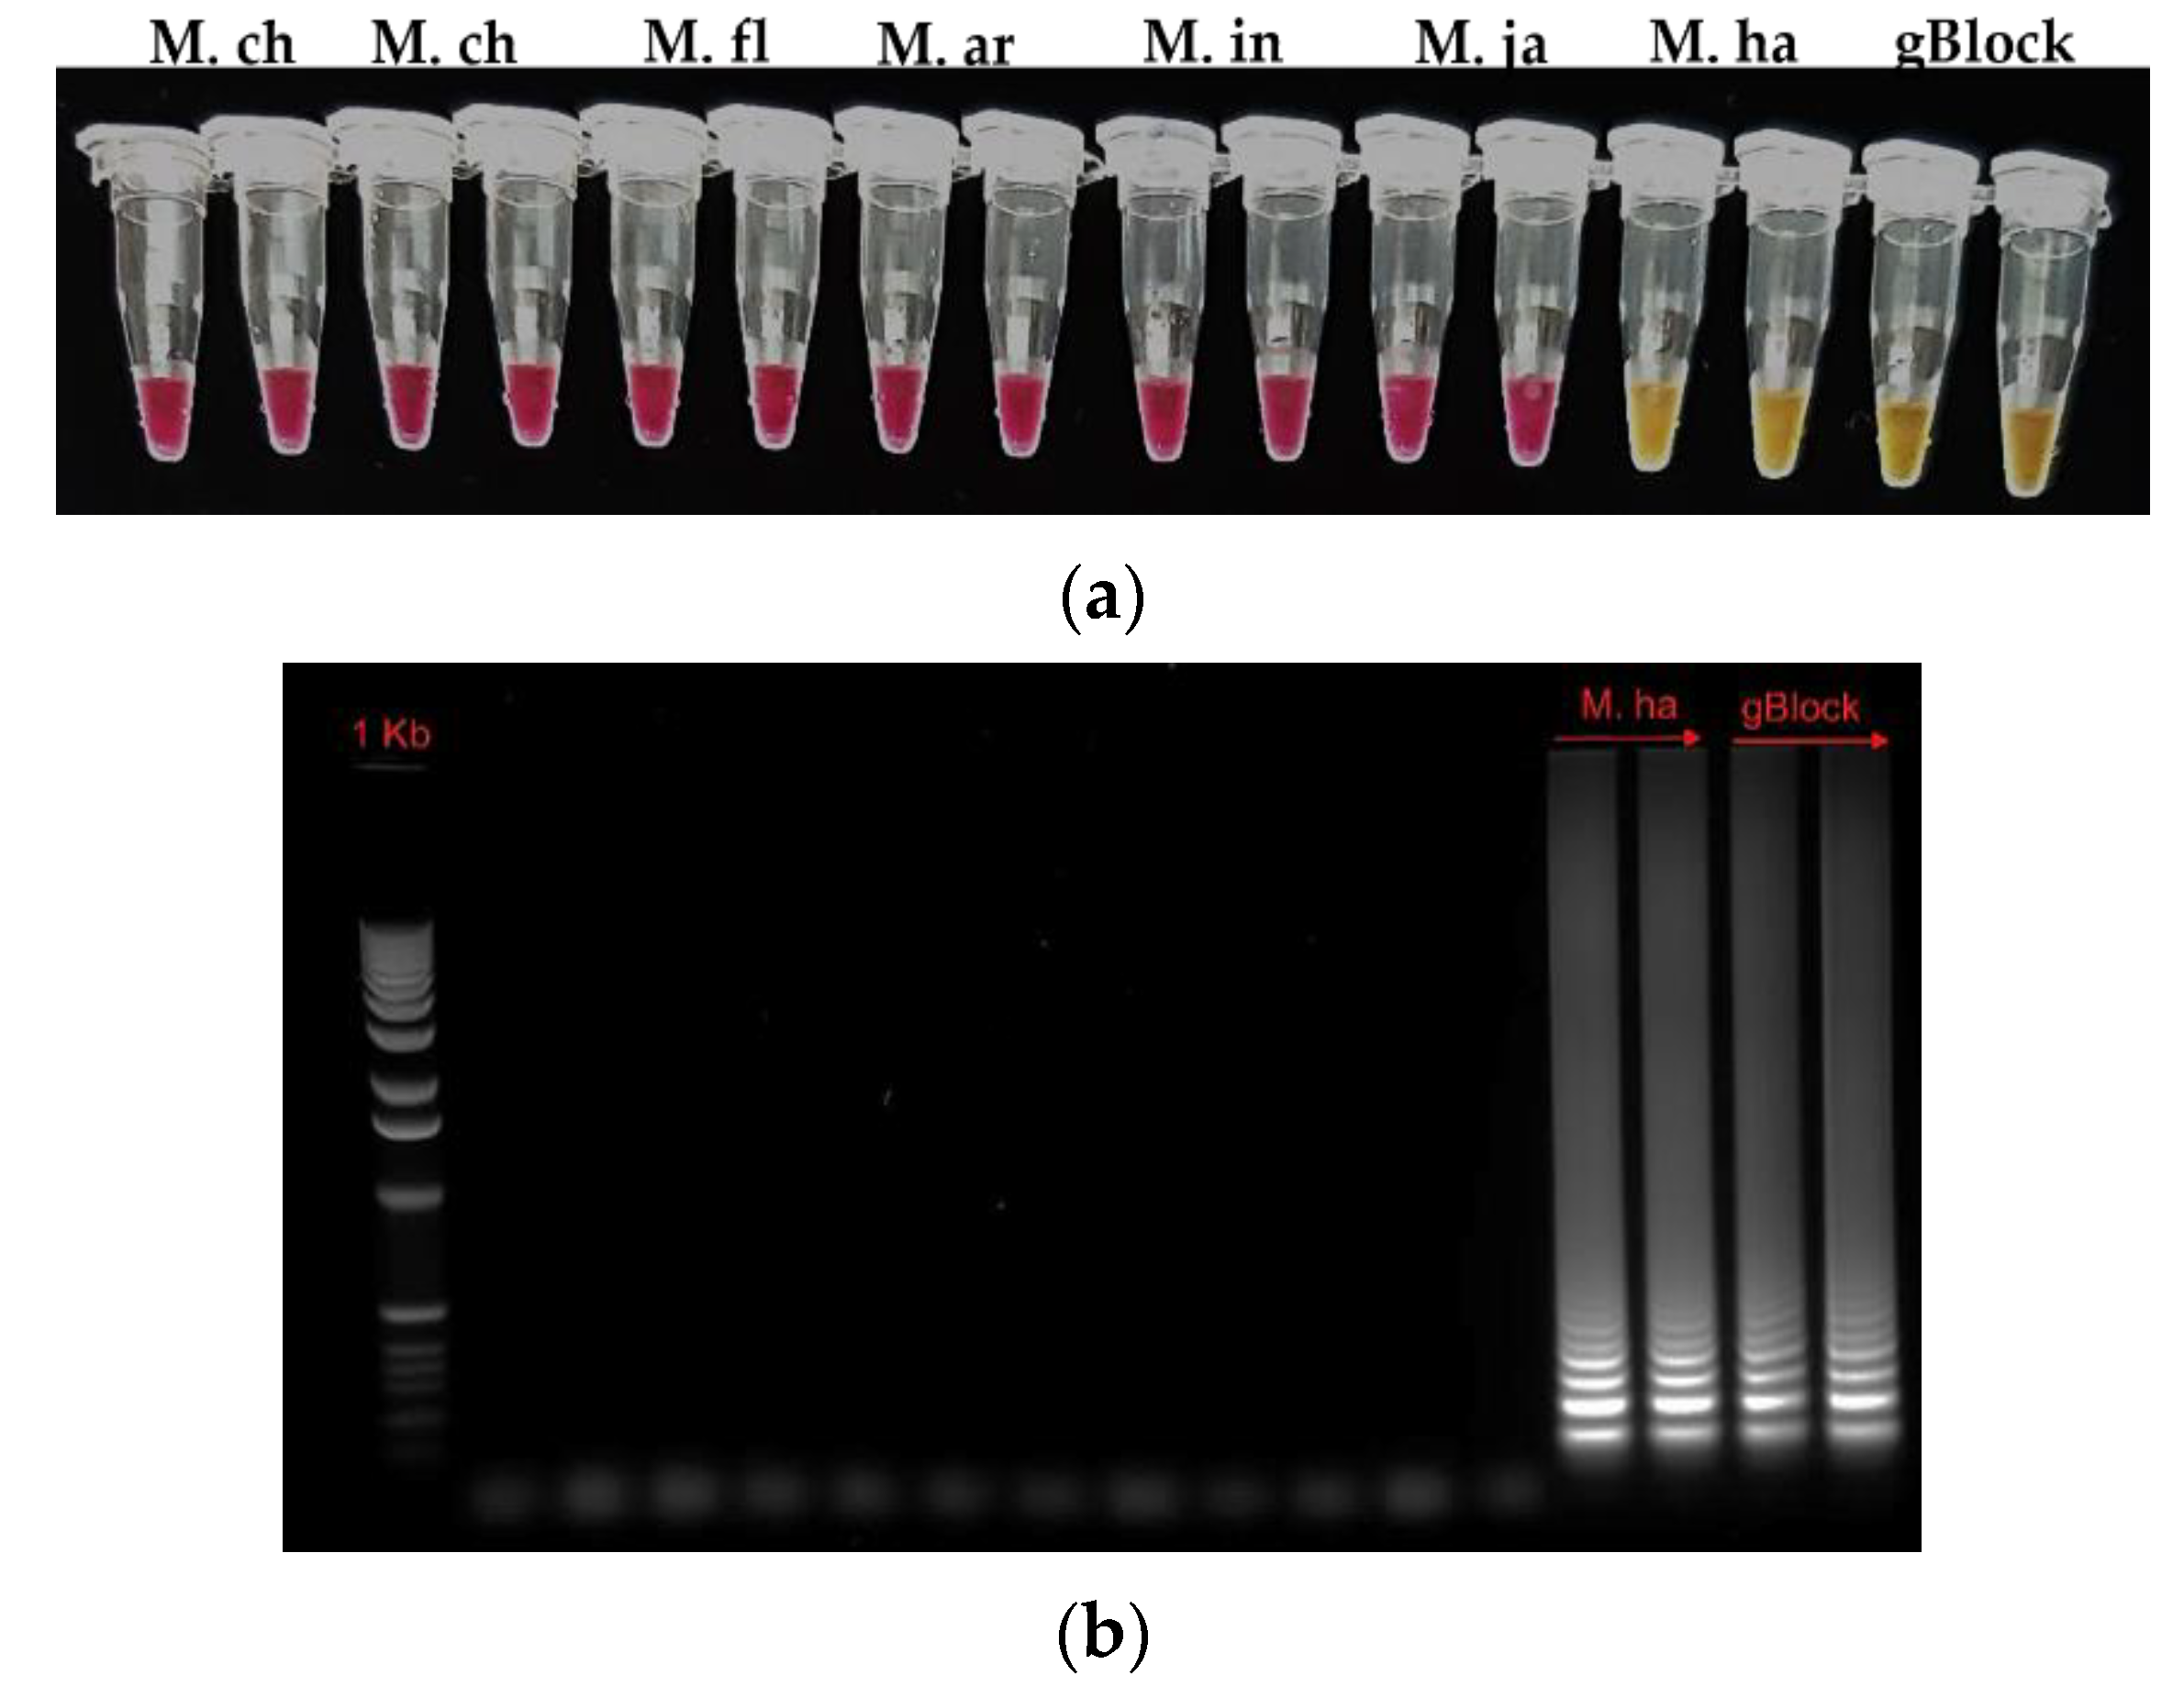
2.4. Specificity Tests

Specificity of the previously published RKN LAMP primer set [24] (Table S1), was initially tested using colorimetric LAMP with hydroxynaphthol blue and DNA from M. hapla juveniles and P. penterans. The Mh primer set [25] (Table S1) and the newly designed HSP-LAMP primer set were verified for specificity against nematodes other than M. hapla, using colorimetric LAMP with phenol red conducted in a C1000TM Thermal Cycler (Bio-Rad, Munich, Germany). The master mix contained per reaction: 12.5 WarmStart® Colorimetric LAMP 2X (NEB, Ipswich, MA, USA); 2.5 µL of primer mix (1.6 µM each of forward inner primer (FIP) and backward inner primer (BIP); 0.2 µM each of F3 and B3; 0.8 µM each of Loop forward primer (LoopF) and Loop backward primer (LoopB) (Thermo Fisher Scientific, Naarden, the Netherlands); 5 µL of MQ water and 5 µL of DNA template. The reaction condition was amplification at 65 °C for 1 h and deactivation of the enzyme at 80 °C for 5 min. Amplicons from colorimetric LAMP were analyzed by gel electrophoresis (1% agarose in 1x Tris Acetate EDTA (TAE) buffer).
Primer’s specificity was also tested by fluorescence based rt-LAMP performed with a CFX ConnectTM real-time system (Bio-Rad, Munich, Germany) (detection) and Genie® II (OptiGene Ltd., West Sussex, UK) (quantification). The master mix was prepared in a total volume of 25 µL per reaction: 15 µL of ISO-001 isothermal master mix (OptiGene Ltd., West Sussex, UK); 5 µL of primer mix and 5 µL of DNA template. The reaction conditions were amplification at 65 °C for 30 or 60 min, annealing at 98–80 °C and ramping at 0.05 °C s−1 to generate melting curves.

2.5. Soil Sampling and Soil Preparation

2.5.1. Artificially Infested Soils

Two root-knot nematode-free soils, one sandy (NF1–17) and one clayey soil (NF2–17), were collected in 2017 from two fields in Uppsala, Sweden (Table S2). The soils were sieved and air-dried at room temperature for 14 days and later artificially inoculated with M. hapla J2s. The juveniles (4, 8, 16, 32 and 64) were hand-picked under a stereomicroscope and placed in 5 μL of MQ water as mentioned before but placed in 2 mL tubes. To this, 500 mg of soil was added, and the tubes were left open to dry over night at room temperature, followed by the addition of matrix-E (glass beads) from the FastDNA spin kit for soil (MP Biomedicals, Solon, OH, USA) and homogenized twice at program P1 for 30 s by Mixer mill MM 400 (Retsch, Haan, Germany). The homogenized inocula in 500 mg were added to the final amount of 250 g of dry soil followed by a second homogenization, twice at 2000 and 4000 rpm, with Mortar Grinder RM 200 (Retsch, Haan, Germany), ISD, Lomma, Sweden. The same procedure was done for both the sandy and the clayey soil. This generated artificially infested clay and sand soil samples with 4–64 J2s 250 g−1 soil.

2.5.2. Naturally Infested Soils

Naturally infested soil with RKNs (N1–19 to N20–19), was collected from commercial fields in southern Sweden and in Denmark in 2019 (Table S2). These samples were extracted by the Oostenbrink elutriator [31] and analyzed morphologically, HS NL, Lomma, Sweden. Subsamples of 250 g from the original samples were kindly provided by Dr. Åsa Olsson, HS NL. The samples were air-dried and homogenized immediately after being received and were kept in cold storage until DNA extraction. Thirty new soil samples were collected in March 2020, to study the within-field distribution of M. hapla in six commercial vegetable fields in southern Sweden (Table S2). These fields were pre-selected based on nematode analysis in autumn 2019 (Table S2) to obtain a range of M. hapla densities. The pre-crop in field NI1-20 to NI6-20 were as follows: onion; spring barley/catch crop; spring/winter barley; spring barley; potato; potato. One pooled sample (collected in a W-pattern) and 4 individual samples (1.5 kg each, located 50 m from each other and GPS marked) were collected per field. The samples were mixed thoroughly by hand and divided into two sets of subsamples (250 g each). Samples in the first set were air-dried and processed as in 2019 and used for soil DNA extraction and rt-LAMP analysis. Samples in the second set were used for the recovery of nematodes from soil by the Baermann funnel method [6] and subsequent DNA extraction and real-time qPCR analysis (ISD, Lomma, Sweden). Soil chemical properties were analyzed at Eurofins Food & Agro Testing Sweden AB, Kristianstad, Sweden, as follows: soil pH determined according to (SS (Swedish standard)—ISO 10390), total carbon (ISO 10694), sand (DIN ISO 11277:2002–08), clay (Internal Method (In-House)), organic matter (KLK1965:1) (Table S2).

2.6. Development of Manual Soil DNA Extraction Procedure

The method originally developed for DNA extraction from plants [32], and was adjusted for DNA extraction from soil, where the extraction buffer was replaced by skim milk and Sodium Dodecyl Sulfate (SDS; the procedure is referred to as SKMM (Skim milk procedure). Firstly, to optimize the extraction buffer, soil NI6–19, with a very dark color (3.8% organic matter and 2.3 total carbon content), was selected for DNA extraction. Skim milk (Oxoid, Basingstoke, Hampshire, UK) at: 3.2, 4, 5 and 6%, as well as different volumes of 10% SDS (Invitrogen, Bohemia NY, USA): 25, 50 and 100 µL was tested using 500 mg of soil. For optimizing DNA binding, two silica products were tested: Celite 545 WA (26 µm) (Sigma, St. Louis, Missouri, USA) and Celite 545 FA (0.02–0.1 mm) (Sigma, St. Louis, MO, USA). Matrix-E (glass beads) (2 mL) was added per tube and the mixtures were vortexed, homogenized and centrifuged at 13,000× g for 3 min. Proteins were precipitated by adding 125 µL of 3 M Potassium acetate (pH 5.5) (Invitrogen) and incubated on ice for 5 min, followed by centrifugation at 13,000× g for 3 min. Stocks of the binding matrices were prepared as follows: 4 g of silica was washed twice with 150 mL of sterile MQ water and finally resuspended in 100 mL of MQ water and used for up to one month. A total of 1 mL of the suspension was withdrawn under stirring and added to a 15 mL Falcon tube. The tubes were centrifuged, and the water was removed and replaced by 700 µL of 6 M Guanidine thiocyanate (binding buffer) (Sigma-Aldrich, Beijing, China), instead of potassium iodide [32]. The supernatants were added to the binding matrix buffer mixture, and the tubes were placed on a rocker for 15 min, thereafter, the mixtures were transferred to empty 2 mL tubes and centrifuged at 13,000× g for 1 min. The liquid was discarded and the silica with the bond DNA was washed twice with 500 µL of freshly prepared washing buffer [32], centrifuged at 13,000× g for 1 min, followed by an extra centrifugation step for 2 min. The tubes were left to dry in a desiccator under a water vacuum for 1 h (Thermo Fisher Scientific, Waltham, MA, USA). The DNA was eluted in 100 µL of pre-warmed MQ water (55 °C) and the DNA concentration and purity were checked with the NanoDrop1000 (Version 3.8.1, Thermo Scientific, Waltham, MA, USA).

2.7. Validation of the HSP LAMP Assay for Analyzing Meloidogyne hapla in Soil

Before starting DNA extraction from the collected soil samples, a pilot investigation was conducted with samples NI1–19, NI2–19, NI6–19 and NI13–19, immediately after receiving them in 2019. In this case, DNA was extracted from 5 g of soil with the FastDNA kit (50 mL) (FD kit 1) and eluted in 3 mL of DES (DNase/Pyrogen-Free Water), precipitated and finally resuspended in 120 µL of MQ water. This process took a long time: therefore, it was feasible to use only 1 mL of the whole extract for further DNA extraction with both SKMM and FD kit 1 as stated below and analyzed by rt-LAMP.

2.7.1. DNA Extraction from 250 g Soil (SKMM Procedure)

To analyze M. hapla in artificially or naturally infested soil samples (250 g), 10 g of subsamples were taken in triplicates (NF–17; NI–19) or duplicates (NI–20) and transferred to 50 mL Falcon tubes with lysing matrix-E (15 mL). The SKMM procedure was performed as mentioned before, with further optimization. Each 10 g subsample was mixed with 5 mL of skim milk (6%), 1 mL of 10% SDS and 2 mL of MQ water. In the sandy soil (NF1–17), 250 µL of SDS was used instead of 1ml. The samples were homogenized as mentioned before and, after centrifugation at 10,000× g for 10 min, 1 mL of the supernatant was used in the next step (equivalent to 1.25 g of soil). Proteins were precipitated by adding 250 µL of 3 M Potassium acetate (pH 5.5) and the procedure continued, as with the 500 mg soil samples, using 1 mL mix of binding buffer and Celite 545 WA. To shorten the extraction time, Celite 545 AW was selected and used together with spin filter columns (0.45 µm) (Norgen Biotek, Thorold, ON, Canada) in all DNA extractions from the soil samples.

2.7.2. DNA Extraction from 250 g of Soil (Commercial Kit)

Parallel DNA extractions were performed with FD kit 1, according to the manufacturer’s instructions, but with some modifications. The washing step prior to DNA extraction was excluded to avoid DNA loss and the garnet lysing matrix was replaced by the lysing E-matrix (15 mL) as in the mini version of this kit. After adding the extraction buffers (11 mL 10 g−1 soil) and homogenization of the soil, 1 mL of the supernatant was taken after centrifugation and used in the rest of the extraction procedure according to the mini version of the kit. DNA was purified using Wizard DNA (kit 2) (Promega, Fitchburg, WI, USA) followed by MicroSpin S-300 HR Columns (kit 3) (Cytiva, Marlborough, MA, USA), according to manufacturers’ instructions.

2.7.3. Quantification of Gene Copies and Juveniles in Soil Samples

To quantify the number of gene copies and juveniles in soil samples, standard curves were generated from 16 J2 DNA aliquots as well as a synthetized gBlockHSP spanning the amplicon sequence including the binding sites of LAMP-HSP F3/B3 primers (Integrated DNA Technologies, Coralville, IA, USA). The gBlockHSP was received as a lyophilized DNA pellet with specified femtomole, resuspended in TRIS-buffer to make a stock of 10 ng µL−1 (3.86 × 10¹⁰ µL−1 copies) according to the manufacturer’s instructions. DNA from the gBlockHSP and juveniles was 10-fold diluted in MQ water to give final concentrations of 193,000 to 193 gene copies and 1.6 to 0.0016 J2 per reaction, respectively (n = 3). Due to the limited capacity of the Genie II, the standard curves were first generated by running the 10-fold diluted DNA with only one sample at a time, and the best equation was used for calculating the number of juveniles in all samples to avoid the extrapolation of samples that lie outside the standard curve. One equation was used for DNA extracted by SKMM and another equation was used for DNA extracted by the kits. The gBlockHSP was tested in several reactions, it proved to be stable and generated almost the same Tt-values in each reaction; therefore, one equation was used for estimating the number of gene copies in all soil samples regardless of the DNA extraction method.

2.8. Real-Time qPCR

Soil samples collected in 2020, for studying within-field variation, were intended to be analyzed morphologically and the nematode densities to be compared with those generated by rt-LAMP. Due to the detection of M. chitwoodi and M. fallax in Sweden, it was crucial to use a specific method such as qPCR to reliably confirm the presence of M. hapla in the collected soil samples. DNA extraction and qPCR analysis were conducted by a commercial laboratory (ISD, Lomma, Sweden). Firstly, nematodes were extracted from the second set of soil samples, as described previously, and collected in 2 mL of MQ water, centrifuged and 1 mL was carefully removed from the top of the liquid; the remaining volume was frozen for two days. After thawing, 1 mL CATB buffer was added and from this mixture, 400 µL (n = 2) were cleaned with filters (in-house method). DNA was eluted in 100 µL of TE buffer and analyzed by a TaqMan real-time qPCR. A standard curve was generated with DNA extracted from 4, 16, 32 and 64 J2s.

2.9. Statistics

The results were analyzed using JMP statistical software (ver.9.0) (Cary, NC, USA). Pairwise comparisons were performed using the LS means Student’s t-test. Tukey’s HSD-test (p ≤ 0.05) was used to identify differences between individual means. The standard curves were generated using the ln(x) equations to express the linear relationship between Tt values (time to amplification) and the respective target gene copies or number of juveniles in rt-LAMP reactions.

3. Results

3.1. Primer Design

One primer set with six individual primers was designed based on Mh-hsp 90 gene and designated as HSP-LAMP (Table S1). The in-silico screening with the BLAST search function of the individual primers showed no significant hits with other DNA sequences available in the GenBank database. The primers designed based on the EF1-α and ctr-1 genes revealed significant matches with DNA sequences from other RKN species; therefore, these were not considered for further testing. Both LAMP Designer software and the online software Primer Explorer Ver. 4, failed to design primers based on the DNA sequence of parasitism protein 16D10 gene.

3.2. Specificity of the HSP-LAMP Primer Set

The HSP-primers exclusively amplified DNA from M. hapla juveniles, both in colorimetric LAMP and rt-LAMP conducted in the qPCR machine (Ta = 87.8 °C) (Table S3). Specificity against other RKNs in colorimetric LAMP (Figure 1a) was confirmed by gel electrophoresis, where the typical “ladder shape” of the DNA bands was only found in amplicons from M. hapla DNA and the gBlockHSP (Figure 1b). Similarly, in rt-LAMP, positive DNA amplification was obtained from M. hapla DNA and gBlockHSP. The resulted average Tt value was 10 min and 7 min, respectively (Figure 1c), and melting curves with a specific peak at annealing temperature (Ta = 87 °C) were developed from both M. hapla and gBlockHSP (Figure 1d). Positive detection of M. hapla DNA by the previously published RKN LAMP primers [24] was also confirmed by our study, both by color change of hydroxynaphthol from purple to blue and by gel electrophoresis (Figure S2a,b). However, these primers also detected DNA from P. penetrans (Figure S2c,d) (Table S3). The Mh LAMP primers [24] amplified DNA in rt-LAMP from M. hapla (Ta = 84 °C) and M. arenaria (Ta = 83 °C) (Figure S3a), in addition to DNA from H. schachtii (Ta = 85 °C), M. chitwoodi (Ta = 84 °C) and P. penetrans (Ta = 86 °C) (Figure S3b) (Table S3).

3.3. Optimization of the Manual DNA Extraction Procedure

The amount of DNA extracted from soil sample NI6–19 using different concentrations of skim milk, 3.2–6%, was not significantly different. However, at 6% skim milk, the DNA purity from proteins (A260/A280) was lower compared with 3.2 and 4% (Table 1). The highest SDS volume, 100 µL, resulted in a higher DNA concentration and higher (A260/A230) absorbance ratio compared with the lowest SDS volume, 25 µL (Table 1). There were no significant differences concerning DNA concentration and purity between the silica products.

3.4. Evaluation of the Manual DNA Extraction Procedure

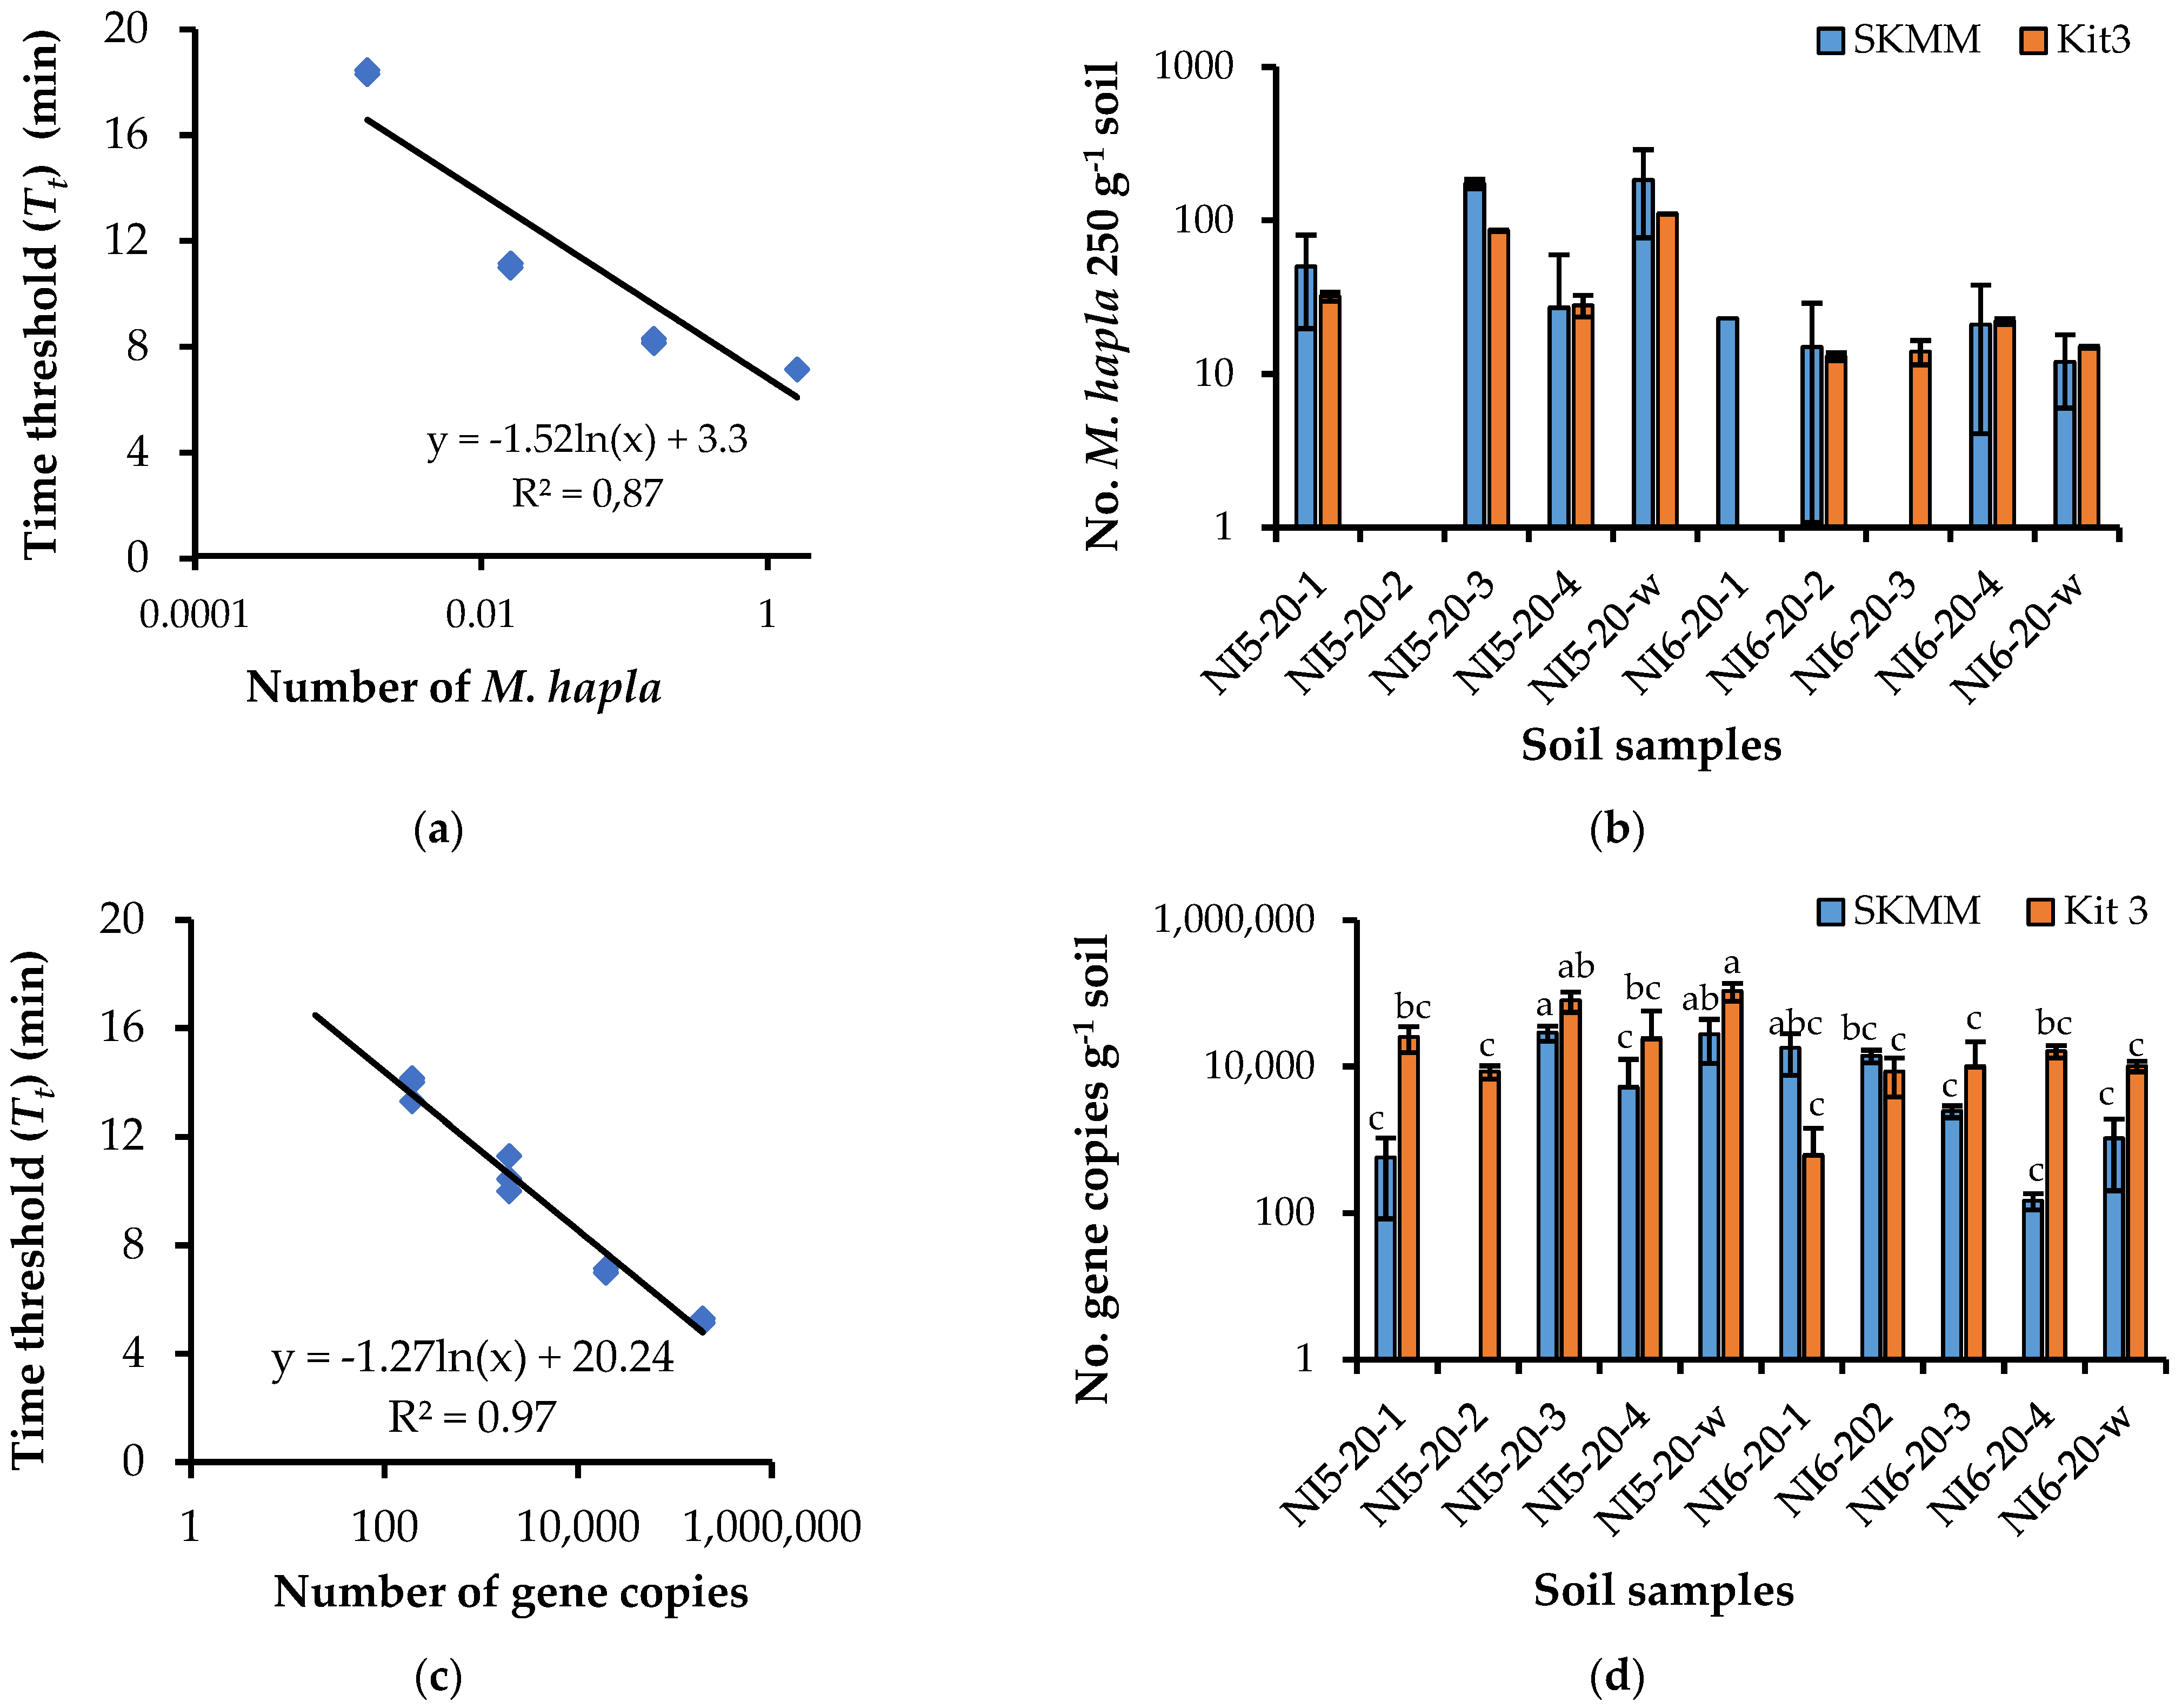
3.4.1. Artificially Infested Soil

The highest average DNA extracted from artificially infested soil samples was obtained by the FD kit (kit 1), but DNA concentration decreased after purification with Wizard DNA kit (kit 2) and MicroSpin S-300 HR Columns (kit 3) (Table 2). This was accompanied by a significant increase in DNA purity from humic acid, however, DNA quality in terms of purity from proteins was not significantly improved (Table 2). The average DNA concentration in clayey and sandy soils, before adding the juveniles, was 4.7 ± 0.17 SD and 2.3 ± 0.03 SD, respectively. Corresponding average soil DNA extracted with SKMM from both clay and sand soil was similar to kit 3, and there were no differences regarding DNA purity (Table 2). DNA concentrations in clay and sand soil without juveniles using SKMM were 4.8 ± 0.3 SD and 4.7 ± 0.1 SD. The average amount of DNA extracted from the clayey soil was higher than that from the sandy soil, 12 vs. 8 µg g−1 soil; as the clay content, organic matter and total carbon were also higher compared with that of the sandy soil (Table S2). In general, the extracted DNA from artificially infested clay soil samples did not increase proportionally with the number of inoculated juveniles. However, in the sandy soil, there was a steady increase in DNA content in samples inoculated with 16, 32 and 64 J2s and this tendency was clearer in the case of kit 3 (Figure S4a). Both SKMM and the commercial kits gave similar ratio (A260/A280) (Figure S4b). Absorbance ratio (A260/A230) was highest in DNA extracted from clay samples inoculated with 16, 32 and 64 J2s using SKMM (Figure S4c), and although there was a tendency to obtain purer DNA with SKMM, the differences were not significant in most of the samples due to variability between replicates.

3.4.2. Naturally Infested Soil

Like the artificially infested soil samples, total DNA extracted from naturally M. hapla-infested field soils collected in 2019 decreased following purification with kit 2 and kit 3, and the average ratio (A260/A230) was higher compared to kit 1 and kit 2 (Table 2). The ratio (A260/A280) was slightly improved after purification with kit 2 and 3 (Table 2). When the same samples were subjected to DNA extraction with the SKMM procedure, average DNA concentration and absorbance ratios were higher than the respective ones obtained by kit 3 (Table 2). In general, average DNA concentrations were higher in some samples extracted with SKMM (Figure S5a). There were differences between SKMM and kit 3 in the ratio (A260/A280) except for in soil sample NI6–19 (Figure S5b), meanwhile, the ratio (A260/A230) was significantly higher in most of the samples extracted with SKMM (Figure S5c).
The DNA extracted from naturally infested samples collected in 2020, showed the same tendency of reduction in concentration following DNA purification (Table 2). The corresponding average DNA concentration and ratio (A260/A230) obtained by SKMM were significantly higher compared to kit 3 (Table 2). The ratio (A260/A280) was similar in DNA extracted with SKMM and kit 1, but after purification with kit 2 and kit 3, the ratios became significantly higher compared to SKMM (Table 2). There were significant differences between the soil samples in the amount of DNA extracted with SKMM, and samples from field NI3–2020 and NI4–2020 had the highest average DNA (Figure S6a). The results showed that DNA obtained by SKMM had lower purity from proteins in samples from field NI1–20 and NI22–0 (Figure S6b), but significantly higher purity from humic acid in samples collected from field NI5–20 and NI6–20 (Figure S6c). Average DNA concentration from each group of samples correlated positively with organic matter content (Table S2), irrespective of the DNA extraction method (r > 0.5) (Table 2).

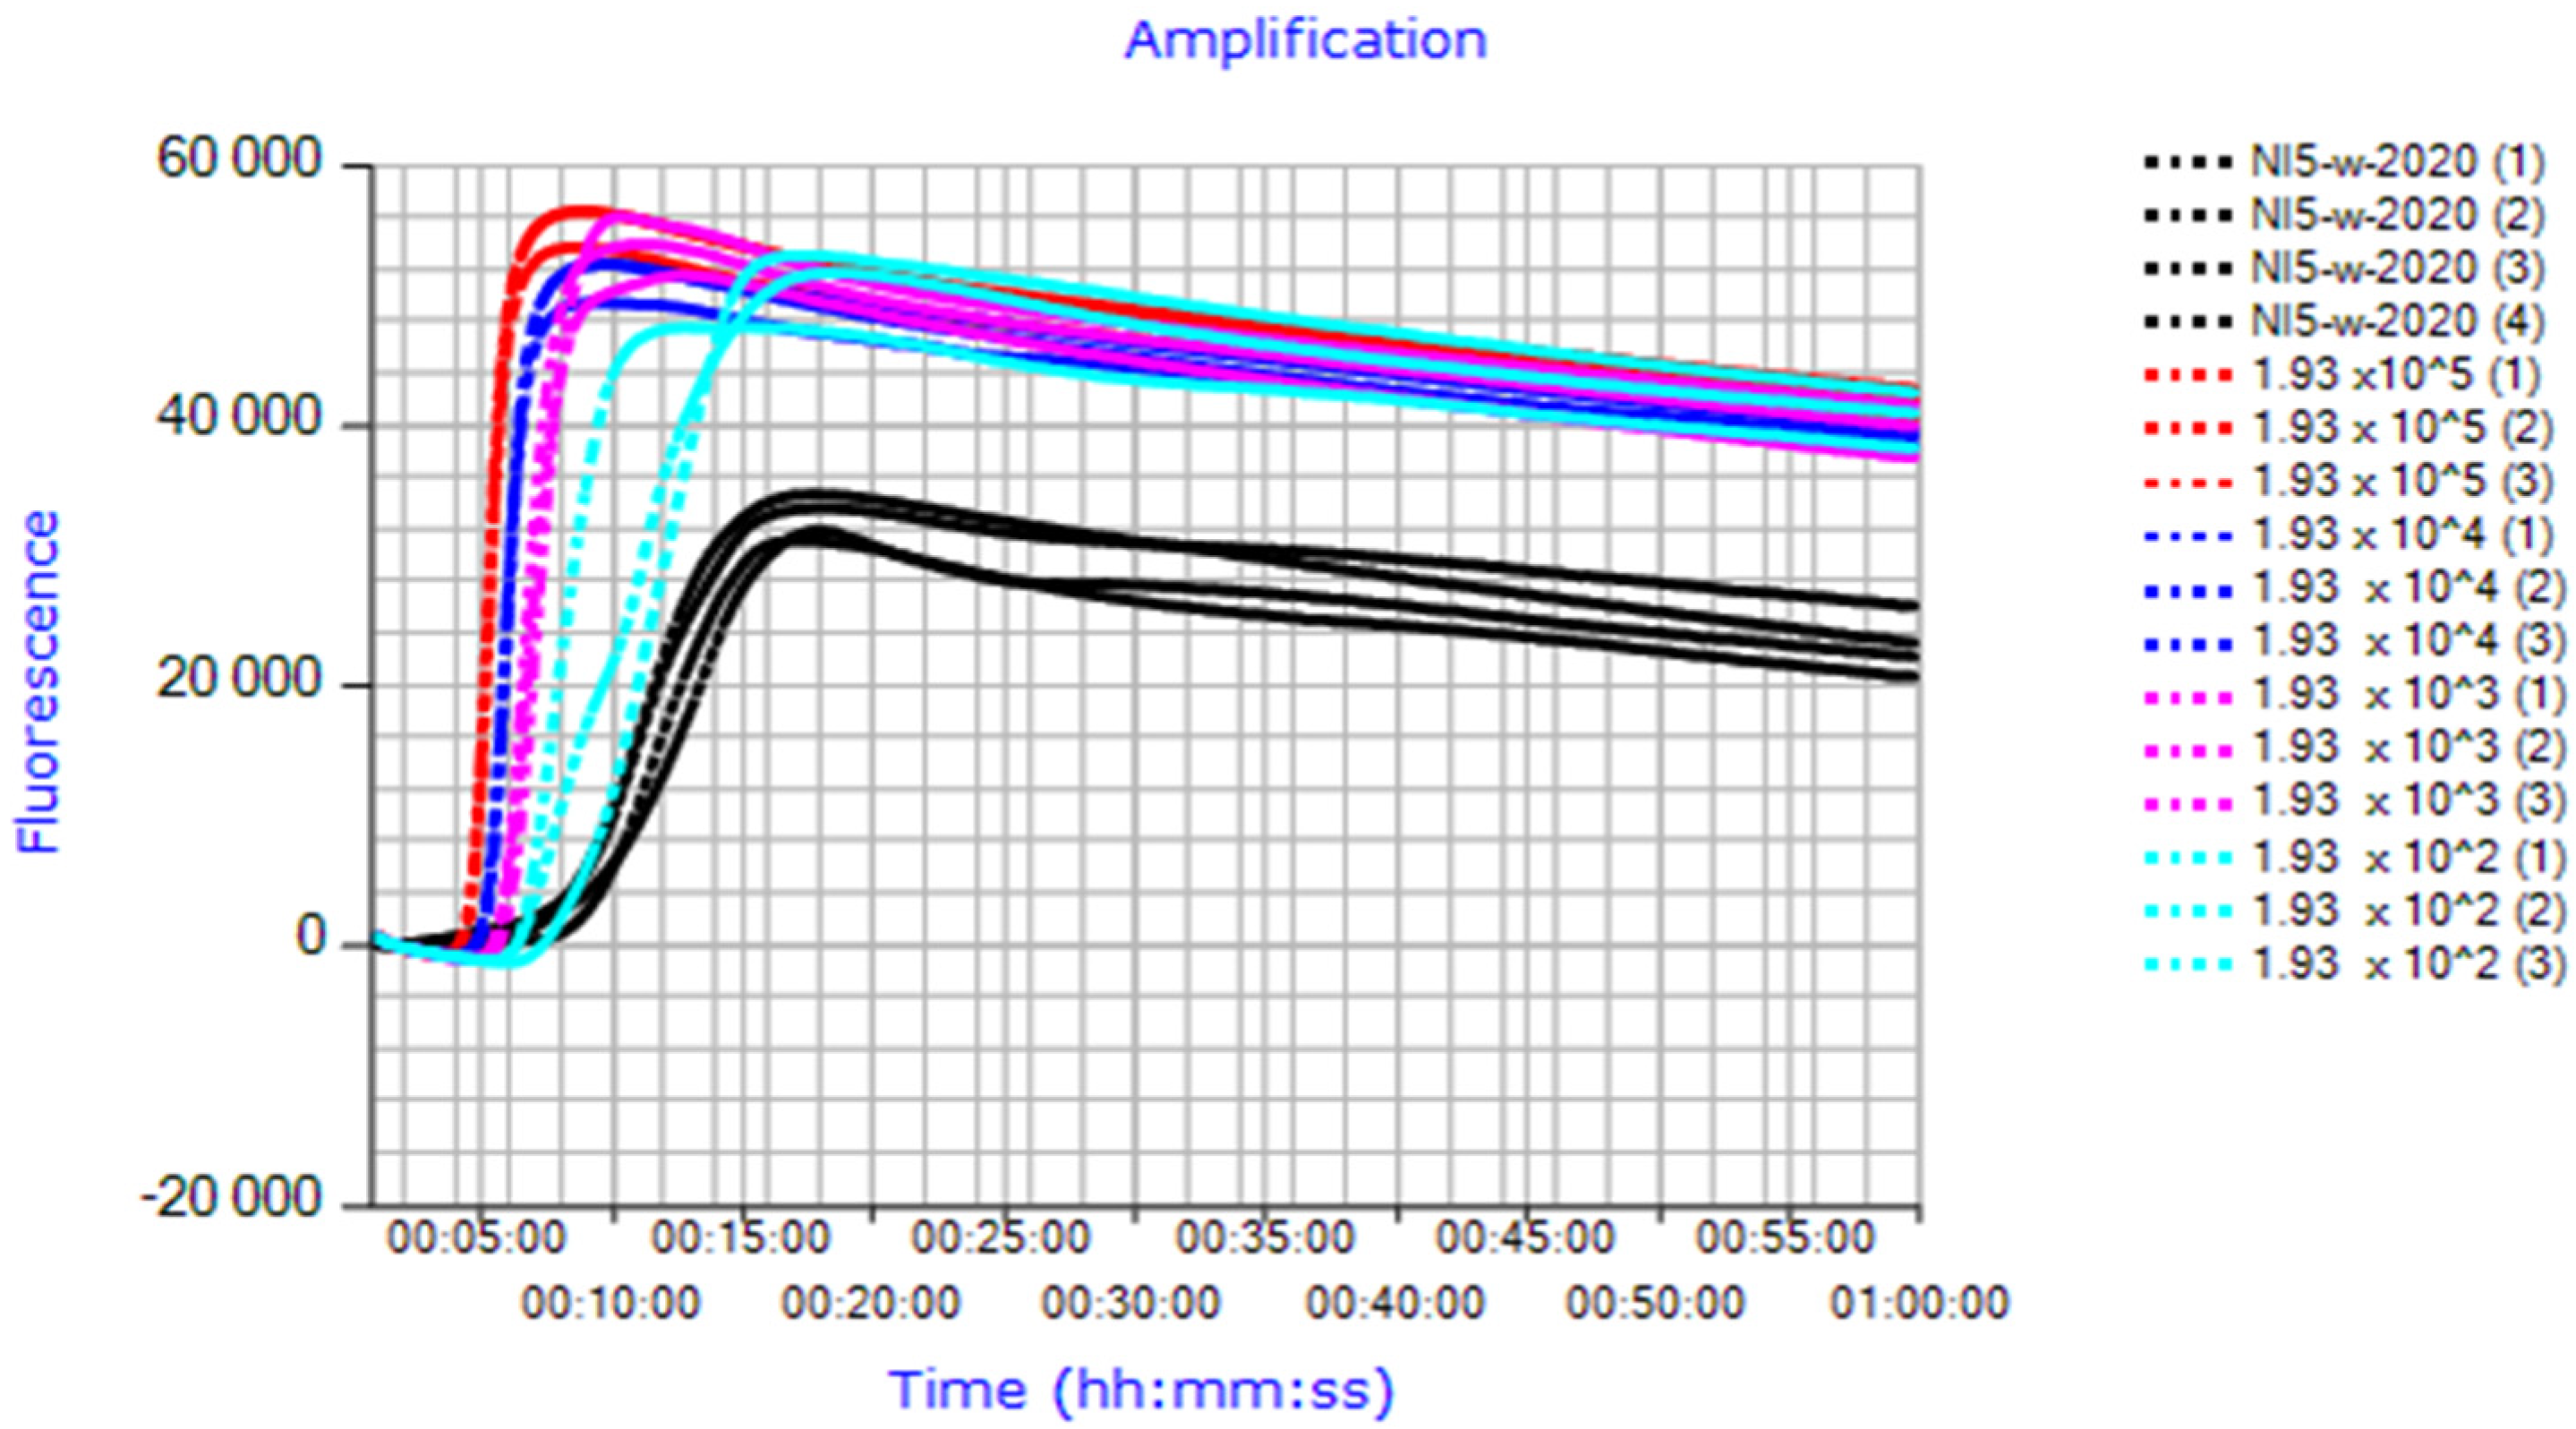
3.5. Verification of the HSP-LAMP Assay for Analyzing Meloidogyne hapla in Soil

Positive DNA amplification in rt-LAMP was obtained from one out of the three technical replicates of the clayey soil inoculated with 64 J2s and extracted with kit 3 (Tt = 14.45 min), and from one replicate of the sandy soil inoculated with 64 J2s (Tt = 10 min) and 32 J2s (Tt = 14.45 min). DNA extracted from the sandy soil inoculated with 8 and 64 J2s with SKMM resulted in amplification from one of the three technical replicates, (Tt = 21.15 and 21 min), respectively.
In general, most of the naturally infested soil samples from 2019 failed to produce a positive signal in the rt-LAMP, irrespective of the DNA extraction method, and the Ta values were near 92 °C, indicating low M. hapla DNA in these samples (results not shown). DNA extracted with the commercial kits amplified from two out of 20 soil samples, NI6–19 (Figure S7a) and NI14–19 (Tt = 17; 17; 15 min). The average numbers of M. hapla in 250 g of soil were estimated to be 15 and 6 juveniles, respectively. DNA extracted with SKMM resulted in amplification from sample NI6-19 (Figure S7a), NI11–19 (Tt = 14; 13; 0 min) and NI14–19 (Tt = 17; 16.45; 15 min). A slight delay in the signal is shown for DNA extracted with SKMM in comparison to the standard gBlockHSP, indicating contamination with inhibitors other than proteins and humic acid (Figure S7b). The estimated M. hapla numbers in 250 g of soil were 184, 37 and 6 juveniles, respectively. The annealing temperature (Ta) in the positive samples was 87 °C.

3.6. Within-Field Distribution of Meloidogyne hapla in Commercial Carrot Fields

The qPCR analysis showed that M. hapla DNA was detected in samples collected from two out of six fields, NI5–2020 and NI6–2020. The standard curve was generated from DNA extracted from 4, 32 and 64 J2s, as the Ct-values for 16 and 32 J2s were similar. The respective number of nematodes per sample (250 g−1) was calculated according to equation: y = −0.1084x + 32.694; R2 = 0.92. The average number of M. hapla juveniles in the five samples (w-pooled and the four individual samples) varied between the two fields, 51 and 13 nematodes, respectively. The ‘w’-pooled soil samples showed the same patterns with a nematode density of 41 and four, respectively (Figure 2a). Analyses of the individual four samples indicated a variation in M. hapla distribution ranging from 12 to 51 in field NI5-20 and from seven to 17 in field NI6–20 (Figure 2a). Parallel rt-LAMP analysis of the same DNA aliquots confirmed that M. hapla DNA was detected only in samples from field NI5–20 and NI6–20 and that the Ct-values of both qPCR and rt-LAMP showed the same pattern across the different samples (Figure 2b).
Similar results were also achieved with DNA extracted directly from soil samples and analyzed with rt-LAMP. To estimate the number of target gene copies (g−1) and respective nematodes per sample (250 g−1), the Genie® II platform was used instead. The number of juveniles was estimated by equation: y = −1.518ln(x) + 3.3151; R2 = 0.87 (DNA extracted and purified with commercial kits) (Figure 3a), and equation: y = −1.556ln(x) + 5.8402; R2 = 0.73 (DNA extracted with SKMM). Using DNA from 16 J2s diluted at a range of 1.6 to 0.0016 J2 per reaction (12 ng to 12 pg µL−1) resulted in Tt values at a range of 7 to 18 min and melting curves with a specific peak at annealing temperature (Ta = 86.6–87.3 °C). On average, the highest number of nematodes was obtained by LAMP-SKMM (51) (250 g−1 soil), followed by LAMP-kit 3 (32) (250 g−1 soil) and qPCR (21) (250 g−1 soil). The difference between qPCR and rt-LAMP was significant, but not between the LAMP assays. As in qPCR, the average number of M. hapla in field NI5-–20 was significantly higher than in field NI6–20, 30 vs. 12 nematodes (kit 3) and 87 vs. 15 nematodes (SKMM). The number of nematodes in the ‘w’-pooled samples was estimated to be 110 and 15 (kit 3), and 183 and 12 (SKMM) in field NI5–20 and NI6-20, respectively (Figure 3b). The number of juveniles in the individual samples ranged from 0 to 86 (field NI5–20) and from 0 to 22 (field NI6–20) (kit 3) (Figure 3b). The corresponding number of nematodes in individual soil samples ranged from 0 to 173 and from 0 to 23 (SKMM) (Figure 3b).
The number of gene copies g−1 soil of DNA extracted from samples of field NI5–20 and NI6–20 was calculated using equation: y = −1.27ln(x) + 20.24, R2 = 0.97 (Figure 3c) and the respective number of gene copies g−1 soil in each sample were shown in Figure 3d. The synthetic gBlockHSP at a range of 193,000 to 193 copies per reaction resulted in Tt values at a range of 5 to 14 min (Figure 4) and melting curves (Ta = 87 °C). Dilutions of <193 copies resulted in inconsistent amplifications and Tt values > 14 min. Average gene copies g−1 soil across field NI5–20 and field NI6–20 was 14,230 and 5676, respectively. On average, LAMP-kit 3 resulted in a higher number of gene copies g−1 soil compared with LAMP-SKMM (47,954 vs. 3086) in field NI5–20 but not in field NI6–20 (9060 vs. 5676). In LAMP-SKMM, the average number of gene copies in ‘w’-pooled sample NI5–20-w and NI6–20-w were 22,118 and 847 g−1 soil, respectively (Figure 3d). The corresponding numbers in the individual samples ranged from 0 to 29,033 g−1 soil (field NI5–20) and 119 to 14,265 g−1 soil (field NI6–20) (Figure 3d). For the LAMP-kit 3, the number of gene copies g−1 soil in NI5–20–w and NI6–20–w were 107,318 and 10,127 and in individual samples 3379 to 79,912 (field NI5–20) and 620 to 16,176 (field NI6–20) (Figure 3d).
The estimated M. hapla populations, using standard curves generated from M. hapla DNA, showed higher densities in DNA extracted with SKMM compared to the commercial kits and vice versa when the gBlockHSP was instead used for generating standard curves. The rt-LAMP assays with the gBlockHSP were performed 3 months after DNA extraction with SKMM, which could be one explanation for the difference in the results between the estimated nematode densities and the number of gene copies. A significant relationship was observed between M. hapla populations in soil samples collected from field NI5-20 and NI6-20, analyzed by qPCR and rt-LAMP, though the R2 values were <1 (Figure S8). Both DNA extraction methods, the commercial kits and SKMM, resulted in similar R2 values.

4. Discussion

Meloidogyne hapla is an economically important pest with a wide range of host plants. In Sweden, the choice of fields to be cultivated with vegetables is guided by soil analysis mostly based on morphological identification of the nematodes. An appropriate soil sampling technique and soil extraction method of nematode juveniles are decisive factors in minimizing the risk of underestimating the nematode population. Subsequent analysis of M. hapla juveniles by qPCR is commercially available for Swedish growers, but is generally used only to detect the presence of the nematodes. LAMP is less prone to inhibitors from biological and environmental samples, hence simple DNA extraction procedures can be adopted, saving both time and resources in terms of expensive commercial kits [21,33]. This makes LAMP assays attractive, especially when DNA is to be extracted from soil, which often requires purification with an additional commercial kit or kits. In this study, a LAMP assay was developed for analyzing M. hapla in soil with HSP-primers designed based on the M. hapla heat shock protein gene hsp90.

4.1. The Choice of Hsp90 Gene for Primers Design

A variety of DNA sequences has been utilized for nematode diagnosis exploiting the ribosomal transcribed spacer (ITS) and the intergenic spacer (IGS) nuclear regions [11,12]. The usefulness of these regions is sometimes limited by the insufficiency of the sequence variability to distinguish between closely related species. The nuclear gene hsp90 possesses sufficient variation in its DNA sequence and most likely occurs as a single copy; therefore, it is regarded as an attractive candidate for use in nematode phylogeny [34]. The hsp90 has previously been used for the identification of M. hapla population in coffee plants, and the sequence was found to be quite distinct from M. javanica hsp90 and other common root-knot nematodes [35].

4.2. LAMP Specificity and Sensitivity

The HSP-primer set was found to be specific against the other tested RKN species, which is crucial for the reliable analysis and identification of M. hapla in commercial vegetable fields, especially with the recently introduced M. chitwoodi and M. fallax in Sweden. Specificity was also confirmed against other important nematode species prevalent in commercial vegetables, sugar beet and winter oilseed rape fields in Sweden. The published Mh (M. hapla) primer set is an important LAMP marker used for analyzing M. hapla in plants, but it was previously not tested for specificity against M. chitwoodi and M. fallax, although further verification of the primer’s specificity [25] was recommended. In our study, the Mh primer set showed clear cross-reaction with DNA extracted from M. chitwoodi juveniles obtained from the HS NL, but not from M. chitwoodi DNA obtained from ISD. Possible contamination with M. hapla DNA is not expected as respective LAMP assays with HSP-primers were negative, which may indicate an occurrence of different races of M. chitwoodi. Two races of M. chitwoodi, race 1 and race 2 were reported in the Pacific Northwest, USA [23], but there is limited knowledge regarding the races present in Europe and so far, only race 1 has been reported [5]. Furthermore, the Mh primer set also produced non-specific amplifications with non-target DNA from M. arenaria, the sugar beet nematode H. schachtii and the root-lesion nematode P. penetrans. The detection limit of the HSP-primer set was found to be at 193 gene copies and 0.0016 J2s per reaction, corresponding to 12 pg µL−1, which is comparable to other reported LAMP assays [36].

4.3. DNA Concentrations and Quality: Comparison between SKMM and Commercial Kits

Soil is a complex matrix, usually containing different substances including salts and phenols. Therefore, it is generally difficult to develop a universal DNA extraction method that can apply across different soil types. A few studies have developed extraction procedures with modifications to make it suitable for DNA extraction from different soil types [37]. Humic acid, originating from clay particles, is one of the most important contaminants as it may co-purify with DNA. To overcome this problem, a pre-washing step of soil with specific buffers efficiently removes contaminants [38], but with a risk of DNA loss. Nonfat skim milk is included in several DNA extraction protocols for its known ability to compete with DNA for adsorbing sites on clay particles, which results in more efficient DNA extraction [37,39]. This component of the extraction buffer made the SKMM procedure superior over the FD kit in terms of DNA purity measured as a ratio (A260/A230). The FD kit is a well-established commercial kit that has been tested in several studies, however, low DNA quality is sometimes reported [40,41]. In this study, the obtained absorbance ratios of DNA before purification, were on average 1.8 (A260/A280) and 0.1 (A260/A230), which agrees with other studies [41]. Apparently, multiple purification steps after DNA extraction with the FD kit are necessary to avoid inhibition of DNA amplification in qPCR [42]. Spike samples were not included in rt-LAMP reactions to investigate the possible inhibition of M. hapla DNA amplification. However, inhibition in the form of signal delay or failure to amplify DNA was evident in some samples when DNA was extracted and purified with the commercial kits. LAMP is known to be more resilient than PCR when it comes to the inhibition of DNA amplification by humic acid and can tolerate up to 100 ng µL−1 per reaction [28]. This might indicate that the DNA extracted from certain samples with the commercial kits contained an amount exceeding the reported tolerance level [28]. The estimated cost of DNA extraction and purification per sample, is estimated to be EUR 30 for the commercial kits and EUR 12 for the SKMM procedure. This reduction in extraction cost reduces the overall cost of M. hapla analysis in soil by rt-LAMP.

4.4. Artificial Soil Inoculation and Detection Limit in Soil

Given the spatial heterogeneity of nematodes in soil, large amounts of soil (approx. 200–250 g) are usually used for morphological identification [43]. Molecular identification usually involves DNA extraction from subsamples of 0.25–1 g of soil, however, using larger soil amounts was found to be more reliable [44]. In this study, 10 g soil of suspended in 8 mL (SKMM) or 11 mL of extraction buffer (FD kit 1) was used as a starting material and an aliquot of 1 mL was used for binding DNA to silica particles. A similar strategy has previously been adopted for DNA extraction from soil [45]. We assumed that taking 1 mL aliquot should be enough to obtain detectable DNA with rt-LAMP in most of the tested soil samples, including the artificially inoculated clayey and sandy soils. The poor detection of M. hapla DNA in the artificially infested samples might be due to improper homogenization of the 500 mg of inocula in the final 250 g of soil, as the amount of the extracted DNA did not increase proportionally with the number of added juveniles. Furthermore, mixing four to 64 juveniles in 250 g of soil was probably not optimal. The aim here was to generate different nematode densities in 250 g of soil to determine the detection limit of rt-LAMP and compare it with the limit of four J2 s 250 g−1 soil (0.016 J2 s g−1 soil), used in practice by the commercial lab, HS NL. In another LAMP study, artificially inoculated samples were generated by adding as much as 10,000 J2s to 100 g of soil, to generate artificially infested samples with M. chitwoodi race 1 [23]. Likewise, in a TaqMan qPCR analysis, M. hapla eggs were added in a range of 62 to 8000 in 100 g of soil and only two of the three technical replicates were positive at the lowest density (62 eggs 100 g−1 soil) [12]. Although LAMP, irrespective of the DNA extraction method, was unsuccessful in detecting M. hapla at the tolerance level in the artificially inoculated soils, the estimated populations in the naturally infested samples from field NI6-20 were at densities close to four J2s 250 g−1 soil. This level of detection in soil is considerably much lower compared to the M. chitwoodi LAMP assay [23] where 100 J2s g−1 soil is reported.

4.5. Verification of Real-Time LAMP Assay for Analyzing Meloidogyne hapla in Naturally Infested Soil

Even though SKMM resulted in significantly higher DNA concentrations compared to the commercial kits, M. hapla DNA was below the detection limit in most of the soil samples collected in 2019. It is generally recommended to extract nematodes from fresh soil and perform the analysis within a short time after sampling [37]. On the other hand, when the samples are air-dried and homogenized, they can be kept at room temperature and used within 6 months without a risk of DNA degradation [37]. In our case, the NI-19 samples were air-dried and homogenized immediately after being received, and they were kept in cold storage until DNA extraction and rt-LAMP analysis. This may indicate that M. hapla populations already decreased drastically in some of the samples before being obtained from the HS NL. However, the results emphasize the importance of analyzing nematodes in soil samples within the first few months after sampling [37].

4.6. Within-Field Distribution of Meloidogyne hapla in Commercial Carrot Fields

The rt-LAMP and qPCR confirmed the spatial distribution of M. hapla especially at high densities (>100). In this case, the ‘w’- pooled sample gave an estimation of nematode density over the whole field without identifying “hot spots” that need more attention as in field NI5-20 [42]. The accuracy of the qPCR was influenced by the indirect approach of DNA extraction adopted by the commercial lab (ISD), even though, when qPCR is conducted with DNA extracted from soil, it gives a more accurate estimation of nematodes [46]. Hence, total DNA extraction from soil, which involves all life stages of M. hapla, probably explains the difference between rt-LAMP and the qPCR in the estimated M. hapla populations. Interestingly, although the population densities in some fields were quite high according to the morphological determination in the preceding autumn/winter, both rt-LAMP and qPCR failed to detect M. hapla DNA in these fields. Meloidogyne hapla is known for its cold tolerance, hence it is more adapted to temperate regions, where egg masses play a significant role in overwintering [47]. The sharp decline of the populations in these fields was probably related to biotic and abiotic factors. Multiple sampling is important to determine the optimal time point for soil sampling and for the better understanding of M. hapla population dynamics in soil.

4.7. Future Perspectives

Although the developed rt-LAMP with a simple DNA extraction method was proven efficient, it can be further optimized, for example, by including one purification step to prolong DNA stability. The capacity of the Genie II instrument was another constraint. The new real-time LAMP machine Genie® HT, Optigene, will help in overcoming this obstacle.

5. Conclusions

We have developed an efficient DNA extraction procedure based on skim milk (SKMM), that together with the developed rt-LAMP give the growers an excellent low-cost soil analysis of M. hapla. To our knowledge, this is the first study that has analyzed M. hapla in soil using rt-LAMP. The DNA obtained from different soil types with the SKMM was significantly higher in concentration and absorbance ratio (A260/A230) compared with the commercial FastDNA kit followed by two purification steps. The developed rt-LAMP assay was specific and able to detect and quantify M. hapla DNA in different soil types. Our results highlight the need to analyze soil immediately after sampling to avoid decline of nematode populations. Although M. hapla was not detected at the tolerance limit (0.016 J2s g−1 soil) in artificially infected clayey and sandy soils, it was possible to quantify M. hapla at densities close to the tolerance limit in naturally infested soil. Furthermore, rt-LAMP analysis confirmed in-field variation of M. hapla occurrence, emphasizing the importance of collecting and analyzing multiple soil samples for an accurate estimation of the M. hapla population in a specific field. We believe that with our suggested adjustments, the rt-LAMP together with the SKMM can be implemented commercially in the near future.

Supplementary Materials

The following are available online at https://www.mdpi.com/article/10.3390/horticulturae8020087/s1, Figure S1: DNA sequences of hsp90 gene used for designing the HSP-LAMP primers, Figure S2: Specificity tests of RKN primers with colorimetric LAMP, Figure S3: Specificity tests of Mh primers and HSP-primers with rt-LAMP performed with qPCR machine and shown as melt curves, Figure S4: Soil DNA extraction from root-knot nematode-free clay and sandy soils inoculated with 4; 8; 16; 32 and 64 J2 250 g−1 soil, Figure S5: Soil DNA extraction from naturally infested soil samples from 20 different commercial fields in Sweden and Denmark collected in 2019, Figure S6: Soil DNA extraction from naturally infested soil samples from six commercial fields in Sweden collected in 2020, Figure S7: Real-time LAMP analysis of DNA extracted from soil NI6-19, Figure S8: Relationship between qPCR and rt-LAMP of Meloidogyne hapla occurrence in soil samples collected from field NI5-20 and NI6-20, Table S1: Sequences of LAMP primers used in this study, Table S2: Soil chemical characteristics and RKN density, Table S3: Specificity of the LAMP primer sets HSP, RKN and Mh using colorimetric and real-time LAMP. Refs. [24,25] are cited in the supplementary materials.

Author Contributions

Conceptualization, Z.S.O., A.-C.W. and M.V.; methodology, Z.S.O. and M.V.; validation, Z.S.O. and M.V.; investigation, Z.S.O. and M.V.; resources, Z.S.O., M.V. and A.-C.W.; data curation, Z.S.O.; writing—original draft preparation, Z.S.O. and M.V.; writing—review and editing, Z.S.O., M.V. and A.-C.W.; project administration, Z.S.O.; funding acquisition, Z.S.O., M.V. and A.-C.W. All authors have read and agreed to the published version of the manuscript.

Funding

This research was funded by the Swedish Farmers’ Foundation for Agricultural Research (grant number R-18-25-022) and Partnership Horticulture (grant number 2016/175 and 2017/198).

Institutional Review Board Statement

Not applicable.

Informed Consent Statement

Not applicable.

Data Availability Statement

Not applicable.

Acknowledgments

The authors thank Åsa Olsson, HS Nematode Laboratory, Sweden and Nicole Viaene, Instituut voor Landbouw-, Visserij- en Voedingsonderzoek (ILVO), Belgium for providing nematode and DNA samples. The authors would like to thank Agronomist Stina Andersson, Crop advisor, HIR Skåne, Sweden for coordinating the soil sampling in 2020 and for her contribution to the project. We would like also to acknowledge the collaboration with Intertek ScanBi Diagnostics, Lomma Sweden.

Conflicts of Interest

The authors declare no conflict of interest.

References

  1. Castagnone-Sereno, P.; Danchin, E.G.J.; Perfus-Barbeoch, L.; Abad, P. Diversity and evolution of root-knot nematodes, genus Meloidogyne: New insights from the genomic era. Annu. Rev. Phytopathol. 2013, 51, 203–220. [Google Scholar] [CrossRef] [PubMed]
  2. Wesemael, W.M.L.; Viaene, N.; Moens, M. Root-knot nematodes (Meloidogyne spp.) in Europe. Nematology 2011, 13, 3–16. [Google Scholar] [CrossRef]
  3. Andersson, S. Rotgallnematod, Ett Ökande Problem I Morotsodling; Skånska Lantbr: Svedala, Sweden, 2009; Volume 2, ISSN 1653-2368. (In Swedish) [Google Scholar]
  4. SJV (Swedish Board of Agriculture). Trädgårdsproduktion 2017. Statistiska Meddelanden, JO 33 SM 1801; SJV: Jönköping, Sweden, 2017. (In Swedish) [Google Scholar]
  5. Saint Louis University. Meloidogyne chitwoodi, M. fallax and M. hapla-Resistance of Plants Relevant in Swedish Cropping Systems; SLU: The Unit for Risk Assessment of Plant Pests: Uppsala, Sweden, 2018; 54p. [Google Scholar]
  6. Baermann, G. Eine einfache Methode zur Auffindung von Anklostomum (Nematoden) Larven in Erdproben. Tijdschr Diergeneeskd 1917, 57, 131–137. [Google Scholar]
  7. Cunha, T.G.; Visôtto, L.E.; Lopes, E.A.; Oliveira, C.M.G.; God, P.I.V.G. Diagnostic methods for identification of root-knot nematodes species from Brazil. Ciência Rural 2018, 48, 1–11. [Google Scholar] [CrossRef] [Green Version]
  8. Eisenbach, J.D. Morphological comparison of head shape and stylet morphology of the second stage juveniles of Meloidogyne species. J. Nematol. 1982, 14, 339–343. [Google Scholar]
  9. Ingham, R.E. Nematodes. In Methods of Soil Analysis. Part 2. Microbiological and Biochemical Properties; Weaver, R.W., Angle, S., Bottomley, P., Bezdicek, D., Smith, S., Tabatabai, A., Wollum, A., Eds.; American Society of Agronomy: Madison, WI, USA, 1994; Volume 1, pp. 459–490. [Google Scholar]
  10. Esbenshade, P.R.; Triantaphyllou, A.C. Isozyme Phenotypes for the Identification of Meloidogyne Species. J. Nematol. 1990, 22, 10–15. [Google Scholar]
  11. Zijlstra, C.; Donkers-Venne, D.T.H.M.; Fargette, M. Identification of Meloidogyne incognita, M. javanica and M. arenaria using sequence characterised amplified region (SCAR) based PCR assays. Nematology. 2000, 2, 847–853. [Google Scholar]
  12. Sapkota, R.; Skantar, A.M.; Nicolaisen, M. A TaqMan real-time PCR assay for detection of Meloidogyne hapla in root galls and in soil. Nematology. 2015, 18, 147–154. [Google Scholar] [CrossRef]
  13. Tebbe, C.C.; Vajhen, W. Interference of humic acids and DNA extracted directly from soil in detection and transformation of recombinant DNA from bacteria and a yeast. Appl. Environ. Microbiol. 1993, 59, 2657–2665. [Google Scholar] [CrossRef] [PubMed] [Green Version]
  14. Notomi, T.; Okayama, H.; Masubuchi, H.; Yonekawa, T.; Watanabe, K.; Amino, N.; Hase, T. Loop-mediated isothermal amplification of DNA. Nucleic Acids Res. 2000, 28, E63. [Google Scholar] [CrossRef] [PubMed] [Green Version]
  15. Goto, M.; Honda, E.; Ogura, A.; Nomoto, A.; Hanaki, K.I. Colorimetric detection of loop-mediated isothermal amplification reaction by using hydroxyl naphthol blue. Biotechniques 2009, 46, 167–172. [Google Scholar] [CrossRef] [PubMed]
  16. Omer, Z.; Wallenhammar, A.-C. Development of Loop-mediated Isothermal Amplification assays for rapid detection of blackleg pathogens in Swedish winter oil seed rape. Euro. J. Plant Pathol. 2020, 157, 353–365. [Google Scholar] [CrossRef]
  17. Ammour, M.S.; Bilodeau, G.J.; Tremblay, D.M.; Van der Heyden, H.; Yaseen, T.; Varvaro, L.; Carisse, O. Development of Real-Time Isothermal Amplification Assays for On-Site Detection of Phytophthora infestans in Potato Leaves. Plant Dis. 2017, 101, 1269–1277. [Google Scholar] [CrossRef] [Green Version]
  18. Aglietti, C.; Luchi, N.; Pepori, A.L.; Bartolini, P.; Pecori, F.; Raio, A.; Capretti, P.; Santini, A. Real-time loop-mediated isothermal amplification: An early-warning tool for quarantine plant pathogen detection. AMB Express 2019, 9, 1–14. [Google Scholar] [CrossRef] [PubMed]
  19. Deguo, W.; Guicheng, H.; Fugui, W.; Yonggang, L.; Daxi, R. Drawback of loop-mediated isothermal amplification. Afr. J. Food Sci. 2008, 2, 83–86. [Google Scholar]
  20. Denschlag, C.; Vogel, R.F.; Niessen, L. Hyd5 gene-based detection of the major gushing-inducing Fusarium spp. in a loop-mediated isothermal amplification (LAMP) assay. Int. J. Food Microbiol. 2012, 156, 189–196. [Google Scholar] [CrossRef]
  21. Moradi, A.; Almasi, M.A.; Jafary, H.; Mercado-Blanco, J. A novel and rapid loop-mediated isothermal amplification assay for the specific detection of Verticillium dahliae. J. Appl. Microbiol. 2014, 116, 942–954. [Google Scholar] [CrossRef]
  22. Leal, I.; Allen, E.; Foord, B.; Anema, J.; Reisle, C.; Uzunovic, A.; Varga, A.; James, D. Detection of living Bursaphelenchus xylophilus in wood, using reverse transcriptase loop-mediated isothermal amplification (RT-LAMP). For. Pathol. 2015, 45, 134–148. [Google Scholar] [CrossRef]
  23. Zhang, L.; Gleason, C. Loop-Mediated Isothermal Amplification for the Diagnostic Detection of Meloidogyne chitwoodi and M. fallax. Plant Dis. 2019, 103, 12–18. [Google Scholar] [CrossRef] [Green Version]
  24. Niu, J.-H.; Guo, Q.-X.; Jian, H.; Chen, C.-L.; Yang, D.; Liu, Q.; Guo, Y.-D. Rapid detection of Meloidogyne spp. by LAMP assay in soil and roots. Crop Prot. 2011, 30, 1063–1069. [Google Scholar] [CrossRef]
  25. Peng, H.; Long, H.; Huang, W.; Liu, J.; Cui, J.; Kong, L.; Hu, X.; Gu, J.; Peng, D. Rapid, simple and direct detection of Meloidogyne hapla from infected root galls using loop-mediated isothermal amplification combined with FTA technology. Sci. Rep. 2017, 7, 44853. [Google Scholar] [CrossRef]
  26. Haan, E.G.; Dekker, C.C.E.M.; Tameling, W.I.L.; den Nijs, L.J.M.F.; van den Bovenkamp, G.W.; Kooman-Gersmann, M. The MeloTuber Test: A real-time TaqMan PCR-based assay to detect the root-knot nematodes Meloidogyne chitwoodi and M. fallax directly in potato tubers. Bull. OEPP/EPPO Bull. 2014, 44, 166–175. [Google Scholar] [CrossRef]
  27. Gorny, A.M.; Wang, X.; Hay, F.S.; Pethybridge, S.J. Development of a Species-Specific PCR for Detection and Quantification of Meloidogyne hapla in Soil Using the 16D10 Root-Knot Nematode Effector Gene. Plant Dis. 2019, 101, 1902–1909. [Google Scholar] [CrossRef] [PubMed]
  28. Stedtfeld, R.D.; Stedtfeld, T.M.; Samhan, F.; Kanitkar, Y.H.; Hatzinger, P.B.; Cupples, A.M.; Hashshama, S.A. Direct loop mediated isothermal amplification on filters for quantification of Dehalobacter in groundwater. J. Microbiol. Methods 2016, 131, 61–67. [Google Scholar] [CrossRef] [Green Version]
  29. Whitehead, A.G.; Hemming, J.R. A comparison of some quantitative methods of extracting small vermiform nematodes from soil. Ann. App. Biol. 1965, 55, 25–38. [Google Scholar] [CrossRef]
  30. Song, Z.Q.; Cheng, J.U.; Cheng, F.X.; Zhang, D.Y.; Liu, Y. Development and Evaluation of Loop-Mediated Isothermal Amplification assay for rapid detection of Tylenchulus semipenetrans using DNA extracted from soil. Plant Pathol. J. 2017, 33, 184–192. [Google Scholar] [CrossRef] [PubMed] [Green Version]
  31. Verschoor, B.; De Goede, R.G.M. The nematode extraction efficiency of the Oostenbrink elutriator-cottonwool filter method with special reference to nematode body size and life strategy. Nematology 2000, 2, 325–342. [Google Scholar] [CrossRef]
  32. Huynh, O.A.; Jankowicz-Cieslak, J.; Saraye, B.; Hofinger, B.; Till, B.J. Low-cost for DNA extraction and quantification. In Biotechnologies for Plant Mutation Breeding; Jankowicz-Cieslak, J., Tai, T.H., Kumlehn, J., Till, B.J., Eds.; Springer Nature: Basel, Switzerland, 2017; Volume 1, pp. 227–239. [Google Scholar]
  33. Niessen, L.; Gräfenhan, T.; Vogel, R.F. ATP citrate lyase 1 (acl1) gene-based loop-mediated amplification assay for the detection of the Fusarium tricinctum species complex in pure cultures and in cereal samples. Int. J. Food Microbiol. 2012, 158, 171–185. [Google Scholar] [CrossRef] [PubMed]
  34. Skantar, A.M.; Carta, L.K. Multiple displacement amplification (MDA) of total genomic DNA from Meloidogyne spp. and comparison to crude DNA extracts in PCR of ITS1, 28S D2-D3 rDNA and Hsp90. Nematology 2005, 7, 285–293. [Google Scholar] [CrossRef] [Green Version]
  35. Handoo, Z.A.; Skantar, A.M.; Carta, L.K.; Schmitt, D.P. Morphological and Molecular Evaluation of a Meloidogyne hapla Population Damaging Coffee (Coffea arabica) in Maui, Hawaii. J. Nematol. 2005, 37, 136–145. [Google Scholar]
  36. Tomlinson, J.A.; Dickinson, M.J.; Boonham, N. Detection of Botrytis cinerea by loop-mediated isothermal amplification. Lett. Appl. Microbiol. 2010, 51, 650–657. [Google Scholar] [CrossRef] [PubMed]
  37. Min, Y.Y.; Toyota, K.; Sato, E. A novel nematode diagnostic method using the direct quantification of major plant-parasitic nematodes in soil by real-time PCR. Nematology 2012, 14, 265–276. [Google Scholar] [CrossRef]
  38. Cheng, F.; Houa, L.; Woestec, K.; Shang, Z.; Penge, X.; Zhaof, P.; Zhang, S. Soil pretreatment and fast cell lysis for direct polymerase chain reaction from forest soils for terminal restriction fragment length polymorphism analysis of fungal communities. Braz. J. Microbiol. 2016, 47, 817–827. [Google Scholar] [CrossRef] [Green Version]
  39. Wallenhammar, A.-C.; Arwidsson, O. Detection of Plasmodiophora brassicae by PCR in naturally infested soils. Eur. J. Plant Pathol. 2001, 107, 313–321. [Google Scholar] [CrossRef]
  40. Knauth, S.; Schmidt, H.; Tippkötter, R. Comparison of commercial kits for the extraction of DNA from paddy soils. Lett. Appl. Microbiol. 2012, 56, 222–228. [Google Scholar] [CrossRef]
  41. Leite, D.C.A.; Balieiro, F.C.; Pires, C.A.; Madari, B.E.; Rosado, A.S.; Coutinho, H.L.C.; Peixoto, R.S. Comparison of DNA extraction protocols for microbial communities from soil treated with biochar. Braz. J. Microbiol. 2014, 45, 175–183. [Google Scholar] [CrossRef] [PubMed] [Green Version]
  42. Wallenhammar, A.-C.; Almquist, C.; Söderström, M.; Jonsson, A. In-field distribution of Plasmodiophora brassicae measured using quantitative real-time PCR. Plant Pathol. 2012, 61, 16–28. [Google Scholar] [CrossRef]
  43. Waite, I.S.; O’Donnell, A.G.; Harrison, A.; Davies, J.T.; Colvan, S.R. Design and evaluation of nematode 18S rDNA primers for PCR and denaturing gradient gel electrophoresis (DGGE) of soil community DNA. Soil Biol. Biochem. 2003, 35, 1165–1173. [Google Scholar] [CrossRef]
  44. Macmillan, K.; Blok, V.; Young, I.; Crawford, J.; Wilson, M.J. Quantification of the slug parasitic nematode Phasmarhabditis hermaphrodita from soil samples using real time PCR. Int. J. Parasitol. 2006, 36, 1453–1461. [Google Scholar] [CrossRef]
  45. Brierley, J.L.; Stewart, J.A.; Lees, A.K. Quantifying potato pathogen DNA in soil. Appl. Soil Ecol. 2009, 41, 234–238. [Google Scholar] [CrossRef]
  46. Baidoo, R.; Yan, G.; Nagachandrabose, S.; Skantar, A.M. Developing a Real-Time PCR Assay for Direct Identification and Quantification of Pratylenchus penetrans in Soil. Plant Dis. 2017, 101, 1432–1441. [Google Scholar] [CrossRef] [PubMed] [Green Version]
  47. Wu, X.; Zhu, W.; Wang, Y.; Liu, X.; Chen, L.; Duan, Y. The cold tolerance of the northern root-knot nematode, Meloidogyne hapla. PLoS ONE 2018, 13, e0190531. [Google Scholar] [CrossRef] [PubMed] [Green Version]
Figure 1. Specificity test of HSP-LAMP primer set: (a) Colorimetric LAMP analysis of RKN DNA, M. ch (Meloidogyne chitwoodi); M. fl (M. fallax); M. ar (M. arenaria); M. in (M. incognita); M. ja (M. javanica); M. ha (M. hapla) (0.16 J2); gBlockHSP (synthetic DNA of M. hapla hsp90 gene) (1.93 × 10⁵ copies) (n = 2); (b) Corresponding gel electrophoresis analysis of amplicons from colorimetric LAMP, Lane 1:1 Kb DNA marker; rt-LAMP analysis of RKN DNA (n = 2): (c) Amplification curve; (d) Anneal derivative curve.
Horticulturae 08 00087 g001aHorticulturae 08 00087 g001b
Figure 2. qPCR and rt-LAMP analysis of DNA extracted from nematodes, originating from field NI5-20 and NI6-20, collected in water using the Baermann funnel method and extracted by CTAB (Intertek ScanBi Diagnostics, ISD): (a) Number of M. hapla juveniles in 250 g of soil (ISD); (b) Cycle threshold values obtained by qPCR and rt-LAMP using same DNA aliquots.
Horticulturae 08 00087 g002
Figure 3. rt-LAMP analysis of Meloidogyne hapla in soil samples collected from field NI5–20 and NI6–20 (n = 5), DNA extracted with SKMM and FastDNA kit for soil followed by DNA purification with the Wizard DNA and MicroSpin S-300 HR Columns commercial kits: (a) Representative standard curve generated using DNA from 16 J2 in MQ water at 1.6 to 0.0016 (10−1–10−4 dilutions) (12 ng µL−1– 2 pg µL−1) (n = 3); (b) Number of M. hapla juveniles 250 g−1 soil; (c) Representative standard curve generated using gBlockHSP at 193,000 to 193 gene copies (n = 3); (d) Number of target gene copies g−1 soil. Note: Log on x-axis (a,c) and y-axis (b,d).
Horticulturae 08 00087 g003
Figure 4. rt-LAMP analysis of Meloidogyne hapla, representative amplification curve of DNA extracted from soil sample NI5-20–w with SKMM (n = 4) and gBlockHSP at 193,000 to 193 gene copies 5 µL−1 (n = 3).
Horticulturae 08 00087 g004
Table 1. Extraction of Meloidogyne hapla DNA with different silica products, SDS volumes and skim milk concentrations and their effects on DNA concentration and quality.
DNA 1
(ng µL−1)
Absorbance Ratios 2
(A260/A280)(A260/A230)
Silica
Celite 545 WA59 ± 6.8a1.5 ± 0.07a0.07 ± 0.02a
Celite 545 FA70 ± 7.3a1.4 ± 0.04a0.07 ± 0.10a
pnsnsns
CV341355
SDS volume (µL)
2554 ± 2.2b1.5 ± 0.03a0.05 ± 0.12b
5058 ± 1.6b1.5 ± 0.11a0.06 ± 0.01ab
10081 ± 2.4a1.4 ± 0.06a0.11 ± 0.02a
pp < 001ns0.03
CV331355
Skim milk concentration (% w/v)
3.222 ± 1.7a1.7 ± 0.01a0.2 ± 0.06a
423 ± 2.4a1.6 ± 0.02a0.2 ± 0.03a
520 ± 0.5a1.6 ± 0.02ab0.2 ± 0.03a
624 ± 1.3a1.5 ± 0.01b0.2 ± 0.04a
pnsp < 001ns
CV13435
1,2 Mean values ± Standard Error (SE). Letters represents the significant differences assessed by Tukey’s HSD-test (p ≤ 0.05).
Table 2. Concentration and absorbance ratios of DNA extracted from artificially infested soil samples collected in 2017 (NF-17) and naturally infested soil samples collected in 2019–2020 (NI19–NI20) using commercial kits and the manual DNA extraction procedure, SKMM.
DNA (µg g−1 Soil)Absorbance Ratios Corr. Coeff 8
(A260/A280)(A260/A230)(r)
NF-17 1
Kit 1 415 ± 0.59a1.80 ± 0.0b0.22 ± 0.017c
Kit 2 511 ± 0.51b1.83 ± 0.01a0.36 ± 0.017b
Kit 3 68 ± 0.38c1.81 ± 0.0b0.90 ± 0.03a0.98
SKMM 78 ± 0.53c1.80 ± 0.0b0.99 ± 0.04a0.83
p<0.0001 0.0005 <0.0001
CV37.1 1.9 66.1
NI-19 2
Kit 128 ± 5.0a1.65 ± 0.02c0.20 ± 0.02c
Kit 210 ± 0.8b1.78 ± 0.01a0.17 ± 0.01c
Kit 36 ± 0.4d1.74 ± 0.01b0.57 ± 0.02b0.93
SKMM7 ± 0.3c1.76 ± 0.01a0.81 ± 0.02a0.83
p<0.0001 <0.0001 <0.0001
CV167.9 6.2 69.3
NI-20 3
Kit 113 ± 1.4a1.75 ± 0.02b0.10 ± 0.01c
Kit 25 ± 0.37b1.79 ± 0.01a0.13 ± 0.01c
Kit 33 ± 0.25c1.80 ± 0.01a0.49 ± 0.03b0.60
SKMM6 ± 0.26b1.72 ± 0.01b0.62 ± 0.02a0.86
p<0.0001<0.0017<0.0001
CV106782
1 NF-17: root-knot (RKN) nematode free soil collected in 2017; 2 NI-19: naturally RKN-infested soil collected in 2019; 3 NI-20: naturally RKN-infested soil collected in 2020; 4 Kit 1: FastDNA kit for soil (FD kit 1) (extraction); 5 Wizard DNA kit (kit 2) (DNA purification step 1); 6 MicroSpin S-300 HR Columns (kit 3) (DNA purification step 2); 7 SKMM (Skim milk procedure); 8 correlation between DNA concentration and soil organic matter content. Mean values ± Standard Error (SE). Letters represents the significant differences assessed by Tukey’s HSD-test (p ≤ 0.05).
Publisher’s Note: MDPI stays neutral with regard to jurisdictional claims in published maps and institutional affiliations.

