Abstract
Watercore is a physiological disorder in pineapples, which is expressed as fluid deposition in intercellular spaces and presents as water soaked. This disorder affects the fruit quality and decreases storage life, resulting in enormous commercial losses to growers and restricting the development of the pineapple industry in China. However, the molecular mechanism of watercore remains unclear. In order to elucidate the molecular mechanism of pineapple watercore, the transcriptome analyses of watercored and normal fruits were carried out in pineapples for the first time using de novo RNA-seq technology. High-quality reads of 46.66 and 43.71 M were obtained in the transcriptomes of normal and mildly watercored fruits, respectively. Clean reads of 45.50 and 42.79 M were obtained after filtering the original data. These genes are useful resources in subsequent pineapple watercore research. Fifty genes in phenylpropanoid biosynthesis, glucose metabolism, calcium transport, and cell wall metabolism were considerably different between normal and watercored fruits. Among them, the expressions of the AcPME, AcBGLU43, Ac4CL5, AcPER1, and AcPOD genes were upregulated by 7–21 times in watercored fruit, while the expressions of AcSUS7 were downregulated by 16.61 times, and the expressions of other differential genes were upregulated or downregulated by more than 2 times. A total of 38 differentially expressed transcription factors were obtained by screening. Among these transcription factors, WRKY was the most abundant, followed by MYB. The acquisition of these genes is important for the first understanding of the molecular mechanism of this physiological disorder.
1. Introduction
The pineapple (Ananas comosus) is a perennial herbaceous plant belonging to the bromeliad family and is one of the most important crops in tropical and subtropical areas [1]. However, in recent years, the watercore disorder has occurred in the main pineapple producing areas of China (the main variety is ‘Comte de Paris’), which leads to the water soaking of the flesh of the pineapple in the near-mature stage. This gives off the taste of lees and over-ripeness, thus losing the commercial value [2]. The disease occurs 2–4 weeks before the pineapple harvest, greatly reducing the economic value of the pineapples and restricting the development of the pineapple industry to a certain extent.
Through the measurement of environmental and fruit temperature, it was found that the incidence of watercore in pineapples was closely related to the temperature 4 weeks before harvesting. It has been preliminarily suggested that high temperatures before the harvest are an inducement of watercoring [3,4]. Through the determination and analysis of the enzyme activities related to sucrose metabolism, it has been suggested that the accumulation of sugar and the enzyme activities of glucose metabolism, especially the activity of cell wall invertase, are closely related to the occurrence of watercore. At the same time, fruit maturity and crown, slip, and leaf removal are also related to the occurrence of watercore [2,4,5]. Further studies showed that spraying calcium 10 weeks before the harvest could reduce the incidence of watercore, suggesting that the disease may be related to the reduction of calcium ion concentration [6]. However, up until now, the pathogenesis of pineapple watercore has not been reported at the transcription level.
In recent years, transcriptome sequencing has been used to study the pathogenesis of fruit tree diseases. Nishitani et al. analyzed the pathogenesis of watercore in Japanese pears with transcriptome sequencing and identified 115 differentially expressed genes, including genes related to sugar metabolism, hormones, and the cell wall [7]. Orcheski et al. found that MdMADS5 and MdIDL1 could be the key candidate genes through the transcriptome sequencing of healthy and bitter pit-affected ‘Honeycrisp’ fruit [8]. The completion of pineapple genome sequencing provides an important basis for systematically and deeply exploring the functional genes of pineapples and revealing the molecular mechanism of fine traits. Transcriptome sequencing on the basis of reference genomes can more accurately and efficiently study tissue-specific expression and the dynamic rule of differentially expressed genes without stress [9]. In this study, based on previous experimental studies, transcriptome sequencing was performed on healthy and watercored fruit so as to explore the possible pathogenesis of pineapple watercore and provide the basis for the further prevention and treatment of this disease.
2. Materials and Methods
2.1. Plant Material
The ‘Comte de Paris’ pineapple variety was used as plant material. Twenty pineapple fruits with the same fruit maturity and no mechanical damage were selected, and the incidence of watercore was observed after cutting. In accordance with the incidence of watercore, the pulps of normal (CK) and mildly watercored fruit (MS) were selected (Figure 1), quickly frozen in liquid nitrogen, and stored at −80 °C in a refrigerator for further use. Three biological replicates were used.
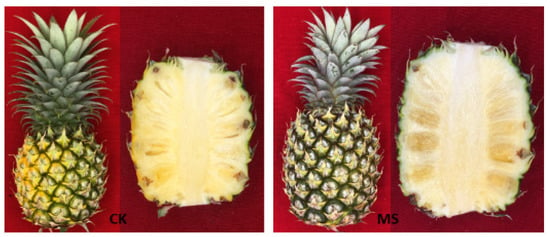
Figure 1.
Fruit and pulp of normal fruit (CK) and mildly watercored (MS) pineapple.
2.2. Assays for Monosaccharide Content
The samples were from two types of pineapple flesh, CK and MS. The sucrose, glucose, and fructose contents of the flesh were determined by high-performance liquid chromatography (HPLC) in accordance with the method of Zhang et al. [10].
2.3. Determination of Cell Wall Composition
The extraction and measurement of cell wall composition (pectin, hemicellulose, and cellulose) were performed as described by Phothiset and Charoenrein [11].
2.4. Assays for Calcium Content
Calcium content was assessed as described by Miqueloto et al. [12].
2.5. Extraction and Determination of Total Phenolic Content
The total phenolic content was measured in accordance with the method of Zupan et al. [13].
2.6. RNA Extraction, cDNA Library Preparation, and RNA Sequencing
The total RNA was isolated using a Quick Plant microRNA Isolation Kit (Huayueyang Biotech Co., Beijing, China) following the manufacturer’s protocol. The concentrations of the samples were quantified using a NanoDrop 2000C spectrophotometer (Thermo Fisher Scientific, Waltham, MA, USA). The RNA integrity was evaluated using an Agilent 2100 Bioanalyzer (Agilent Technologies, Santa Clara, CA, USA). Samples with RNA integrity numbers ≥7 were subjected to subsequent analysis. Libraries were constructed using a TruSeq Stranded mRNA LTSample Prep Kit (Illumina, San Diego, CA, USA) in accordance with the manufacturer’s instructions. An Illumina Hiseq X Ten system was used for the high-throughput sequencing of the constructed library to generate 125 or 150 bp double-ended data. The sequencing work was completed by OE Biotech Co., Ltd. (Shanghai, China).
2.7. Quality Control and Mapping
A large number of Raw data were sequenced, and clean reads were obtained by removing the joint sequence, primer sequence, and low-quality reads in the raw data. The data quality was determined by base mass value Q30 and GC content. We used hisat2 [14] for the clean reads and pineapple genome sequence alignment (http://pineapple.zhangjisenlab.cn/pineapple/html/index.html, accessed on 9 May 2022), its position in the reference genome or genetic information, and the specific sequence characteristic information of the sequencing samples.
2.8. Differential Gene Expression and Enrichment Analysis
The fragments per kilobase of exon model per million mapped reads (KPKM) value was used to measure the abundance value of gene expression, and the influence of gene length and sequencing volume differences on gene expression was eliminated. The calculated gene expression levels could be directly used to compare the gene expression differences among different samples. The screening standards of differentially expressed genes (DEGs) were p value < 0.05 and fold-change > 2 or fold-change < 0.5. The gene ontology (GO) gene function annotation and Kyoto encyclopedia of genes and genomes (KEGG) pathway enrichment analysis were conducted for the selected DEGs.
2.9. Gene Expression Analysis by Using Quantitative Real-Time PCR
To validate the accuracy and repeatability of the RNA-seq analysis, we selected 18 key DEGs related to phenylpropanoid biosynthesis and performed a qRT-PCR expression analysis between CK and MS. The gene-specific primers used in the qRT-PCR analysis are listed in Supplementary Table S1. Quantitative real-time PCR was performed using a LightCycler 480 II System (Roche, Basel, Switzerland) and a FastStart Essential DNA Green Master Kit (Roche, Indianapolis, IN, USA). AcActin (HQ148720) was used as a reference gene [15]. The relative expression levels were analyzed using the 2−ΔΔCt method.
2.10. Data Analysis
The data were analyzed by variance and compared by means of the Duncan test. An SPSS 26 software package was used for the statistical analysis.
3. Results
3.1. Phenotype and Physiology Responses of Pineapples with Watercore
The change of monosaccharide content is shown in Figure 2. MS had lower contents of sucrose and glucose and a higher content of fructose than CK. The contents of sucrose and glucose in MS decreased by 30% and 15.87%, respectively. However, no significant difference in the fructose level was determined between CK and MS. The cell walls of higher plants are composed of polysaccharides, such as pectin, cellulose, and hemicellulose, and a small amount of protein. As shown in Figure 3A, the contents of the cell wall components in MS were significantly lower than those in CK. The contents of total pectin, hemicellulose, and cellulose in MS were 14.6%, 2.6%, and 6.9% lower than those in CK, respectively. No significant difference in hemicellulose and cellulose contents was observed between CK and MS. The results showed that the calcium content in MS was significantly lower than that in CK, with a decrease of 16.38% (Figure 3B). As shown in Figure 3C, the total phenolic content in MS was lower than that in CK, but the difference was not significant.
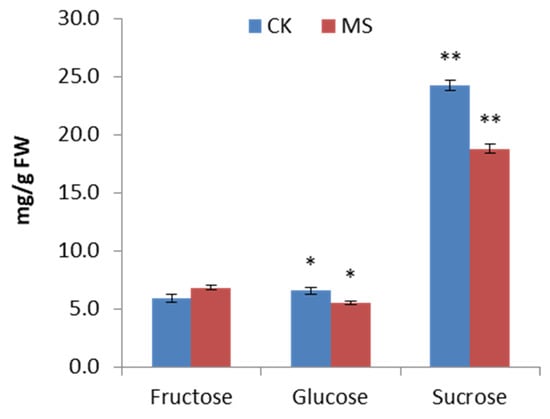
Figure 2.
Contents of individual sugars in CK and MS pineapple flesh. CK: normal fruit; MS: mildly watercored fruit. ANOVA was used to compare the monosaccharide content between CK and MS; error bar represents the standard deviation of the three replicates. * p < 0.05, ** p < 0.01.
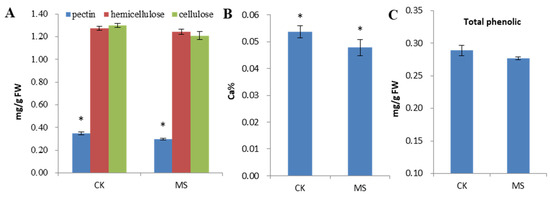
Figure 3.
Changes in the physiological indices of CK and MS pineapple flesh. (A) Content of cell wall components; (B) calcium content; (C) total phenolic content. CK: normal fruit; MS: mildly watercored fruit. ANOVA was used to compare the index content between CK and MS; error bar represents the standard deviation of the three replicates. * p < 0.05.
3.2. Transcriptome Assembly
After RNA library construction and sequencing, a total of 40.67 Gb of raw data were obtained from the CK and MS samples. We obtained 37.94 Gb of clean reads by purification and mass filtration, and the base percentage (Q30) was greater than 96% (Table S2). The clean reads were sequentially compared with the pineapple genome using hisat2, and the alignment rate was 84.40–93.54% (Table 1).

Table 1.
Statistical results of reads and reference pineapple genome alignment in normal fruit (CK) and mildly watercored fruit (MS).
3.3. Functional Annotation and Classification of DEGs
The results showed that 625 and 438 genes were upregulated and downregulated, respectively (Figure 4A). GO analysis showed that 778 DEGs were divided into 47 GO functional groups, which were distributed into three main categories: biological process, cellular components, and molecular function (Figure 4B). Within the biological process category, genes encoding proteins related to cellular (53.98%) and metabolic processes (46.65%) were the most enriched. Among the molecular function category, genes encoding catalytic active-related proteins (54.11%) and binding proteins (53.47%) were the most enriched. Within the cell component category, cells (71.97%), cell parts (71.97%), and organelles (52.31%) were the most abundant genes. The KEGG pathway analysis showed that 355 DEGs belonged to 21 KEGG pathways, among which 236 genes belonged to metabolic pathways. Of the 236 genes, 44 percent were classified as carbohydrate metabolism, and 35 percent were classified as a biosynthesis of other secondary metabolites (Figure 4C).
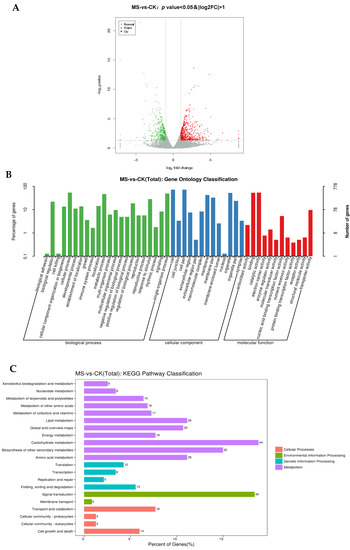
Figure 4.
Functional enrichment analysis of differentially expressed genes (DEGs) between CK and MS. (A) Volcano plot of all detected genes between CK and MS; (B) GO enrichment of DEGs between CK and MS; (C) KEGG pathway analysis of DEGs between CK and MS. CK: normal fruit; MS: mildly watercored fruit.
3.4. Isolation of Genes Related to Pineapple Watercore
A total of 50 genes related to phenylpropyl metabolism, glucose metabolism, calcium transport, and cell wall metabolism were screened out according to the transcriptome differential expression gene data. Among them, the AcBGLU16, AcBGLU18, AcBGLU26, and AcBGLU43 genes were involved in glucose and phenylpropanoid metabolism, as shown in Table 2. The phenylpropanin metabolism pathway involves 27 DEGs, of which 20 DEGs are upregulated and 7 DEGs are downregulated. There were 13 DEGs in the glucose metabolism pathway, of which 9 were upregulated and 4 were downregulated. There were seven DEGs in calcium transport, of which two were upregulated and five were downregulated. There were seven DEGs in cell wall metabolism, of which two were upregulated and five were downregulated.

Table 2.
Genes with different expression levels between MS and CK. Up, expression in MS > expression in CK; down, expression in MS < expression in CK.
3.5. Isolation of Transcription Factors (TFs) Related to Pineapple Watercore
To identify the TFs involved in the watercore response, we analyzed the TFs of DEGs. A total of 38 TFs, covering nine families of TFs, were identified (Figure 5). The results showed that the TFs HSF, GATA, NAC, and MYB were only upregulated, and MADS was only downregulated in MS vs. CK, while bZIP, ERF, bHLH, and WRKY were both upregulated and downregulated. The proportion of the up/down regulations of bzip was 3/2; ERF, bHLH, and WRKY were all 3/1.
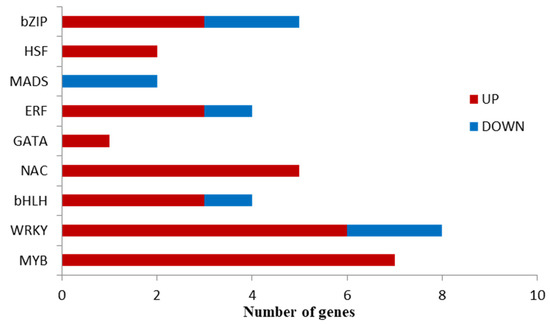
Figure 5.
TFs differentially expressed in pineapples with watercore.
3.6. Confirmation of DEGs Related to the Phenylpropanoid Biosynthesis Pathway Using qRT-PCR
The 18 DEGs that may be related to the pathogenesis of pineapple watercore were analyzed and verified with RT-qPCR, and the results are shown in Figure 6. The results indicated that most gene expression patterns were similar using both methods. Similar results from the log2Fold (qRT-PCR) and log2Fold change (RNA-seq) analyses indicated that the RNA-seq data were reliable.
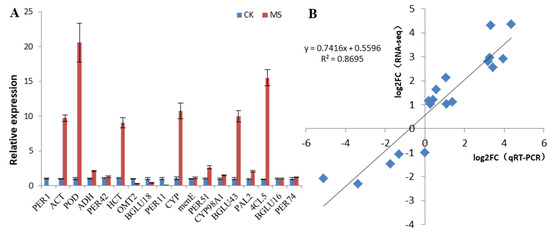
Figure 6.
qRT-PCR validation of 18 selected genes. (A) Gene expression analysis based on qRT-PCR; (B) Pearson correlation analysis between RNA-seq and qRT-PCR expression profiles.
4. Discussion
Previous studies on apple and pear watercore found that the accumulation of sorbitol may be a cause of watercore. Fruit affected by watercore had lower fructose and glucose contents, but higher sorbitol content [16,17]. The reason for the accumulation of sorbitol is that the reduction of sorbitol transport ability leads to the accumulation of sorbitol in the intercellular space, thus inducing the occurrence of watercore [18]. The accumulation of sugar and the activity of glucose-metabolizing enzymes in pineapples have also been suggested as a cause of watercore [2,4]. Pineapple watercore may be related to the accumulation of sugar because pineapple basal tissue has 3% to 4% higher total soluble solids than pineapple top tissue [2]. However, the sucrose and glucose contents in watercored fruits are less than those in normal fruits. Regardless of whether the occurrence of watercore is related to sugar accumulation or reduction, our data suggested that sugar metabolism genes are differentially expressed in fruits. Other studies have suggested that watercore is related to changes in membrane permeability and integrity and is associated with maturation [19]. The composition and structure of cell walls were changed in the watercored fruit, and the low accumulation of cell wall components may lead to watercore in pears [20,21]. The results of this study showed that the contents of pectin, hemicellulose, and cellulose in watercored pineapple fruits were lower than those in normal fruits, and this finding was consistent with the results of the study on pears with watercore disorder. The phenylpropanoid pathway is also closely related to the occurrence of watercore. The Cebulj et al. study showed that the content of dihydrochaldone in the flesh of watercored fruit was higher, and the activity of enzymes related to the phenylpropane pathway significantly changed in the early stages of watercore [22]. Zupan et al. showed that watercore had an effect on the sugar and phenol contents of apple fruit before internal decomposition and browning [13]. The total phenolic content in pineapples with watercore in this study was consistent with research results in apples. Calcium deficiency can weaken the tolerance of plants to biotic and abiotic stresses, leading to the occurrence of some physiological diseases that seriously affect the quality of fruits [23,24], e.g., apple bitter pit [25], citrus crease [26], and litchi cracking [27]. Studies have shown that the occurrence of watercore decreases due to calcium fertilization during fruit development [28,29]. The results of this study showed that the calcium content of fruit with watercore was significantly lower than that of the control, suggesting that the occurrence of pineapple fruit with watercore may be related to calcium deficiency.
For plants, RNA-seq technology makes a remarkable contribution to the understanding of gene expression level and aims to understand which genes are involved and expressed in various mechanisms, organs, and cells. At present, the application of RNA-seq in the molecular mechanism of watercore has been reported. Nishitani et al. conducted a transcriptome analysis of watercore in Japanese pears by comparing susceptible and resistant F1 sibs and identified a total of 115 genes related to glucose metabolism, hormones, and cell walls [7]. Cebulj et al. conducted a transcriptome analysis on healthy and watercore-affected apples and found the upregulated expression of the early flavonoid pathway, sorbitol metabolism, and stress-related genes in the healthy flesh of watercore-affected fruits [22]. These studies provide a possibility for the transcriptome analysis of the pathogenesis of pineapple watercore.
Phenolic compounds are the most important secondary metabolites in fruits and vegetables, which can scout free radicals and have antioxidant and antiaging properties. In this study, the 9 AcPER, 2 AcPAL, 2 Ac4CL, 1 AcCAD, and 2 AcCYP genes were differentially expressed. These genes may be involved in the regulation of resistance to watercore by regulating the synthesis and accumulation of downstream secondary metabolites, lignin, and flavonoids [30]. PMEs, PG, β-GAL, and XET are the key enzymes in plant cell wall degradation; participate in the cell wall degradation of blueberries [31], pears [32], and cherimoyas [33]; and promote fruit softening. In this study, the expression levels of the AcPME and AcXET genes were upregulated in pineapples with watercore, thus promoting the degradation of the pineapple pulp cell wall.
Calcium is an indispensable element for plant growth and development and has many irreplaceable physiological functions, such as building cell walls, stabilizing cell membranes, participating in signal transduction, and maintaining cell ion balance [34]. Plants can use Ca2+ channels, Ca2+/H+ exchangers, Ca2+-ATPase (ACA), and calcium-binding proteins to regulate the calcium content in cells. ACA and Ca2+/H+ exchangers can actively transport Ca2+ to vacuoles [35,36], thus maintaining low cytoplasmic Ca2+ levels. In this study, we found that three AcACA genes were downregulated in watercored fruit. Calcium-binding proteins include calmodulin/calmodulin-like proteins (CaMs/CMLs), calcineurin-B-like proteins (CBLs), and calcium-dependent protein kinases (CDPKs) [37]. CBLs, CaMs, and CMLs function by regulating the activities of downstream targets. However, CDPKs only act as catalytic proteins and are sensor responders that bind calcium ions and regulate their enzymatic activities. CaM gene expression in tomato, strawberry, and Arabidopsis is affected by ABA, SA, GA, and other plant growth regulators [38,39,40]. Studies on the CML gene in Arabidopsis showed that AtCML9 plays a negative regulatory role in Arabidopsis under drought and salt stress conditions [41]. Arabidopsis AtCPK1 can promote cell death and organ senescence by phosphorylating the core-aging-related transcription factor ORE1 and enhancing ORE1 transcriptional activation activity [42]. Potato StCDPK4 promotes the production of reactive oxygen species in the extracellular space by phosphorylating RBOHB, thereby inducing programmed cell death [43]. In this study, we found that the AcCDPK and AcCaM genes were upregulated, but two AcCML genes were downregulated in watercored fruit. Thus, we speculated that due to the downregulation or upregulation of calcium transport genes, calcium metabolism disorder is caused, and the stress resistance of pineapples is reduced, leading to the occurrence of watercore.
Some TFs are differentially expressed in watercored and normal fruits. Genes for at least seven MYB-like proteins have been detected. MYB transcription factor plays an important role in various processes of plant growth and development, such as regulating the biosynthesis of secondary metabolites, participating in various stress responses, and responding to plant hormone responses [44,45]. The identification of components affected by these MYB genes may provide molecular markers for predicting watercore before its symptoms become visible.
5. Conclusions
The occurrence of pineapple watercore is a complex process involving multiple genes and various metabolic processes. The results of this study showed that the expression levels of genes related to phenylpropanoid biosynthesis, calcium transport, glucose metabolism, and cell wall metabolism were increased or decreased, resulting in incomplete cell wall structure, accelerated degradation of the cell wall, and the occurrence of watercore (Figure 7). The results provide reference for the molecular mechanism of pineapple watercore from the transcriptional level and genetic resources for the exploration of key functional genes of watercore.
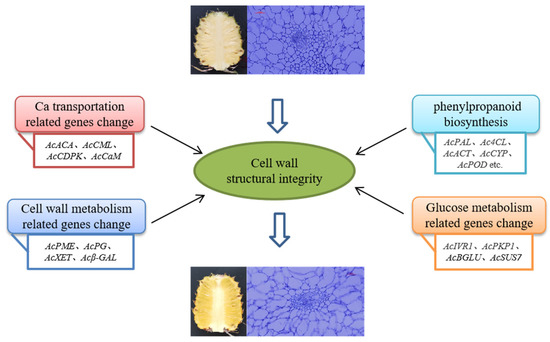
Figure 7.
Speculated molecular mechanism of pineapple watercore.
Supplementary Materials
The following supporting information can be downloaded at: https://www.mdpi.com/article/10.3390/horticulturae8121175/s1, Table S1: Sequences of primers used for qRT-PCR analysis for normal and watercore pineapple; Table S2: Results of normal fruit (CK) and mild watercore fruit (MS) sequencing data quality.
Author Contributions
Conceptualization, Y.Y. and X.Z.; methodology, Y.Y., Q.F. and Z.Z.; software, W.L.; formal analysis, M.L.; data curation, S.L., Q.W. and Y.G.; writing—original draft preparation, Y.Y.; writing—review and editing, Y.Y. and X.Z.; visualization, M.L.; supervision, Y.Y. and X.Z.; project administration, Y.Y. All authors have read and agreed to the published version of the manuscript.
Funding
This research was funded by Hainan Provincial Natural Science Foundation of China, grant number 2019RC287; the Natural Science Foundation of Guangdong Province, grant number 2019A1515011186; and the Guangdong Provincial Special Fund for Modern Agriculture Industry Technology Innovation Teams, grant number 2022KJ109.
Data Availability Statement
The raw transcriptome data have been submitted to NCBI SRA under the project number: PRJNA889062.
Acknowledgments
The authors acknowledge the financial support provided by the Science and Technology Departments of the Hainan and Guangdong Provinces.
Conflicts of Interest
The authors declare no conflict of interest.
References
- Ali, M.M.; Hashim, N.; Aziz, S.A.; Lasekan, O. Pineapple (Ananas comosus): A comprehensive review of nutritional values, volatile compounds, health benefits, and potential food products. Food Res. Int. 2020, 137, 109675. [Google Scholar] [CrossRef]
- Chen, C.C.; Paull, R.E. Sugar metabolism and pineapple flesh translucency. J. Am. Soc. Hortic. Sci. 2000, 125, 558–562. [Google Scholar] [CrossRef]
- Chen, C.C.; Paull, R.E. Fruit temperature and crown removal on the occurrence of pineapple fruit translucency. Sci. Hortic. 2001, 88, 85–95. [Google Scholar] [CrossRef]
- Paull, R.E.; Reyes, M.E. Preharvest weather conditions and pineapple fruit translucency. Sci. Hortic. 1996, 66, 59–67. [Google Scholar] [CrossRef]
- Murai, K.; Chen, N.J.; Paull, R.E. Pineapple crown and slip removal on fruit quality and translucency. Sci. Hortic. 2021, 283, 110087. [Google Scholar] [CrossRef]
- Cano-Reinoso, D.M.; Kharisun, K.; Soesanto, L.; Wibowo, C. Effect of calcium and silicon fertilization after flowering on pineapple mineral status and flesh translucency. Plant Physiol. Rep. 2022, 27, 96–108. [Google Scholar] [CrossRef]
- Nishitania, C.; Inoueb, E.; Saitoa, T.; Ogatac, N.; Kitac, K.; Gonaic, T.; Kasumic, M.; Ishiic, R.; Sawamuraa, Y.; Takadaa, N.; et al. Transcriptome analysis of watercore in Pyrus pyrifolia by comparing pairs of susceptible and resistant F1 sibs. Sci. Hortic. 2020, 264, 109136. [Google Scholar] [CrossRef]
- Orcheski, B.; Meng, D.; Bai, Y.; Fei, Z.J.; Cheng, L.L. The transcriptomes of healthy and bitter pit-affected ‘Honeycrisp’ fruit reveal genes associated with disorder development and progression. Tree Genet. Genomes 2021, 17, 37. [Google Scholar] [CrossRef]
- Huang, J.; Zhang, C.M.; Zhao, X.; Fei, Z.J.; Wan, K.K.; Zhang, Z.; Pang, X.M.; Yin, X.; Bai, Y.; Sun, X.Q.; et al. The jujube genome provides insights into genome evolution and the domestication of sweetness/acidity taste in fruit trees. PLoS Genet. 2016, 12, e1006433. [Google Scholar] [CrossRef]
- Zhang, X.M.; Wang, W.; Du, L.Q.; Xie, J.H.; Yao, Y.L.; Sun, G.M. Expression Patterns, Activities and Carbohydrate-Metabolizing Regulation of Sucrose Phosphate Synthase, Sucrose Synthase and Neutral Invertase in Pineapple Fruit during Development and Ripening. Int. J. Mol. Sci. 2012, 13, 9460–9477. [Google Scholar] [CrossRef]
- Phothiset, S.; Charoenrein, S. Effects of freezing and thawing on texture, microstructure and cell wall composition changes in papaya tissues. J. Sci. Food Agric. 2014, 94, 189–196. [Google Scholar] [CrossRef] [PubMed]
- Miqueloto, A.; Amarante, C.V.T.; Steffens, C.A.; Santos, A.; Mitcham, E. Relationship between xylem functionality, calcium content and the incidence of bitter pit in apple fruit. Sci. Hortic. 2014, 165, 319–323. [Google Scholar] [CrossRef]
- Zupan, A.; Mikulic-Petkovsek, M.; Stampar, F.; Veberic, R. Sugar and phenol content in apple with or without watercore. J. Sci. Food Agric. 2016, 96, 2845–2850. [Google Scholar] [CrossRef]
- Kim, D.; Langmead, B.; Salzberg, S.L. HISAT: A fast spliced aligner with low memory requirements. Nat. Methods 2015, 12, 357–360. [Google Scholar] [CrossRef] [PubMed]
- Li, Y.H.; Wu, Q.S.; Xia, H.; Liu, S.H.; Zhang, H.N.; Zhang, Z.; Sun, G.M. Molecular cloning and characterization of four genes encoding ethylene receptors associated with pineapple (Ananas comosus L.) flowering. Front. Plant Sci. 2016, 7, 710. [Google Scholar] [CrossRef] [PubMed]
- Melado-Herreros, A.; Munoz-Garcia, M.A.; Blanco, A.; Val, J.; Fernandez-Valle, M.E.; Barreiro, P. Assessment of watercore development in apples with MRI: Effect of fruit location in the canopy. Postharvest Biol. Tec. 2013, 86, 125–133. [Google Scholar] [CrossRef]
- Yamaki, S.; Kajiura, I.; Omura, M.; Matsuda, K. Watercore in Japanese pear (Pyrus seronita Rehder var. ‘Culta’ Rehder) II Chemical changes in watercored tissue. Sci. Hortic. 1976, 4, 271–277. [Google Scholar] [CrossRef]
- Gao, Z.F.; Jayanty, S.; Beaudry, R.; Loescher, W. Sorbitol transporter expression in apple sink tissues: Implications for fruit sugar accumulation and watercore development. J. Am. Soc. Hort. Sci. 2005, 130, 261–268. [Google Scholar] [CrossRef]
- Li, M.; Feng, F.; Cheng, L. Expression patterns of genes involved in sugarmetabolism and accumulation during apple fruit development. PLoS ONE 2012, 7, e33055. [Google Scholar] [CrossRef]
- Gemma, H.; Oomori, S.; Sugaya, S.; Peng, S.-A.; Iwabori, S. Study on watercore occurrence in ‘Hosui’ Japanese pear. Acta Hort. 2002, 596, 845–850. [Google Scholar] [CrossRef]
- Lee, S.H.; Gemma, S.; Sugaya, Y.; Sekosawa, Y.; Kim, W.S. Changes of cell wall polysaccharides related to watercore in ‘Hosui’ pear fruit (P. pyrifolia) grown in alluvial and volcanic soils. Acta Hort. 2008, 772, 327–332. [Google Scholar] [CrossRef]
- Cebulj, A.; Mikulic-Petkovsek, M.; Lucaciu, C.R.; Veberic, R.; Marinovic, S.; Kolarek, M.; Hutabarat, O.S.; Faramarzi, S.; Rattei, T.; Molitor, C.; et al. Alteration of the phenylpropanoid pathway by watercore disorder in apple (Malus x domestica). Sci. Hortic. 2021, 289, 110438. [Google Scholar] [CrossRef]
- Saure, M.C. Calcium translocation to fleshy fruit: Its mechanism and endogenous control. Sci. Hortic. 2005, 105, 65–89. [Google Scholar] [CrossRef]
- Freitas, S.T.D.; Mitcham, E.J. Factors involved in fruit calcium deficiency disorders. Hortic. Rev. 2012, 40, 107–146. [Google Scholar]
- Volz, R.K.; Alspach, P.A.; Fletcher, D.J.; Ferguson, I.B. Genetic variation in bitter pit and fruit calcium concentrations within a diverse apple germplasm collection. Euphytica 2006, 149, 1. [Google Scholar] [CrossRef]
- Storey, R.; Treeby, M.T.; Milne, J. Crease: Another Ca deficiency-related fruit disorder? J. Hortic. Sci. Biotech. 2002, 77, 565–571. [Google Scholar] [CrossRef]
- Huang, X.M.; Yuan, W.Q.; Wang, H.C.; Li, J.G.; Huang, H.B. Early calcium accumulation may play a role in spongy tissue formation in litchi pericarp. J. Hortic. Sci. Biotech. 2004, 79, 947–952. [Google Scholar] [CrossRef]
- Cano-Reinoso, D.M.; Soesanto, L.; Wibowo, C. Review: Fruit collapse and heart rot disease in pineapple: Pathogen characterization, ultrastructure infections of plant and cell mechanism resistance. Biodiversitas 2021, 22, 2477–2488. [Google Scholar] [CrossRef]
- Chen, N.J.; Paull, R.E. Production and postharvest handling of low acid hybrid pineapple. Acta Hortic. 2017, 1166, 25–34. [Google Scholar] [CrossRef]
- Dixon, R.A.; Paiva, N.L. Stress-Induced Phenylpropanoid Metabolism. Plant Cell 1995, 7, 1085–1097. [Google Scholar] [CrossRef]
- Chen, H.J.; Cao, S.F.; Fang, X.J.; Mu, H.L.; Yang, H.L.; Wang, X.; Xu, Q.Q.; Gao, H.Y. Changes in fruit firmness, cell wall composition and cell wall degrading enzymes in postharvest blueberries during storage. Sci. Hortic. 2015, 188, 44–48. [Google Scholar] [CrossRef]
- Song, L.; Wang, Z.; Wang, Z.; Meng, G.; Zhai, R.; Cai, M.; Ma, F.; Xu, L. Screening of cell wall related genes that are expressed differentially during ripening of pears with different softening characteristics. Postharvest Biol. Tec. 2016, 115, 1–8. [Google Scholar] [CrossRef]
- Li, C.R.; Shen, W.B.; Lu, W.J.; Jiang, Y.M.; Xie, J.H.; Chen, J.Y. 1-MCP delayed softening and affected expression of XET and EXP genes in harvested cherimoya fruit. Postharvest Biol. Tec. 2009, 52, 254–259. [Google Scholar] [CrossRef]
- White, P.J.; Broadley, M.R. Calcium in plants. Ann. Bot. 2003, 92, 487–511. [Google Scholar] [CrossRef]
- Rea, P.A.; Britten, C.J.; Jennings, I.R.; Calvert, C.M.; Skiera, L.A.; Leigh, R.A.; Sanders, D. Regulation of vacuolar H+-pyrophosphatase by free calcium: A reaction kinetic analysis. Plant Physiol. 1992, 100, 1706–1715. [Google Scholar] [CrossRef]
- Shigaki, T.; Rees, I.; Nakhleh, L.; Hirschi, K.D. Identification of three distinct phylogenetic groups of CAX cation/proton antiporters. J. Mol. Evol. 2006, 63, 815–825. [Google Scholar] [CrossRef]
- Mohanta, T.K.; Mohanta, N.; Mohanta, Y.K.; Parida, P.; Bae, H. Genome-wide identification of calcineurin b-like (cbl) gene family of plants reveals novel conserved motifs and evolutionary aspects in calcium signaling events. BMC Plant Biol. 2015, 15, 189. [Google Scholar] [CrossRef]
- Dai, C.; Lee, Y.; Lee, I.C.; Nam, H.G.; Kwak, J.M. Calmodulin 1 regulates senescence and ABA response in Arabidopsis. Front. Plant Sci. 2018, 9, 803. [Google Scholar] [CrossRef]
- Shi, J.Y.; Du, X. Identifcation characterization and expression analysis of calmodulin and calmodulin-like proteins in Solanum pennellii. Sci. Rep. 2020, 10, 7474. [Google Scholar] [CrossRef]
- Zhang, K.; Yue, D.Y.; Wei, W.; Hu, Y.; Feng, J.Y.; Zou, Z.R. Characterization and functional analysis of calmodulin and calmodulin-like genes in Fragaria vesca. Front. Plant Sci. 2016, 7, 1820. [Google Scholar] [CrossRef]
- Magnan, F.; Ranty, B.; Charpenteau, M.; Sotta, B.; Galaud, J.P.; Aldon, D. Mutations in AtCML9, a calmodulin-like protein from Arabidopsis thaliana, alter plant responses to abiotic stress and abscisic acid. Plant J. 2008, 56, 575–589. [Google Scholar] [CrossRef] [PubMed]
- Durian, G.; Sedaghatmehr, M.; Matallana-Ramirez, L.P.; Schilling, S.M.; Schaepe, S.; Guerra, T.; Herde, M.; Witte, C.P.; Mueller-Roeber, B.; Schulze, W.X.; et al. Calcium-Dependent Protein Kinase CPK1 Controls Cell Death by In Vivo Phosphorylation of Senescence Master Regulator ORE1. Plant Cell 2020, 32, 1610–1625. [Google Scholar] [CrossRef]
- Kobayashi, M.; Ohura, I.; Kawakita, K.; Yokota, N.; Fujiwara, M.; Shimamoto, K.; Doke, N.; Yoshioka, H. Calcium-dependent protein kinases regulate the production of reactive oxygen species by potato NADPH oxidase. Plant Cell 2007, 19, 1065–1080. [Google Scholar] [CrossRef] [PubMed]
- Li, C.N.; Ng, C.K.-Y.; Fan, L.M. MYB transcription factors, active players in abiotic stress signaling. Environ. Exp. Bot. 2015, 114, 80–91. [Google Scholar] [CrossRef]
- Ambawat, S.; Sharma, P.; Yadav, N.R.; Yadav, R.C. MYB transcription factor genes as regulators for plant responses: An overview. Physiol. Mol. Biol. Plants 2013, 19, 307–321. [Google Scholar] [CrossRef] [PubMed]
Publisher’s Note: MDPI stays neutral with regard to jurisdictional claims in published maps and institutional affiliations. |
© 2022 by the authors. Licensee MDPI, Basel, Switzerland. This article is an open access article distributed under the terms and conditions of the Creative Commons Attribution (CC BY) license (https://creativecommons.org/licenses/by/4.0/).