Article

Phenological Study of 53 Spanish Minority Grape Varieties to Search for Adaptation of Vitiviniculture to Climate Change Conditions

1
Instituto Madrileño de Investigación y Desarrollo Rural Agrario y Alimentario (IMIDRA), Finca El Encín, 28805 Alcalá de Henares, Spain
2
Instituto de Investigación y Formación Agraria y Pesquera de Andalucía (IFAPA), Rancho de la Merced, Ctra. Cañada de la Loba, pk 3.1, 11471 Jerez de la Frontera, Spain
3
Institut Català de la Vinya i el Vi (INCAVI), Plaça Àgora 2-3, 08720 Vilafranca del Penedès, Spain
4
Institut de Recerca i Tecnologia Agroalimentaria (IRTA), Torre Marimon, Crta. C-59, km 21.1, 08140 Caldes de Montbui, Spain
5
Instituto Tecnológico Agroalimentario de Extremadura (CICYTEX, INTAEX), Av. Adolfo Suárez, s/n, 06007 Badajoz, Spain
6
Estación de Viticultura y Enología de Galicia (EVEGA), Ponte San Clodio s/n, 32428 Leiro, Spain
7
Misión Biológica de Galicia (MBG-CSIC), Edificio Cruz Gallastegui, Carballeira, 8. Salcedo, 36143 Pontevedra, Spain
8
Estación de Viticultura y Enología de Navarra (EVENA), C. del Valle de Orba, 34, 31390 Olite, Spain
*
Author to whom correspondence should be addressed.
Horticulturae 2022, 8(11), 984; https://doi.org/10.3390/horticulturae8110984
Submission received: 7 September 2022 / Revised: 18 October 2022 / Accepted: 19 October 2022 / Published: 22 October 2022
(This article belongs to the Special Issue The State of The Art of Horticulture Science in Spain)

Abstract

:
The main phenological stages (budburst, flowering, veraison, and ripeness) of 53 Spanish minority varieties were studied to determine their potential to help winegrowers adapt to climate change conditions. In total, 43 varieties were studied in the same location in Spain (Alcalá de Henares, in the Madrid region) and 10 varieties in 5 other regions (Galicia, Navarre, Catalonia, Extremadura, and Andalusia). Other traits of agronomic and oenological interest, such as yield and acidity, were also monitored. The results allow for the grouping of the varieties into several clusters according to the time of ripeness (very early—only for red varieties—and early, intermediate, and late, for both red and white varieties) and yield (high, medium, and low). The total acidity in the grape juice ranged from 3 to 11 g of tartaric acid/L. The average temperatures were higher (up to 3–4 °C during summer) compared to historical averages during the 1957–2021 time period. Advanced phenology phases and reduced acidity are regarded as negative effects of climate change for winegrowing practices. Since some minority varieties showed late or intermediate ripening, high acidity, and high (1 Kg/shoot) or medium (0.5 Kg/shoot) yield, our findings suggest that they may be cultivated in the coming years by winegrowers as an approach to mitigate climate change effects.

1. Introduction

Climate is the most decisive factor in wine production [1]. Climate change, particularly leading to warmer and drier conditions, is exerting an increasingly profound influence on vine phenology and grape composition, ultimately affecting wine characteristics. Among the most important climate change-related effects are advanced harvest times and temperatures, increased grape sugar concentrations that lead to high wine alcohol levels, lower acidities, and modification of varietal aroma compounds. Vineyard yield and wine quality are strongly influenced by climatic conditions and are dependent on intricate interactions between temperatures, water availability, plant material, and viticultural practices. In the vast majority of winegrowing regions, winegrowers have improved yield and quality by using plant material and viticultural practices suited to local climatic conditions, but these will need to be adjusted as the climate changes. Adaptations to higher temperatures include changing plant material and modifying viticultural practices, such as harvest dates [2].
Several studies have described the impact of climate change on viticulture worldwide. The phenology of grapevines tends towards the earlier occurrence of its phases, accompanied by an alteration in sugar and acid composition with effects on the typicity and quality of wines [3,4]. By 2050, in some regions harvest, could occur up to 45 days earlier than current harvest times [5]. Furthermore, heat events, which are also linked to climate change, have been found to delay ripening in berries and to cause a significant reduction in berry quality [6]. The total soluble solids, pH, and titratable acidity of berry juice at harvest are affected by the variety and thermal regime. However, the assumption that elevated temperature reduces titratable acidity and increases pH is an oversimplification that highlights the risk of generalizations based on indirect evidence, where temperature is confounded with other factors [7].
Recent studies in various ecological zones of La Rioja (Spain) focusing on the Tempranillo variety, which covers more than 50,000 ha in this region and is widely cultivated in Spain, are in line with the above scenarios. These studies predict that all phenological stages will suffer an advance, which will be higher for the last stages (veraison and ripeness) than for the first ones (budburst and flowering). The shortening of the periods between phenological stages is also predicted. Grape composition could also suffer changes, reaching the required maturity earlier, with a decoupling between anthocyanins and sugars and with lower acidity caused by the increase in temperatures [8].
The phenological diversity of wine grape varieties (Vitis vinifera subsp. vinifera) provides a tool to help growers adapt to shifting climates [9]. Different grapevine varieties exhibit different temperature requirements to reach key phenological stages. Understanding the temperature requirements of different cultivars using temperature-based phenological modeling can provide information about a variety’s suitability for changing temperatures. This enables vine growers to adapt to climate change by using varieties that may be more suited to future warmer conditions [10,11,12].
Exploiting the existing genetic diversity could, therefore, be useful to mitigate the predicted impacts of climate change on viticulture, among other factors, such as management or enological practices [13]. Old World regions, such as Spain, retain a diversity of varieties in traditional local vineyards, where ancestral varieties are cultivated, despite a globalizing wine market in which 70–90% of the vineyard area is planted with only 12 varieties representing, 1% of the total known diversity for grape varieties [14]. Successfully exploiting this diversity for climate change adaptation requires comparative studies under similar environmental conditions carried out over several years. The use of ampelographic collections to assess the adaptation of varieties to climate change has been successful for this goal [15].
The grapevine collection of El Encín, which is located in Alcalá de Henares (Madrid, Spain), holds the highest diversity of old minority Spanish varieties, identified through molecular and morphological approaches. Many of these varieties were prospected in the different Spanish wine-producing regions over the last two decades under a collaboration involving researchers across Spain (Figure 1) and grafted into this collection [16]. The aim of this work is to help to maintain and improve the production and quality of wines in Spain, in view of climate change, by growing varieties with (a) intermediate and late ripening, (b) good yield rates, and (c) appropriate acidity levels in berries. For this reason, the phenological behavior of 43 Spanish minority varieties located in one collection, as well as their yields and acidity, have been evaluated. This has been complemented through the phenological study of the other 10 varieties maintained in the other 4 collections in other Spanish regions.

2. Materials and Methods

The phenology of 53 minority grape varieties (Table 1), 18 white and 35 red or rose, was studied from 2019 to 2021, using the BBCH scale [17]. Tempranillo (red) and Moscatel de grano menudo (white) varieties, which are widely grown in Spain, were used as controls. Most of these varieties (43) were located and studied at Finca El Encín (Alcalá de Henares, Spain). Original plant material had been prospected in the different Spanish wine-producing regions over the last two decades (Figure 1) and grafted in the collection of El Encín. These prospections were performed thanks to the collaboration between viticulture and oenology researchers and winegrowers across Spain. The other 10 varieties were located and studied in other Spanish regions (Galicia, Navarre, Catalonia, Extremadura, or Andalusia). In each case, at least one of these 10 varieties (other than the controls) was also present in the El Encín collection, thus allowing for a better comparison of the results. The ripeness date was determined to be that date when the grapes reached 20–21 °Brix (white varieties) and 21–22 °Brix (red varieties). A total of 10 vines per variety were monitored.
The location of El Encín is considered to have a semiarid Mediterranean climate (40°31′ N, 3°17′ W, 610 m.a.s.l.). The climate data were obtained from the meteorological station located at the collection site. The average precipitation (mm) and temperature (°C) were compiled monthly over the study period.
The vines were planted in 2002, all of which are grafted onto Richter 110 rootstock, trained to a simple cordon, and pruned at eight buds per vine; the vines were adult plants at the time of study. The planting density is 4444 vines/ha (0.90 m × 2.50 m). All varieties were grown under the same cultural practices, including winter pruning, shoot thinning, soil management, and phytosanitary treatments. No thinning of the bunches was performed.
The evaluated phenological phases were: budburst (BBCH 08), flowering 50% (BBCH 65), veraison (BBCH 83), and ripeness (BBCH 89). Within each interphase interval, the average temperature of the interphase interval period (°C) and GDDs (growing degree days) was calculated. The average daily air temperature was calculated by averaging the daily maximum and minimum air temperatures measured in any 24 h period. GDDs were calculated by subtracting the plant’s lower base, or threshold temperature of 10 °C, from the average daily air temperature in °C [18].
The agronomical and oenological parameters were monitored at harvest: yield, °Brix, and acidity in grape juice. Yield (g/shoot) was calculated by determining the average number of bunches per shoot and the average weight of each bunch [19]. The soluble solid concentration, expressed in °Brix, was measured by using a handheld Brix refractometer (PR-101 Palette, ATAGO, Tokyo, Japan). The titratable acid content was determined through titration with sodium hydroxide and by using a digital pH meter [20]. Acidity was calculated as tartaric acid (g/L).

Data Analysis

SPSS software version 23 was used for data analysis [21]. A correlation study was carried out between the GDDs for the white and red varieties at each phenological stage (budburst, flowering, veraison, and ripeness) and time to ripeness (BBCH 89). The Pearson correlation coefficient was calculated in every case. The Shapiro–Wilk and Kolmogorov–Smirnov methods were used to test the normality of the data. A t-test was used to determine if there was a statistically significant difference between the means of the control and the minority varieties. Cluster analysis by K-mean was used to group varieties. Compared to other data reduction techniques, such as principal component analysis aimed at grouping similarities across variables, cluster analysis by K-mean is useful when no causal relationship is sought between the variables.

3. Results and Discussion

3.1. Climatic Conditions

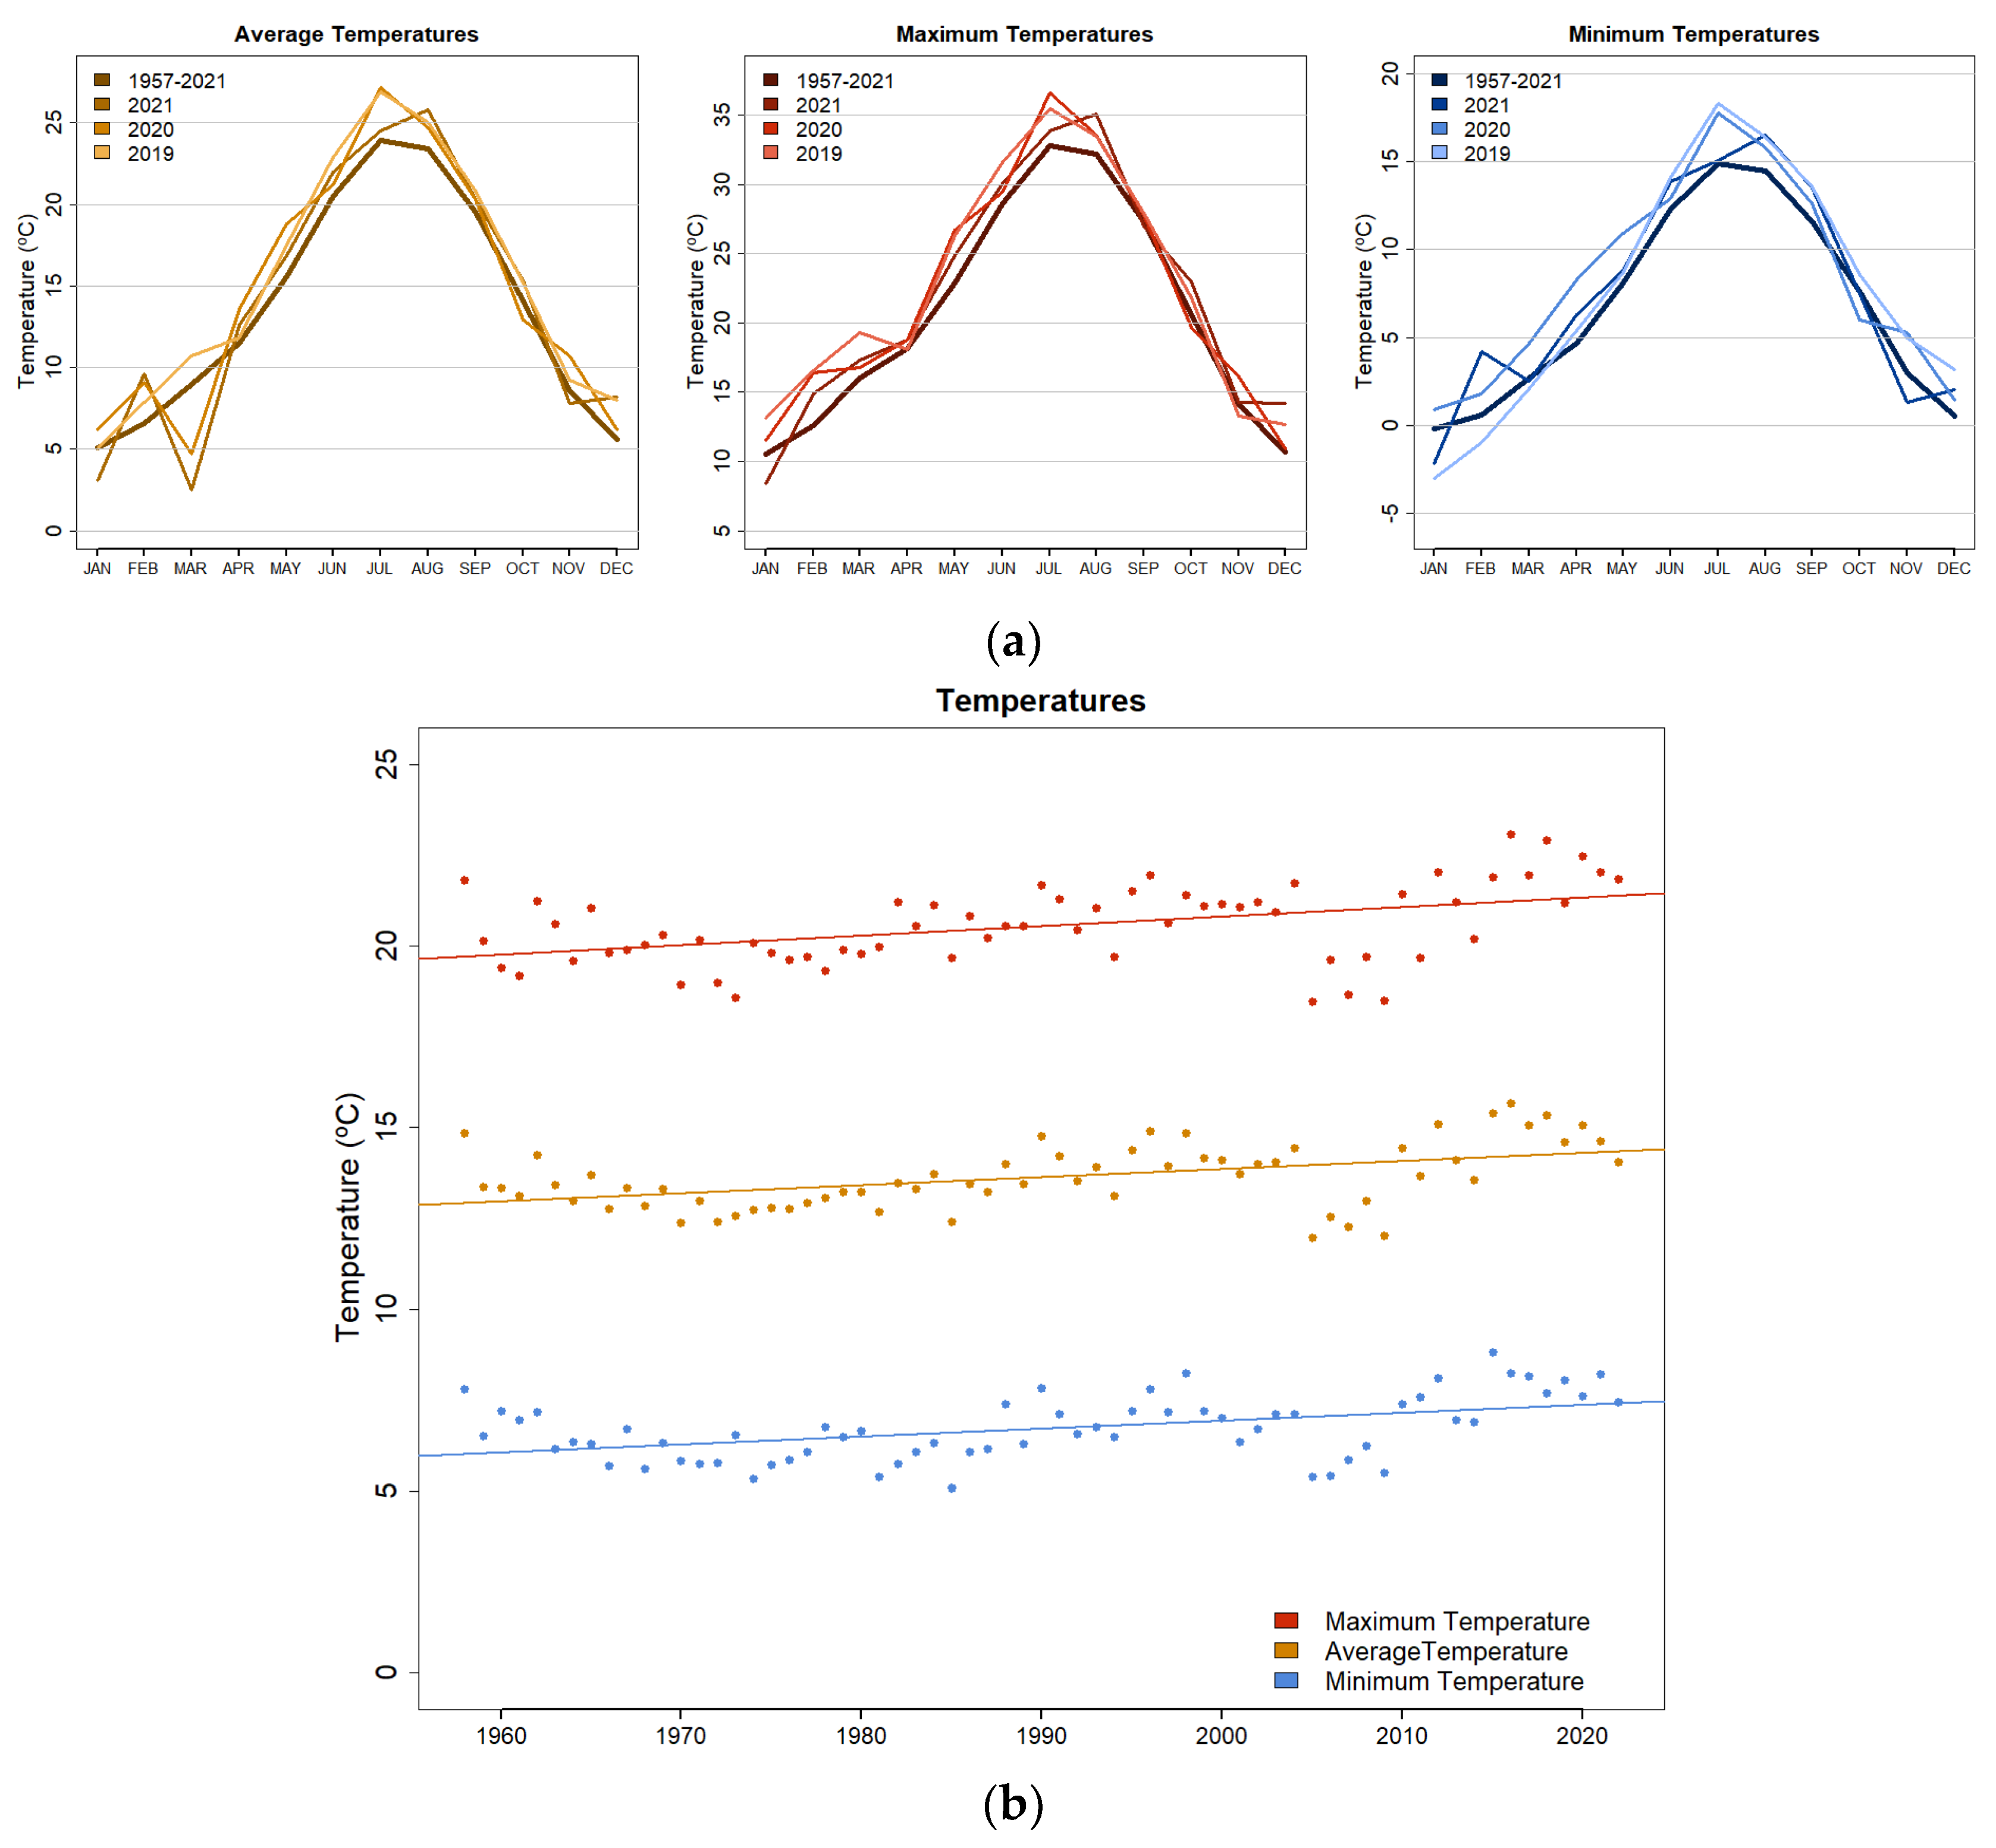
The distribution of the monthly average temperature during each year of study (2019–2021) and the last 60-year average temperature (1957–2021) shows the trend of rising temperatures brought about by climate change conditions (Figure 2a,b). The average temperature during the months of vegetative growth and ripening of grapes was higher during the study years compared to the 60-year historical average. This difference is much greater during the grape ripening period, with differences of 3–4 °C in the months of July (2019 and 2020) and August (2021). Other studies show growing season average temperatures rising by 2.3 °C from 1964 to 2009 in the Veneto region of Italy [22], which is in line with our data.

3.2. Phenology

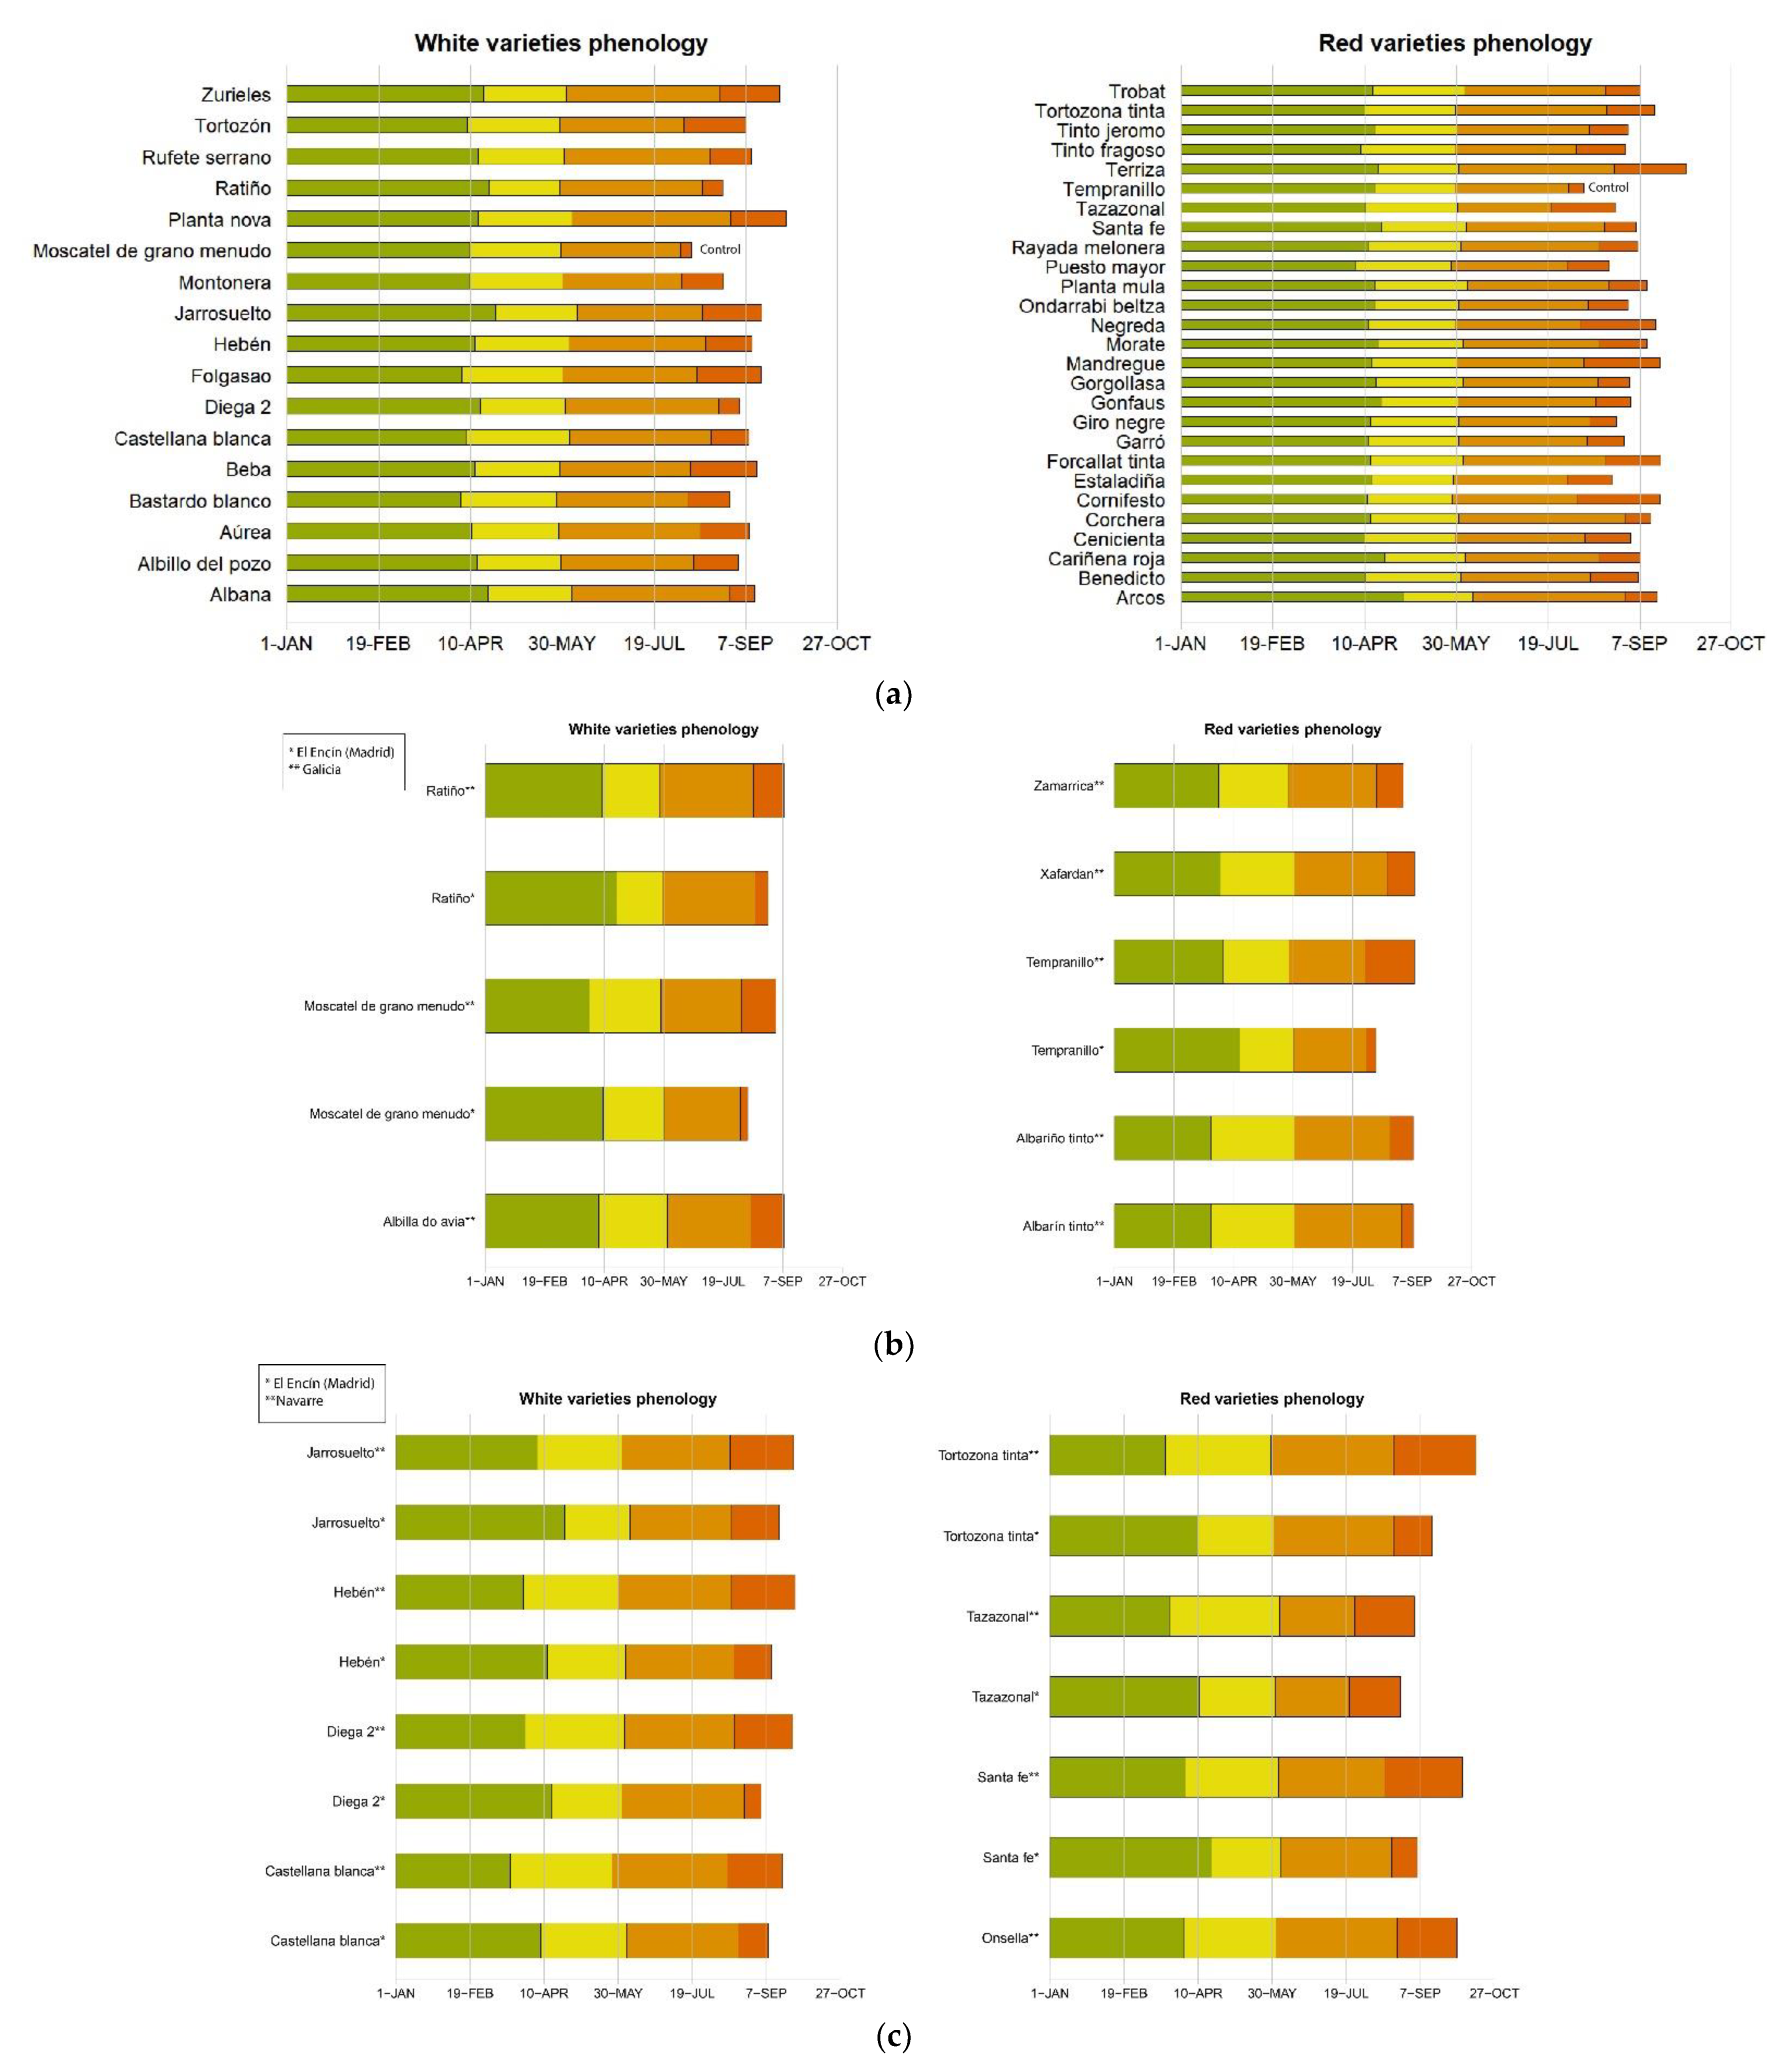
The average time taken by each of the varieties to reach the phenological stages of budbreak, flowering, veraison, and ripeness (Figure 3a) is markedly different when compared to the control varieties. Differences between varieties are more marked at later phenological stages (veraison and ripeness), in both white and red varieties.
On average, the white minority varieties required 250.9 days in 2019, 253.5 days in 2020, and 256.25 days in 2021 to reach the ripeness (stage BBCH 89). Generally, the white varieties always ripened later than the control variety (Moscatel de grano menudo). The differences between the average days required by the white minority varieties and the control variety were statistically significant (95% confidence) in both 2020 and 2021, but they were not in 2019, when the control variety ripened somewhat later than in subsequent years. Additionally, in other recent articles, the indigenous varieties appear to be better adapted to the recent and projected future climate, usually responding less dramatically to warming as compared to the non-indigenous varieties [23].
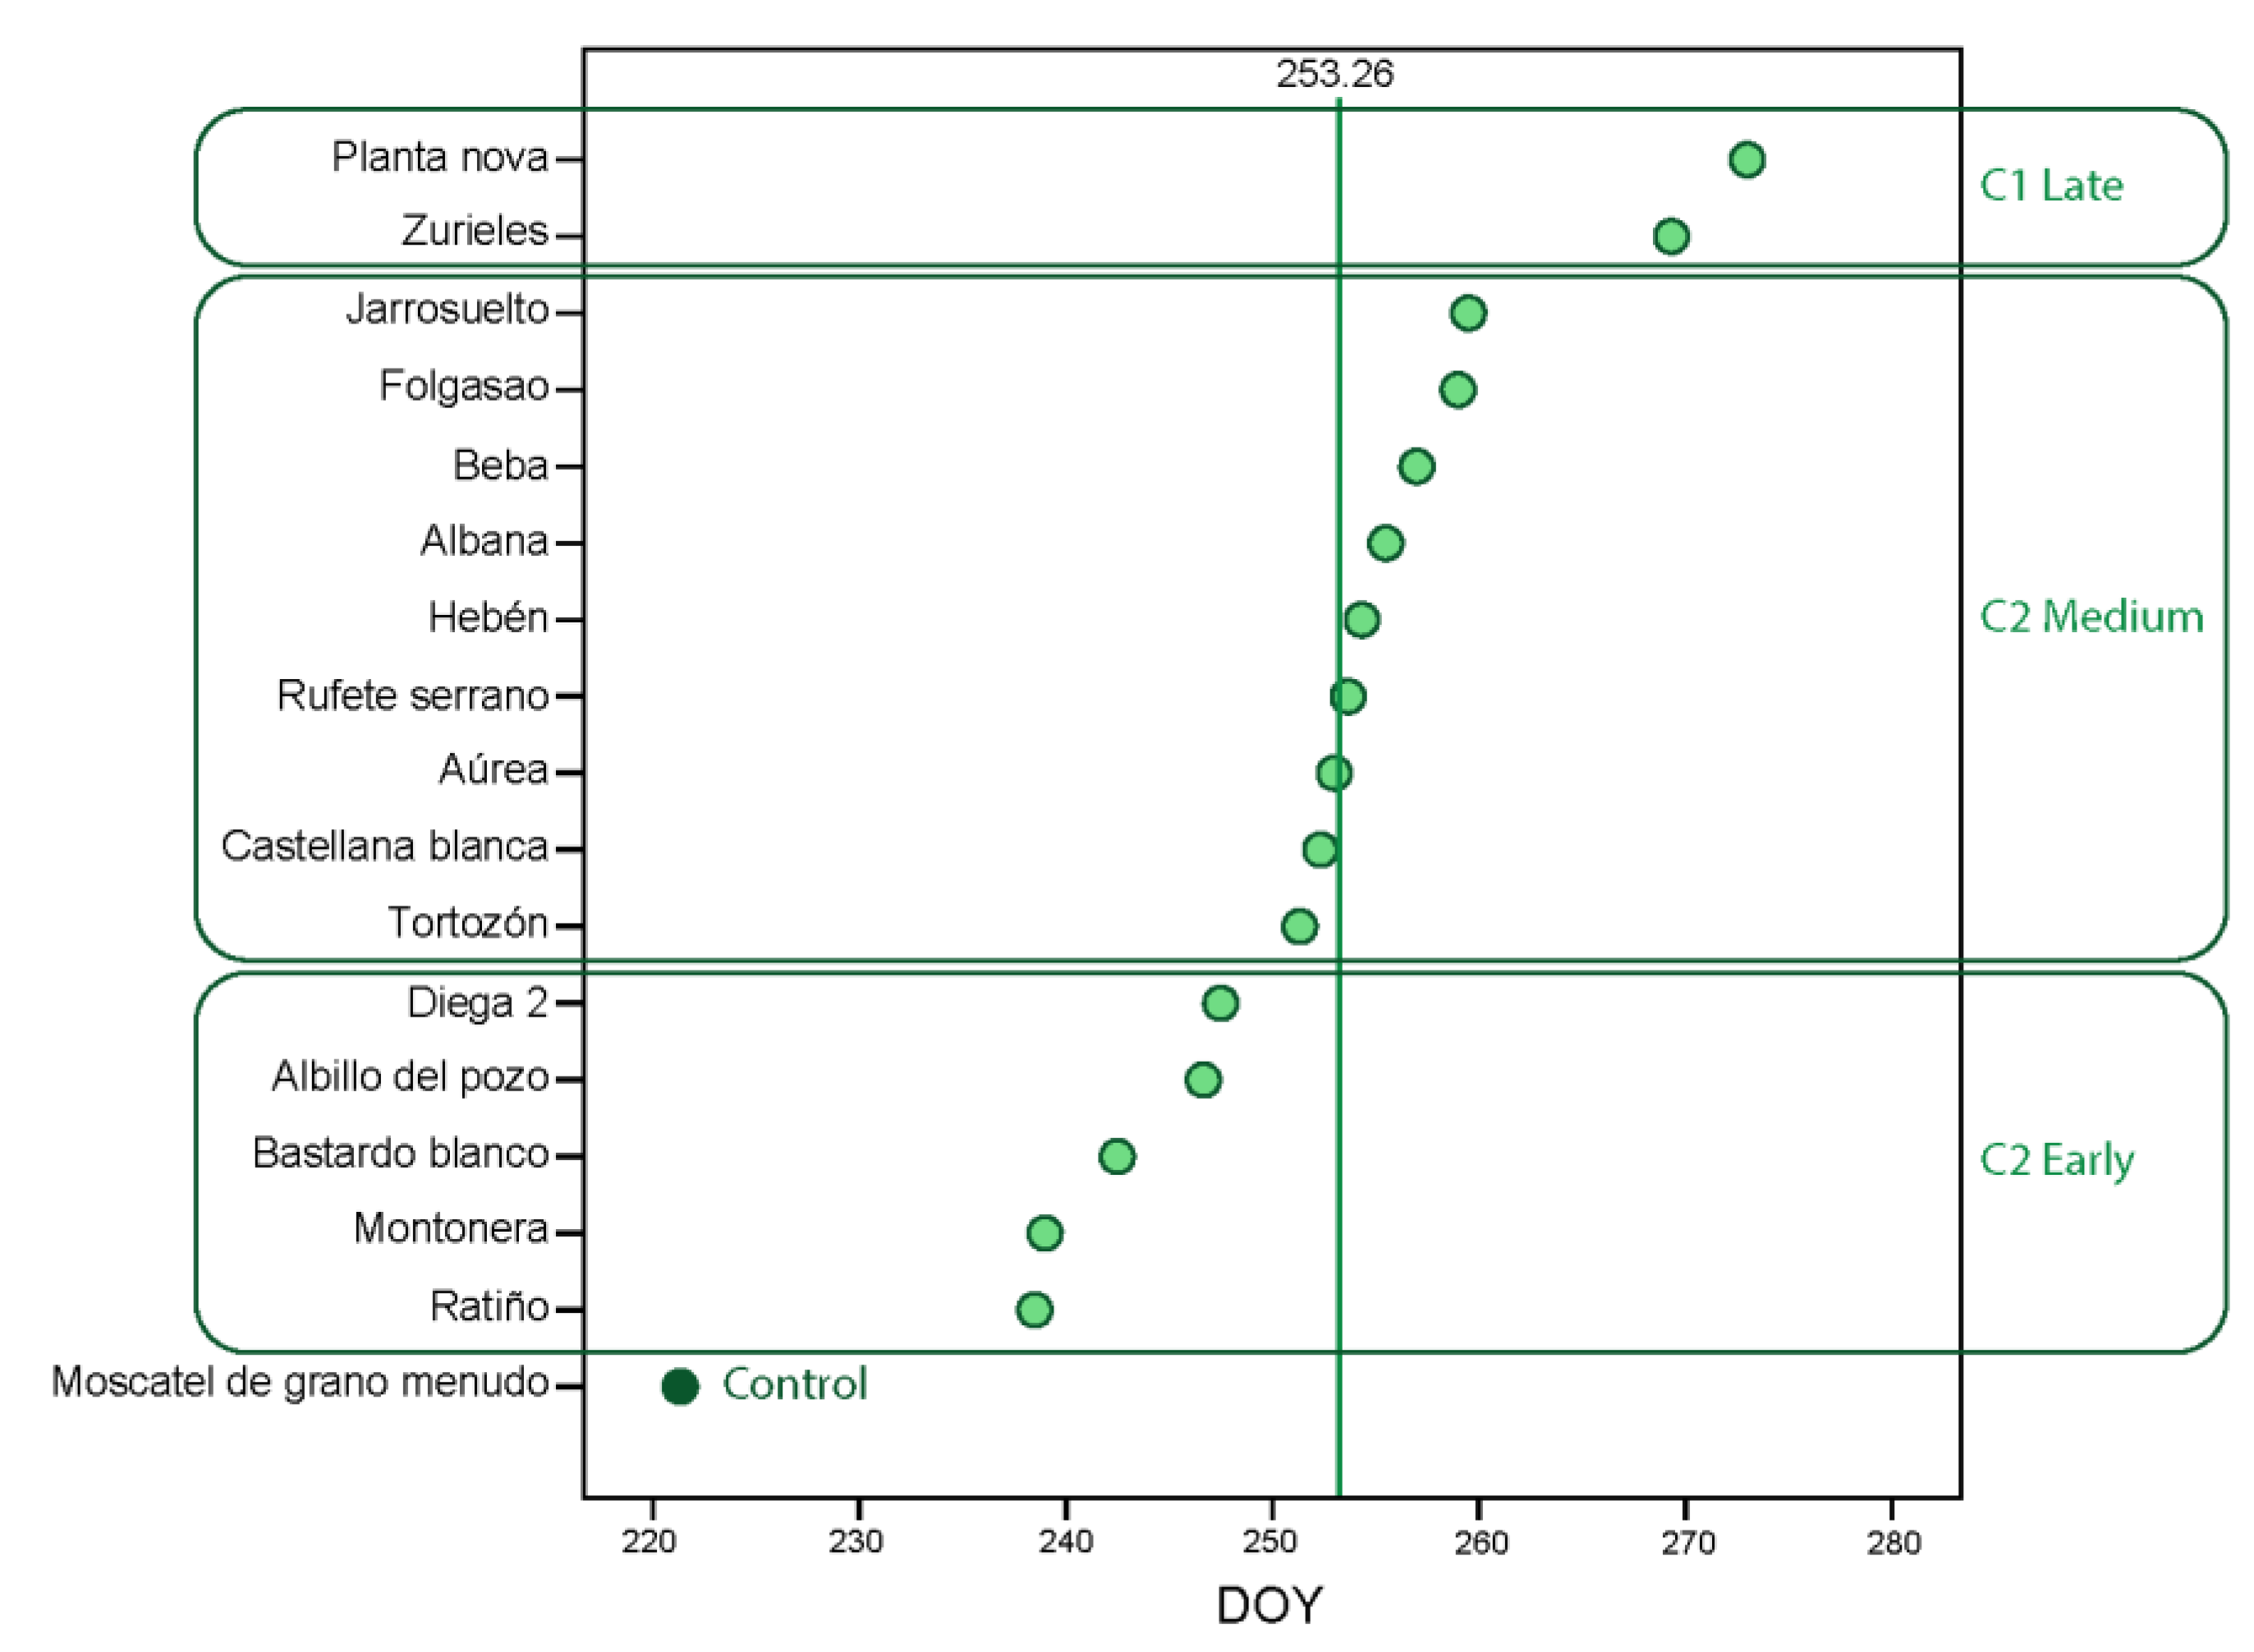
The statistical analysis generated three groups (clusters) according to differences in the time of ripeness (Figure 4). The first group includes the varieties that ripened late, Planta nova and Zurieles, which ripen on average around 28–29 September. Since these varieties require more days to ripen, the effect of higher temperatures on shortening the time of ripening could have less relevant consequences in vitiviniculture practices. The second cluster includes the nine white varieties studied (Tortozón, Castellana blanca, Aúrea, Rufete serrano, Hebén, Albana, Beba, Folgasao, and Jarrosuelto), which still showed a marked difference in the ripeness date compared to the control. This group reached ripeness around 12 September. The third group includes the varieties that ripened earlier, on average around 30–31 August. Therefore, cultivating these varieties (Ratiño, Montonera, Bastardo blanco, Albillo del pozo and Diega 2) would be less useful to counteract the effect of higher temperatures. Nonetheless, they still reached ripeness significantly later than the control group (Moscatel de grano menudo).
The red minority varieties required an average of 247 days in 2019, 250.04 days in 2020, and 252.68 days in 2021 to reach ripeness (stage BBCH 89); generally, they ripened later than the control variety (Tempranillo). The differences between the average days required by the red minority varieties and the control variety were statistically significant (95% confidence) in both 2020 and 2021; but this was not the case in 2019, when the control variety ripened somewhat later than in subsequent years.
The statistical analysis generated four clusters of red varieties according to the time of ripeness (Figure 5). The first cluster includes seven late ripening varieties that ripened on 17–18 September: Corchera, Tortozona tinta, Negreda, Arcos, Cornifesto, Mandregue, and Forcallat tinta. Since these varieties require more days to ripen, the effect of higher temperatures on shortening the time to ripeness would have less relevant consequences in winegrowing practices. The variety Terriza is a different case, as it is separated from all the other varieties, achieving full ripeness in October (Figure 3). The second cluster includes the other seven red varieties, Santa fe, Rayada melonera, Benedicto, Cariñena roja, Trobat, Morate, and Planta mula, reaching full ripeness at an intermediate time period and with a marked difference in the ripening date compared to the control. This group reached maturity around 12 September. The third cluster includes varieties that ripened early, on average around 1–2 September. Therefore, cultivating these varieties (Garró, Tinto fragoso, Ondarrabi beltza, Tinto jeromo, Gorgollasa, Cenicienta, and Gonfaus) would be less useful to counteract the effect of higher temperatures. Nonetheless, they still ripened significantly later than the control (Tempranillo). The cluster of varieties that ripened very early includes Puesto mayor, Estaladiña, Tazazonal, Giro negre, and Sanguina, reaching ripeness around 25 August, which is the closest to control, and therefore, may be considered as less suitable for cultivation in the coming years, if temperatures continue to rise.

3.3. Phenology in Other Spanish Regions

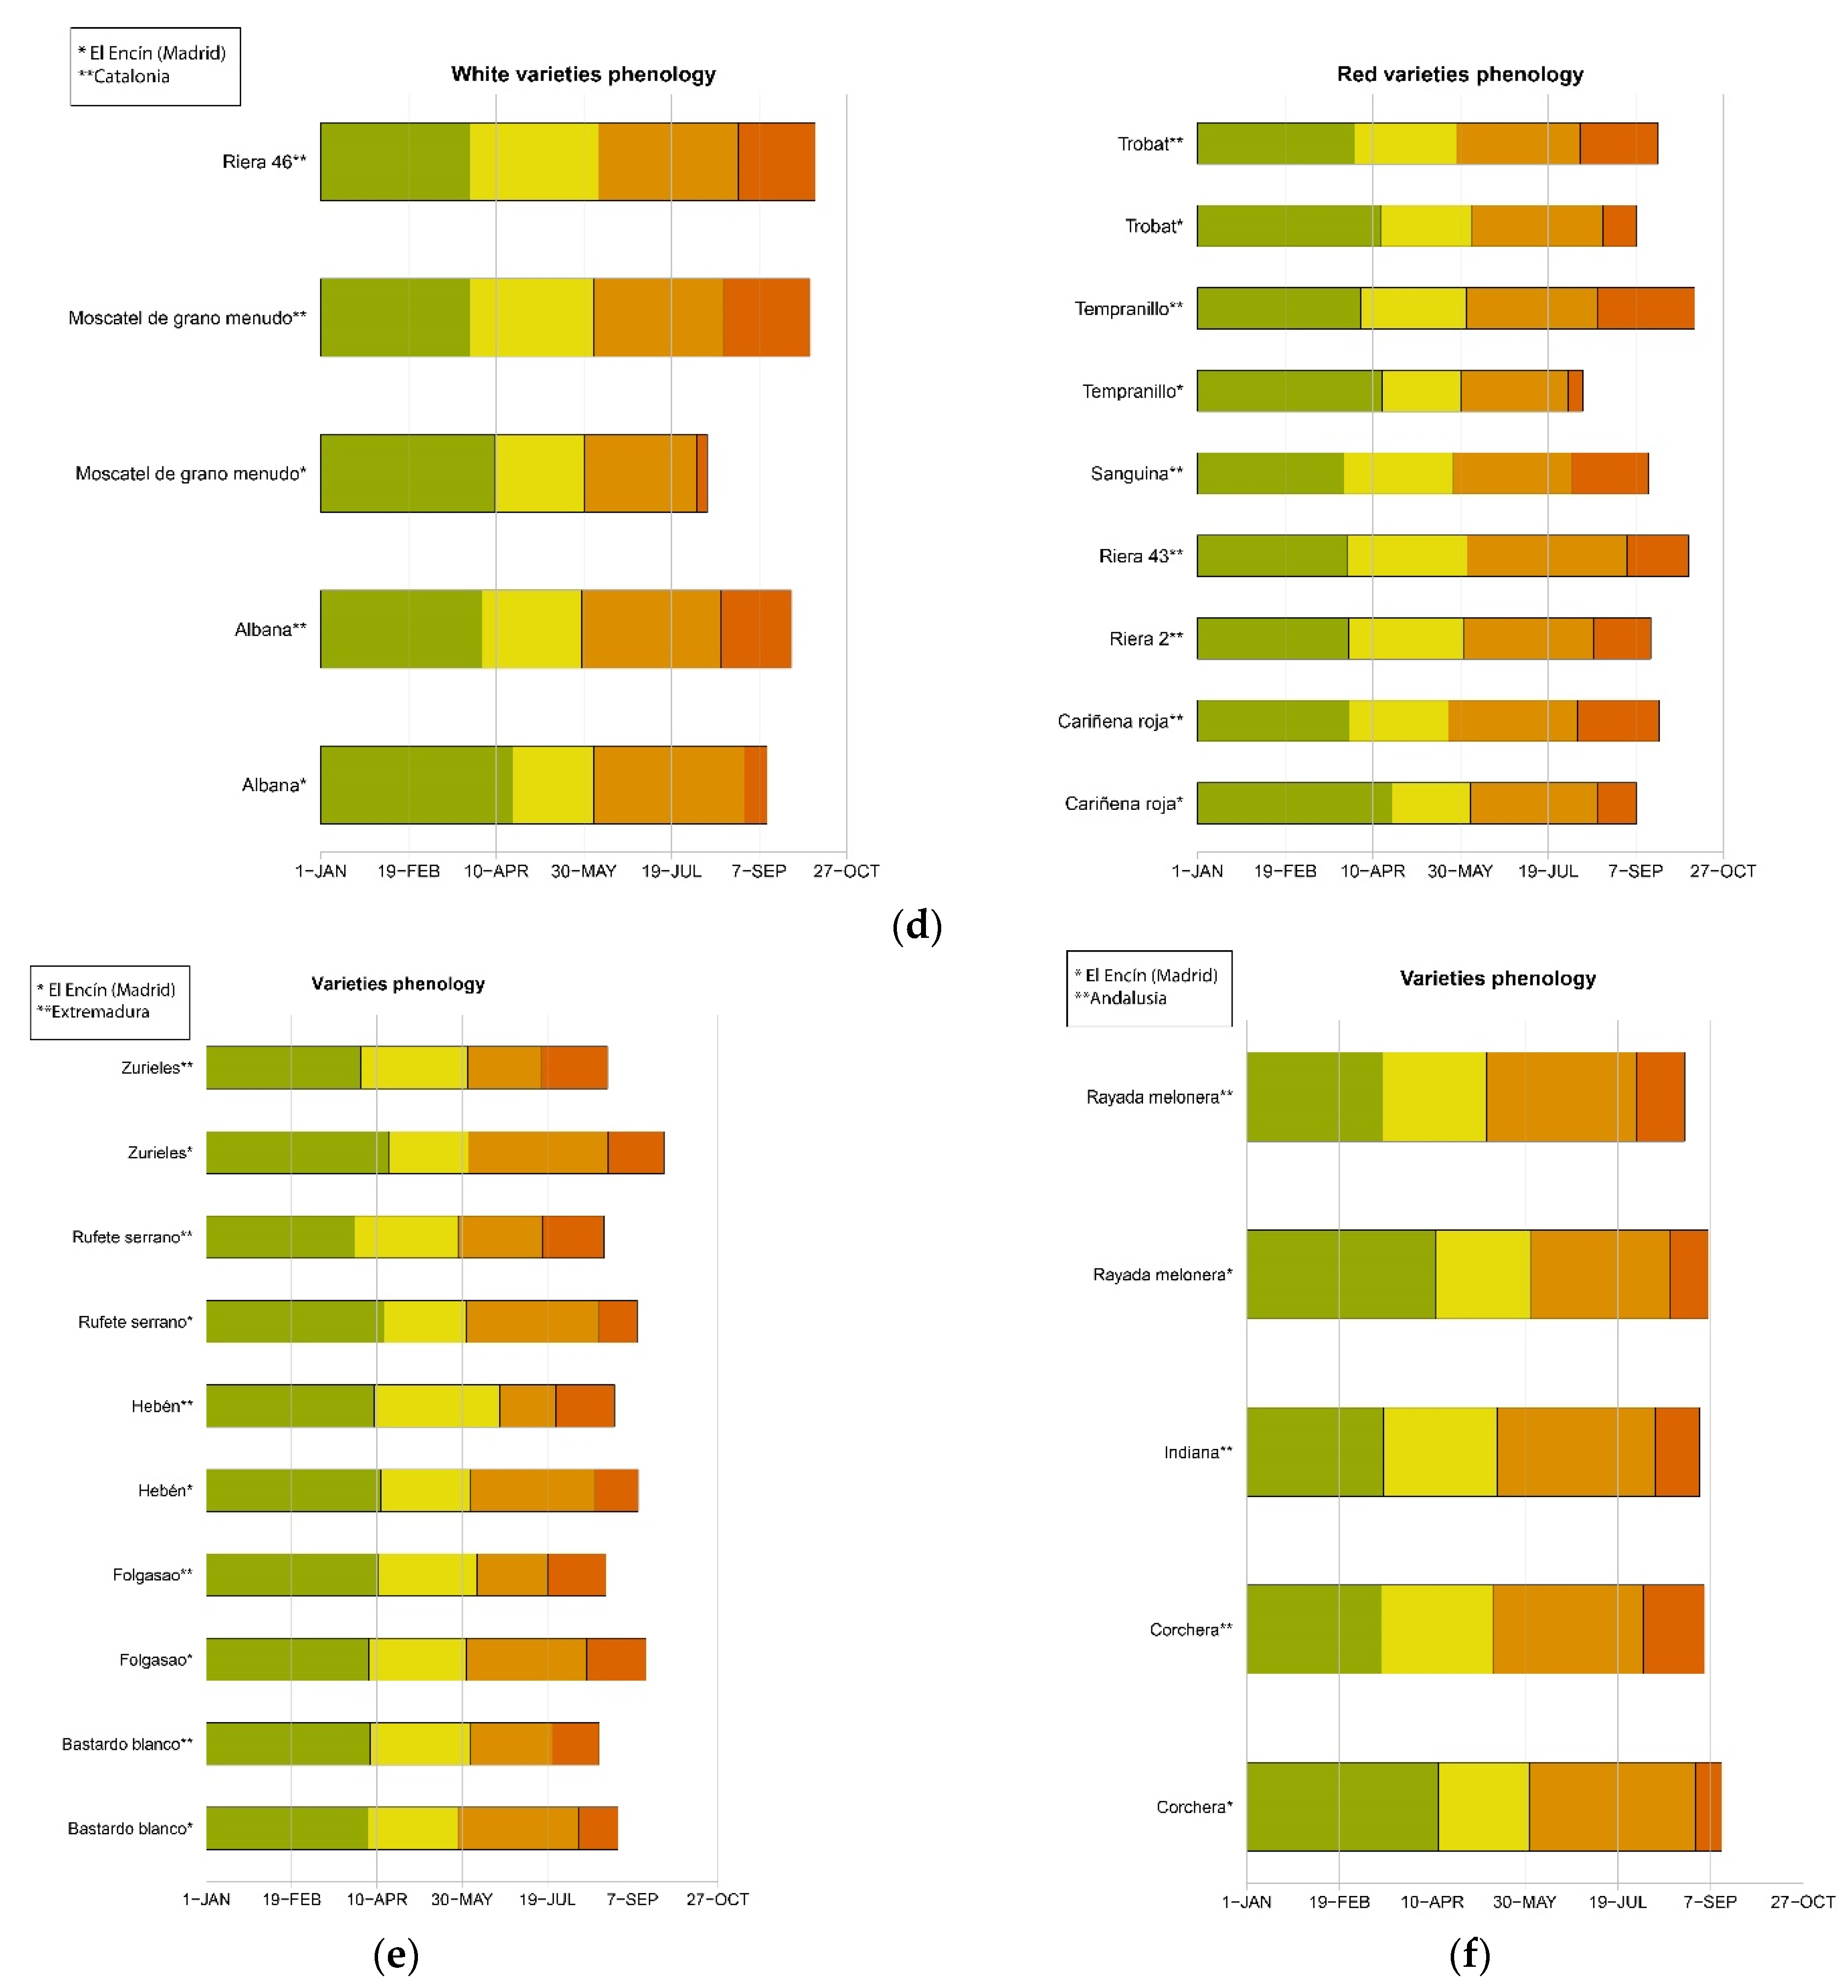
The phenological monitoring of a total of 10 varieties grown in other regions, Galicia (Figure 3b), Navarre (Figure 3c), Catalonia (Figure 3d), Extremadura (Figure 3e) and Andalusia (Figure 3f), was carried out. To allow for better comparisons, at least one of the varieties studied in one location was also present and evaluated in the El Encín collection (Madrid).
All the varieties studied in both Galicia and Madrid (controls and Ratiño) reached full ripeness later than in Madrid, but taking into account the control varieties (Moscatel de grano menudo and Tempranillo), we can conclude that Ratiño and Albilla do Avia (white) and Albarín tinto, Albariño tinto, Xafardán, and Zamarrica (red) can also be considered early ripening varieties in Galicia.
The time to ripeness of the varieties in Navarre was also later than in Madrid. Besides the control, the common varieties were Jarrosuelto, Hebén, Diega 2, and Castellana Blanca (white) and Tortozona tinta, Tazazonal, and Santa fe (red). The only minority variety not studied in Madrid was Onsella (rose), and its time to ripeness was very close to that of Santa fe, so it can be included in the cluster of varieties with an intermediate ripening time.
Ripeness dates for the same varieties were also later in Catalonia than in Madrid. Taking into account the two control varieties and the three common varieties in both locations (Albana, Trobat, and Cariñena roja), we can classify Riera 46 in the group of the white varieties with an early date of ripeness, and Riera 2, Riera 43, and Sanguina in the group of the red varieties with a very early date of ripeness.
In contrast to the observations in the other regions, which are located in northern Madrid and generally have a cooler climate, ripeness occurred earlier in Extremadura and Andalusia than in Madrid, for the same varieties. These regions are located in southern Madrid and generally have a warmer climate. In Extremadura, only white varieties were evaluated, and all of them are common to both locations, and were thus classified in the same ripening clusters. However, Zurieles, included in the late date of ripeness cluster in Madrid, seemed to be closer to the intermediate ripening date cluster when studied in Extremadura and compared to the other 5 varieties in that location, probably due to higher temperatures during the previous period.
The Indiana variety, which was studied only in Andalusia, ripened at an intermediate time between that of the Rayada melonera and Corchera varieties, and can, therefore, be considered to exhibit either an intermediate or late ripening time point.

3.4. Correlation GDDs and Phenology

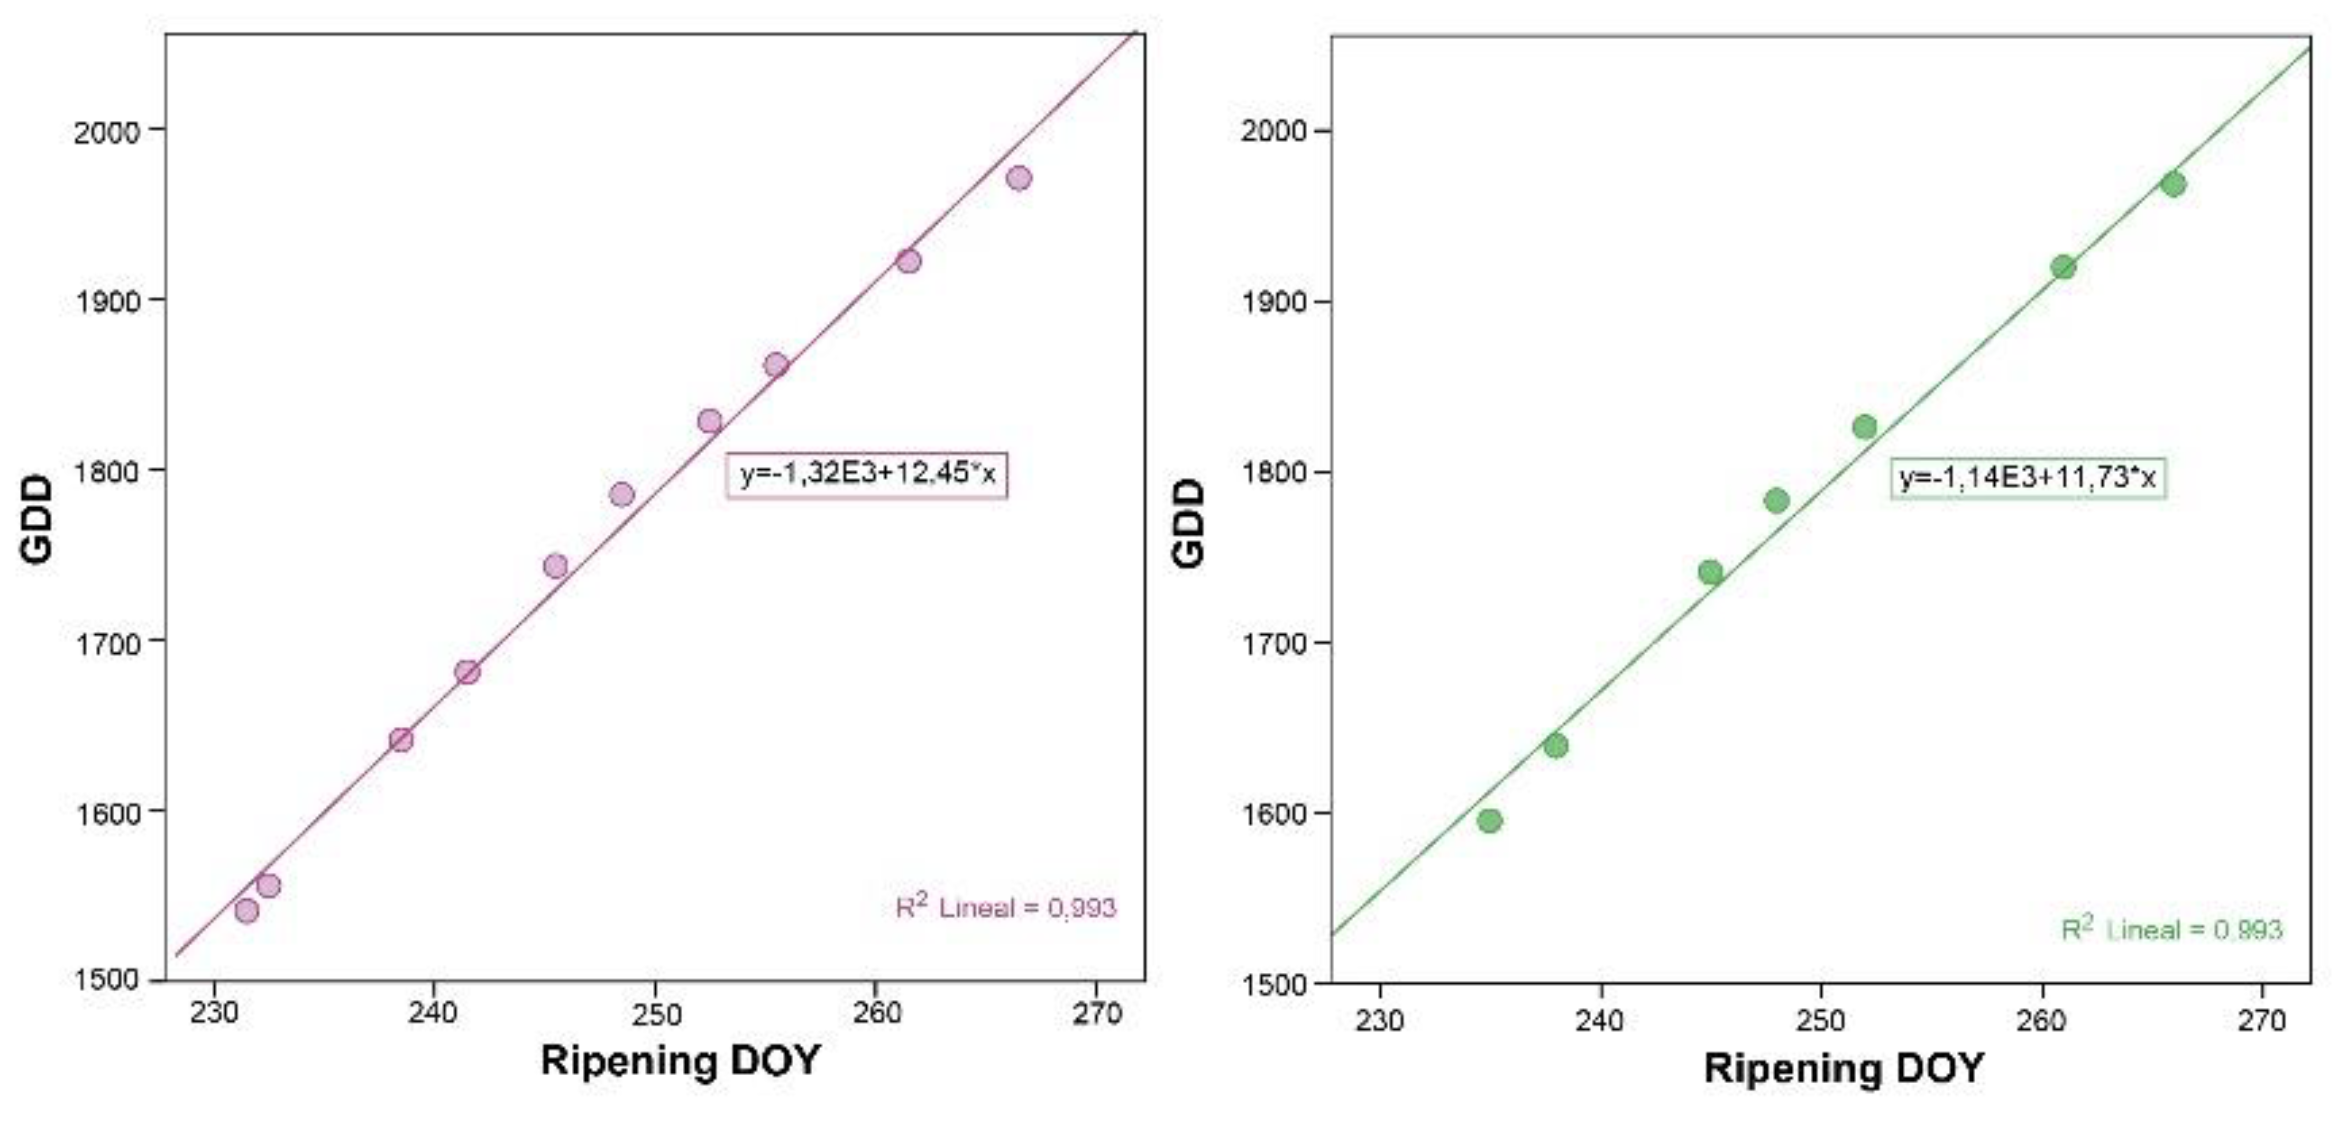
The climate and phenology of wine grapes have been shown to be strongly related [24], and our results also revealed significant relationships between these two factors. The Pearson correlation between growing degree days (GDDs) in the four main phenological stages (budburst, flowering, veraison, and ripeness) and the time to ripeness (BBCH 89) of the white minority (Table 2) and red minority varieties (Table 3) was more significant in the later phenological stages, especially regarding ripeness. The strength of the association is great, with the time to ripeness at a significance level of 0.01 in two of the years (2020 and 2021) and at a significance level of 0.05 in one year (2019) for both the red and white varieties. The strength of the association with veraison was also great in two out of the three years of study. The correlation was also good with regards to the flowering stage in the white varieties at a significance level of 0.05 during the two years, but there was no such significant correlation for the red varieties.
These results confirm the conclusions found by other authors [8] regarding the higher influence of temperature in the later phenological stages than in the earlier phases. Figure 6 shows examples of correlations found in 2019. Temporal correlations between the phenology averaged over several cultivars showed that budbreak timing is not significantly correlated with the later growth stages [22]. Furthermore, the timing of veraison and ripeness dates were found to be highly correlated (r = 0.79; p ≤ 0.001) in this study, indicating that budbreak and bloom timing are largely independent phenological events, possibly due to the more variable weather early in the season.

3.5. Yield

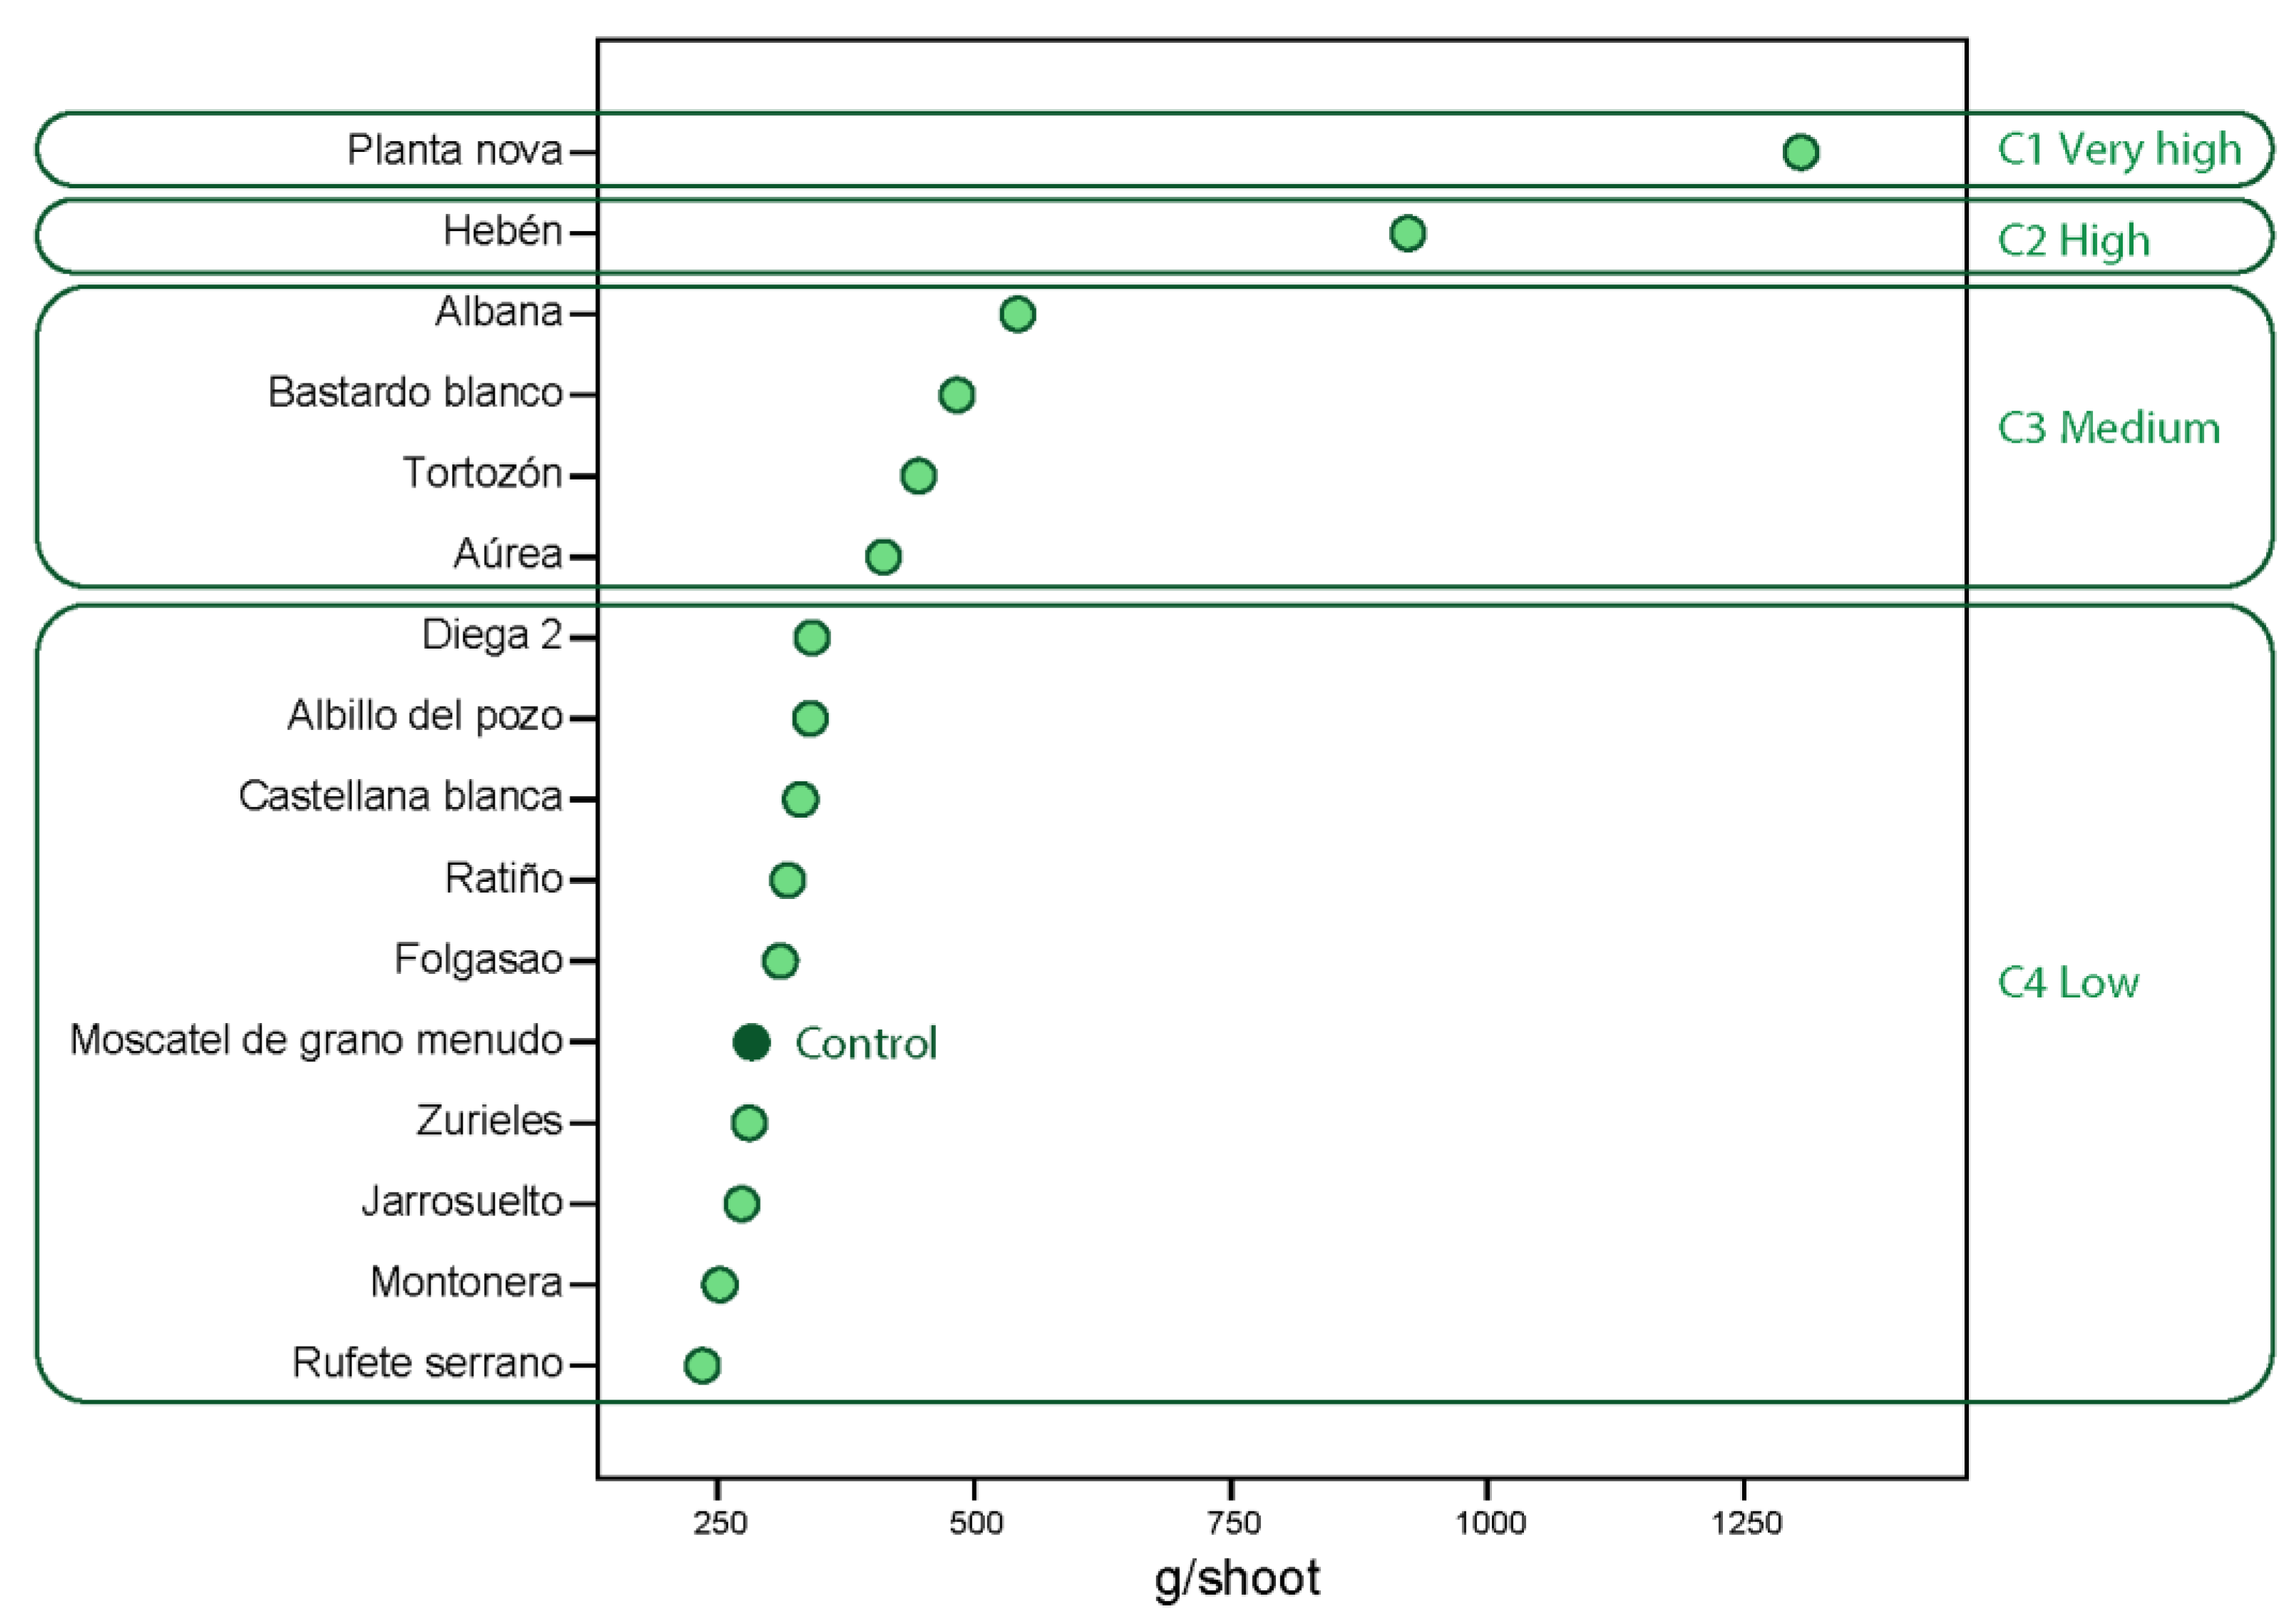
Differences in yield were also found between the varieties. Yield is a factor of great genetic influence, but it is also strongly influenced by environmental conditions. The effect of climate change on yields will affect the economic viability of vineyards [25], and consequently, the decision of winegrowers to choose a variety. In this study, since the environmental conditions were the same for all plants, we can draw clear conclusions about the differences between varieties in terms of yield. Statistical analysis grouped the white varieties into four clusters according to yield (Figure 7). Hebén and Planta nova stand out, showing high and very high yields, respectively (1.000 and 1.200 g per shoot). The four other white varieties, Albana, Bastardo blanco, Tortozón, and Aúrea, also maintained adequate yields of approximately 500 g/shoot. The largest group, including the control, was found to have lower yields, between 250 and 300 g/shoot.
Regarding the red varieties, they were grouped into five clusters by yield (Figure 8). Terriza, Forcallat tinta, and Morate were included in the cluster with higher yields, with almost 1 kg per shoot. Rayada melonera and Santa fe were included in the second group, with an even higher yield than the control. The control (Tempranillo) and six other varieties (Cornifesto, Negreda, Benedicto, Garró, Giró negre, and Ondarrabi beltza) were in found to be in the group of medium yield (500–600 g/shoot). The largest group, with 11 varieties, was found to have low yields. Additionally, a fifth cluster, made up of Gonfaus, Tinto jeromo, Tinto fragoso, Tazazonal, and Corchera, had the lowest yields.
Winegrowers will preferably choose the most productive varieties in order to improve economic yields. However, this will always be a less important decision factor than the time of ripening of the variety.

3.6. Titratable Acidity

Titratable acidity is other important trait affecting the quality of the juice, and is influenced by the variety, the environmental conditions, and the stage of ripening [26]. Acid levels have been found to show large positive correlations with bloom, veraison, and harvest dates [24]. In this study, all the grapes were harvested at the same stage of ripening (20–21 °Brix and 21–22 °Brix for white and red varieties, respectively) and under the same environmental conditions. Figure 9 shows the results of titratable acidity in the different varieties. The white control Moscatel de grano menudo is considered as a variety with high acidity in its berries, and the red control Tempranillo is considered as a variety with generally low acidity. Among the white varieties, Ratiño stands out, exhibiting a similar acidity to the control. Montonera, Rufete serrano, Castellana blanca, and Bastardo blanco also show very good acidity levels for making white wines. Regarding red varieties, 16 out of the 25 red minority varieties analyzed have higher average acidity levels than the control. Corchera stands out, exhibiting very high levels of acidity. Other varieties showing very good acidity are Tortozona tinta, Garró, Puesto mayor, Giró negre, Gonfaus, Cornifesto, and Ondarrabi beltza. A considerable temperature effect is noted regarding total acidity [27]. While the main grape acid, tartaric acid, is relatively stable with regard to temperature effects, malic acid levels are highly dependent on maturity and temperature, decreasing with higher temperatures [28]. It is to be expected that varieties with a higher total acidity will maintain an adequate acidity level at harvest, despite higher temperatures leading to reduced acidity.

3.7. General Overview

Collectively taking into account phenological, agronomical (yield), and enological (acidity) traits, we can determine that a group of minority varieties in Spain exhibit a better chance of success under more extreme climatic conditions. Planta nova stands out among the white varieties as a late-ripening variety with a high yield and a good level of acidity in its juice. Other white late-ripening varieties with a lower yield and low acidity, such as Zurieles, can be considered as an alternative choice, correcting for acidity and assessing it with other quality aspects, such as aroma compounds, which are not included in this study. The white varieties with an intermediate date of ripeness, a good yield, and medium acidity, such as Albana, Hebén, Tortozón, and Aúrea, would be of great interest for cultivation. Other white varieties, such as Folgasao, Rufete serrano, and Castellana blanca, with a high level of acidity and reaching ripeness in the intermediate period, would be a good alternative when focusing only on quality, rather than yield.
Similar considerations could be made for the red varieties. One-half of the varieties studied have a late or intermediate ripeness date. Furthermore, some of these varieties have high-medium yields (Forcallat tinta, Negreda, Benedicto, Rayada melonera, and Santa fe), high acidity (Corchera and Tortozona tinta), or both (Cornifesto and Morate).
The diagram explaining the process that allows for the identification suitable varieties is shown in Figure 10.
Although this study of adaptation to climate change is quite conclusive, before growing some of these varieties, it is advisable to carry out complementary evaluations of agronomic aspects, such as disease and drought resistance, as well as oenological aspects, such as the aromatic and phenolic composition of their berries or the sensory evaluation of their wines.

4. Conclusions

Countries with an important varietal heritage—such as Spain—can employ some of this diversity in their viticulture as a measure to mitigate climate change effects. The use of minority varieties, which were grown in the past and which, for different reasons, are no longer cultivated at a commercial scale, also allows for an increase in the diversity of wines on the market, without losing tradition and indigenous materials. There are varieties showing late ripeness dates (aim a), preserved in public collections, with good yields (aim b) and beneficial oenological characteristics (aim c), that can be used to replace some of the varieties currently cultivated without the need to create new ones. This is not the first time that genetic diversity has been used in viticulture to solve major problems; for example, the use of Vitis species have been used in the fight against phylloxera, as well as against critical diseases, such as downy mildew and powdery mildew.

Author Contributions

Conceptualization, G.M.-O. and F.C.; formal analysis, E.R. and M.F.-P.; investigation, M.F.-P., A.P.-P., M.C.M., M.E.V., F.E.E., B.P. and J.F.C.; resources, A.P.-P., C.D., E.D.-L., J.L.S., B.P., M.E.V., J.F.C. and G.M.-O.; data curation, M.A.U., A.P.-P., C.D., E.D.-L., J.L.S., M.C.M., B.P., M.E.V., J.F.C., F.E.E., M.F.-P., D.M., M.L. and G.M.-O.; writing—original draft preparation, G.M.-O.; writing—review and editing, J.P.Z.; visualization, M.F.-P., E.D.-L., M.C.M., B.P., J.P.Z., A.P.-P. and M.E.V.; project administration, G.M.-O., M.C.M. and A.P.-P.; funding acquisition, G.M.-O., M.C.M., A.P.-P. and J.P.Z. All authors have read and agreed to the published version of the manuscript.

Funding

Project RTI2018-101085-R-C31, “Valorization of Minority Grapevine Varieties for their Potential for Wine Diversification and Resilience to Climate Change (MINORVIN),” funded by MCIN/AEI/10.13039/501100011033, and by the ERDF, A Way to Make Europe.

Institutional Review Board Statement

Not applicable.

Informed Consent Statement

Not applicable.

Data Availability Statement

The data presented in this study are available on request from the corresponding author.

Acknowledgments

The authors thank Bodegas Torres, Bodegas Martín Codax, and Bodega Encina Blanca de Alburquerque for their collaboration with plant materials and field support.

Conflicts of Interest

The authors declare no conflict of interest.

References

  1. De Orduña, R.M. Climate change associated effects on grape and wine quality and production. Food Res. Int. 2010, 43, 1844–1855. [Google Scholar] [CrossRef]
  2. Van Leeuwen, C.; Destrac-Irvine, A.; Dubernet, M.; Duchêne, E.; Gowdy, M.; Marguerit, E.; Pieri, P.; Parker, A.; de Rességuier, L.; Ollat, N. An update on the impact of climate change in viticulture and potential adaptations. Agronomy 2019, 9, 514. [Google Scholar] [CrossRef] [Green Version]
  3. Bock, A.; Sparks, T.; Estrella, N.; Menzel, A. Changes in the phenology and composition of wine from Franconia, Germany. Clim. Res. 2011, 50, 69–81. [Google Scholar] [CrossRef] [Green Version]
  4. Droulia, F.; Charalampopoulos, I. Future climate change impacts on European Viticulture: A review on recent scientific advances. Atmosphere 2021, 12, 495. [Google Scholar] [CrossRef]
  5. Webb, L.B.; Whetton, P.H.; Barlow, E.W.R. Modelled impact of future climate change on the phenology of winegrapes in Australia. Aust. J. Grape Wine Res. 2007, 13, 165–175. [Google Scholar] [CrossRef]
  6. Greer, D.H.; Weedon, M.M. The impact of high temperatures on Vitis vinifera cv. Semillon grapevine performance and berry ripening. Front. Plant Sci. 2013, 4, 491. [Google Scholar] [CrossRef] [Green Version]
  7. Sadras, V.O.; Petrie, P.R.; Moran, M.A. Effects of elevated temperature in grapevine. II juice pH, titratable acidity and wine sensory attributes. Aust. J. Grape Wine Res. 2013, 19, 107–115. [Google Scholar] [CrossRef]
  8. Ramos, M.C.; de Toda, F.M. Variability in the potential effects of climate change on phenology and on grape composition of Tempranillo in three zones of the Rioja DOCa (Spain). Eur. J. Agron. 2020, 115, 126014. [Google Scholar] [CrossRef]
  9. Wolkovich, E.M.; Burge, D.O.; Walker, M.A.; Nicholas, K.A. Phenological diversity provides opportunities for climate change adaptation in winegrapes. J. Ecol. 2017, 105, 905–912. [Google Scholar] [CrossRef] [Green Version]
  10. Parker, A.; García de Cortázar-Atauri, I.; Trought, M.C.; Destrac, A.; Agnew, R.; Sturman, A.; Van Leeuwen, C. Adaptation to climate change by determining grapevine cultivar differences using temperature-based phenology models. Oeno One 2020, 4, 955–974. [Google Scholar] [CrossRef]
  11. Morales-Castilla, I.; García de Cortázar-Atauri, I.; Cook, B.I.; Lacombe, T.; Parker, A.; Van Leeuwen, C.; Nicholas, K.A.; Wolkovich, E.M. Diversity buffers winegrowing regions from climate change losses. Proc. Natl. Acad. Sci. USA 2020, 117, 2864–2869. [Google Scholar] [CrossRef] [PubMed]
  12. Fraga, H.; García de Cortázar Atauri, I.; Malheiro, A.C.; Santos, J.A. Modelling climate change impacts on viticultural yield, phenology and stress conditions in Europe. Glob. Chang. Biol. 2016, 22, 3774–3788. [Google Scholar] [CrossRef]
  13. Neethling, E.; Petitjean, T.; Quénol, H.; Barbeau, G. Assessing local climate vulnerability and winegrowers’ adaptive processes in the context of climate change. Mitig. Adapt. Strateg. Glob. Chang. 2017, 22, 777–803. [Google Scholar] [CrossRef]
  14. Wolkovich, E.M.; García de Cortázar-Atauri, I.; Morales-Castilla, I.; Nicholas, K.A.; Lacombe, T. From Pinot to Xinomavro in the world’s future wine-growing regions. Nat. Clim. Chang. 2018, 8, 29–37. [Google Scholar] [CrossRef]
  15. Novikova, L.Y.; Naumova, L.G. Structuring ampelographic collections by phenotypic characteristics and comparing the reaction of grape varieties to climate change. Vavilovskii Zhurnal Genetiki i Selektsii= Vavilov. J. Genet. Breed. 2019, 23, 772–779. [Google Scholar]
  16. Ortiz, J.M.; Pedro Martín, J.; Borrego, J.; Chávez, J.; Rodríguez, I.; Muñoz, G.; Cabello, F. Molecular and morphological characterization of a Vitis gene bank for the establishment of a base collection. Genet. Resour. Crop Evol. 2004, 51, 403–409. [Google Scholar] [CrossRef]
  17. Lorenz, D.H.; Eichhorn, K.W.; Bleiholder, H.; Klose, R.; Meier, U.; Weber, E. Growth Stages of the Grapevine: Phenological growth stages of the grapevine (Vitis vinifera L. ssp. vinifera)—Codes and descriptions according to the extended BBCH scale. Aust. J. Grape Wine Res. 1995, 1, 100–103. [Google Scholar] [CrossRef]
  18. Duchêne, E.; Huard, F.; Dumas, V.; Schneider, C.; Merdinoglu, D. The challenge of adapting grapevine varieties to climate change. Clim. Res. 2010, 41, 193–204. [Google Scholar] [CrossRef] [Green Version]
  19. OIV. OIV Descriptor List for Grape Varieties and Vitis Species, 2nd ed.; Organisation International Vigne Vine: Paris, France, 2009. [Google Scholar]
  20. Iland, P.; Ewart, A.; Sitters, J. Techniques for Chemical Analysis and Stability Tests of Grape Juice and Wine; Patrick Iland Wine Promotions: Athelstone, Australia, 1993. [Google Scholar]
  21. Santoso, S. Panduan Lengkap SPSS Versi 23; Elex Media Komputindo: Jakarta, Indonesia, 2016. [Google Scholar]
  22. Tomasi, D.; Jones, G.V.; Giust, M.; Lovat, L.; Gaiotti, F. Grapevine phenology and climate change: Relationships and trends in the Veneto region of Italy for 1964–2009. Am. J. Enol. Vitic. 2011, 62, 329–339. [Google Scholar] [CrossRef]
  23. Koufos, G.C.; Mavromatis, T.; Koundouras, S.; Jones, G.V. Adaptive capacity of winegrape varieties cultivated in Greece to climate change: Current trends and future projections. Oeno One 2020, 54, 1201–1219. [Google Scholar]
  24. Jones, G.V.; Davis, R.E. Climate influences on grapevine phenology, grape composition, and wine production and quality for Bordeaux, France. Am. J. Enol. Vitic. 2000, 51, 249–261. [Google Scholar]
  25. Schultz, H.R. Global climate change, sustainability, and some challenges for grape and wine production. J. Wine Econ. 2016, 11, 181–200. [Google Scholar] [CrossRef]
  26. Vršič, S.; Vodovnik, T. Reactions of grape varieties to climate changes in North East Slovenia. Plant Soil Environ. 2012, 58, 34–41. [Google Scholar] [CrossRef]
  27. Tarara, J.M.; Lee, J.; Spayd, S.E.; Scagel, C.F. Berry temperature and solar radiation alter acylation, proportion, and concentration of anthocyanin in Merlot grapes. Am. J. Enol. Vitic. 2008, 59, 235–247. [Google Scholar]
  28. Huglin, P.; Schneider, C. Biologie et Ecologie de la Vigne; TecDoc.: Paris, France, 1998; p. 370. [Google Scholar]
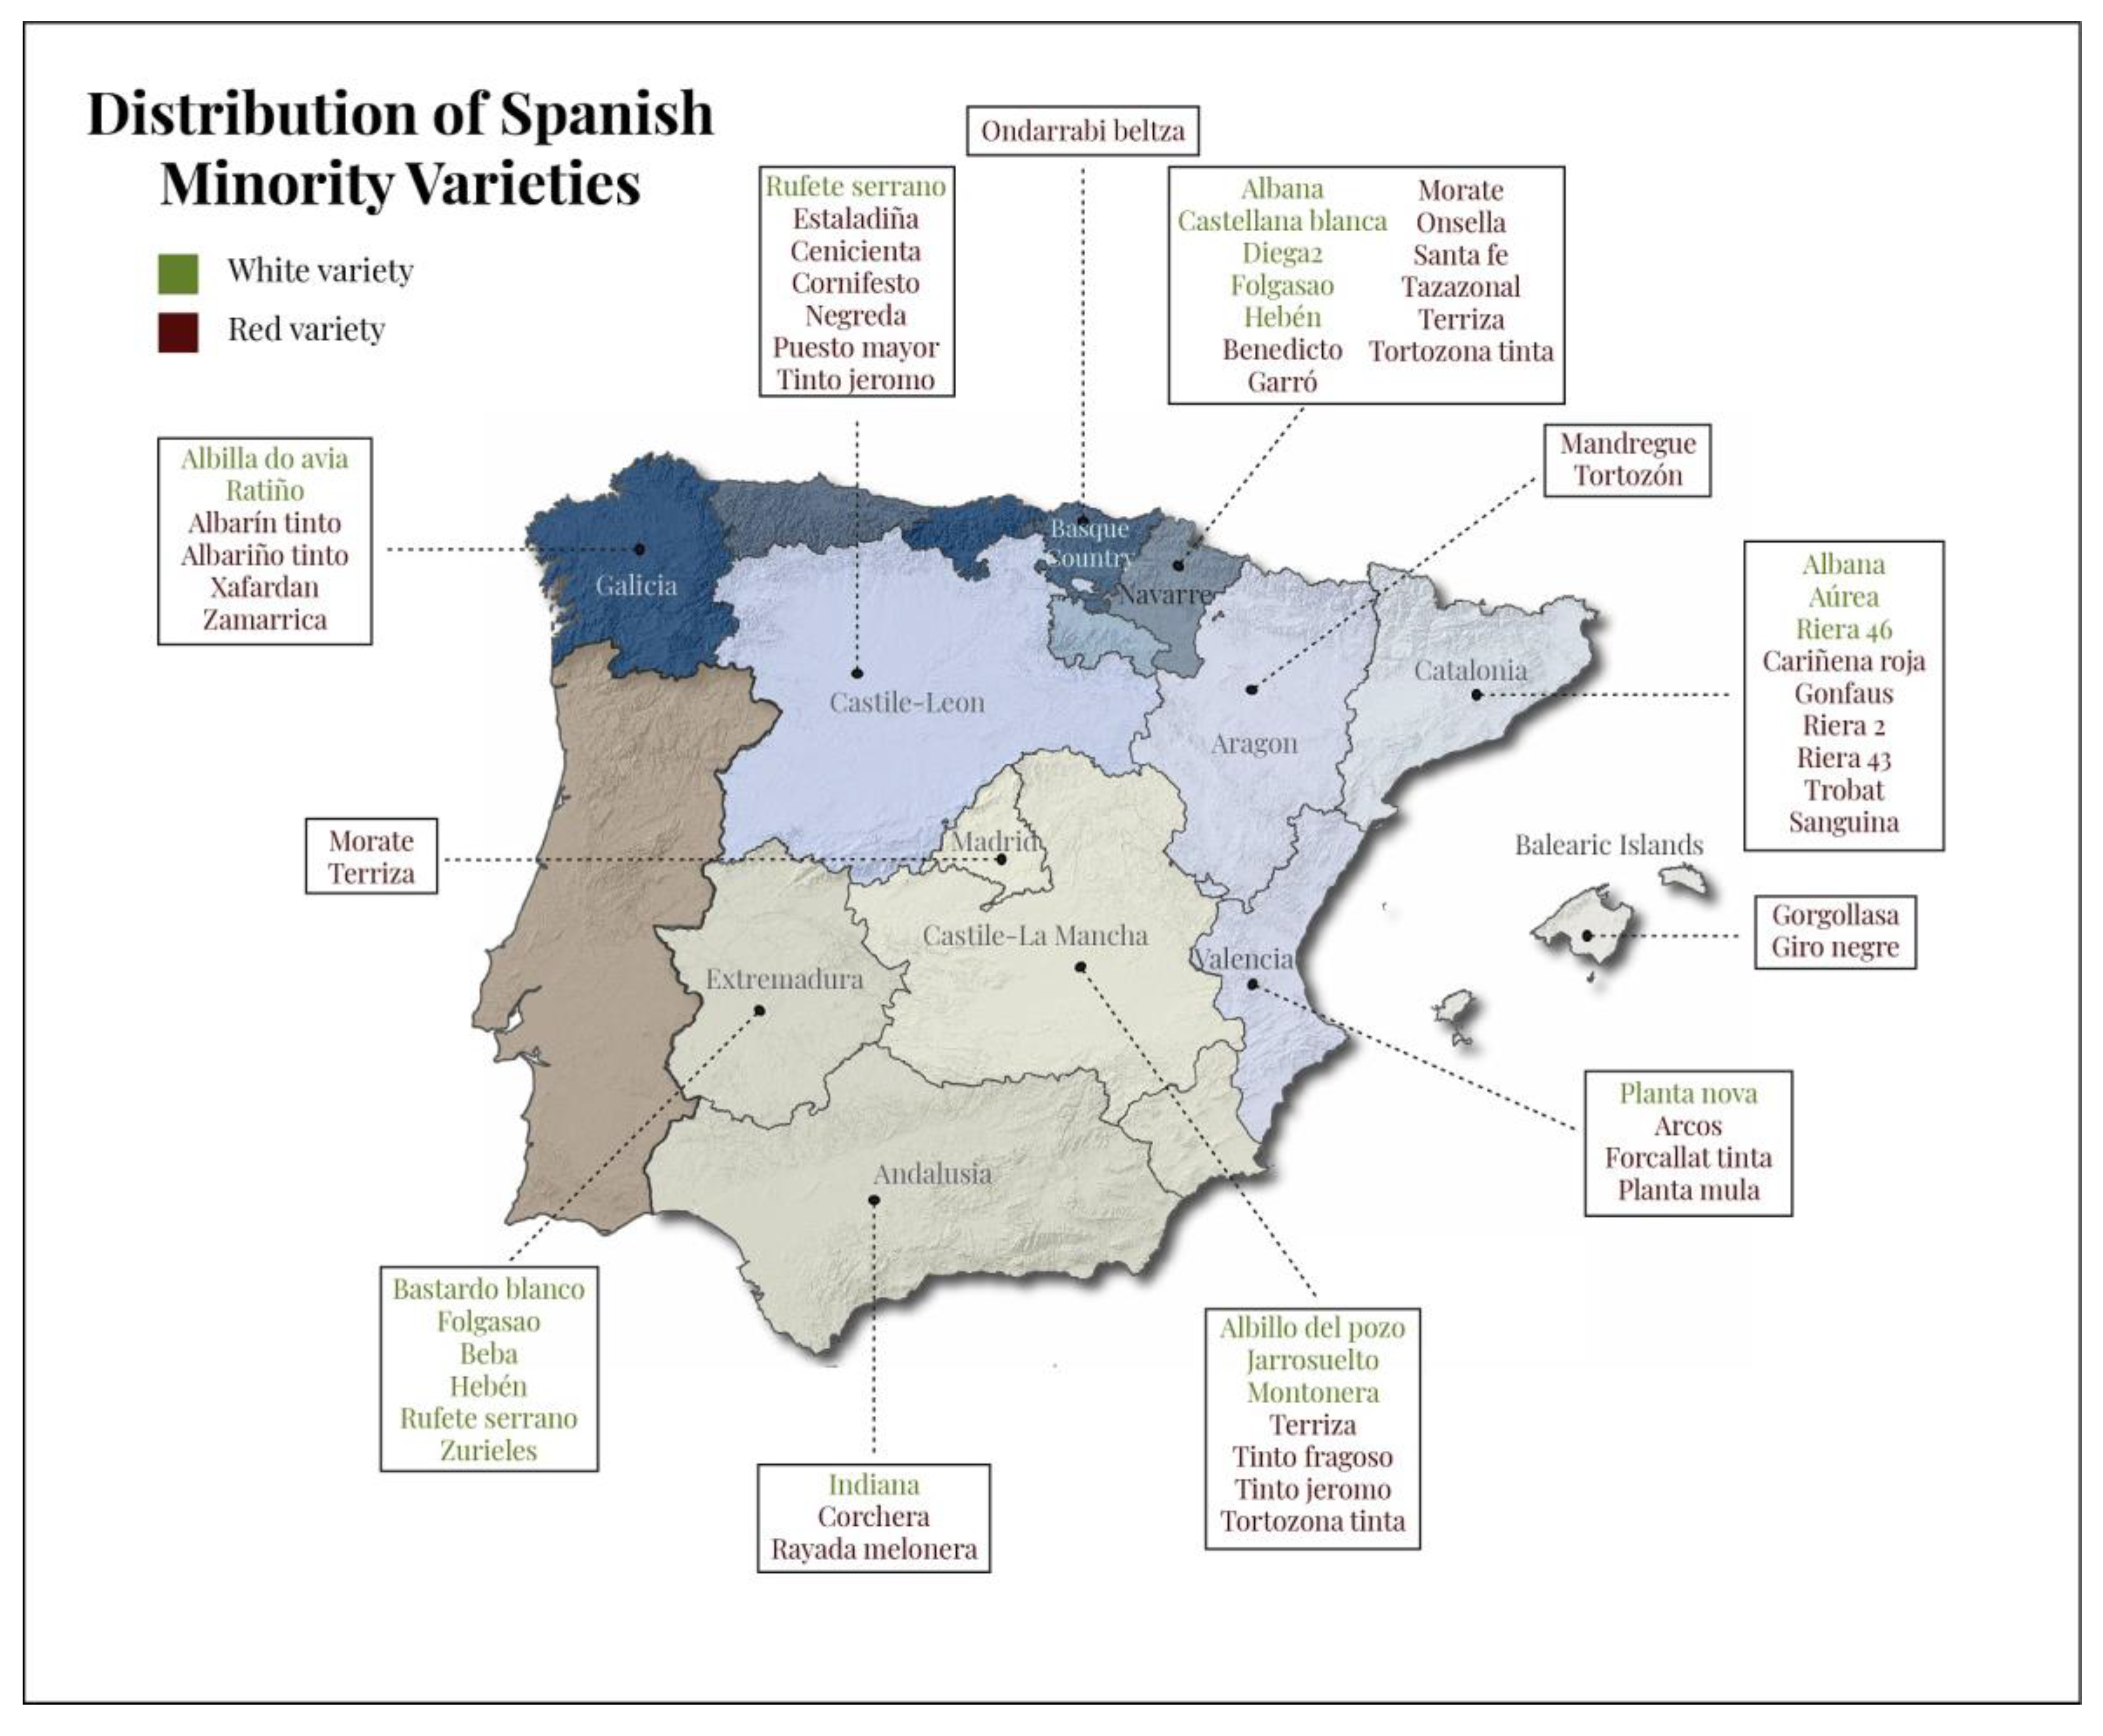
Figure 1. Map of the Spanish regions where the studied minority varieties were prospected.
Horticulturae 08 00984 g001
Figure 2. (a) Average, maximum, and minimum temperatures during the study (2019–2021) and during the 1957–2021 time period. (b) Trends in average, maximum, and minimum temperatures during the 1957–2021 time period.
Horticulturae 08 00984 g002
Figure 3. (a) Average of phenological stages at El Encín (Madrid) during the study period (budburst: green; flowering: yellow; veraison: orange; ripeness: red). (b) Average of phenological stages at El Encín (Madrid) *, and Galicia **, during the 2019–2021 time period (budburst: green; flowering: yellow; veraison: orange; ripeness: red). (c) Average of phenological stages at El Encín (Madrid) *, and Navarre **, during the 2019–2021 time period (budburst: green; flowering: yellow; veraison: orange; ripeness: red). (d) Average of phenological stages at El Encín (Madrid) *, and Catalonia **, during the 2019–2021 time period (budburst: green; flowering: yellow; veraison: orange; ripeness: red). (e) Average of phenological stages at El Encín (Madrid) *, and Extremadura **, during the 2019–2021 time period (budburst: green; flowering: yellow; veraison: orange; ripeness: red). (f) Average of phenological stages at El Encín (Madrid) *, and Andalusia **, during the 2019–2921 time period (budburst: green; flowering: yellow; veraison: orange; ripeness: red).
Horticulturae 08 00984 g003aHorticulturae 08 00984 g003b
Figure 4. Groups of white varieties according to ripeness (average of 2019, 2020, and 2021).
Horticulturae 08 00984 g004
Figure 5. Groups of red varieties according to ripeness (average of 2019, 2020, and 2021).
Horticulturae 08 00984 g005
Figure 6. Examples of graphs of GDD variables at the different stages of ripeness in 2019 (left red varieties, right white varieties).
Horticulturae 08 00984 g006
Figure 7. White minority varieties grouped according to yield (g/shoot, average of 2019, 2020, and 2021).
Horticulturae 08 00984 g007
Figure 8. Red minority varieties grouped according to yield (g/shoot, average of 2019, 2020, and 2021).
Horticulturae 08 00984 g008
Figure 9. Titratable acidity in grapes from the minority varieties studied (average 2019, 2020 and 2021).
Horticulturae 08 00984 g009
Figure 10. Illustration of workflow used to identify suitable candidate varieties.
Horticulturae 08 00984 g010
Table 1. Minority varieties studied and the regions where the material was prospected.
VarietyBerry ColorLocations of StudyProspection Regions
AlbanawhiteMadrid (El Encín)Catalonia, Navarre
Albarín tintoredGaliciaGalicia
Albariño tintoredGaliciaGalicia
Albilla do aviawhiteGaliciaGalicia
Albillo del pozowhiteMadrid (El Encín)Castile-La Mancha
ArcosredMadrid (El Encín)Valencia
AúreawhiteMadrid (El Encín)Catalonia
Bastardo blancowhiteMadrid (El Encín)Extremadura
BebawhiteMadrid (El Encín)Extremadura
BenedictoredMadrid (El Encín)Navarre
Cariñena rojaredMadrid (El Encín)Catalonia
Castellana blancawhiteMadrid (El Encín)Navarre
CenicientaredMadrid (El Encín)Castile-Leon
CorcheraredMadrid (El Encín)Andalusia
CornifestoredMadrid (El Encín)Castile-Leon
Diega 2whiteMadrid (El Encín)Navarre
EstaladiñaredMadrid (El Encín)Castile-Leon
FolgasaowhiteMadrid (El Encín)Extremadura, Navarre
Forcallat tintaredMadrid (El Encín)Valencia
GarróredMadrid (El Encín)Navarre
Giró negreredMadrid (El Encín)Balearic Islands
GonfausredMadrid (El Encín)Catalonia
GorgollasaredMadrid (El Encín)Balearic Islands
HebénwhiteMadrid (El Encín)Extremadura, Navarre
IndianawhiteAndalusiaAndalusia
JarrosueltowhiteMadrid (El Encín)Castile-La Mancha
MandregueredMadrid (El Encín)Aragon
MontonerawhiteMadrid (El Encín)Castile-La Mancha
MorateredMadrid (El Encín)Navarre, Madrid
Moscatel de G MenudowhiteMadrid (El Encín)Several
NegredaredMadrid (El Encín)Castile-Leon
Ondarrabi beltzaredMadrid (El Encín)Basque Country
OnsellaroseNavarreNavarre
Planta mularedMadrid (El Encín)Valencia
Planta novawhiteMadrid (El Encín)Valencia
Puesto mayorredMadrid (El Encín)Castile-Leon
RatiñowhiteMadrid (El Encín)Galicia
Rayada meloneraredMadrid (El Encín)Andalusia
Riera 2redCataloniaCatalonia
Riera 43redCataloniaCatalonia
Riera 46whiteCataloniaCatalonia
Rufete serranowhiteMadrid (El Encín)Extremadura, Castile-Leon
SanguinaredMadrid (El Encín)Catalonia
Santa feredMadrid (El Encín)Navarra
TazazonalredMadrid (El Encín)Navarra
TempranilloredMadrid (El Encín)Several
TerrizaredMadrid (El Encín)Navarre, Castile-La Mancha, Madrid
Tinto fragosoredMadrid (El Encín)Castile-La Mancha
Tinto jeromoredMadrid (El Encín)Castile-La Mancha, Castile-Leon
TortozónwhiteMadrid (El Encín)Aragon
Tortozona tintaredMadrid (El Encín)Navarre, Castile-La Mancha
TrobatredMadrid (El Encín)Catalonia
XafardanredGaliciaGalicia
ZamarricaredGaliciaGalicia
ZurieleswhiteMadrid (El Encín)Extremadura
Table 2. Pearson correlation between growing degree days (GDDs) in the main phenological stages and ripeness of the white minority varieties.
GDD Ripeness 2019Ripeness 2020Ripeness 2021
GDD budburstPearson correlation0.5520.0910.312
Sig. (bilateral)0.0790.7470.323
N111512
GDD floweringPearson correlation0.669 *0.4660.658 *
Sig. (bilateral)0.0250.0690.20
N111612
GDD veraisonPearson correlation0.808 *0.1540.817 **
Sig. (bilateral)0.0030.5700.001
N111612
GDD ripenessPearson correlation0.997 *0.987 **0.990 **
Sig. (bilateral)0.0000.0000.000
N111612
* Significance level of 0.05 (bilateral); ** significance level of 0.01 (bilateral).
Table 3. Pearson correlation between growing degree days (GDDs) in the main phenological stages and ripeness of the red minority varieties.
GDD Ripeness 2019Ripeness 2020Ripeness 2021
GDD budburstPearson correlation0.1760.2050.244
Sig. (bilateral)0.4340.3480.251
N222324
GDD floweringPearson correlation−0.1820.2960.367
Sig. (bilateral)0.4160.1510.077
N222524
GDD veraisonPearson correlation0.3660.716 *0.478 *
Sig. (bilateral)0.0940.0000.018
N222524
GDD ripenessPearson correlation0.997 *0.998 **0.990 **
Sig. (bilateral)0.0000.0000.000
N222524
* Significance level of 0.05 (bilateral);** significance level of 0.01 (bilateral).
Publisher’s Note: MDPI stays neutral with regard to jurisdictional claims in published maps and institutional affiliations.