Article

Elucidating the Molecular Responses to Waterlogging Stress in Cucumis melo by Comparative Transcriptome Profiling

1
Key Laboratory of Horticultural Plant Genetics and Physiology, Institute of Horticulture, Jiangxi Academy of Agricultural Sciences, Nanchang 330200, China
2
Zhengzhou Fruit Research Institute, Chinese Academy of Agricultural Sciences, Zhengzhou 450009, China
*
Authors to whom correspondence should be addressed.
These authors contributed equally to this work.
Horticulturae 2022, 8(10), 891; https://doi.org/10.3390/horticulturae8100891
Submission received: 21 August 2022 / Revised: 21 September 2022 / Accepted: 24 September 2022 / Published: 29 September 2022
(This article belongs to the Section Biotic and Abiotic Stress)

Abstract

:
Waterlogging is a serious abiotic stressor that drastically hinders the growth and productivity of melon (Cucumis melo) around the world, due to the reduction in available oxygen levels in the waterlogged tissues. However, the mechanism underlying the responses to waterlogging stress in melon is largely unknown. In this study, physiological and transcriptome data of the waterlogging-sensitive accession ‘L39’ and the waterlogging-tolerant accession ‘L45’ were investigated under conditions of normal water supply and waterlogging stress. The results showed that ‘L45’ exhibited higher chlorophyll contents and lower REL (relative electrolyte leakage) and MDA (malondialdehyde) contents compared with ‘L39’ under waterlogging stress. Additionally, waterlogging stress only led to the stomatal closure and chloroplast damage of ‘L39’. In total, 1748 genes were differentially expressed in the leaves of waterlogging-stressed ‘L45’ compared with control, whereas 3178 genes were differentially expressed in ‘L39’. Further analysis indicated that genes related to chlorophyll synthesis and photosynthesis were more depressed in ‘L39’, while sugar cleavage, glycolysis, and fermentation genes were highly induced in ‘L39’ compared with ‘L45’. The expression of genes involved in ROS (reactive oxygen species) scavenging and hormone signaling significantly differed between ‘L39’ and ‘L45’ in their response to waterlogging stress. Moreover, a total of 311 differentially expressed transcription factors were waterlogging-responsive, among which members of the ERF (ethylene response factor), bHLH (basic helix-loop-helix), and WRKY families might play crucial roles in waterlogging tolerance in melon. This study unraveled the molecular responses to waterlogging stress in melon and could provide helpful candidate genes for further molecular breeding of waterlogging-tolerant melon varieties.

1. Introduction

Due to global climate change, flooding has become one of the most widespread stressors threatening crop production and food security worldwide. Flooding can be classified either as waterlogging, when water only covers the root zone of the plant, or as submergence, when the water fully covers the aerial plant tissues [1,2]. Waterlogging is a more common problem than submergence in dryland plants since soil can become easily waterlogged because of poor drainage after a prolonged period of excessive rainfall or irrigation [3,4,5]. The oxygen starvation caused by waterlogging in the root zone arises from an imbalance between the slow gas diffusion rate in water compared with air and the rapid consumption rate of oxygen by plant roots and microorganisms [6]. This leads to an energy crisis in the plant caused by the suppression of oxidative phosphorylation, impaired root hydraulic conductivity, reduced ion absorption and water uptake, decreased stomatal conductance, transpiration, and photosynthesis, and an imbalance in the phytohormones, which manifest as growth arrest and biomass and yield reduction [4,7,8,9].
To survive this state of restricted oxygen supply, plants have evolved an array of strategies to modulate their transcription, translation, and metabolite levels, resulting in modifications of morphology, physiology, and metabolism. It has been reported that several morphological changes, including aerenchyma development, adventitious root formation, shoot elongation, and leaf epinasty can mitigate the negative effects of the hypoxic environment caused by waterlogging stress [10,11,12]. A prominent response to oxygen deficiency is an energy metabolism shift from aerobic respiration to anaerobic respiration via the activation of genes that participate in glycolysis and fermentation, which results in a rapid reduction in ATP level and the accumulation of acetaldehyde, acetate, ethanol, and other harmful substances [13,14,15]. Plant hormones, as the crucial regulators of the signaling transduction pathway, act prominently in both developmental processes and against various biotic and abiotic stresses throughout the whole lifespan of plants. It has been reported that ethylene, auxin, gibberellin, abscisic acid, salicylic acid, and jasmonic acid are involved in the responses to waterlogging stress and contribute to mediating many pathways required for waterlogging tolerance [16,17,18,19]. Furthermore, several families of transcription factors, such as ERF (ethylene response factor), MYB (v-myb avian myeloblastosis viral oncogene homolog), WRKY, bHLH (basic helix-loop-helix) and bZIP (basic leucine zipper), have also been described as playing critical roles in response to waterlogging stress-induced gene regulation [20,21,22].
Melon (Cucumis melo L.) is an economically important fruit crop that has a sweet aromatic taste and high nutritional value [23,24], with an estimated production of more than 42 million tons worldwide in 2020, according to the United Nations Food and Agriculture Organization (FAO) (http://faostat.fao.org, accessed on 20 June 2020). Waterlogging stress can disturb the normal growth and development of melon and may even lead to the death of plants, which seriously influences the quality and yield of melon in rainy regions [17]. Nevertheless, there has been relatively little research into the waterlogging response mechanism of melon until now. In the present study, two melon accessions, i.e., ‘L39’ (waterlogging-sensitive) and ‘L45’ (waterlogging-tolerant), were investigated to explore the possible difference in their molecular responses to waterlogging stress, with the assistance of RNA-seq-based comparative transcriptome analysis. Our results will provide insights into the regulatory networks and tolerance mechanisms underlying the responses of melon to waterlogging stress, which may contribute to the future molecular stress resistance breeding of melon.

2. Materials and Methods

2.1. Plant Materials and Waterlogging Stress Treatment

Two melon accessions, ‘L39’ (waterlogging-sensitive) and ‘L45’ (waterlogging-tolerant), cultivated by the Jiangxi Academy of Agricultural Sciences (Nanchang, China), were used in this study. Seeds of ‘L39’ and ‘L45’ were soaked in distilled water for 5 h and sown in 7-cm-wide plastic pots under natural temperature and lighting (28 °C/20 °C, 12 h/12 h) and a relative humidity ranging from 70% to 85% in a ventilated greenhouse. The cultured soil was a 3:1:1 (v/v/v) mixture of peat, vermiculite, and perlite. Healthy and uniform seedlings with three true leaves were selected for waterlogging stress treatment. The pots were placed into plastic containers filled with tap water to the top of the hypocotyls. Waterlogging stress treatment was maintained for four days, and the flooding depth was kept constant throughout the experiment. The control plants without waterlogging remained well-watered as normal, in plastic containers. For RNA-seq and physiological analysis, the leaves were collected after four days of waterlogging stress and the leaves of the control plants were sampled simultaneously. The samples under control conditions were designated as L39_C and L45_C, while samples under waterlogging stress were designated as L39_W and L45_W. There were two biological replicates, with 15 seedlings per replicate. The samples were placed into liquid nitrogen immediately and then kept at −80 °C until further analyses.

2.2. Leaf Chlorophyll Content, Malondialdehyde Content, and Relative Electrolyte Leakage (REL) Determination

The contents of leaf chlorophyll and malondialdehyde (MDA) were determined using a plant chlorophyll content detection kit (Solarbio, Beijing, China) and an MDA assay kit (Solarbio, Beijing, China), as described previously [25,26,27]. For chlorophyll content determination, 0.1 g of leaf samples was ground in liquid nitrogen and extracted by extraction buffer for 3 h, under dark conditions. After centrifugation at 10,000× g for 10 min, the supernatants were detected by spectrophotometer at the absorption wavelengths of 645 and 663 nm. For MDA content quantification, 0.1 g of leaf samples was ground in liquid nitrogen, extracted with an extraction buffer, and centrifuged at 8000× g for 10 min at 4 °C. After the addition of MDA test solution to the supernatants, the mixture was kept in a boiling water bath for 60 min, cooled to room temperature in an ice bath, and centrifuged at 10,000× g for 10 min. The absorbance of the obtained supernatants was measured at 450, 532, and 600 nm. For the REL analysis, 10 leaf discs were collected from freshly harvested leaf samples using a 1 cm punch. Each leaf disc from every sample was put into a covered test tube containing 10 mL of distilled water. After being shaken for 3 h, the conductivity was measured with a conductivity meter. Then, the tubes were stored in a boiling water bath for 30 min and cooled to room temperature. The conductivity was detected again; the REL was the ratio of the measured conductivity.

2.3. Ultrastructure Analysis

Ultrastructure observation was performed according to previous reports, with minor modifications [28,29]. For scanning electron microscopy (SEM), the leaves of ‘L39’ and ‘L45’ plants under waterlogging stress for four days were fixed in 2.5% (v/v) glutaraldehyde solution (Solarbio, Beijing, China) for 24 h and rinsed with 0.1 M phosphate buffer (pH 7.2, Sigma-Aldrich, St. Louis, MO, USA) for 3 times. After being fixed in 1% (v/v) OsO4 (Aladdin, Shanghai, China) for 2 h, the samples were dehydrated with a gradient ethanol solution, sputter-coated with gold, and observed under a HITACHI S-3400N scanning electron microscope (Hitachi Ltd., Tokyo, Japan). The stomatal aperture was evaluated by the level of stomatal opening, including completely open, partially open, and completely closed stomata [30]. The number of evaluated stomata for each accession was approximately 50. For transmission electron microscopy (TEM), the leaf samples were fixed in 2.5% (v/v) glutaraldehyde solution for 24 h and post-fixed overnight in 1% (v/v) OsO4. After rinsing 3 times in phosphate buffer, the samples were dehydrated with gradient ethanol series and then embedded in London Resin White (Aladdin, Shanghai, China). A series of ultrathin sections cut by a Leica ultramicrotome (Leica, Wetzlar, Germany) were treated with 2% (v/v) uranyl acetate and 10 mM lead citrate (Aladdin, Shanghai, China) before observation with a HITACHI-H7500 transmission electron microscope (Hitachi Ltd., Tokyo, Japan).

2.4. RNA Extraction and Transcriptome Sequencing

The total RNA was extracted by Trizol reagent (Invitrogen, Carlsbad, CA, USA) according to the manufacturer’s instructions. The RNA quantity and quality were detected by a NanoDrop 2000 (ThermoFisher, Waltham, MA, USA) and the Agilent Bioanalyzer 2100 (Agilent, Santa Clara, CA, USA). High-quality RNA samples with an OD260/280 value ranging from 1.8 to 2.2 and an RNA integrity number ranging from 7.0 to 10.0 were used. After a series of operations, including mRNA purification, fragmentation, cDNA synthesis, adapter ligation and PCR amplification, 8 RNA-seq libraries (L39_C1, L39_C2, L39_W1, L39_W2, L45_C1, L45_C2, L45_W1 and L45_W2) were constructed. The quantity and quality of these libraries were evaluated with an Agilent Bioanalyzer 2100. The high-quality libraries were used to perform paired-end sequencing on an Illumina HiSeqTM 4000 platform (Illumina, San Diego, CA, USA) by the LC-Biotechnology Co. (Hangzhou, China).

2.5. Analysis of Transcriptome Data

To obtain clean reads, the adaptor sequences, those reads with unknown bases of more than 5%, and low-quality reads were removed from the raw reads. Afterward, the clean reads were mapped to the reference genome of melon (http://cucurbitgenomics.org/v2/ftp/genome/melon/DHL92/v4.0/, accessed on 20 June 2020) using HISAT2 (Version 2.1.0) [31]. The mapped reads of each sample were assembled using StringTie software (Version 2.0) [32]. Subsequently, the transcript abundance of each gene was measured by fragment per kilobase of transcript per million mapped reads (FPKM) using StringTie software. The identification of differentially expressed genes (DEGs) was conducted using DESeq2 [33]; among them, genes with |log2 (fold change)| > 1 and a false discovery rate (FDR) < 0.05 were designated as DEGs. To inspect the functional classifications and metabolic pathways, GO enrichment and KEGG pathway enrichment analyses of the DEGs were conducted using topGO from the Bioconductor package (Version 1.7) [34] and KOBAS software (Version 2.0) [35], with the criterion of FDR < 0.05.

2.6. Quantitative Reverse Transcription-PCR (qRT-PCR) Verification

To verify the reliability of our RNA-seq results, the transcription levels of 26 DEGs were detected by qRT-PCR, using the same RNA samples for RNA-seq library construction. The synthesis of first-strand cDNA was performed using a reverse transcription system (Promega, Madison, WI, USA). The qRT-PCR reaction was conducted on a LightCycler®96 System (Roche, Mannheim, Germany) in a 20 µL reaction system which contained 10 μL of Top Green qPCR SuperMix (TransGen Biotech, Beijing, China), 0.5 μL of cDNA template, 0.5 μL of each primer (10 μmol·L−1, Table S1 in the Supplementary Materials), and 8.5 μL of ddH2O. The thermal cycler procedure was set as previously described [36] and each sample was run in triplicate. The housekeeping gene CmACT was used as an internal control [37]. The 2−ΔΔCt method was used to calculate the relative transcription level of each gene [38].

2.7. Statistical Analysis

Data were analyzed by SAS 9.1.3 (SAS Inc., Cary, NC, USA). The analysis of significant differences was performed by an ANOVA with an LSD test at the level of p < 0.01.

3. Results

3.1. Physiological Responses to Waterlogging Stress

Here, we compared the physiological changes in two melon accessions, ‘L39’ and ‘L45’, in control and waterlogged plants after four days of waterlogging stress. Both ‘L39’ and ‘L45’ showed vigorous development under well-watered control conditions (Figure S1A,B in the Supplementary Materials). The leaves of ‘L39’ became withered and chlorotic after waterlogging stress (Figure S1C), whereas no remarkable changes were observed in ‘L45’ (Figure S1D). Thus, ‘L45’ was more tolerant than ‘L39’ to waterlogging stress. Under control conditions, there was no significant difference in chlorophyll contents between ‘L39’ and ‘L45’ (Figure 1A–C). However, under waterlogging stress, the chlorophyll a, chlorophyll b, and total chlorophyll contents of ‘L45’ were significantly higher than those of ‘L39’ (Figure 1A–C). Similarly, no significant differences were observed in terms of relative electrolyte leakage (REL) and malondialdehyde (MDA) content between ‘L39’ and ‘L45’, under control conditions (Figure 1D,E). However, under waterlogging stress, both the REL and MDA contents of ‘L45’ were significantly lower than those of ‘L39’ (Figure 1D,E).
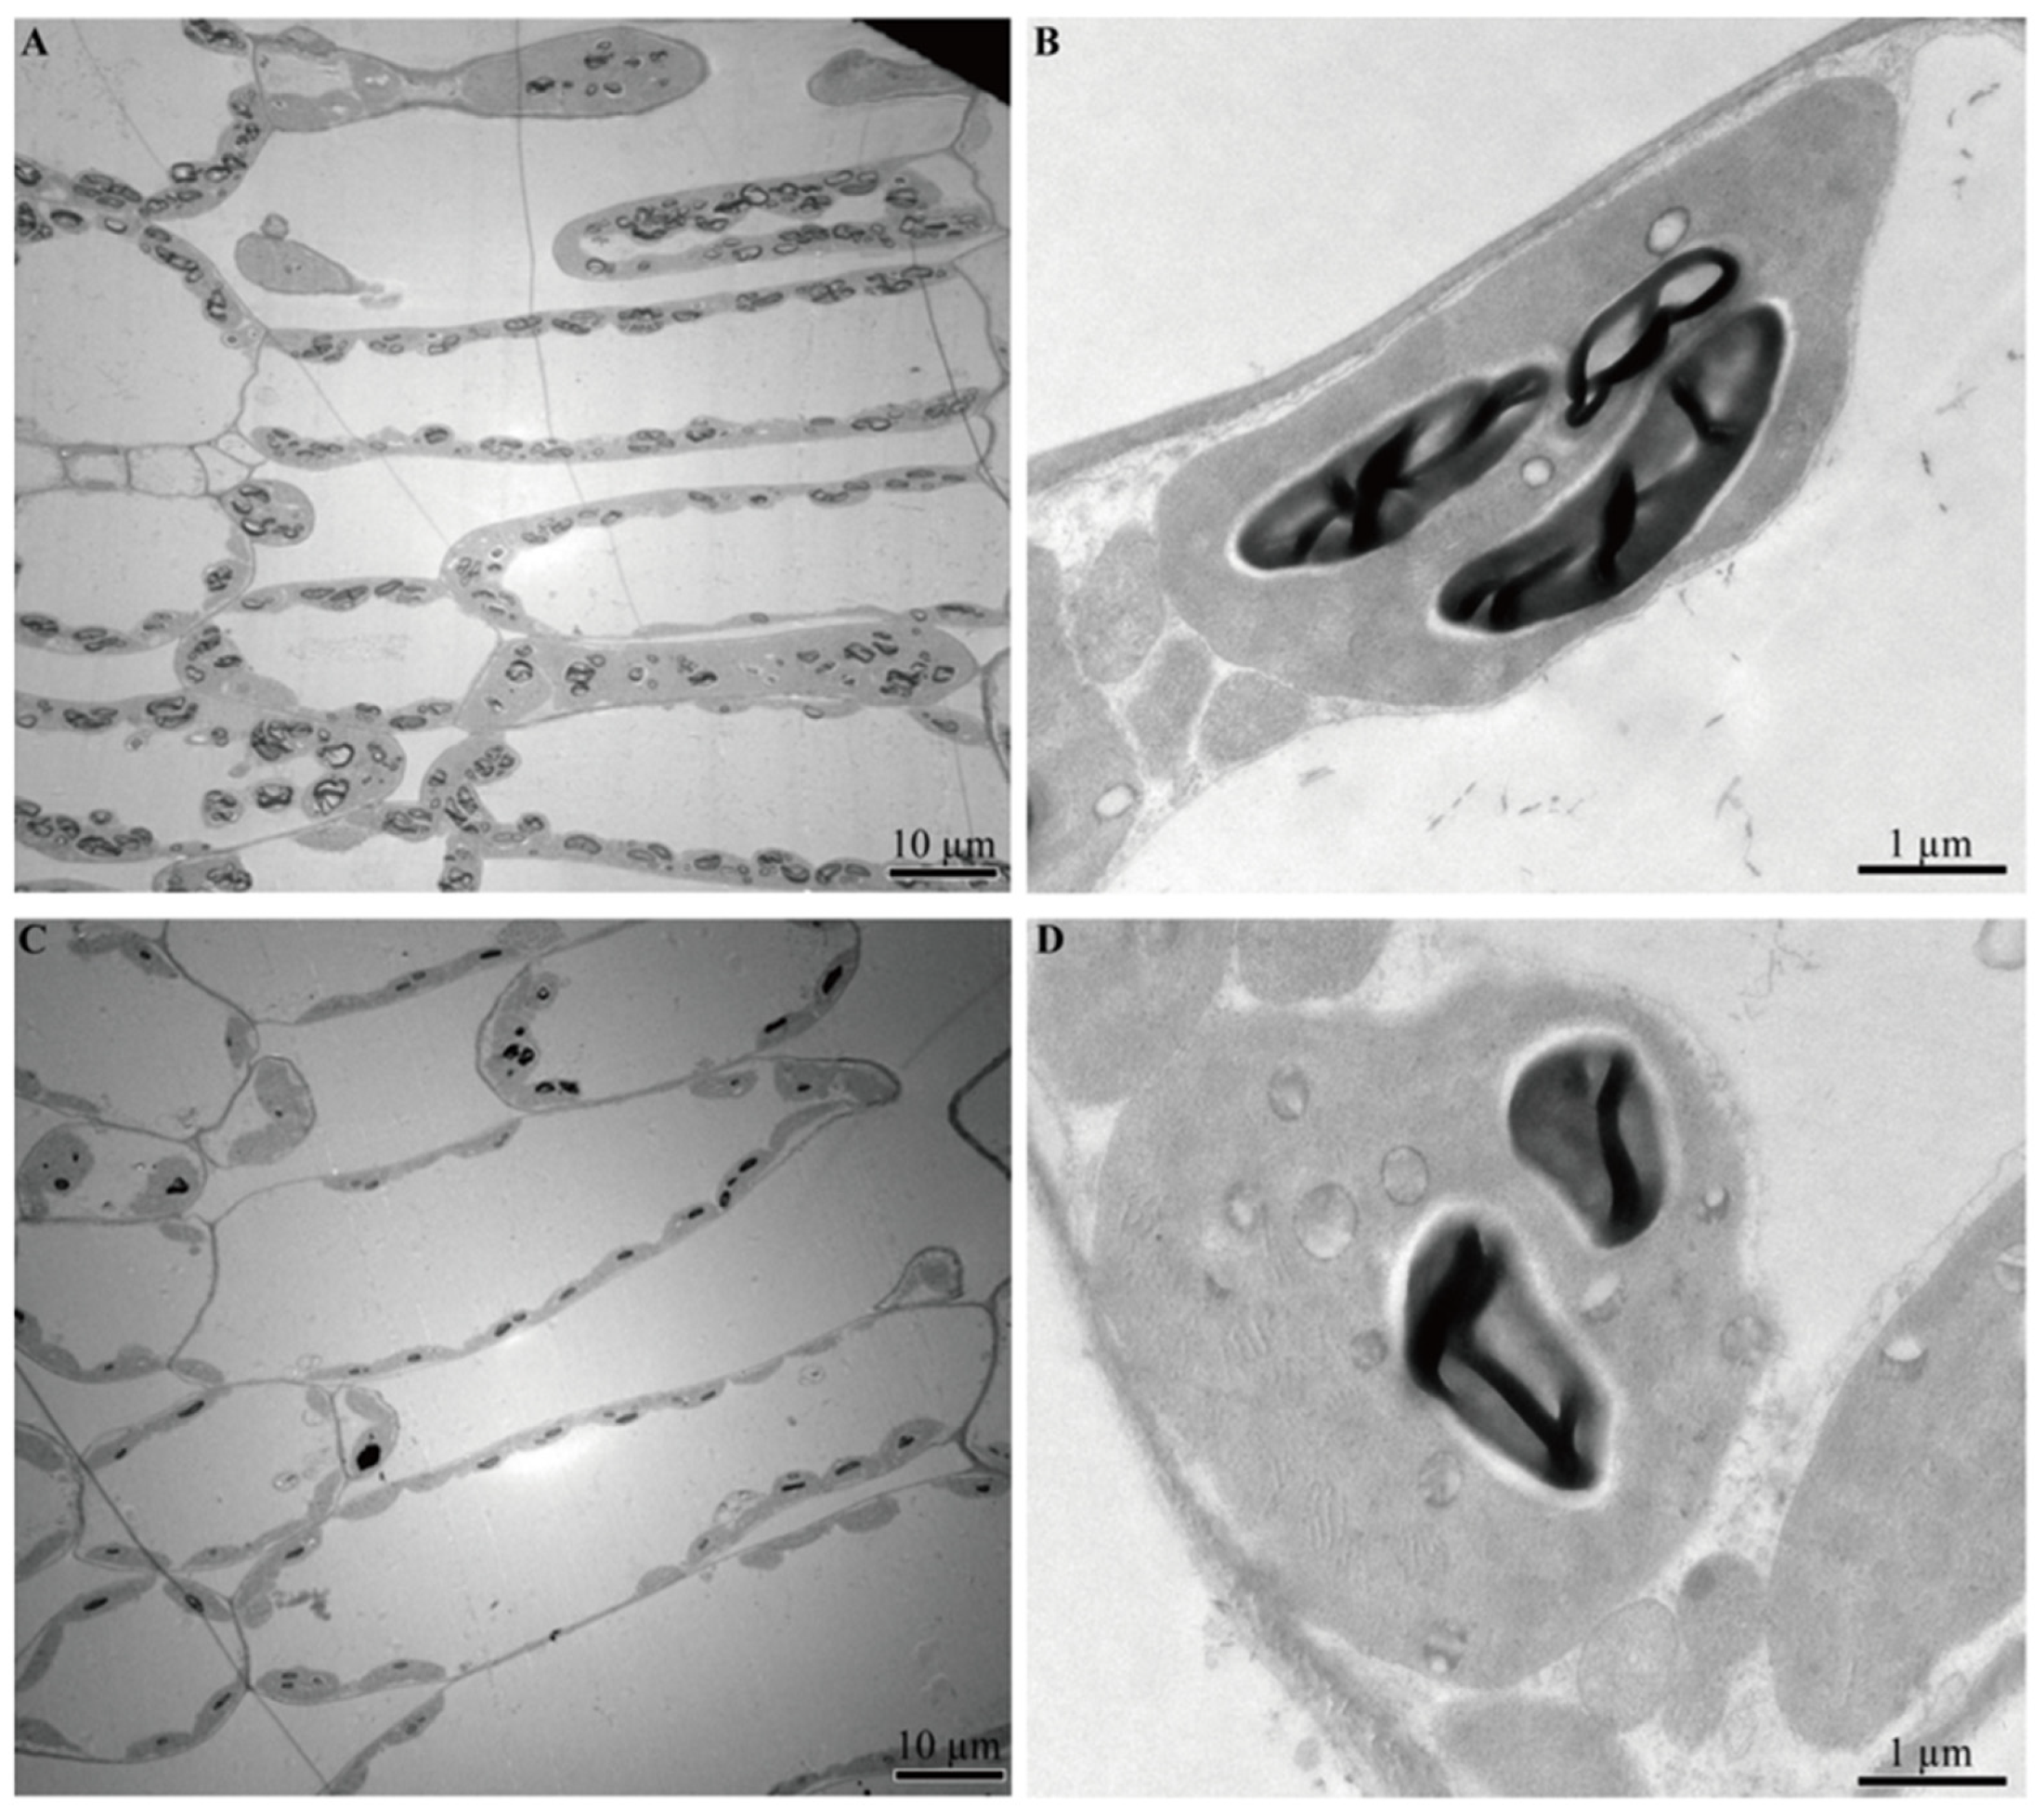
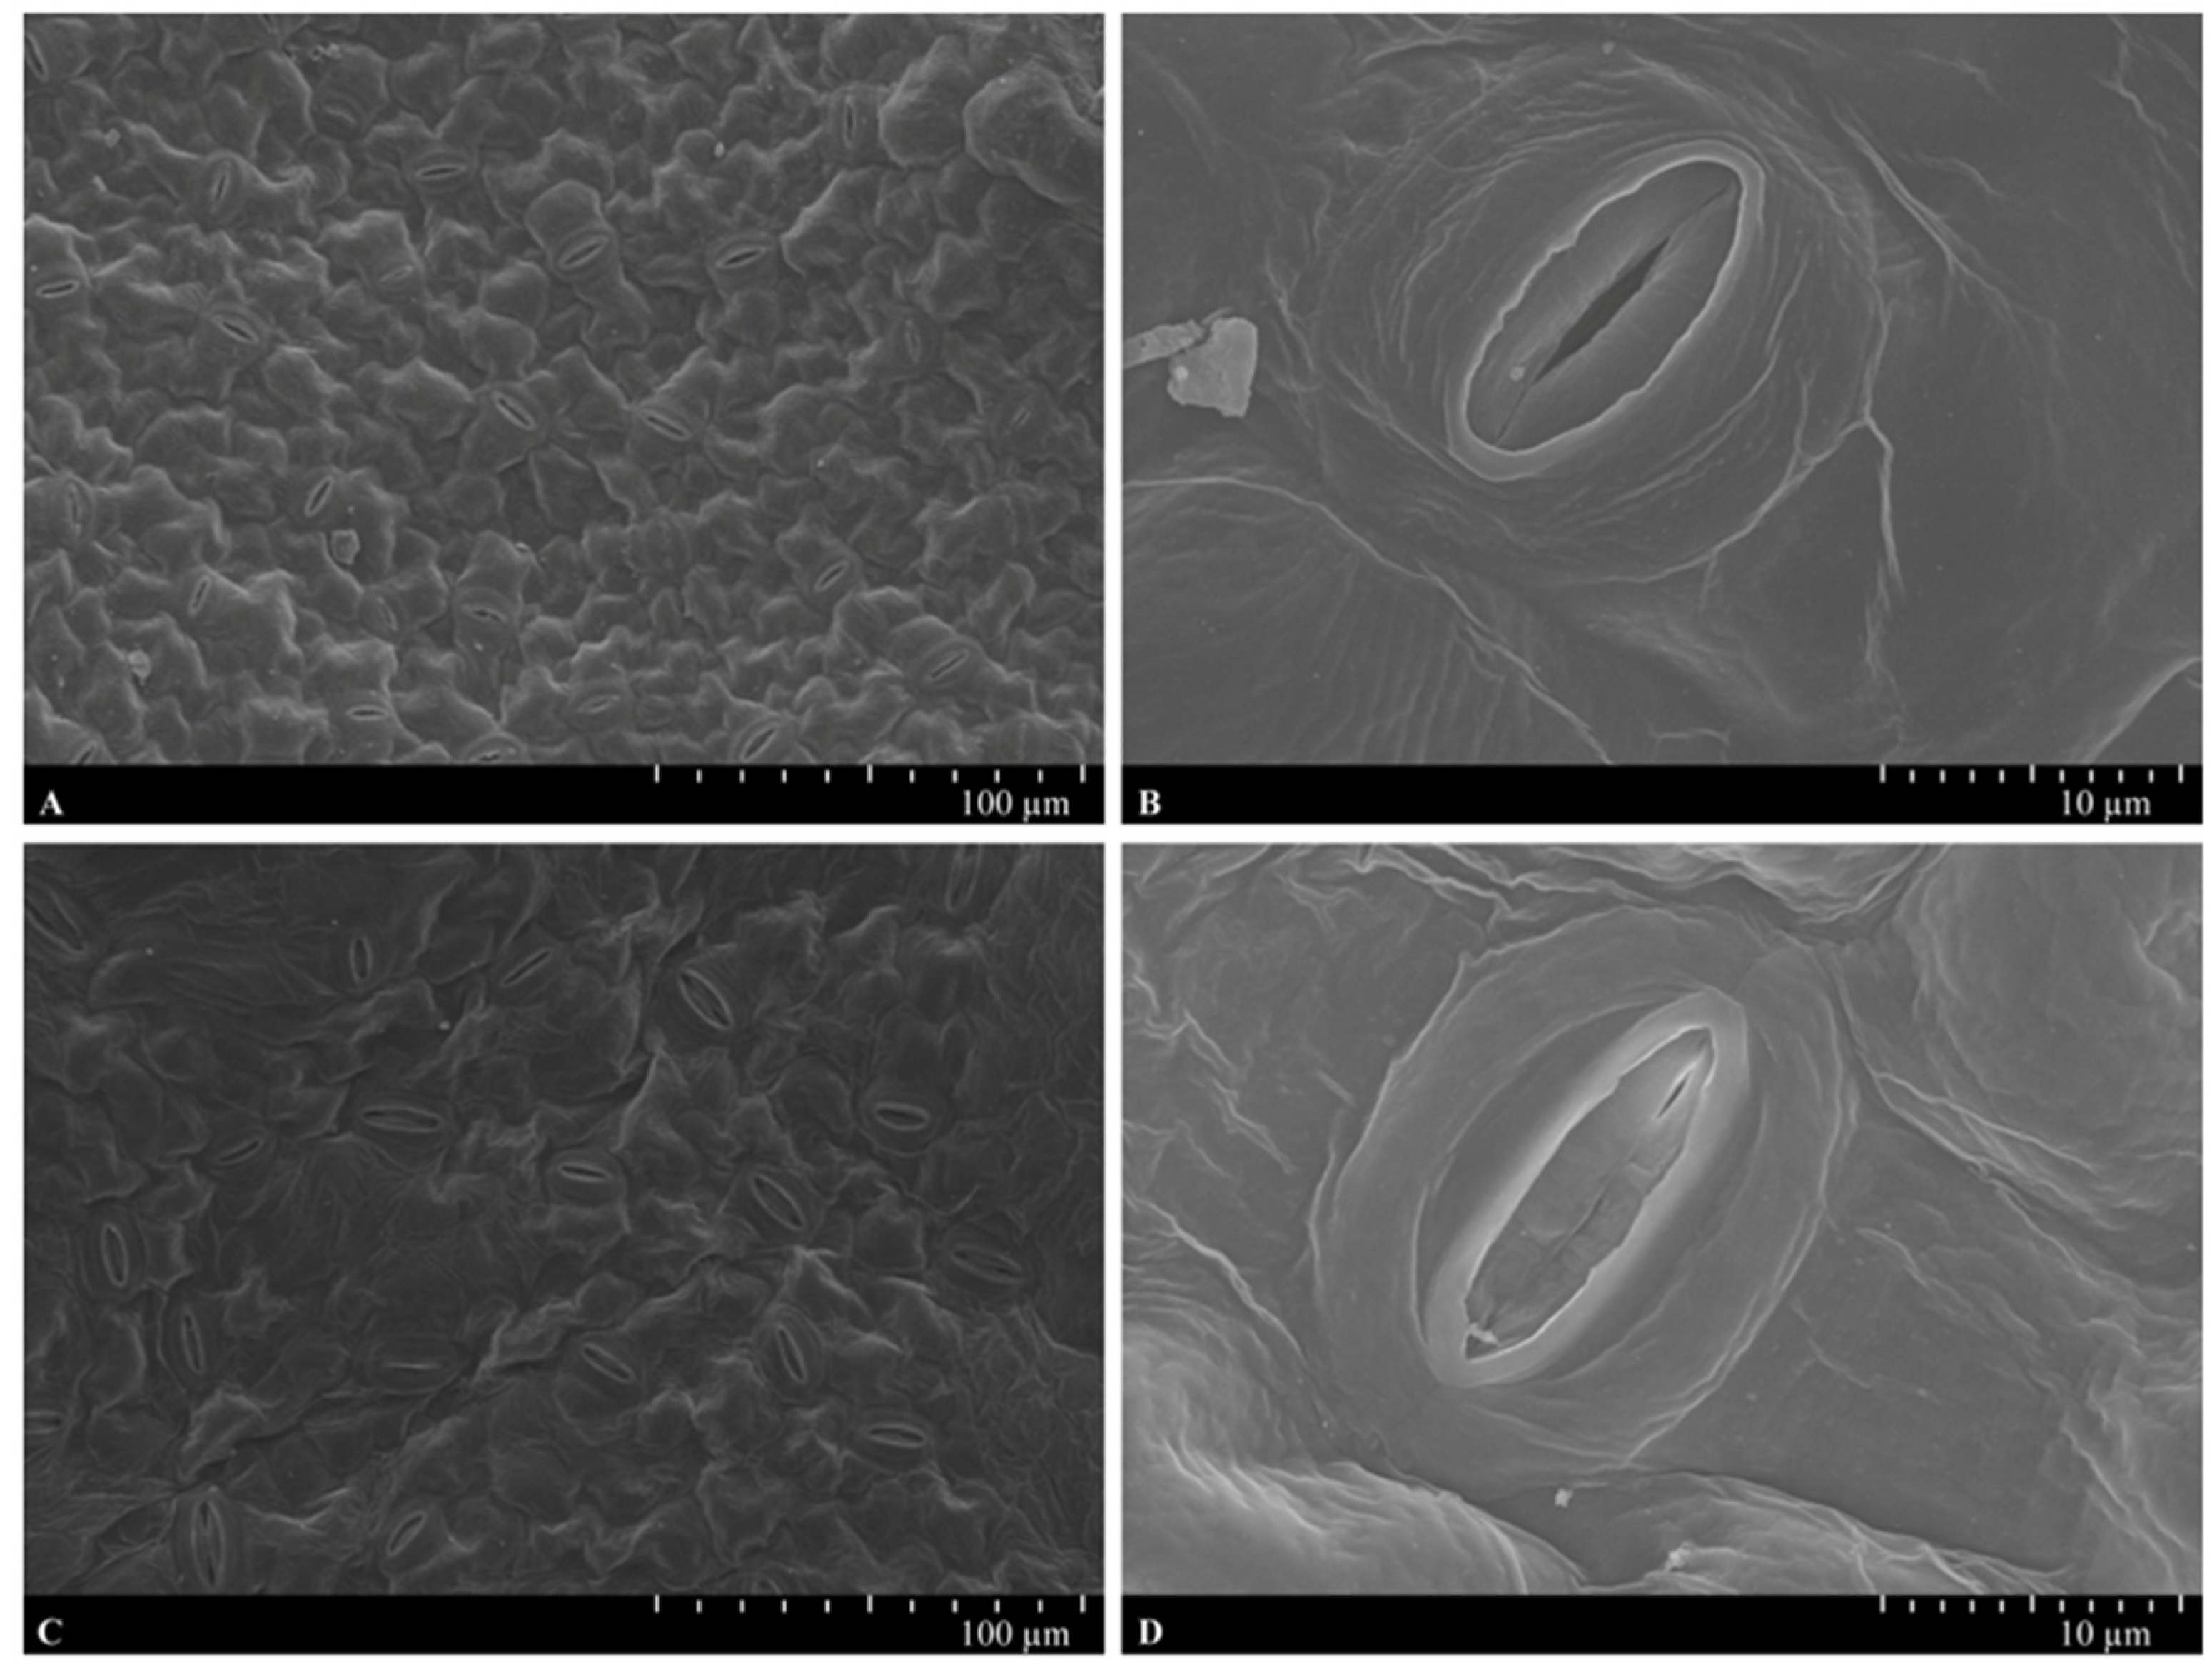
To compare the ultrastructure of chloroplasts between ‘L39’ and ‘L45’, the leaf samples taken after four days of waterlogging stress were observed using transmission electron microscopy. The leaf cells of ‘L45’ contained oval chloroplasts with well-organized lamellar structures (Figure 2A,B), while most of the chloroplasts of ‘L39’ were deformed, showing loose lamellar structures (Figure 2C,D). Additionally, we observed the stomata of the leaves using scanning electron microscopy. The results showed that the number of stomata in ‘L45’ was greater than in ‘L39’ (Figure 3A,C), the development of stomata in ‘L45’ was relatively normal, and most of the stomata were open (Figure 3A,B and Figure S2). However, the epidermal cells of the ‘L39’ leaves were distorted, and some stomata were trapped in the epidermal cells. In addition, most of the stomata became closed (Figure 3C,D and Figure S2).

3.2. Transcriptome Data Analysis

To examine the transcriptional differences between ‘L39’ and ‘L45’ under control and waterlogged conditions, eight RNA-seq libraries, including L39_C1, L39_C2, L39_W1, L39_W2, L45_C1, L45_C2, L45_W1, and L45_W2, were used to perform paired-end sequencing on the Illumina HiSeqTM 4000 platform (Illumina, San Diego, CA, USA). A total of 366.76 million raw reads and 331.65 million clean reads were taken (Table 1). After quality filtering, the clean reads ratio exceeded 86% for each library. In total, we gained a 49.74 giga base of clean bases with a Q20 percentage over 99%, a Q30 percentage over 97%, and a GC percentage ranging from 43.50% to 47.00% (Table 1).
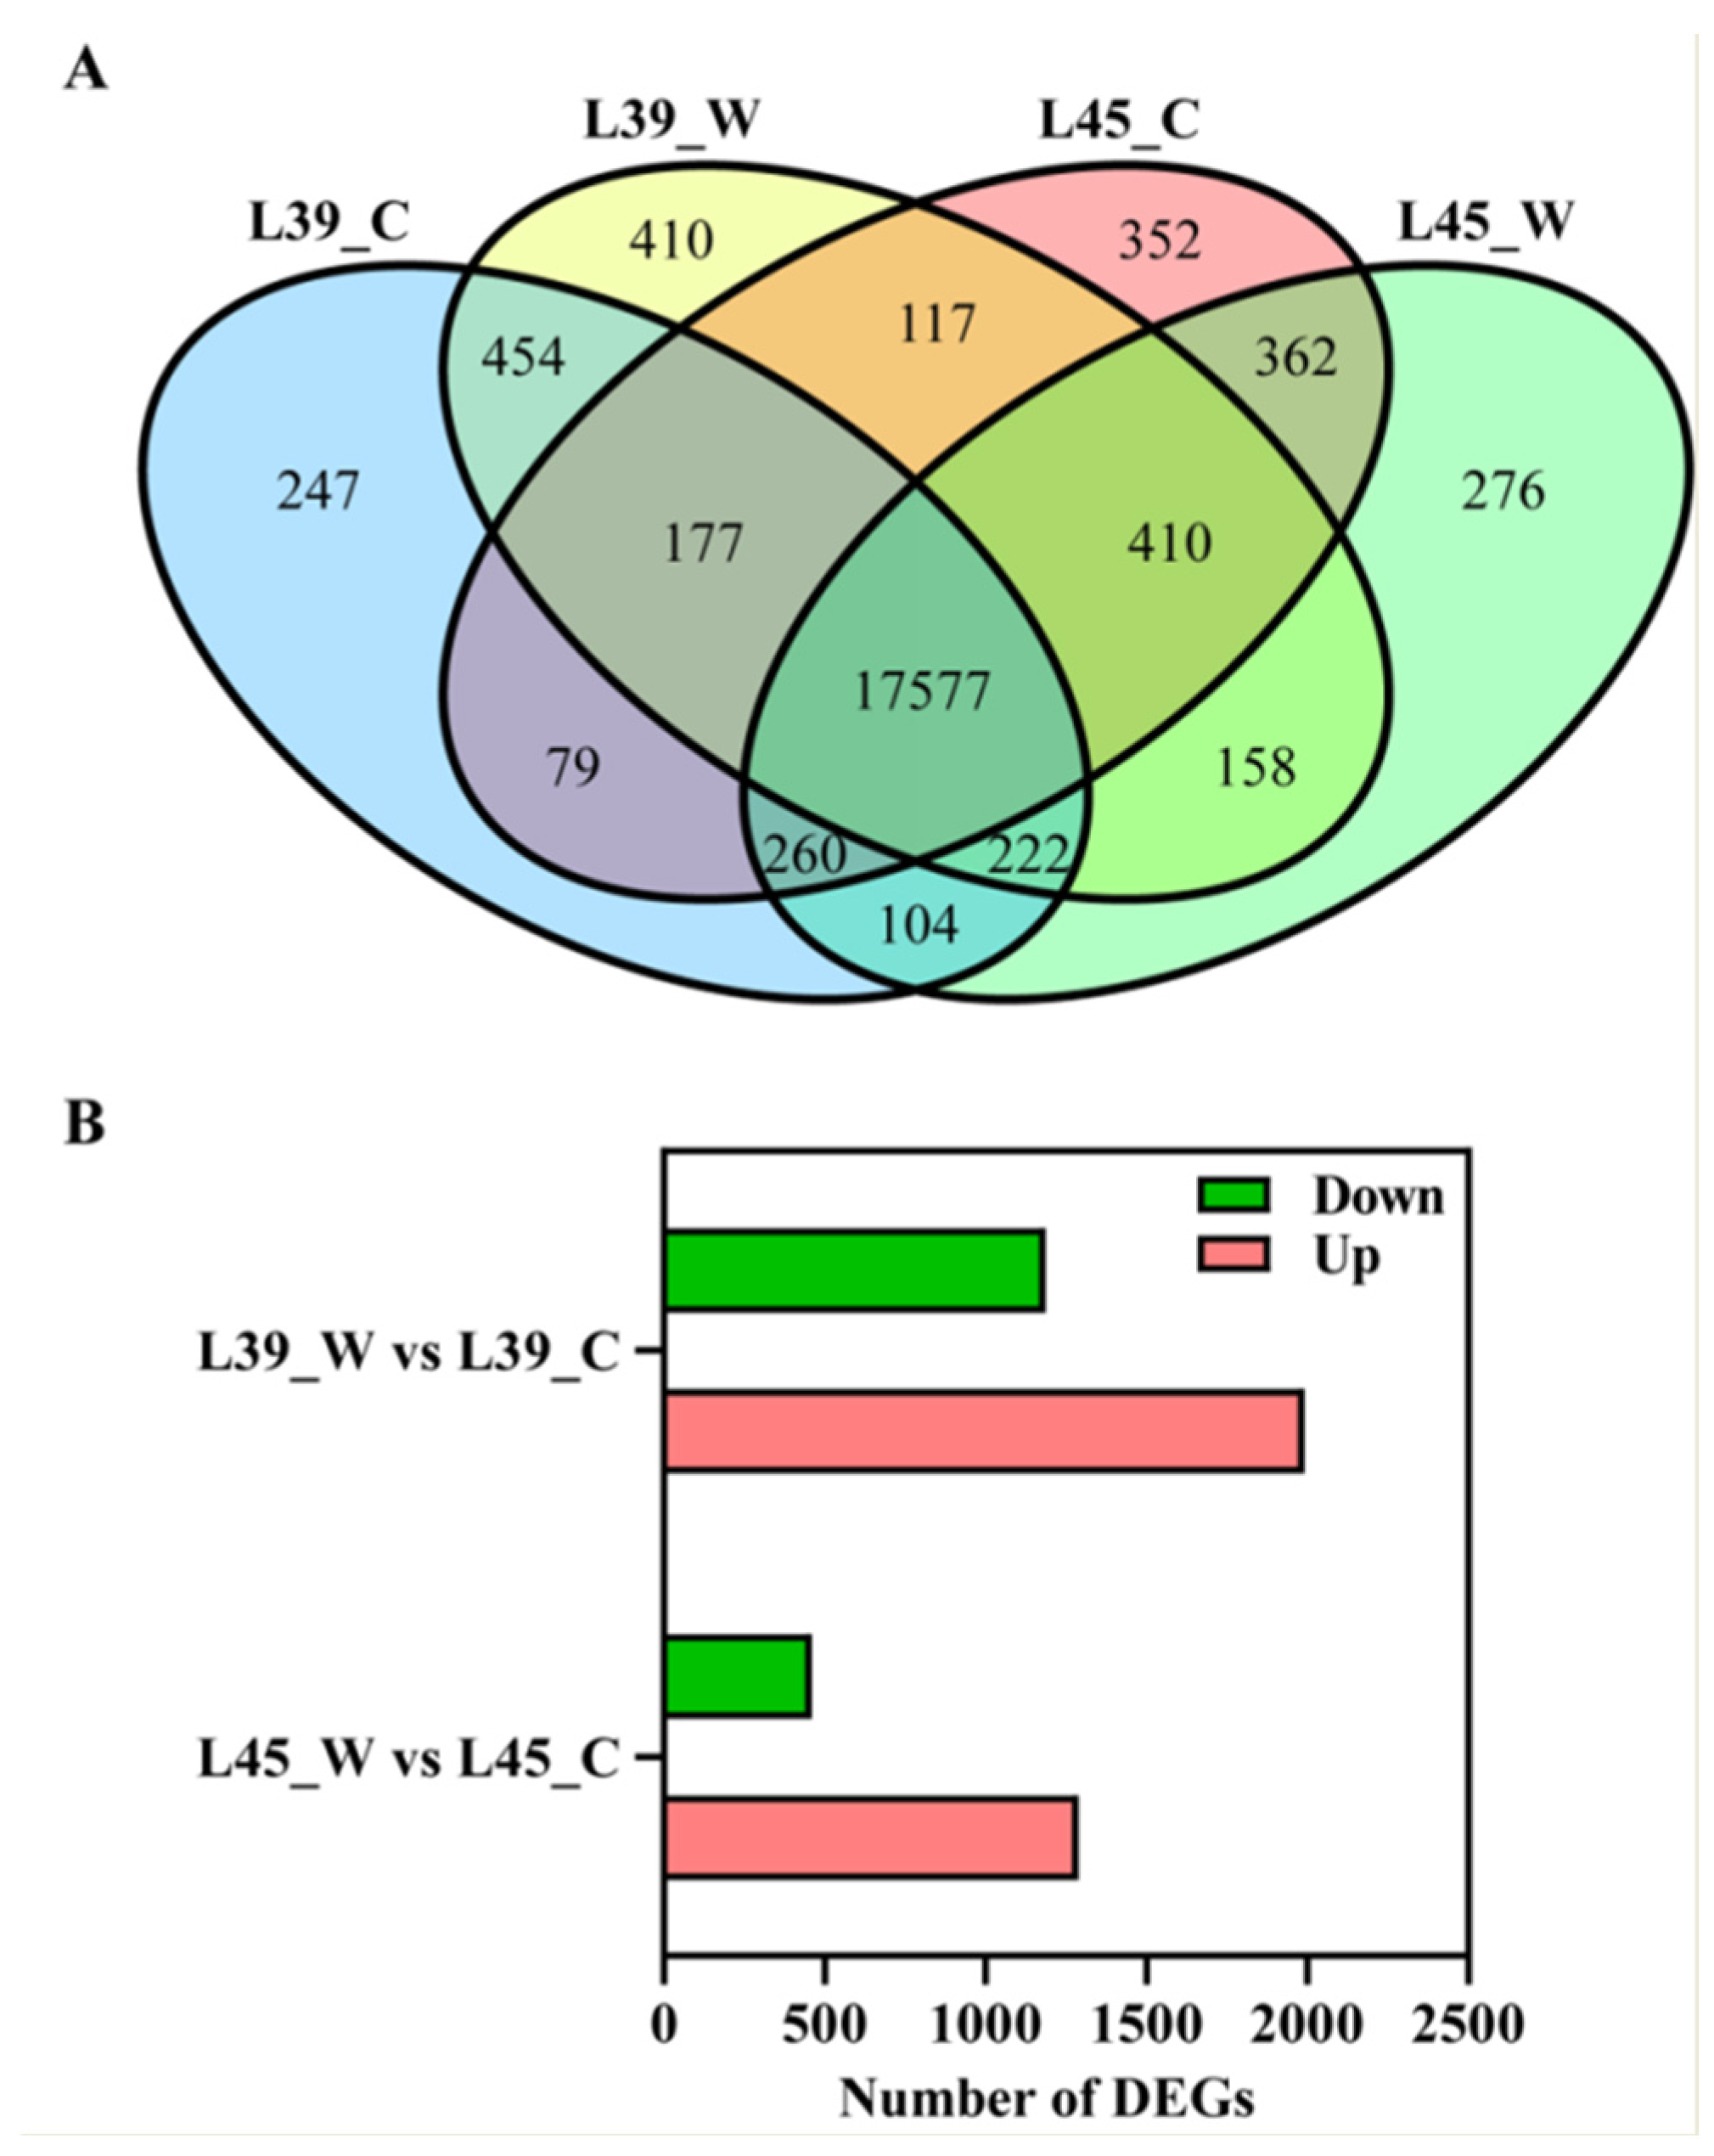
The transcription level of each gene was calculated as FPKM after mapping the clean reads to the melon reference genome. The results showed that 19,334, 19,369, 19,120, and 19,525 genes were expressed in L45_C, L45_W, L39_C, and L39_W, respectively. A total of 21,205 genes were expressed, among which 17,577 genes were shared in different samples (Figure 4A). The common set of genes was enriched in 224 GO terms, among which 28 were associated with a cellular component, 69 were relevant to molecular function, and 127 were related to biological processes (Table S2). In the category of cellular components, the top five enriched GO terms were intracellular (GO:0005622), cell (GO:0005623), intracellular part (GO:0044424), cell part (GO:0044464) and intracellular organelle (GO:0043229). In the category of molecular function, the top five enriched GO terms were RNA binding (GO:0003723), purine ribonucleoside triphosphate binding (GO:0035639), small molecule binding (GO:0036094), carbohydrate derivative binding (GO:0097367) and nucleotide binding (GO:0000166). In the category of biological processes, the top five enriched GO terms were cellular process (GO:0009987), cellular metabolic process (GO:0044237), cellular macromolecule metabolic process (GO:0044260), macromolecule modification (GO:0043412), and cellular protein metabolic process (GO:0044267) (Table S2).

3.3. Identification and Functional Classification of DEGs

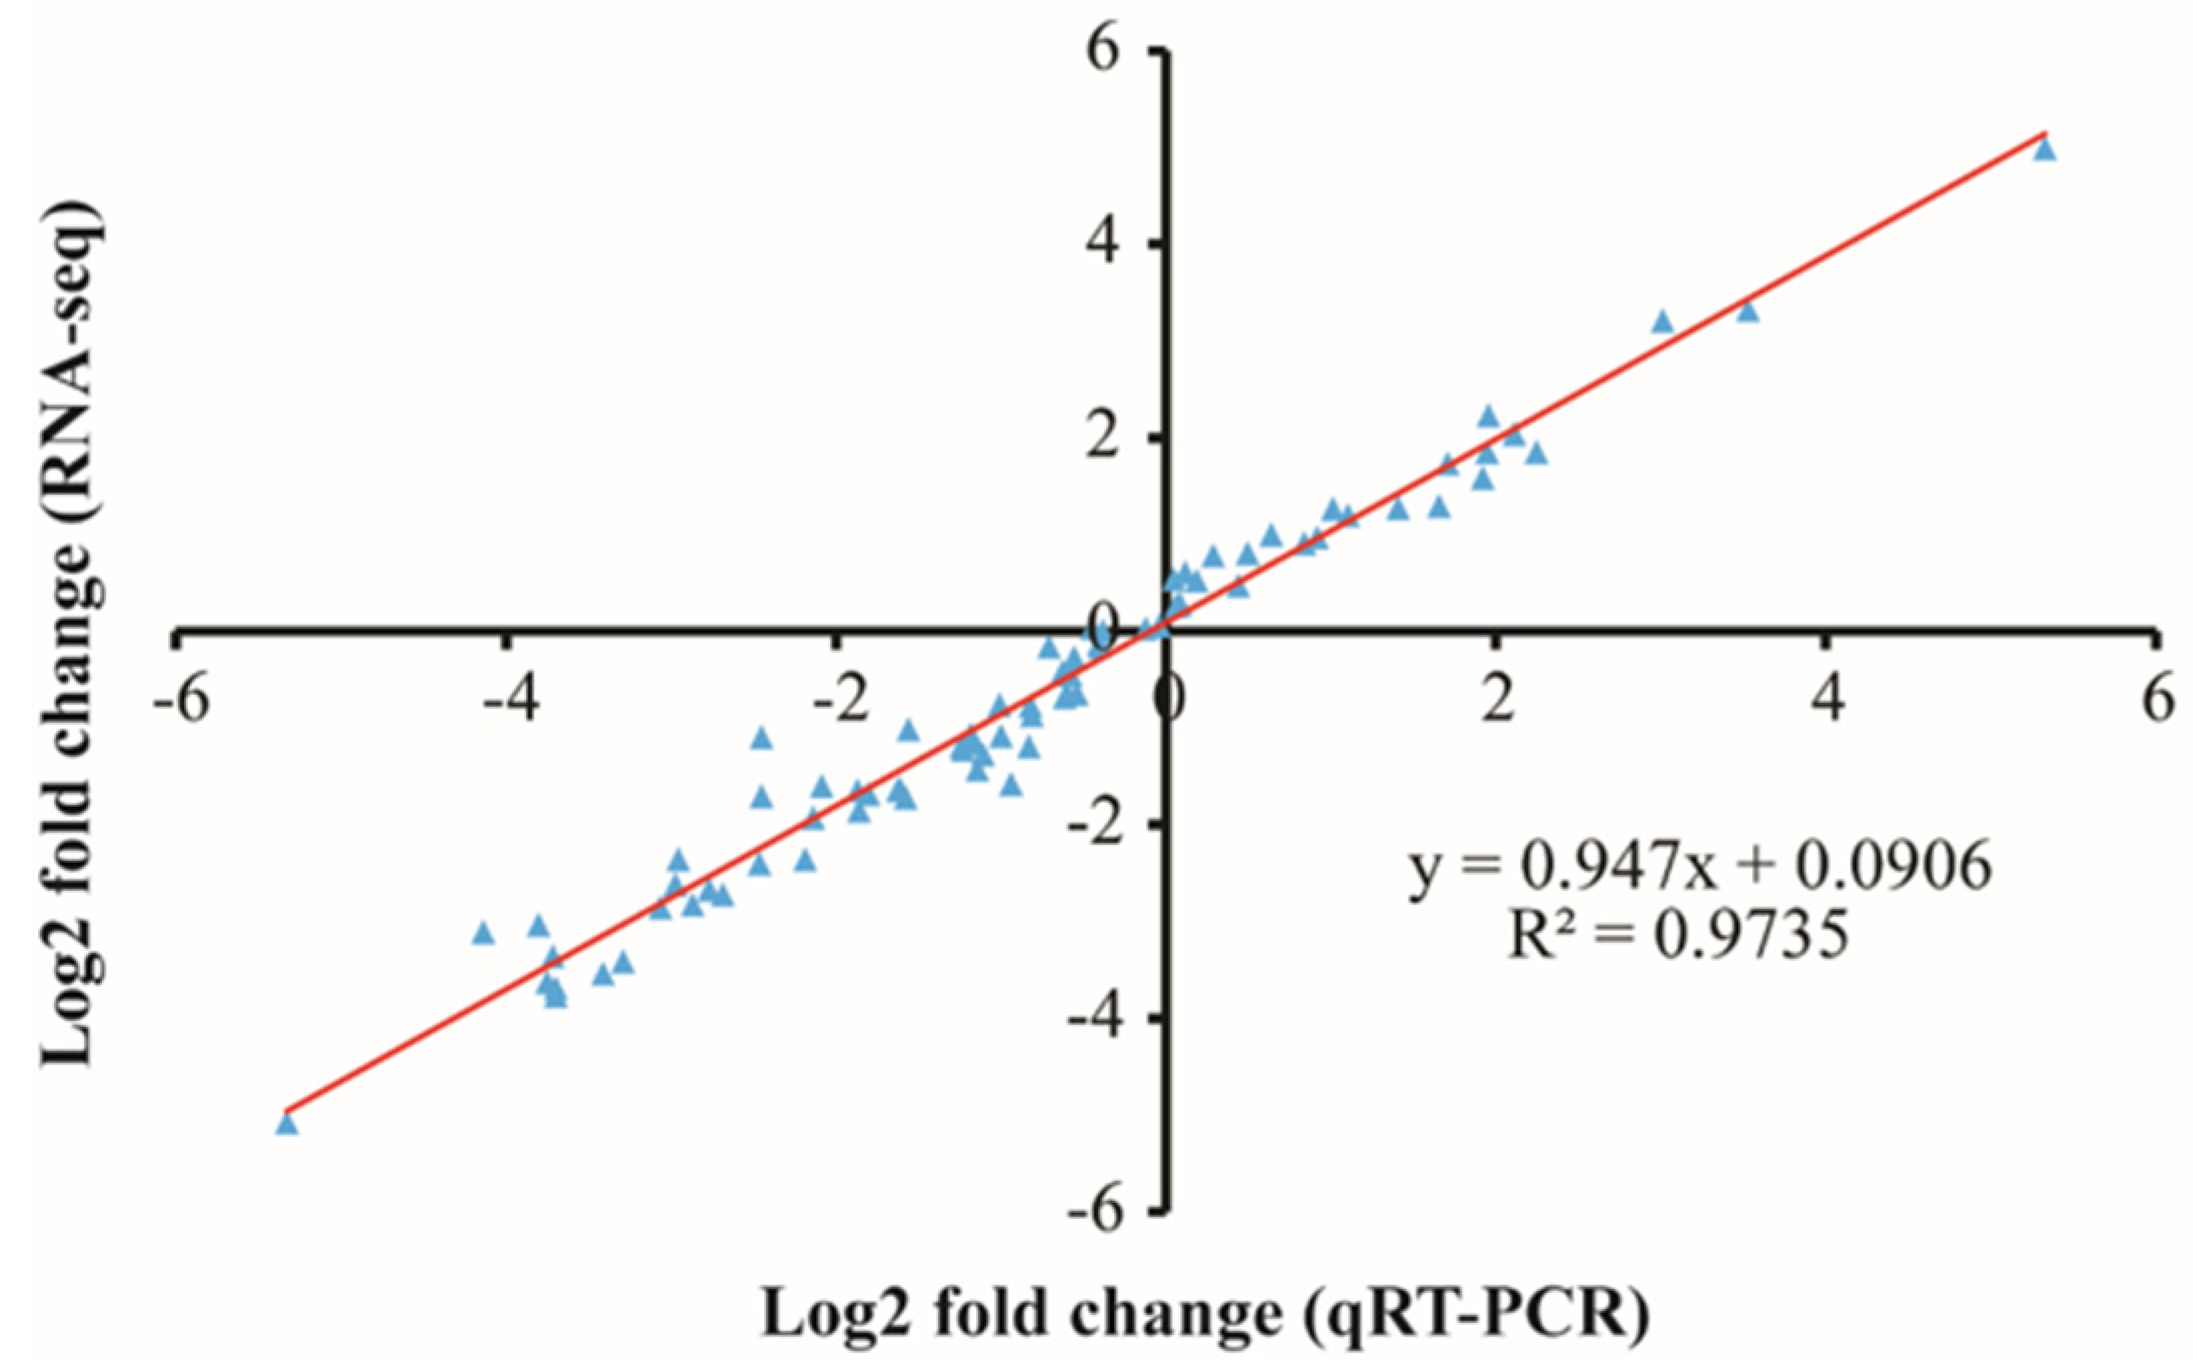
In the waterlogging-tolerant accession ‘L45’, under waterlogging stress, 1748 genes were differentially expressed compared with control plants, including 1289 up-regulated and 459 down-regulated genes. In the case of the waterlogging-sensitive accession ‘L39’, 3178 (1991 up-regulated and 1187 down-regulated) genes were differentially expressed compared with control (Figure 4B). Next, to validate the results of the RNA-seq, 26 DEGs were selected randomly and subjected to qRT-PCR analysis. As shown in Figure 5, a strong positive correlation (two tailed, R2 = 0.9735) was observed between the RNA-seq and qRT-PCR results, which indicated the credibility of RNA-seq results.
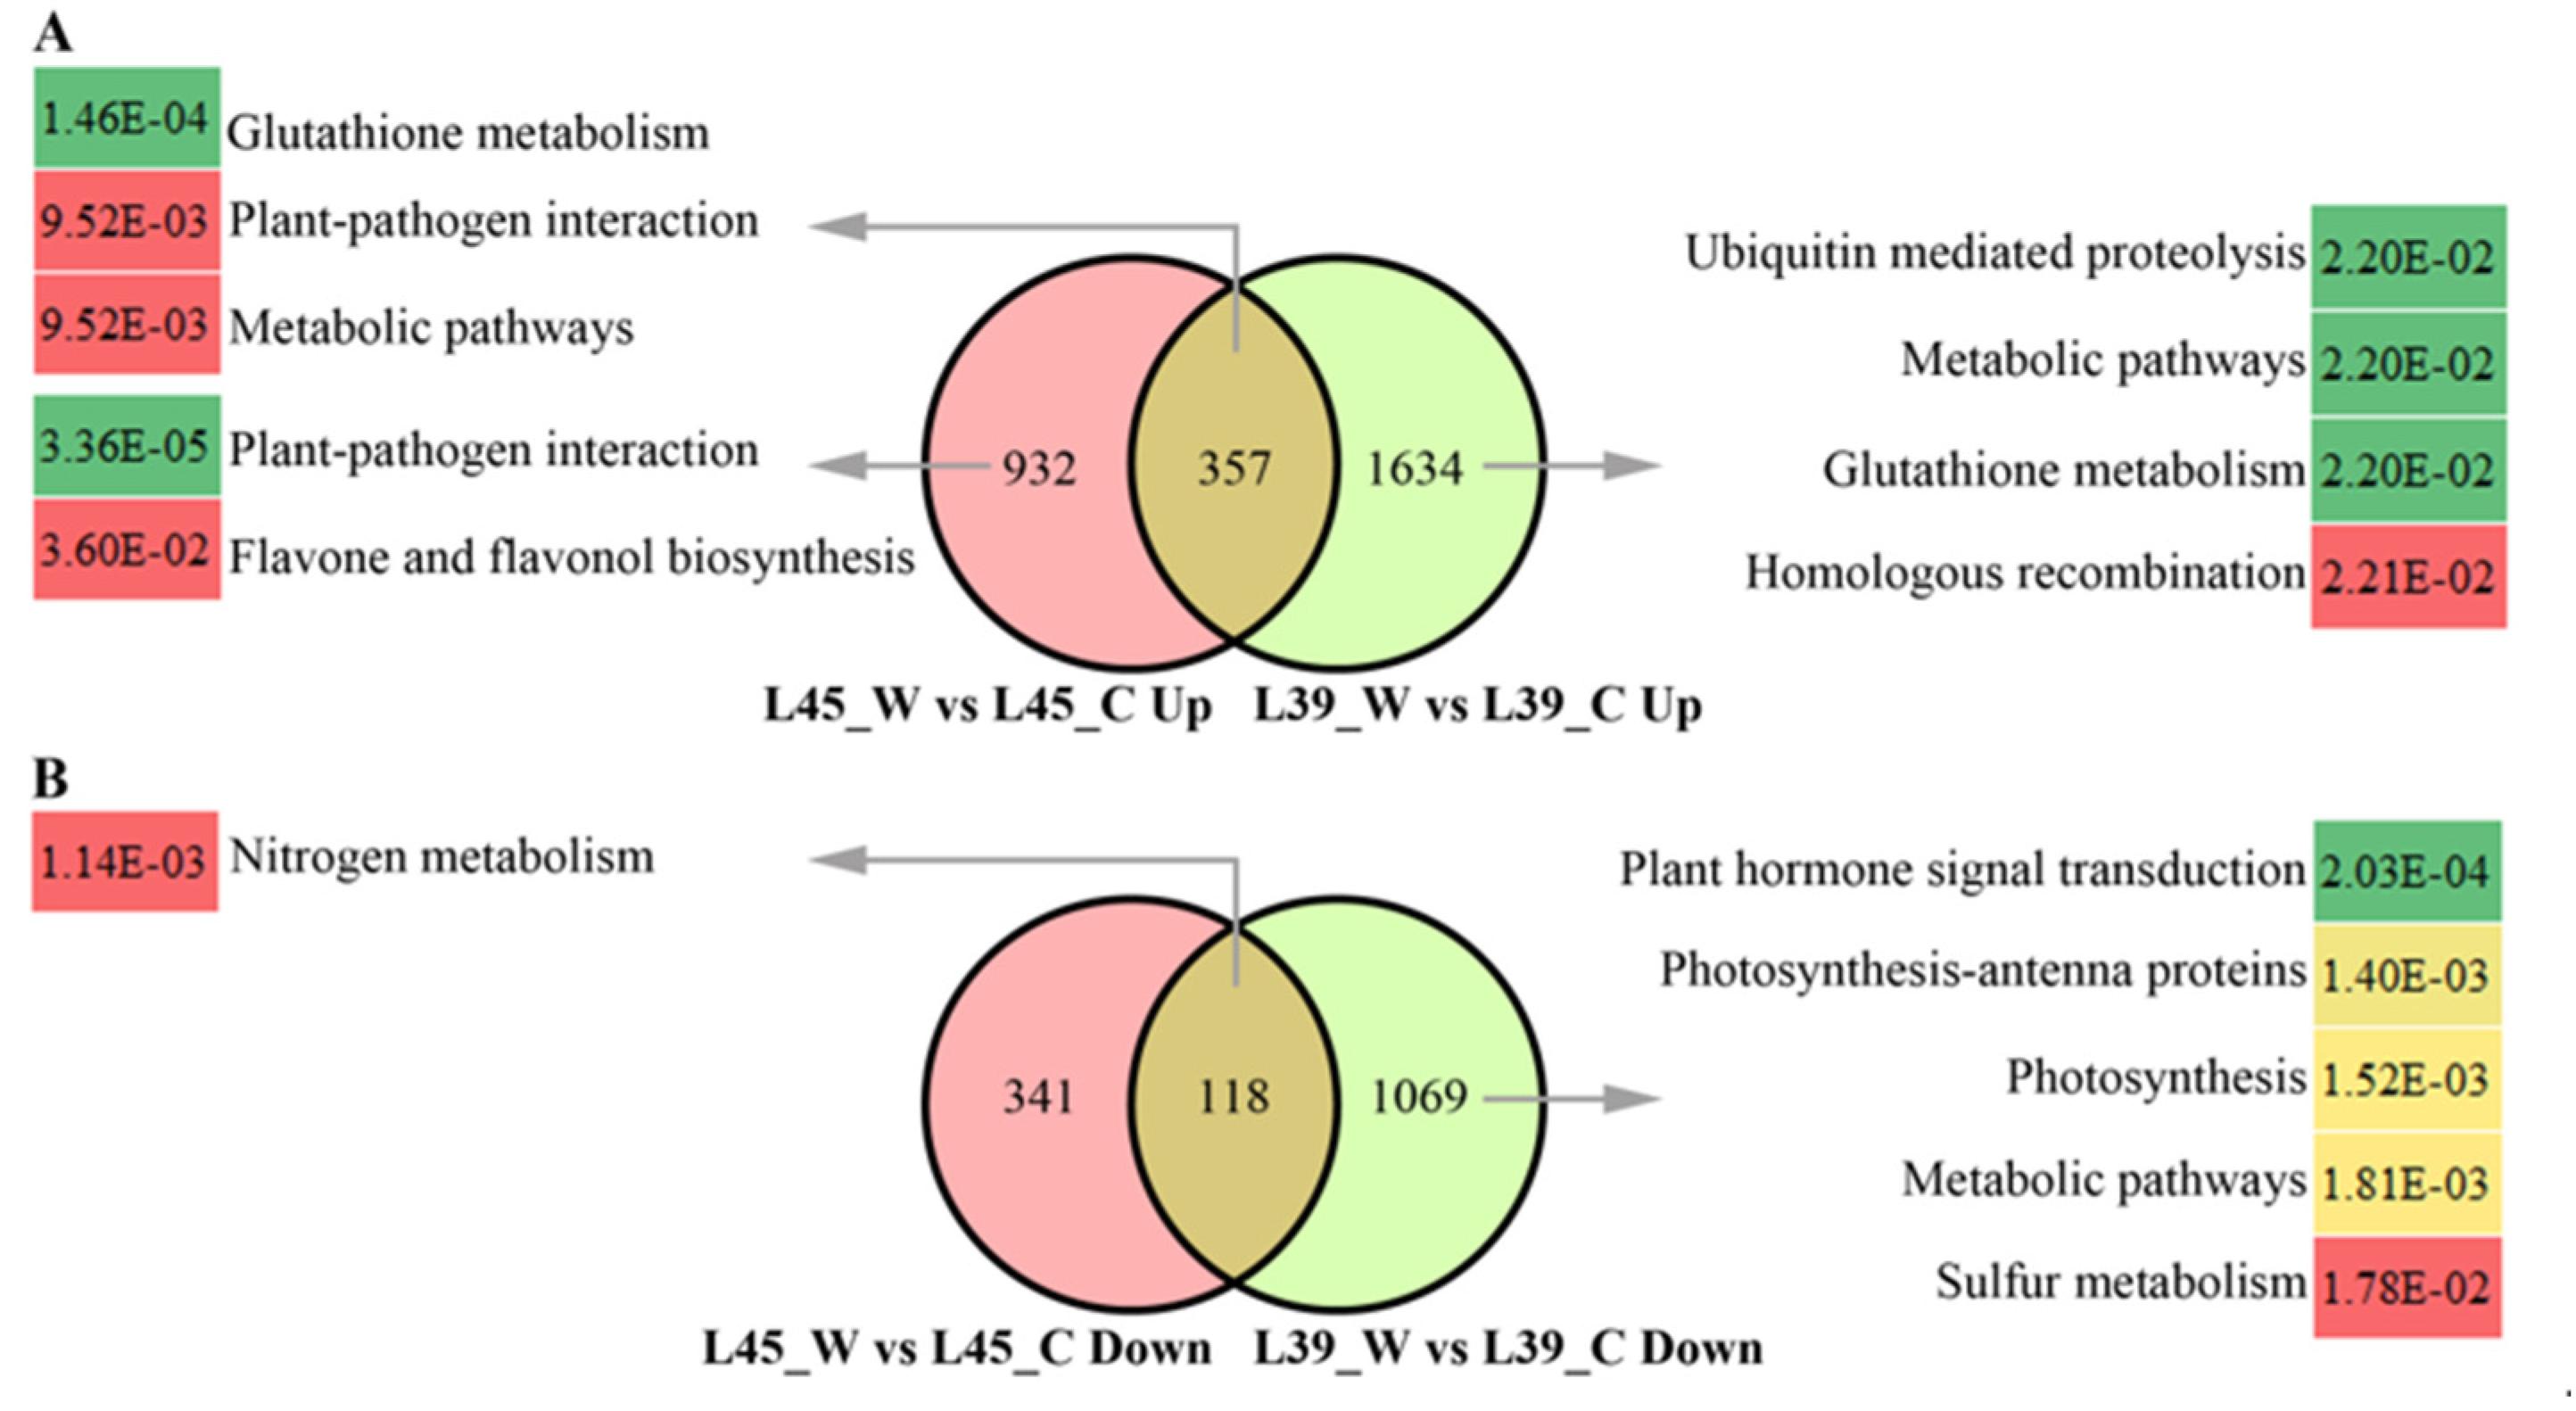
Venn diagrams of the DEGs mentioned above were constructed. In the comparison between waterlogging stress and control conditions, 357 up-regulated DEGs were common to both accessions, and the pathways of ‘glutathione metabolism’, ‘plant-pathogen interaction’, and ‘metabolic pathways’ (Figure 6A) were highly enriched in these DEGs. The waterlogging-sensitive accession ‘L39’ possessed a higher number of uniquely up-regulated DEGs (1634 genes) when compared to the waterlogging-tolerant accession, ‘L45’ (932 genes). Pathways of ‘ubiquitin mediated proteolysis’, ‘metabolic pathways’, ‘glutathione metabolism’, and ‘homologous recombination’ were highly enriched in the 1634 DEGs of ‘L39’, whereas ‘plant-pathogen interaction’ and ‘flavone and flavonol biosynthesis’ were highly enriched in the 932 DEGs of ‘L45’ (Figure 6A). Among the down-regulated DEGs, 118 DEGs were common to both accessions, and the pathways of ‘nitrogen metabolism’ were highly enriched (Figure 6B). A total of 341 DEGs were specific to ‘L45’. In ‘L39’, 1069 DEGs were uniquely down-regulated; these were highly enriched in the pathways of ‘plant hormone signal transduction’, ‘photosynthesis-antenna proteins’, ‘photosynthesis’, ‘metabolic pathways’, and ‘sulfur metabolism’ (Figure 6B).

3.4. Analysis of DEGs Related to Chlorophyll Metabolism and Photosynthesis

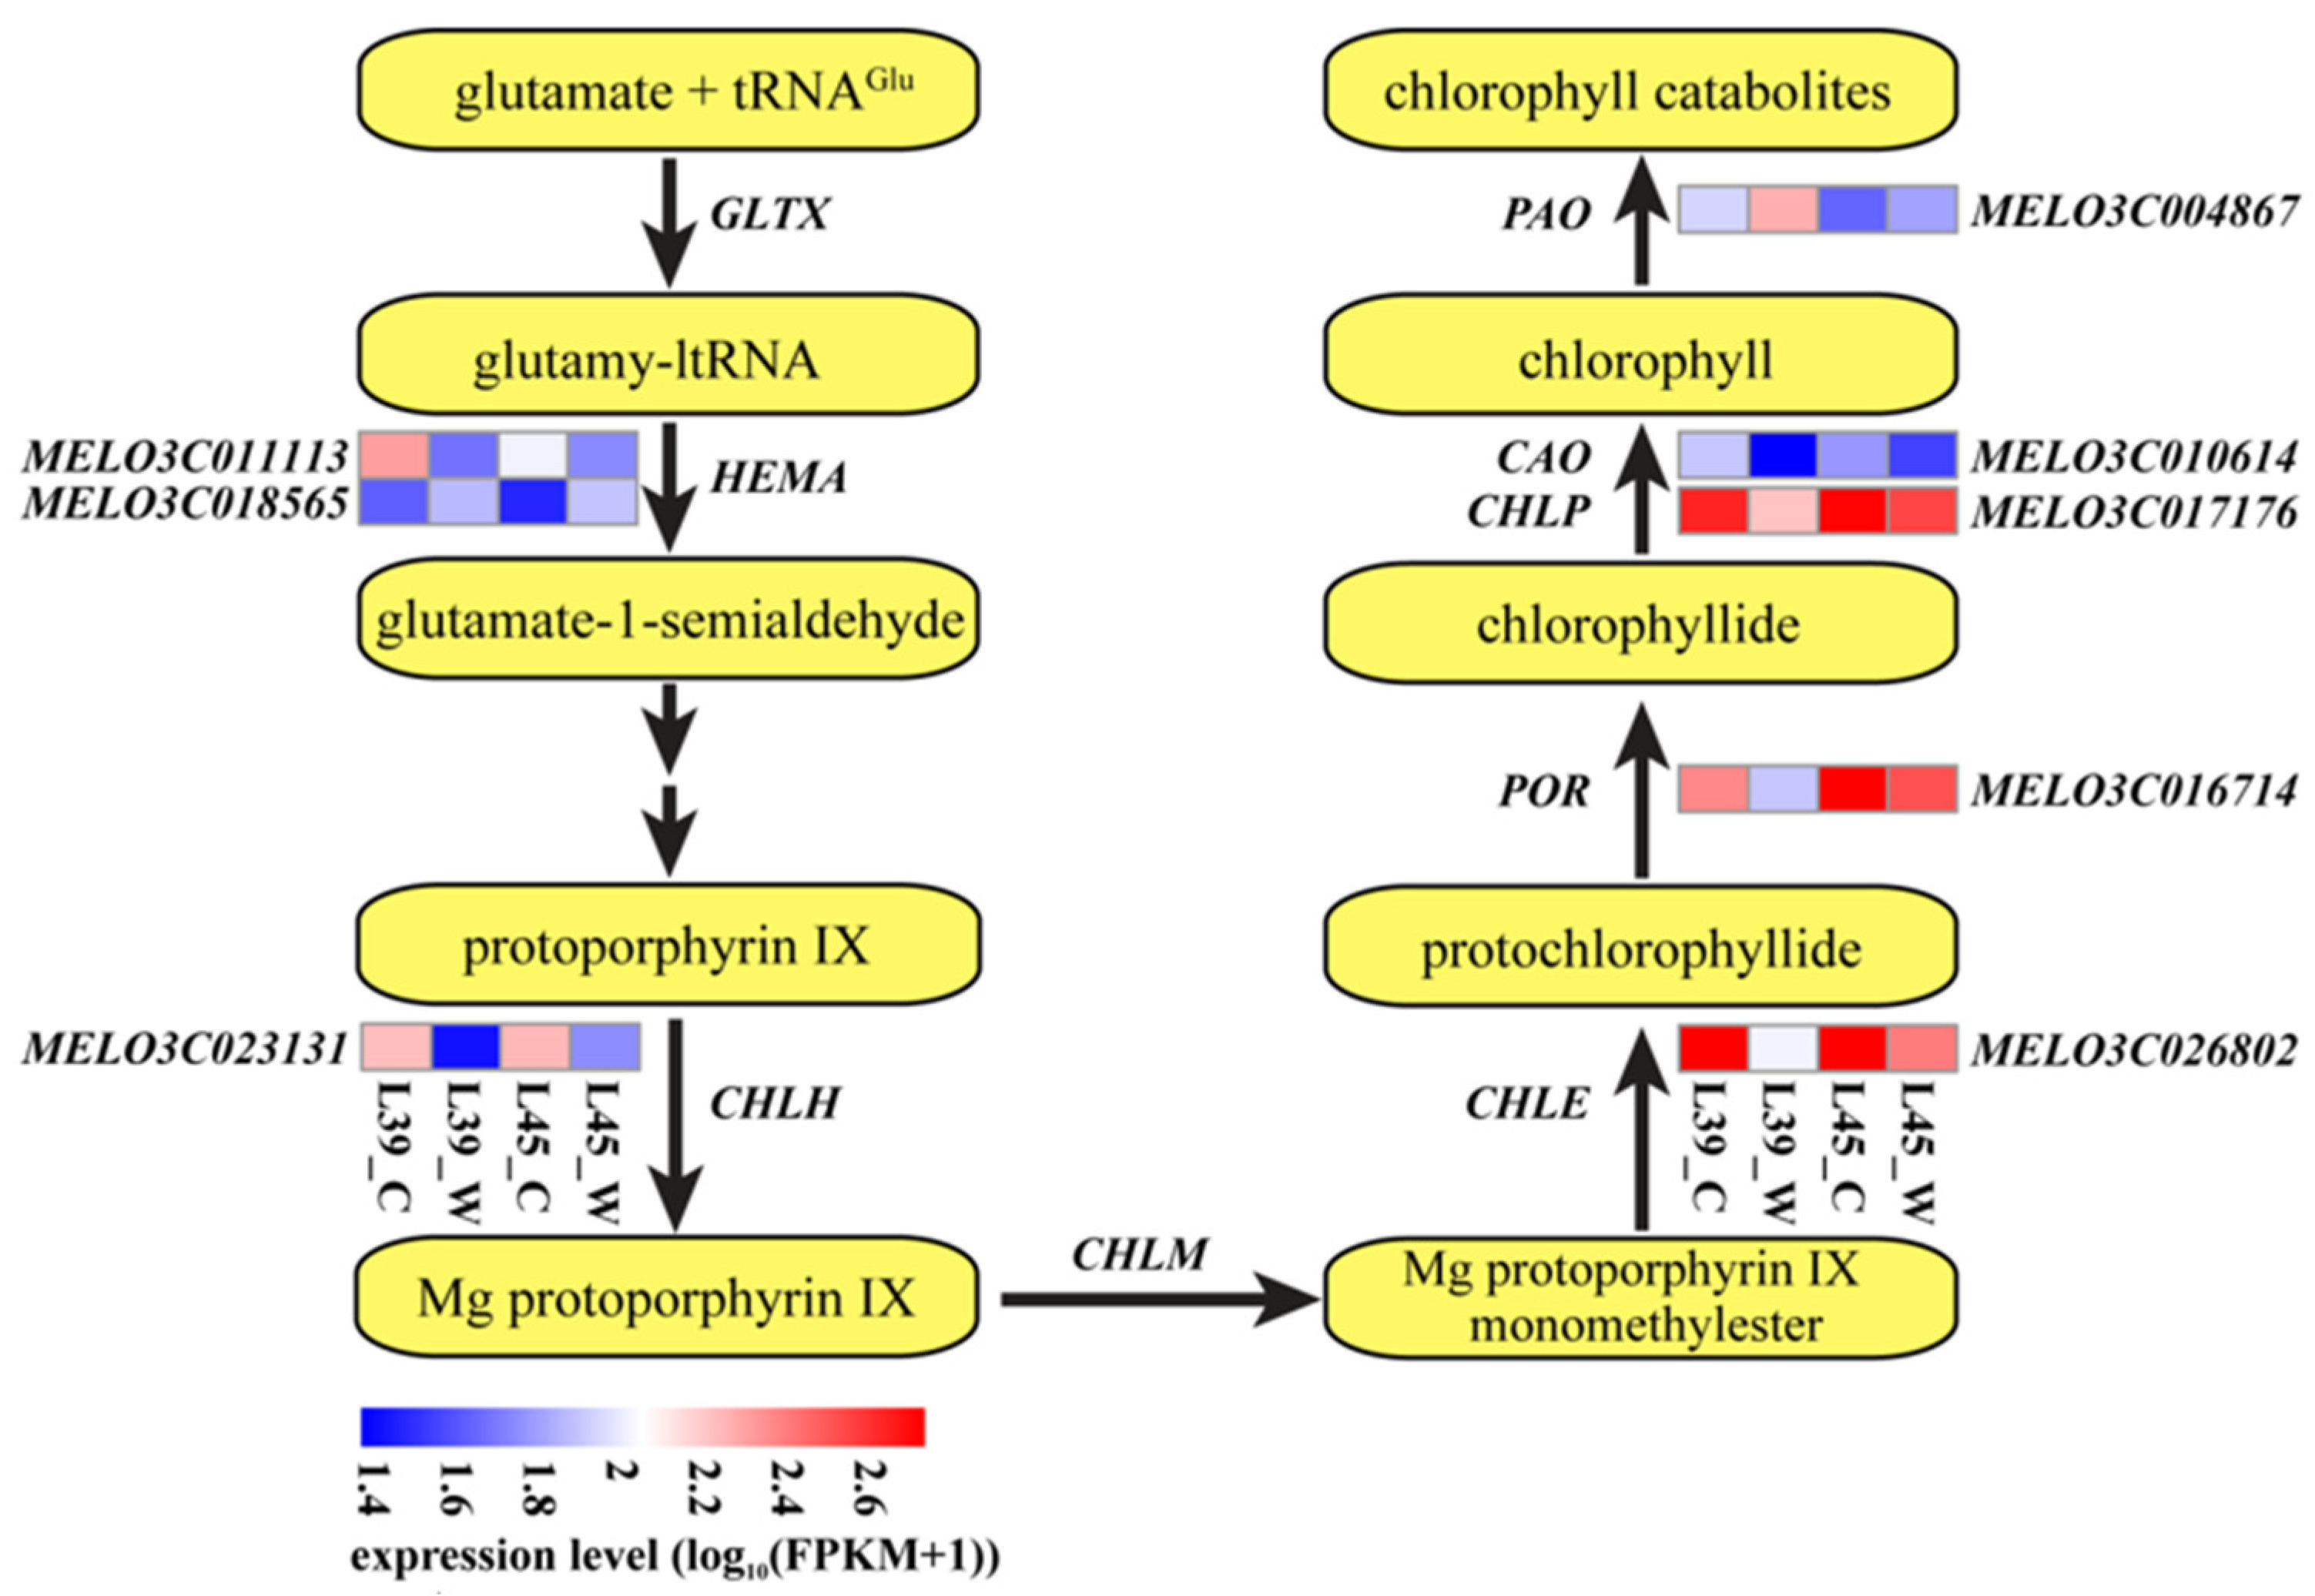
The chlorophyll metabolic pathway consists of chlorophyll a synthesis from glutamate, the interconversion of chlorophyll a and chlorophyll b, and chlorophyll degradation. In ‘L39’, five genes involved in chlorophyll a synthesis were significantly down-regulated in waterlogged leaves compared with control, including glutamyl-tRNA reductase (MELO3C011113), magnesium-chelatase subunit H (MELO3C023131), magnesium-protoporphyrin IX monomethylester oxidative cyclase (MELO3C026802), protochlorophyllide oxidoreductase (MELO3C016714) and geranylgeranyl reductase (MELO3C017176). The expression of MELO3C023131 in ‘L39’ was down-regulated 6.58-fold under waterlogging stress, compared with that under control conditions (Figure 7). In L45_W vs L45_C, MELO3C023131 and MELO3C026802 were down-regulated, whereas MELO3C018565 was up-regulated (Figure 7). Chlorophyllide a oxygenase (CAO) catalyzes the interconversion of chlorophyll a and chlorophyll b. The expression of the CAO encoding gene MELO3C010614 was significantly down-regulated in L39_W vs L39_C; however, there was no significant change in L45_W vs. L45_C (Figure 7). In addition, the expression of the pheophorbide a oxygenase (PAO) encoding gene MELO3C004867, involved in chlorophyll degradation, was up-regulated in L39_W vs L39_C but not significantly up-regulated in L45_W vs L45_C (Figure 7). In the photosynthesis pathway, numerous genes were down-regulated in ‘L39’ under waterlogging stress compared with control, including eight photosystem I, nine photosystem II, one cytochrome b6/f complex, two ferredoxin, one plastocyanin, twelve chlorophyll a-b binding proteins and three oxygen-evolving enhancer protein encoding genes, while in ‘L45’, seven photosystem I, six photosystem II and four chlorophyll a-b binding protein-encoding genes were down-regulated (Table S3 in the Supplementary Materials).

3.5. Analysis of DEGs Related to Energy Generation

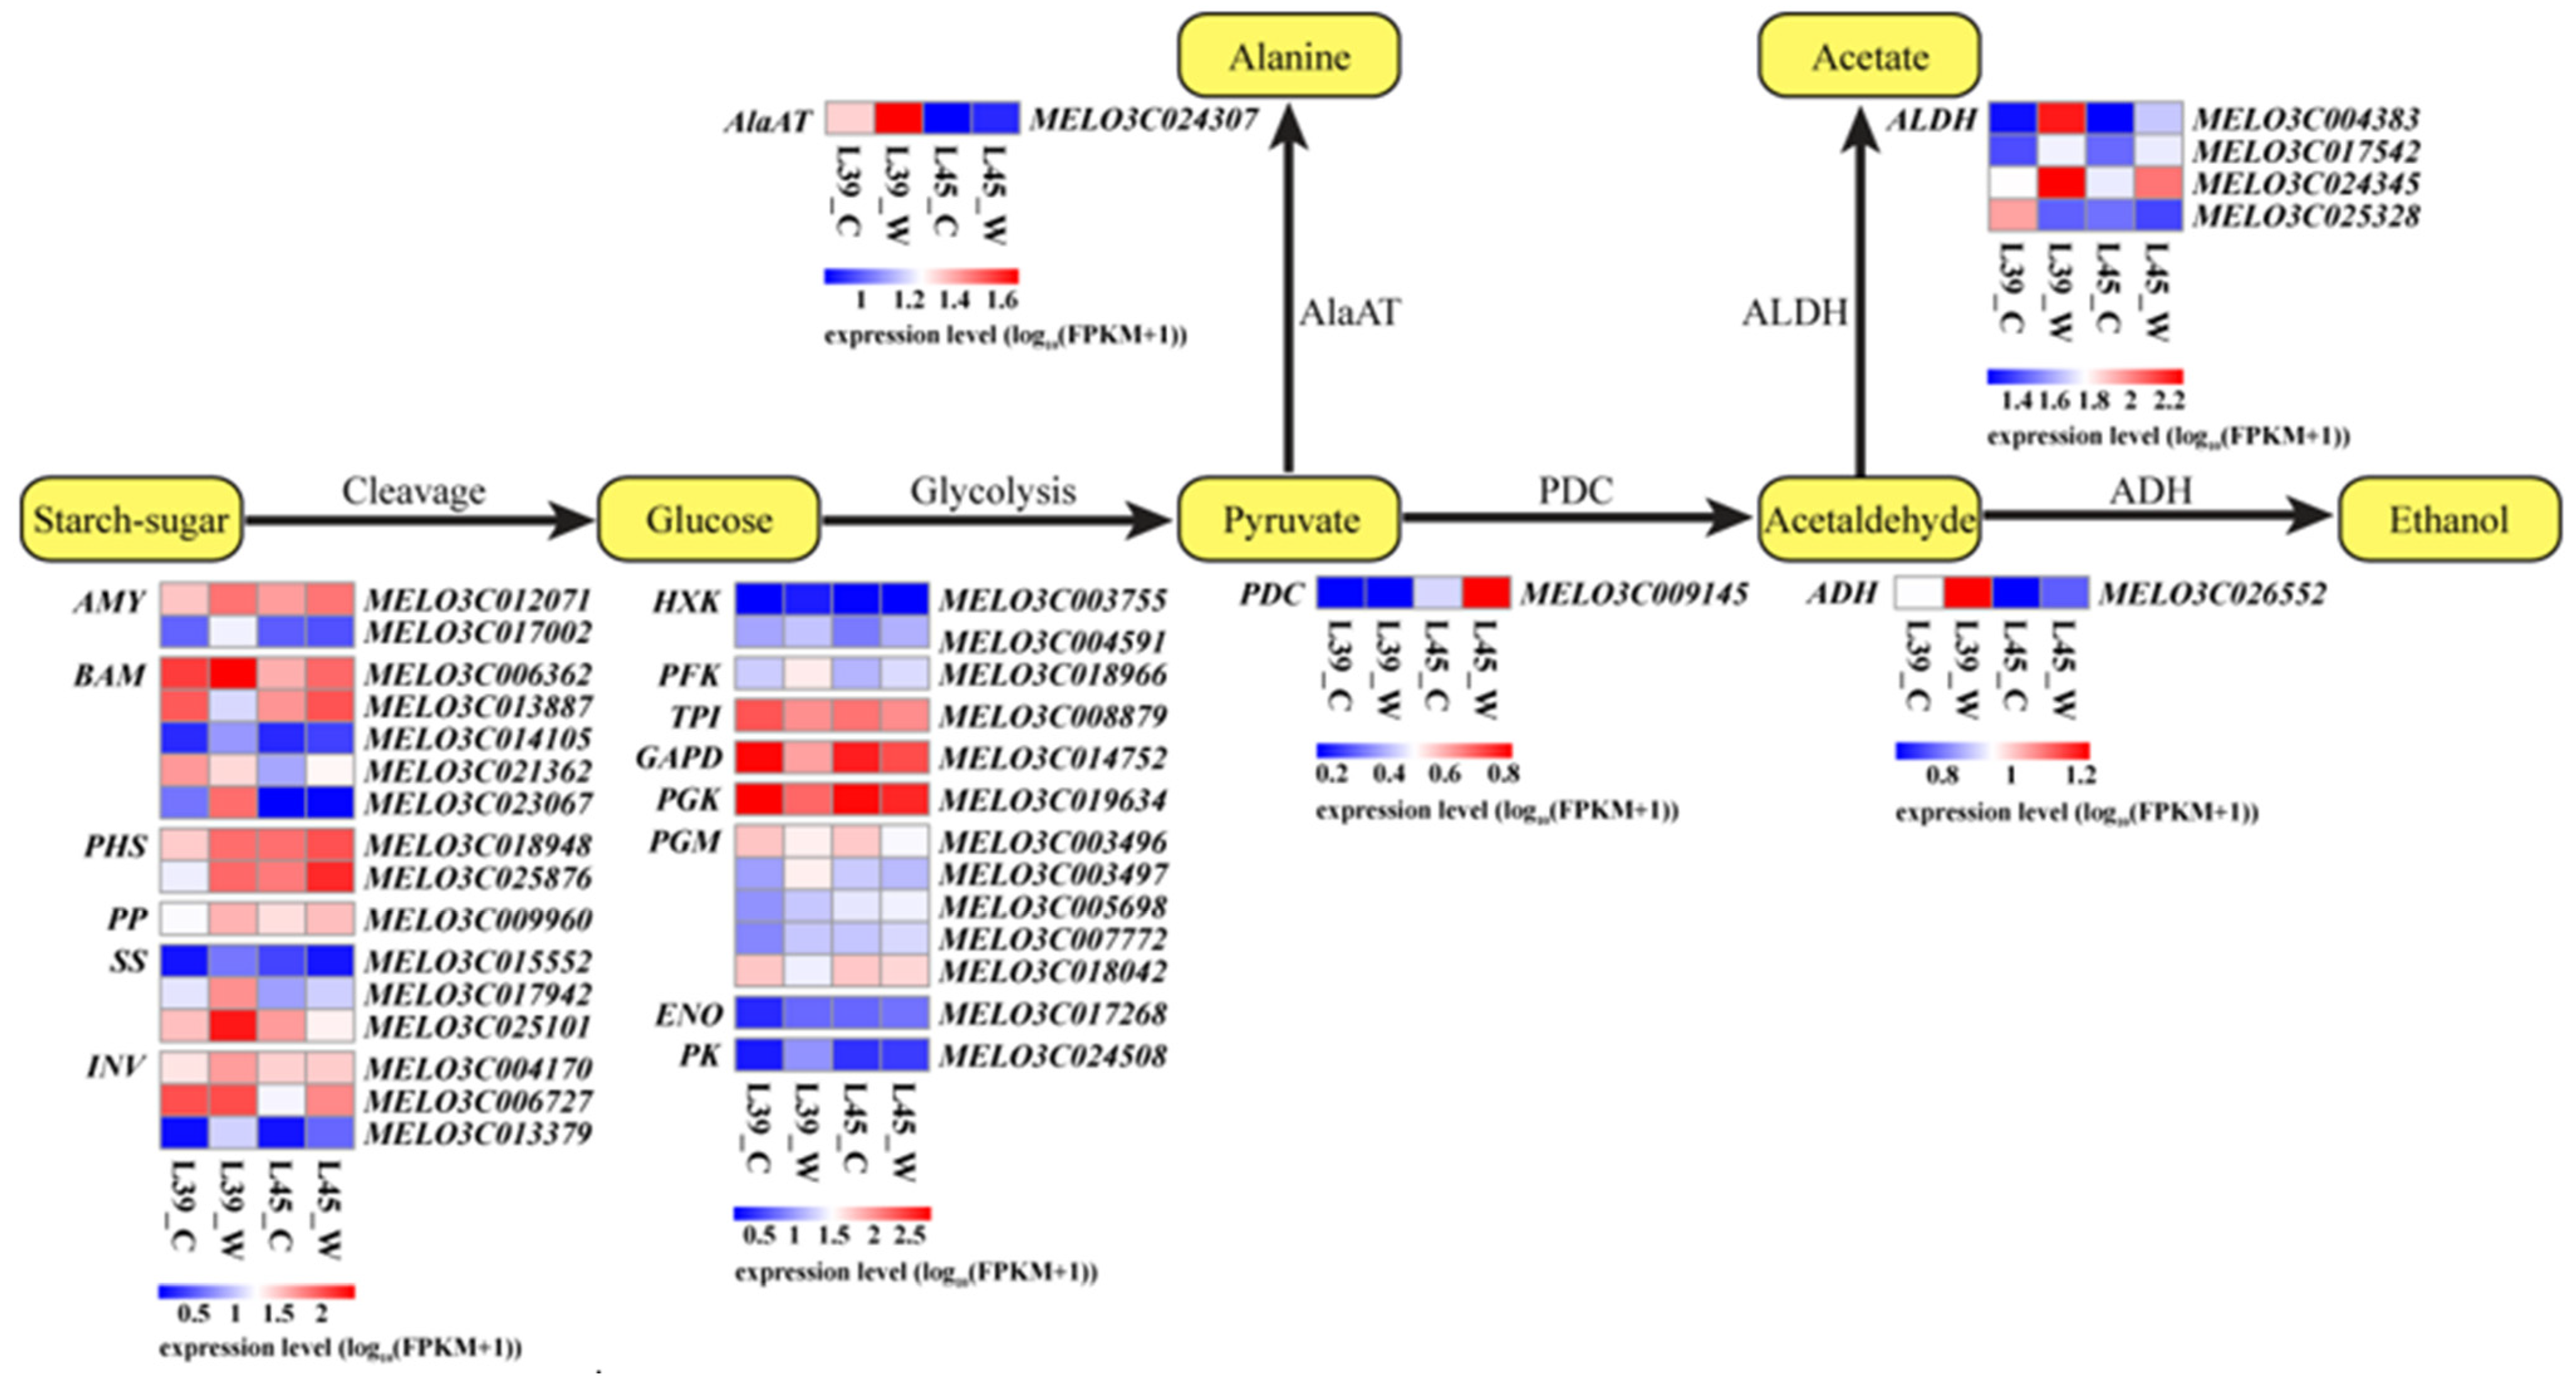
The changes in the expression of starch and sugar cleavage, glycolysis, and fermentation-related genes were examined in this study (Figure 8). One of the most significant changes upon waterlogging stress was the up-regulation of 12 starch and sugar cleavage-related genes in ‘L39’, but only five were up-regulated in ‘L45’. Among these genes, α-amylase (MELO3C012071 and MELO3C017002), β-amylase (MELO3C014105 and MELO3C023067), α-glucan phosphorylase (MELO3C018948), phosphoglucan phosphatase (MELO3C009960), sucrose synthase (MELO3C015552, MELO3C017942 and MELO3C025101) and invertase (MELO3C004170) were uniquely up-regulated in ‘L39’, whereas β-amylase (MELO3C006362 and MELO3C021362) and invertase (MELO3C006727) were specifically up-regulated in ‘L45’. The expression of α-glucan phosphorylase (MELO3C025876) and invertase (MELO3C013379) were commonly up-regulated in both accessions; however, the up-regulation multiples in ‘L39’ were higher than in ‘L45’, among which MELO3C013379 was up-regulated 21.03-fold in ‘L39’ but 4.53-fold in ‘L45’. In addition, we found that seven genes involved in glycolysis significantly and specifically accumulated in ‘L39’, including hexokinase (MELO3C003755), phosphofructokinase (MELO3C018966), phosphoglycerate mutase (MELO3C003497, MELO3C005698 and MELO3C007772), enolase (MELO3C017268), and pyruvate kinase (MELO3C024508), among which MELO3C024508 was up-regulated 7.75-fold compared with the control. Interestingly, only one gene (MELO3C004591) encoding hexokinase was significantly induced in ‘L45’ (Figure 8).
Fermentation converts the pyruvate produced by glycolysis into other metabolites, such as alanine, acetate, and ethanol. Alanine aminotransferase (AlaAT), pyruvate decarboxylase (PDC), aldehyde dehydrogenase (ALDH), and alcohol dehydrogenase (ADH) are enzymes that participate in fermentation (Figure 8). In the present study, we found that the PDC-encoding gene MELO3C009145 was significantly and specifically induced after waterlogging in ‘L45’ but not in ‘L39’, whereas the AlaAT encoding gene MELO3C024307, ALDH encoding gene MELO3C017542, and ADH encoding gene MELO3C026552 were uniquely induced in ‘L39’ but not in ‘L45’ (Figure 8). Two genes (MELO3C004383 and MELO3C024345) that encoded ALDH were commonly up-regulated in both accessions; however, they were more strongly induced in ‘L39’, among which MELO3C004383 was up-regulated 9.24- and 2.63-fold in ‘L39’ and ‘L45’, respectively (Figure 8).

3.6. Analysis of DEGs Related to Reactive Oxygen Species Scavenging

The generation and quenching of reactive oxygen species (ROS) are one of the most central responses to waterlogging stress in plants. In our data, four ROS-generating genes, RBohC (MELO3C000378, MELO3C015312, MELO3C025712, and MELO3C029753) were significantly induced in ‘L39’ upon waterlogging stress, whereas only one RBohC gene (MELO3C026754) was up-regulated in ‘L45’. Interestingly, the transcript level of the RBohC gene MELO3C016333 was significantly repressed in ‘L45’ upon waterlogging stress (Table S4). Antioxidant enzymes have evolved to alleviate the side effects of ROS in plants. The transcripts of one superoxide dismutase (SOD) gene, four peroxidase (POD) genes, one monodehydroascorbate reductase gene and one catalase (CAT) gene accumulated significantly in ‘L39’ upon waterlogging stress, while five POD genes, one monodehydroascorbate reductase gene, and one polyphenol oxidase (PPO) gene were induced in ‘L45’ (Table S4).

3.7. Analysis of DEGs Related to Hormone Metabolism

Ethylene is a primary hormone controlling the waterlogging response in plants. S-adenosylmethionine (SAM), the precursor of ethylene biosynthesis, is formed by methionine and ATP, catalyzed by SAM synthase (SAMS). In this study, the gene that encoded SAMS, MELO3C012911, was significantly up-regulated in ‘L39’ but not in ‘L45’ (Table S5). The first step of ethylene biosynthesis involves 1-aminocyclopropane-1-carboxylic acid (ACC) synthase (ACS), which converts the SAM into ACC, while the second step is catalyzed by ACC oxidase (ACO) converting ACC to ethylene. We found that one ACS-encoding gene, MELO3C016340, was accumulated in both ‘L39’ and ‘L45’, while another gene, MELO3C021182, was uniquely induced in ‘L39’, which was up-regulated 17.75-fold under waterlogging stress compared with control. MELO3C010508, which encodes ACO, was uniquely accumulated in ‘L39’, while MELO3C014437 was uniquely induced in ‘L45’ upon waterlogging stress (Table S5).
Abscisic acid (ABA), salicylic acid (SA), and jasmonic acid (JA) are involved in the plant’s response to various abiotic or biotic stresses. Our data showed that the transcript levels of two genes (MELO3C023086 and MELO3C027057) that encoded 9-cis-epoxycarotenoid dioxygenase (NCED), which is one of the rate-limiting enzymes in ABA biosynthesis, increased significantly and uniquely in ‘L39’, whereas one NCED gene was down-regulated in ‘L45’ under waterlogging stress. Additionally, an ABA 8′-hydroxylase gene (MELO3C018449), which is involved in ABA inactivation, was down-regulated 5.19-fold in ‘L39’ but was not significantly regulated in ‘L45’. In the ABA signal transduction pathway, five ABA receptor PYL-encoding genes were significantly down-regulated upon waterlogging stress in ‘L39’, while two PYL encoding genes were down-regulated in ‘L45’, among which MELO3C008314 was commonly regulated in the two accessions. The transcript level of one ABF-encoding gene (MELO3C018458) was uniquely induced in ‘L39’ (Table S5). These results revealed that the waterlogging response of ABA is up-regulated in ‘L39’. Phenylalanine ammonia-lyase (PAL) is one of the key enzymes in SA biosynthesis. In our data, the transcript levels of nine and five PAL genes increased significantly in ‘L39’ and ‘L45’, respectively, among which, four PAL genes were commonly up-regulated. In the SA signal transduction pathway, two NPR genes (MELO3C016187 and MELO3C021795) were uniquely induced in ‘L45’, while one NPR gene (MELO3C009778) was uniquely repressed in ‘L39’. The transcript level of MELO3C018539, encoding the pathogenesis-related protein, was up-regulated in both ‘L39’ and ‘L45’ (Table S5). In the process of JA biosynthesis, numerous DEGs were identified in both accessions upon waterlogging stress, including phospholipase A, lipoxygenase, allene oxide synthase, allene oxide cyclase, 12-oxo-phytodienoic acid reductase, acyl-activating enzyme, acyl-CoA oxidase, and multi-functional protein- and 3-keto-acyl-CoA thiolase-encoding genes (Table S5). We found that 13 genes that participated in JA biosynthesis were induced and 10 genes were repressed in ‘L39’, whereas 15 genes involved in JA biosynthesis were up-regulated and one gene was down-regulated in ‘L45’. In the JA signal transduction pathway, five TIFY protein-encoding genes were substantially repressed upon waterlogging stress in ‘L39’, among which two genes (MELO3C015538 and MELO3C022678) were significantly induced in ‘L45’. The transcript level of MELO3C013851, encoding transcription factor MYC2, was significantly and uniquely up-regulated in ‘L45’ (Table S5).

3.8. Analysis of Differentially Expressed Transcription Factors

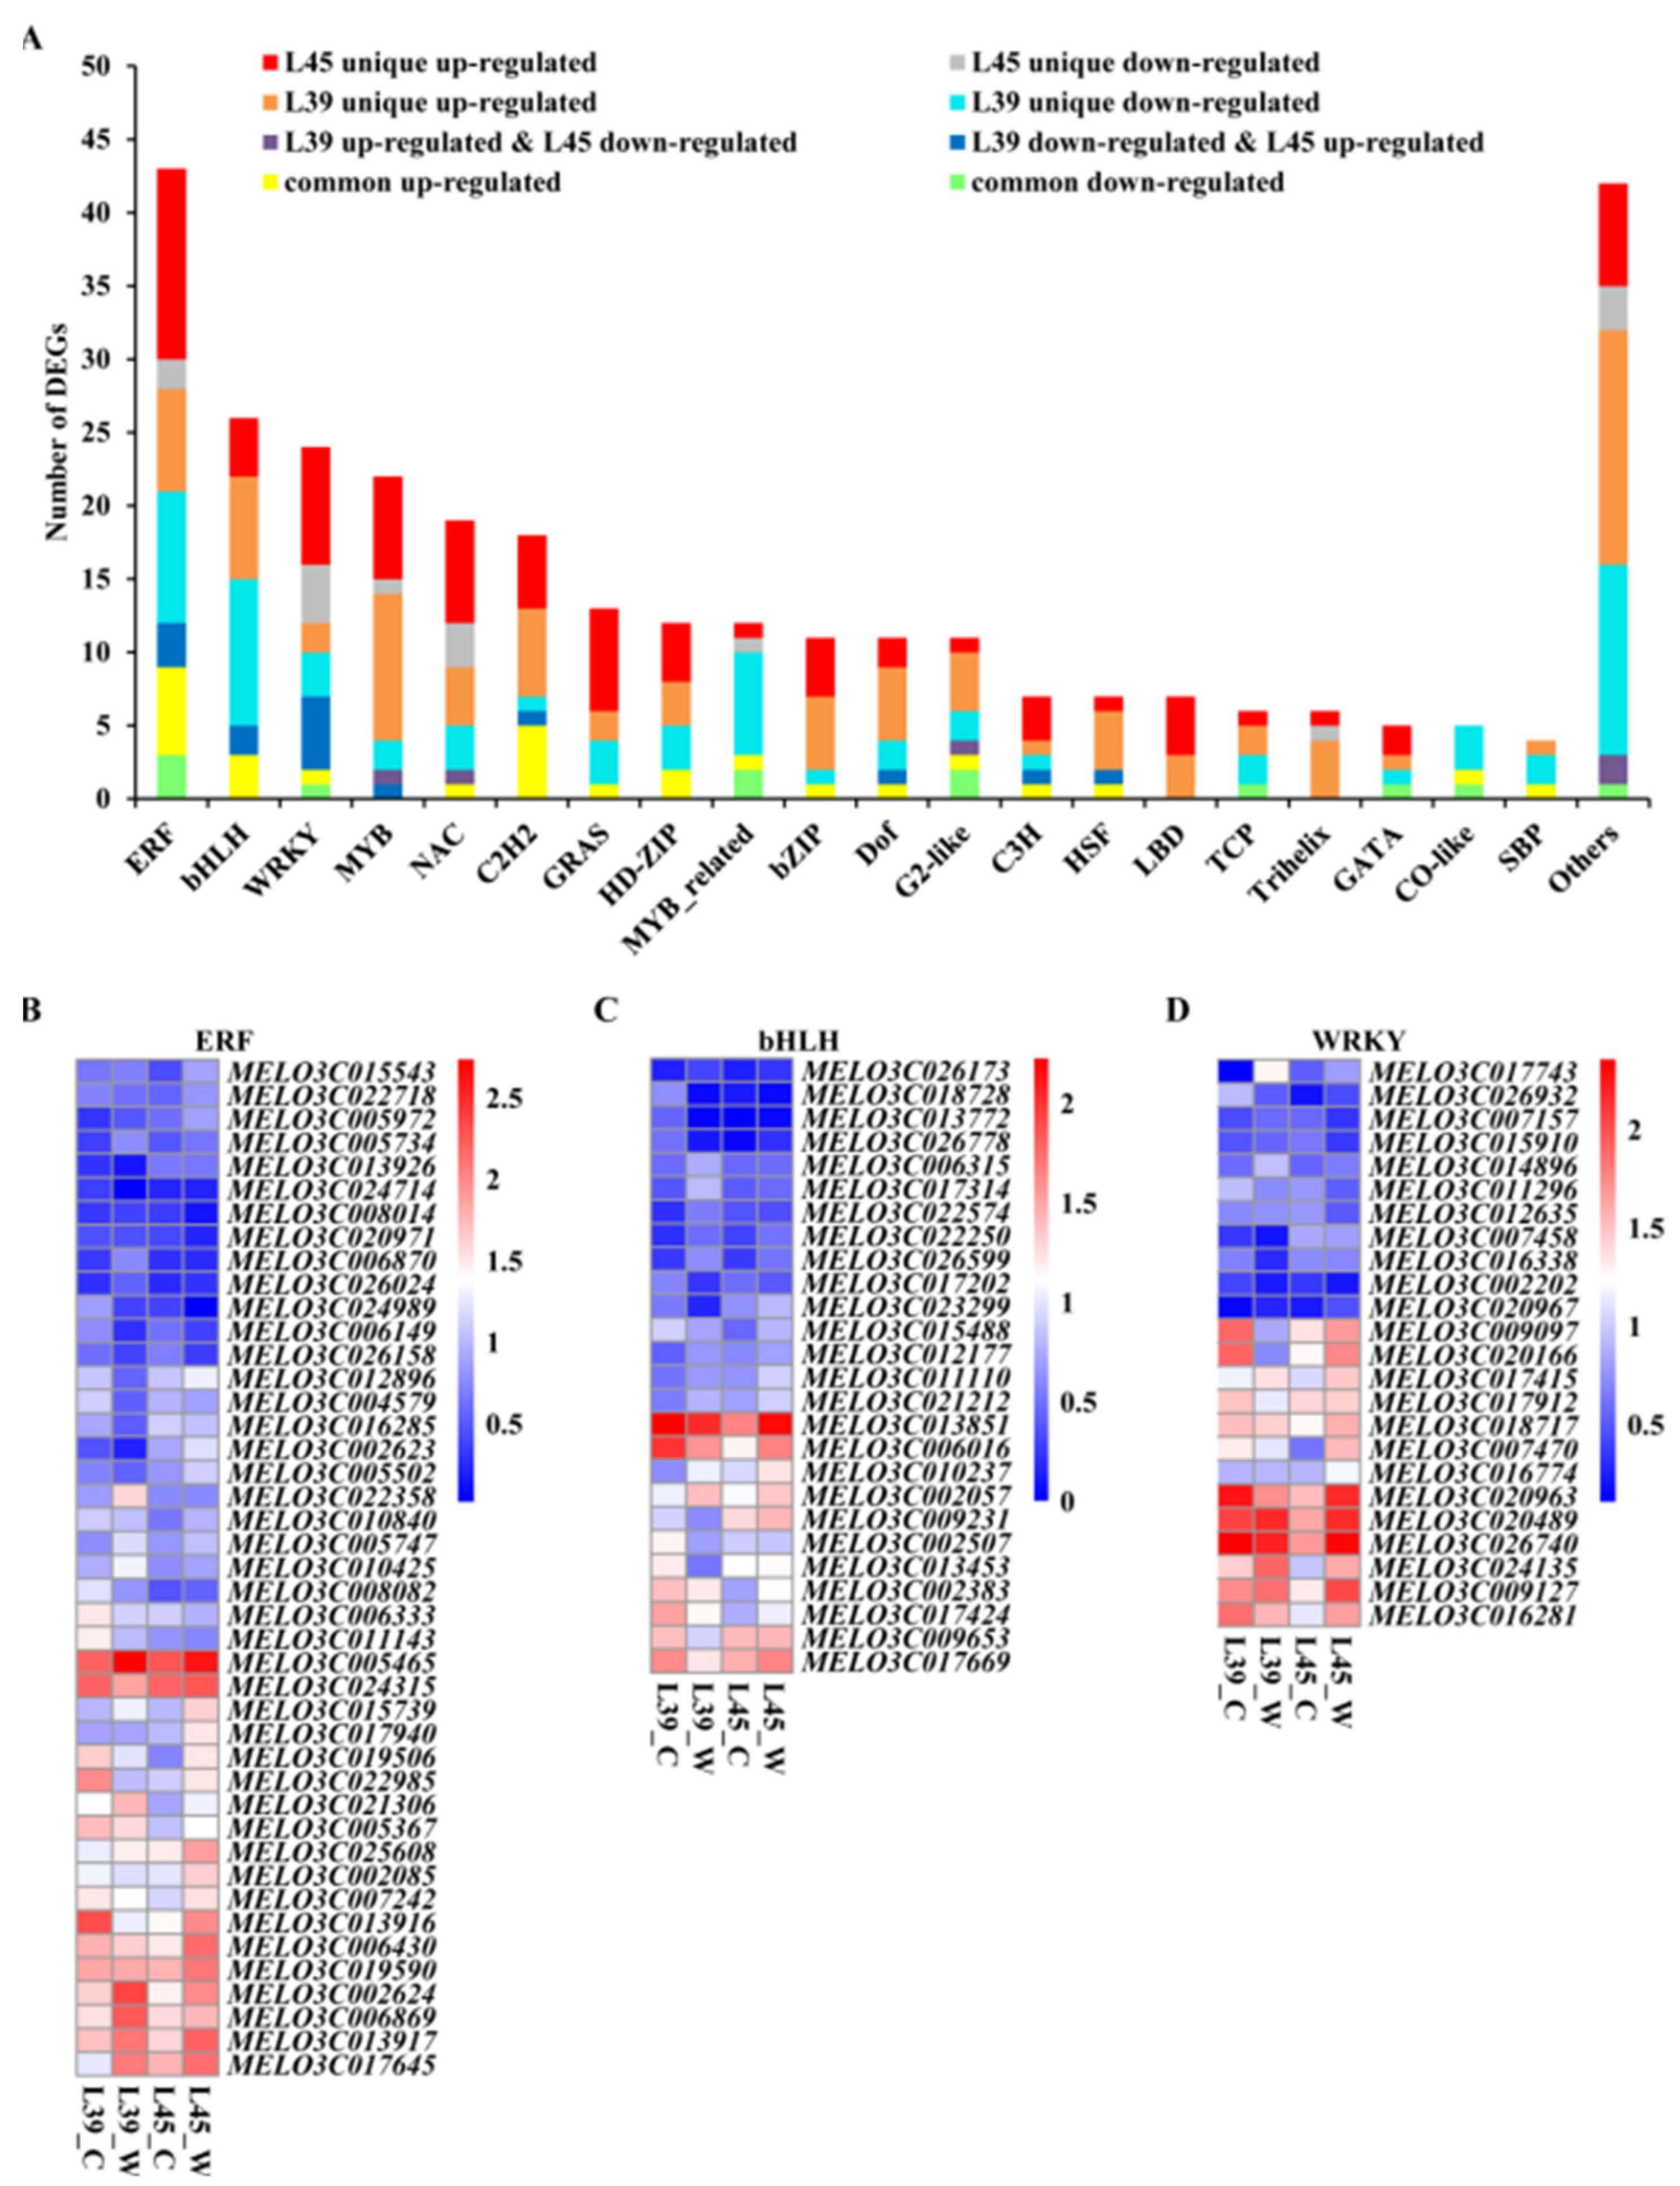
To analyze the different responses of transcription factors to waterlogging stress in two accessions, all the DEGs obtained in this study were categorized according to the Plant Transcription Factor Database, version 3.0 [39]. A total of 311 waterlogging-regulated transcription factors were identified (Table S6). Of these, 39 transcription factors (27 up-regulated and 12 down-regulated) were commonly regulated in ‘L39’ and ‘L45’, whereas 155 transcription factors (87 up-regulated and 68 down-regulated) were regulated in ‘L39’ only, and 97 transcription factors (82 up-regulated and 15 down-regulated) were regulated in ‘L45’ only. In addition, 15 transcription factors were down-regulated in ‘L39’ but were up-regulated in ‘L45’, while 5 transcription factors were up-regulated in ‘L39’ but down-regulated in ‘L45’ (Figure 9A).
The ERF (43 DEGs), bHLH (26 DEGs), WRKY (24 DEGs), MYB (22 DEGs), NAC (19 DEGs), C2H2 (18 DEGs), GRAS (13 DEGs), HD-ZIP (12 DEGs), MYB_related (12 DEGs), bZIP (11 DEGs), Dof (11 DEGs), G2-like (11 DEGs), C3H (7 DEGs), HSF (7 DEGs) and LBD (7 DEGs) families were the top 15 differentially expressed categories (Figure 9A). A heatmap analysis of the ERF, bHLH, and WRKY families was performed (Figure 9B–D). In the ERF family, 13 members were significantly and specifically induced after waterlogging in ‘L45’ but not in ‘L39’, and two members were specifically suppressed in ‘L45’. The expression of MELO3C013916, MELO3C019506 and MELO3C022985 was greatly up-regulated in ‘L45’ but was down-regulated in ‘L39’ (Figure 9B and Table S6). It has been reported that VII ERF plays a crucial role in controlling waterlogging and hypoxia tolerance [40]. In the melon genome, we previously identified five group-VII ERF genes [17]. In the current study, three members of VII ERFs (MELO3C017940, MELO3C021306 and MELO3C024315) responded to waterlogging stress. Of these, MELO3C017940 was specifically induced in ‘L45’ and MELO3C024315 was specifically suppressed in ‘L39’, whereas MELO3C021306 was induced more strongly in ‘L45’ than in ‘L39’ after waterlogging stress (Figure 9B and Table S6). In the bHLH family, the expression of MELO3C002383, MELO3C011110, MELO3C013851, and MELO3C015488 was specifically up-regulated in ‘L45’, and MELO3C006016 and MELO3C017424 were greatly up-regulated in ‘L45’ but were down-regulated in ‘L39’ (Figure 9C and Table S6). In the WRKY family, eight, four, and five members were specifically induced in ‘L45’, specifically suppressed in ‘L45’, and up-regulated in ‘L45’, but were down-regulated in L39’, respectively, among which MELO3C007470 was up-regulated 10.53-fold in ‘L45’ but was not significantly regulated in ‘L39’ (Figure 9D and Table S6).

4. Discussion

Waterlogging stress has become one of the most severe abiotic stressors facing agriculture worldwide; it leads to hypoxia stress and upsets the normal growth and development of crops. The development of crop cultivars with resistance to waterlogging stress is an economic and effective method by which to reduce the damage of waterlogging stress to crop production. Understanding the genes that respond to waterlogging stress could contribute to developing waterlogging-tolerant cultivars. Although the gene regulation and adaptive mechanism have been reported in rice [41], wheat [42], sesame [43], peanut [44], zombi pea [3], alfalfa [22], chrysanthemum [45], and cucumber [46], limited candidate genes and knowledge of the molecular mechanism of melon to waterlogging stress are available. In the present study, to explore the molecular responses to waterlogging stress in melon, we performed an RNA-seq-based comparative transcriptome analysis between waterlogging-tolerant and waterlogging-susceptible accessions and analyzed the transcriptomic differences between these two contrasting melon accessions.
In the present study, we first investigated the morphological and physiological changes in ‘L39’ and ‘L45’ after waterlogging stress. After four days of waterlogging stress treatment, ‘L39’ displayed a waterlogging-sensitive phenotype with withered and chlorotic leaves, while ‘L45’ showed a waterlogging-tolerant phenotype with vigorous growth (Figure S1). In agreement with this, the chlorophyll contents of ‘L39’ decreased significantly under waterlogging stress, compared with control plants, while ‘L45’ contents did not change upon waterlogging stress (Figure 1A–C). Previous studies have reported that the hypoxia environment caused by waterlogging stress has adverse effects on membrane stability [47,48,49]. In our present study, we found that under waterlogging stress, ‘L45’ exhibited lower REL and content of MDA than ‘L39’ (Figure 1D,E), indicating that the waterlogging-tolerant accession suffers less oxidative stress and a lower degree of membrane lipid peroxidation and electrolyte leakage; thus, it can better maintain the stability of the cell membrane.
A global analysis of transcriptome could contribute to the identification of genes that respond to waterlogging stress. In this study, gene transcriptional profiles of the waterlogging-sensitive accession ‘L39’ and waterlogging-tolerant accession ‘L45’ under waterlogging stress and control conditions were performed. A total of 1748 DEGs were identified in ‘L45’ under waterlogging stress, compared with the control, whereas 3178 DEGs were found in ‘L39’ (Figure 4B). The accession that was indicated as sensitive (‘L39’) demonstrated notably more genes with differential expression than the tolerant accession (‘L45’), indicating more extensive transcriptomic reprogramming in sensitive accessions, which is analogous to previous reports on cucumber [46,50], zombi pea [3], and alfalfa [22]. It has been reported that ubiquitination plays a critical role in regulating the transcriptional changes required for adaption to abiotic stresses by modulating the amount and activity of regulatory proteins [51]. Interestingly, we found the KEGG pathway of ‘ubiquitin-mediated proteolysis’ was significantly and uniquely enriched in the up-regulated DEGs of ‘L39’ (Figure 6A), which might partially explain the possible reasons for extensive transcriptomic changes in ‘L39’. Simultaneously, considering the dramatic morphological and physiological changes of ‘L39’, we speculate that the waterlogging-sensitive accession might undergo more profound cellular and metabolic reorganization under waterlogging stress than waterlogging-tolerant accession.
Stomata have been described as windows for gas exchange between the plants and the outside environment [52]. Previous studies have reported that waterlogging stress could induce the closing of stomata due to the decreased oxygen supply and hydraulic conductance of waterlogged roots [53,54,55,56]. In our present study, we found that most of the stomata of ‘L39’ became closed (Figure 3C,D and Figure S2), while the stomata of ‘L45’ remained open (Figure 3A,B and Figure S2), which is consistent with the observations on waterlogging-sensitive and waterlogging-tolerant Citrus accessions under waterlogging stress [53]. It is presumed that the stomata of waterlogging-sensitive accession might close as a response to the water deficit in leaves. In addition, the results of transmission electron microscopy showed that most of the chloroplasts of ‘L39’ exhibited deformation, with loose lamellar structures (Figure 2C,D), while the chloroplasts of ‘L45’ were oval-shaped, with normal lamellar structures (Figure 2A,B), indicating that waterlogging stress leads to more detrimental effects in ‘L39’. In grapevines, a number of genes related to chlorophyll synthesis were down-regulated under waterlogging stress [57]. Similarly, in this study, we found that in ‘L39’, the expression of five genes that participated in chlorophyll a synthesis was down-regulated, one gene involved in the interconversion of chlorophyll a and chlorophyll b was down-regulated, and one gene associated with chlorophyll degradation was up-regulated, whereas in ‘L45’, two genes and one gene involved in chlorophyll a synthesis were down-regulated and up-regulated, respectively (Figure 7). This suggested that waterlogging stress inhibited chlorophyll synthesis and induced chlorophyll degradation of ‘L39’, while, it had less effect on the chlorophyll metabolism of the waterlogging-tolerant accession ‘L45’, which is confirmed by the results of the chlorophyll contents (Figure 1A–C). It has been reported that waterlogging stress can reduce the plant’s photosynthetic capabilities [52,53,56]. In agreement with previous studies, we found that ‘photosynthesis-antenna proteins’ and ‘photosynthesis’ pathways were significantly enriched in the DEGs that were uniquely down-regulated in ‘L39’ (Figure 6B). Simultaneously, more genes associated with photosynthesis were down-regulated in ‘L39’ than in ‘L45’ under waterlogging stress, compared with control (Table S3). These results indicated a deeper effect of waterlogging stress on the waterlogging-sensitive accession, which suffered stomatal closure, chloroplast distortion, and chlorophyll degradation, reducing its photosynthetic capability, thereby increasing its vulnerability to waterlogging stress.
During waterlogging stress, the switch from aerobic respiration to anaerobic respiration is likely to strongly influence energy and carbon metabolism [58]. In grapevine, waterlogging stress increased the expression of genes that participated in sugar and starch cleavage, including α-amylase, β-amylase and sucrose synthase [57]. In rice, it has been reported that starch breakdown-related genes were induced to a greater degree in the flooding-intolerant variety, compared with the flooding-tolerant variety [59]. In the present study, we found that a total of 12 starch and sugar cleavage-related genes were significantly induced by waterlogging stress in ‘L39’, while only five genes were up-regulated in ‘L45’ (Figure 8). Remarkably, most of the above-mentioned genes were differentially expressed at a higher level and were more strongly induced in ‘L39’ than in ‘L45’ (Figure 8). Previous studies have reported that numerous genes related to glycolysis and fermentation were significantly accumulated under waterlogging stress [7,19,46,57]. In this study, seven genes involved in glycolysis were induced in ‘L39’, which included genes encoding the rate-limiting enzyme hexokinase, phosphofructokinase, and pyruvate kinase, whereas in ‘L45’, only one gene encoding hexokinase was induced by waterlogging stress (Figure 8). In addition, our data showed that the number of induced fermentation genes was higher in ‘L39’, and these genes were more strongly induced in ‘L39’ compared with ‘L45’ (Figure 8). These results were consistent with previous findings wherein those genes that participated in starch-sugar cleavage, glycolysis, and fermentation are more strongly induced in the sensitive variety than in the tolerant variety [3,60]. We speculate that the waterlogging-tolerant accession might have a slower glycolytic process and a better ability to maintain carbohydrate reserves than the sensitive accession, which suggests that the management of carbohydrate reserves could be vital for the survival of plants encountering energy crises from low oxygen conditions caused by waterlogging stress.
Under waterlogging stress, ethylene entrapment is described as the first warning signal in plants [16,41,61]. In the zombi pea, waterlogging stress led to the stronger induction of ethylene synthesis and perception in the waterlogging-sensitive variety than in the waterlogging-tolerant variety [3]. Similarly, in this study, our analysis demonstrated that the transcript of SAMS was uniquely accumulated in ‘L39’ (Table S5). In addition, two genes encoding ACS, the rate-limiting enzyme of ethylene biosynthesis, were substantially induced in ‘L39’, while only one was up-regulated in ‘L45’ (Table S5). These results indicated that the waterlogging response of ethylene might be more pronounced in the waterlogging-sensitive accession, ‘L39’ than in the waterlogging-tolerant accession, ‘L45’. Although ethylene plays a vital role in plants under waterlogging stress, excessive accumulation may lead to negative effects, such as the enhancement of chlorophyll degradation and carbohydrate reserves consumption [59,62,63], which was in accordance with our results described above (Figure 1A–C, Figure 7 and Figure 8), thereby resulting in the sensitivity to waterlogging stress of ‘L39’. In sesame plants, 10 abscisic acid pathway genes were responsive to waterlogging stress [43]. It has been reported that most key enzyme encoding genes for ABA biosynthesis were greatly up-regulated in grapevines [57]. In this study, two genes encoding NCED, a rate-limiting enzyme in ABA biosynthesis, were significantly induced, while one gene encoding ABA 8′-hydroxylase, which is involved in ABA inactivation, was substantially and uniquely repressed in ‘L39’, whereas one NCED gene was down-regulated in ‘L45’ under waterlogging stress (Table S5). Additionally, more genes related to the ABA signal transduction pathway changed transcript level in ‘L39’ compared with ‘L45’ (Table S5). These results suggest that the waterlogging response of ABA is more prominent in ‘L39’, which is in line with the results of stomatal closure in ‘L39’ (Figure 3C,D). Moreover, many genes associated with the SA and JA signaling pathways were identified under waterlogging stress (Table S5). These waterlogging-responsive hormone genes might help increase the endurance of waterlogging stress in melon and need to be studied further.
Transcription factors have been described as vital regulators of the response to waterlogging stress, including members of the ERF, MYB, WRKY, bHLH, NAC and bZIP families [7,64,65]. In this study, we found that 311 transcription factors were waterlogging-responsive (Table S6), suggesting the importance of transcriptional regulation in response to waterlogging stress in melon. Among these transcription factors, 43 ERFs exhibited altered transcriptional levels under waterlogging stress, representing the highest number of significantly expressed transcription factors (Figure 9A). It has been reported that the overexpression of a waterlogging-responsive ERF from Mentha, MaRAP2-4, could enhance the waterlogging tolerance of Arabidopsis [66]. In Arabidopsis, AtRAP2.6L, a member of the ERF family, functions as a positive regulator of waterlogging tolerance, the overexpression of which leads to an increase in Arabidopsis survival [67]. In this study, 13 ERFs were uniquely up-regulated in ‘L45’, and three ERFs were induced in ‘L45’ but suppressed in ‘L39’ (Figure 9B and Table S6), indicating the possible contributions of these ERFs in the different waterlogging tolerance of the two melon accessions. Previous studies have reported that members of the group-VII ERF family in Arabidopsis, including RAP2.2, RAP2.3, RAP2.12, HRE1, and HRE2, are responsive to hypoxia and have a function in hypoxia tolerance [68,69,70]. Similarly, in this study, three out of five VII ERF genes in melon responded to waterlogging stress, among which MELO3C017940 was uniquely induced in ‘L45’, MELO3C024315 was specifically suppressed in ‘L39’, and MELO3C021306 was induced at a higher level in ‘L45’ than ‘L39’ (Figure 9B and Table S6), suggesting that these VII ERF genes might act as oxygen sensors under waterlogging stress. The members of the bHLH gene family have prominent regulatory functions in waterlogging tolerance in barley [71], sesame [72] and Sesbania cannabina [65]. In chrysanthemum, bHLH93 and bHLH130 were more up-regulated by waterlogging stress in the tolerant cultivar, while bHLH25 and bHLH63 were induced more strongly in the sensitive cultivar [45]. In this study, we also found four bHLH genes that were specifically up-regulated in ‘L45’, while two genes were greatly up-regulated in ‘L45’ but down-regulated in ‘L39’ (Figure 9C and Table S6), which may probably explain the certain difference between ‘L39’ and ‘L45’ in waterlogging tolerance. Furthermore, members of the WRKY family were found to act as master players in waterlogging response [20,73,74]. It has been reported that the ectopic overexpression of the sunflower transcription factor HaWRKY76 in Arabidopsis could increase the waterlogging tolerance of transgenic plants [21]. Our data showed that eight genes of the WRKY family were specifically induced in ‘L45’, while five members were up-regulated in ‘L45’ but down-regulated in ‘L39’ (Figure 9D and Table S6). The observed differential expression of numerous transcription factors indicates a complicated transcriptional regulatory network underlying melon responses to waterlogging stress. However, it is worth noting that an in-depth functional analysis of these waterlogging-responsive transcription factors is required to enhance resistance to waterlogging in melon.

5. Conclusions

In conclusion, we examined the differences in morphological and physiological changes in the waterlogging-sensitive melon accession ‘L39’ and waterlogging-tolerant accession ‘L45’ under waterlogging stress. Then, a comparative transcriptome analysis was carried out, which showed that the DEGs between ‘L39’ and ‘L45’ varied dramatically at the transcriptional level. Complex molecular response differences in chlorophyll metabolism, photosynthesis, sugar cleavage, glycolysis, fermentation, reactive oxygen species scavenging, hormone signals, and transcription factors were detected. This study revealed the pathways and genes fulfilling important roles in waterlogging tolerance of melon, which could provide a foundation for further understanding of the molecular response mechanism against waterlogging stress and benefit the development of waterlogging resistant varieties in melon.

Supplementary Materials

The following supporting information can be downloaded at: https://www.mdpi.com/article/10.3390/horticulturae8100891/s1, Figure S1: Plant growth of ‘L39’ and ‘L45’ in control (A,B) and waterlogged plants after four days of waterlogging stress (C,D); Figure S2: The percentage of three levels of stomatal opening in ‘L39’ and ‘L45’ leaves under waterlogging stress for four days (n = 47 stomata for ‘L39’; n = 54 stomata for ‘L45’); Table S1: The primer sequences for qRT-PCR; Table S2: GO enrichment of the genes commonly expressed in all samples; Table S3: Differentially expressed genes related to photosynthesis; Table S4: Differentially expressed genes related to reactive oxygen species scavenging; Table S5: Differentially expressed genes related to hormone metabolism; Table S6: Differentially expressed genes annotated as transcription factors.

Author Contributions

Formal analysis, H.Z. and G.L.; methodology, X.H., F.Z. and W.L.; validation, C.Y., X.Z., N.C. and M.L.; writing—original draft, H.Z. All authors have read and agreed to the published version of the manuscript.

Funding

This work was supported by Natural Science Foundation of China (32260756), China Postdoctoral Science Foundation (2021M701514), the Modern Agricultural Research Collaborative Innovation Program of Jiangxi Province (JXXTCXQN202007, JXXTCX202109, JXXTCX202203), the Innovation Program of Jiangxi Academy of Agricultural Sciences (20181CBS002), China Agriculture Research System (CARS-25), the Jiangxi Province Science Foundation for Youths (20192BAB214017), and the Agricultural Science and Technology Innovation Program (CAAS-ASTIP-2021-ZFRI).

Data Availability Statement

All datasets obtained for this study are included in the manuscript/Supplementary Materials.

Conflicts of Interest

The authors declare that they have no conflict of interest.

References

  1. Sasidharan, R.; Bailey-Serres, J.; Ashikari, M.; Atwell, B.J.; Colmer, T.; Fagerstedt, K.; Fukao, T.; Geigenberger, P.; Hebelstrup, K.H.; Hill, R.D.; et al. Community recommendations on terminology and procedures used in flooding and low oxygen stress research. New Pythol. 2017, 214, 1403–1407. [Google Scholar] [CrossRef] [PubMed]
  2. Fukao, T.; Barrera-Figueroa, B.E.; Juntawong, P.; Pena-Castro, J.M. Submergence and waterlogging wtress in plants: A review highlighting research opportunities and understudied aspects. Front. Plant Sci. 2019, 10, 340. [Google Scholar] [CrossRef] [PubMed]
  3. Butsayawarapat, P.; Juntawong, P.; Khamsuk, O.; Somta, P. Comparative transcriptome analysis of waterlogging-sensitive and tolerant zombi pea (Vigna vexillata) reveals energy conservation and root plasticity controlling waterlogging tolerance. Plants 2019, 8, 264. [Google Scholar] [CrossRef]
  4. Sreeratree, J.; Butsayawarapat, P.; Chaisan, T.; Somta, P.; Juntawong, P. RNA-seq qeveals waterlogging-triggered root plasticity in mungbean associated with ethylene and jasmonic acid signal integrators for root regeneration. Plants 2022, 11, 930. [Google Scholar] [CrossRef] [PubMed]
  5. Valliyodan, B.; Ye, H.; Song, L.; Murphy, M.; Shannon, J.G.; Nguyen, H.T. Genetic diversity and genomic strategies for improving drought and waterlogging tolerance in soybeans. J. Exp. Bot. 2017, 68, 1835–1849. [Google Scholar] [CrossRef]
  6. Visser, E.J.W.; Voesenek, L.; Vartapetian, B.B.; Jackson, M.B. Flooding and plant growth. Ann. Bot. 2003, 91, 107–109. [Google Scholar] [CrossRef]
  7. Cao, M.; Zheng, L.; Li, J.; Mao, Y.; Zhang, R.; Niu, X.; Geng, M.; Zhang, X.; Huang, W.; Luo, K.; et al. Transcriptomic profiling suggests candidate molecular responses to waterlogging in cassava. PLoS ONE 2022, 17, e0261086. [Google Scholar] [CrossRef]
  8. Juntawong, P.; Sirikhachornkit, A.; Pimjan, R.; Sonthirod, C.; Sangsrakru, D.; Yoocha, T.; Tangphatsornruang, S.; Srinives, P. Elucidation of the molecular responses to waterlogging in Jatropha roots by transcriptome profiling. Front. Plant Sci. 2014, 5, 658. [Google Scholar] [CrossRef]
  9. Kim, Y.; Seo, C.W.; Khan, A.L.; Mun, B.G.; Shahzad, R.; Ko, J.W.; Yun, B.W.; Park, S.K.; Lee, I.J. Exo-ethylene application mitigates waterlogging stress in soybean (Glycine max L.). BMC Plant Biol. 2018, 18, 254. [Google Scholar] [CrossRef]
  10. Dawood, T.; Yang, X.; Visser, E.J.W.; te Beek, T.A.H.; Kensche, P.R.; Cristescu, S.M.; Lee, S.; Floková, K.; Nguyen, D.; Mariani, C.; et al. A co-opted hormonal cascade activates dormant adventitious root primordia upon flooding in Solanum dulcamara. Plant Physiol. 2016, 170, 2351–2364. [Google Scholar] [CrossRef] [Green Version]
  11. Herzog, M.; Striker, G.G.; Colmer, T.D.; Pedersen, O. Mechanisms of waterlogging tolerance in wheat-a review of root and shoot physiology. Plant Cell Environ. 2016, 39, 1068–1086. [Google Scholar] [CrossRef]
  12. Ni, X.L.; Gui, M.Y.; Tan, L.L.; Zhu, Q.; Liu, W.Z.; Li, C.X. Programmed cell death and aerenchyma formation in water-logged sunflower stems and its promotion by ethylene and ROS. Front. Plant Sci. 2019, 9, 1928. [Google Scholar] [CrossRef]
  13. Gibbs, J.; Greenway, H. Mechanisms of anoxia tolerance in plants. I. Growth, survival and anaerobic catabolism. Funct. Plant Biol. 2003, 30, 1–47. [Google Scholar] [CrossRef] [PubMed]
  14. Ricoult, C.; Echeverria, L.O.; Cliquet, J.B.; Limami, A.M. Characterization of alanine aminotransferase (AlaAT) multigene family and hypoxic response in young seedlings of the model legume Medicago truncatula. J. Exp. Bot. 2006, 57, 3079–3089. [Google Scholar] [CrossRef] [PubMed]
  15. Narsai, R.; Rocha, M.; Geigenberger, P.; Whelan, J.; van Dongen, J.T. Comparative analysis between plant species of transcriptional and metabolic responses to hypoxia. New Phytol. 2011, 190, 472–487. [Google Scholar] [CrossRef] [PubMed]
  16. Vidoz, M.L.; Loreti, E.; Mensuali, A.; Alpi, A.; Perata, P. Hormonal interplay during adventitious root formation in flooded tomato plants. Plant J. 2010, 63, 551–562. [Google Scholar] [CrossRef]
  17. Zhang, H.; Li, G.; Yan, C.; Cao, N.; Yang, H.; Le, M.; Zhu, F. Depicting the molecular responses of adventitious rooting to waterlogging in melon hypocotyls by transcriptome profiling. 3 Biotech 2021, 11, 351. [Google Scholar] [CrossRef]
  18. Shukla, V.; Lombardi, L.; Pencik, A.; Novak, O.; Weits, D.A.; Loreti, E.; Perata, P.; Giuntoli, B.; Licausi, F. Jasmonate signalling contributes to primary root inhibition upon oxygen deficiency in Arabidopsis thaliana. Plants 2020, 9, 1046. [Google Scholar] [CrossRef]
  19. Arora, K.; Panda, K.K.; Mittal, S.; Mallikarjuna, M.G.; Rao, A.R.; Dash, P.K.; Thirunavukkarasu, N. RNAseq revealed the important gene pathways controlling adaptive mechanisms under waterlogged stress in maize. Sci. Rep. 2017, 7, 10950. [Google Scholar] [CrossRef]
  20. Wang, L.; Dossa, K.; You, J.; Zhang, Y.; Li, D.; Zhou, R.; Yu, J.; Wei, X.; Zhu, X.; Jiang, S.; et al. High-resolution temporal transcriptome sequencing unravels ERF and WRKY as the master players in the regulatory networks underlying sesame responses to waterlogging and recovery. Genomics 2021, 113, 276–290. [Google Scholar] [CrossRef]
  21. Raineri, J.; Ribichich, K.F.; Chan, R.L. The sunflower transcription factor HaWRKY76 confers drought and flood tolerance to Arabidopsis thaliana plants without yield penalty. Plant Cell Rep. 2015, 34, 2065–2080. [Google Scholar] [CrossRef] [PubMed]
  22. Zeng, N.; Yang, Z.; Zhang, Z.; Hu, L.; Chen, L. Comparative transcriptome combined with proteome analyses revealed key factors involved in alfalfa (Medicago sativa) response to waterlogging stress. Int. J. Mol. Sci. 2019, 20, 1359. [Google Scholar] [CrossRef] [PubMed]
  23. Burger, Y.; Sa′ar, U.; Paris, H.; Lewinsohn, E.; Katzir, N.; Tadmor, Y.; Schaffer, A. Genetic variability for valuable fruit quality traits in Cucumis melo. Isr. J. Plant Sci. 2006, 54, 233–242. [Google Scholar] [CrossRef]
  24. Nuñez-Palenius, H.G.; Gomez-Lim, M.; Ochoa-Alejo, N.; Grumet, R.; Lester, G.; Cantliffe, D.J. Melon fruits: Genetic diversity, physiology, and biotechnology features. Crit. Rev. Biotechnol. 2008, 28, 13–55. [Google Scholar] [CrossRef] [PubMed]
  25. Zhu, F.Y.; Chen, M.X.; Chan, W.L.; Yang, F.; Tian, Y.; Song, T.; Xie, L.J.; Zhou, Y.; Xiao, S.; Zhang, J.; et al. SWATH-MS quantitative proteomic investigation of nitrogen starvation in Arabidopsis reveals new aspects of plant nitrogen stress responses. J. Proteom. 2018, 187, 161–170. [Google Scholar] [CrossRef] [PubMed]
  26. Shao, P.; Wang, P.; Niu, B.; Kang, J. Environmental stress stability of pectin-stabilized resveratrol liposomes with different degree of esterification. Int. J. Biol. Macromol. 2018, 119, 53–59. [Google Scholar] [CrossRef] [PubMed]
  27. Zhang, Z.; Liu, H.; Sun, C.; Ma, Q.; Bu, H.; Chong, K.; Xu, Y. A C2H2 zinc-finger protein OsZFP213 interacts with OsMAPK3 to enhance salt tolerance in rice. J. Plant Physiol. 2018, 229, 100–110. [Google Scholar] [CrossRef]
  28. Wang, M.; Jiang, B.; Peng, Q.; Liu, W.; He, X.; Liang, Z.; Lin, Y. Transcriptome analyses in different cucumber cultivars provide novel insights into drought stress responses. Int. J. Mol. Sci. 2018, 19, 2067. [Google Scholar] [CrossRef]
  29. Zhang, Z.; Cheng, Z.J.; Gan, L.; Zhang, H.; Wu, F.Q.; Lin, Q.B.; Wang, J.L.; Wang, J.; Guo, X.P.; Zhang, X.; et al. OsHSD1, a hydroxysteroid dehydrogenase, is involved in cuticle formation and lipid homeostasis in rice. Plant Sci. 2016, 249, 35–45. [Google Scholar] [CrossRef]
  30. Cui, L.G.; Shan, J.X.; Shi, M.; Gao, J.P.; Lin, H.X. DCA1 acts as a transcriptional co-activator of DST and contributes to drought and salt tolerance in rice. PLoS Genet. 2015, 11, e1005617. [Google Scholar] [CrossRef] [Green Version]
  31. Kim, D.; Langmead, B.; Salzberg, S.L. HISAT: A fast spliced aligner with low memory requirements. Nat. Methods 2015, 12, 357–360. [Google Scholar] [CrossRef] [PubMed]
  32. Pertea, M.; Pertea, G.M.; Antonescu, C.M.; Chang, T.C.; Mendell, J.T.; Salzberg, S.L. StringTie enables improved reconstruction of a transcriptome from RNA-seq reads. Nat. Biotechnol. 2015, 33, 290–295. [Google Scholar] [CrossRef] [PubMed]
  33. Love, M.I.; Huber, W.; Anders, S. Moderated estimation of fold change and dispersion for RNA-seq data with DESeq2. Genome Biol. 2014, 15, 550. [Google Scholar] [CrossRef] [PubMed]
  34. Alexa, A.; Rahnenfuhrer, J.; Lengauer, T. Improved scoring of functional groups from gene expression data by decorrelating GO graph structure. Bioinformatics 2006, 22, 1600–1607. [Google Scholar] [CrossRef]
  35. Xie, C.; Mao, X.; Huang, J.; Ding, Y.; Wu, J.; Dong, S.; Kong, L.; Gao, G.; Li, C.-Y.; Wei, L. KOBAS 2.0: A web server for annotation and identification of enriched pathways and diseases. Nucleic Acids Res. 2011, 39, W316–W322. [Google Scholar] [CrossRef]
  36. Zhang, H.; Cao, N.; Dong, C.; Shang, Q. Genome-wide identification and expression of ARF gene family during adventitious root development in hot pepper (Capsicum annuum). Hortic. Plant J. 2017, 3, 151–164. [Google Scholar] [CrossRef]
  37. Kong, Q.; Yuan, J.; Niu, P.; Xie, J.; Jiang, W.; Huang, Y.; Bie, Z. Screening suitable reference genes for normalization in reverse transcription quantitative real-time PCR analysis in melon. PLoS ONE 2014, 9, e87197. [Google Scholar] [CrossRef]
  38. Livak, K.J.; Schmittgen, T.D. Analysis of relative gene expression data using real-time quantitative PCR and the 2−ΔΔCT method. Methods 2001, 25, 402–408. [Google Scholar] [CrossRef]
  39. Jin, J.; Zhang, H.; Kong, L.; Gao, G.; Luo, J. PlantTFDB 3.0: A portal for the functional and evolutionary study of plant transcription factors. Nucleic Acids Res. 2014, 42, D1182–D1187. [Google Scholar] [CrossRef]
  40. Gibbs, D.J.; Conde, J.V.; Berckhan, S.; Prasad, G.; Mendiondo, G.M.; Holdsworth, M.J. Group VII ethylene response factors coordinate oxygen and nitric oxide signal transduction and stress responses in plants. Plant Physiol. 2015, 169, 23–31. [Google Scholar] [CrossRef] [Green Version]
  41. Minami, A.; Yano, K.; Gamuyao, R.; Nagai, K.; Kuroha, T.; Ayano, M.; Nakamori, M.; Koike, M.; Kondo, Y.; Niimi, Y.; et al. Time-course transcriptomics analysis reveals key responses of submerged deepwater rice to flooding. Plant Physiol. 2018, 176, 3081–3102. [Google Scholar] [CrossRef] [PubMed]
  42. Li, W.; Challa, G.S.; Gupta, A.; Gu, L.; Wu, Y.; Li, W. Physiological and transcriptomic characterization of sea-wheatgrass-derived waterlogging tolerance in wheat. Plants 2022, 11, 108. [Google Scholar] [CrossRef]
  43. Wang, L.; Li, D.; Zhang, Y.; Gao, Y.; Yu, J.; Wei, X.; Zhang, X. Tolerant and susceptible sesame genotypes reveal waterlogging stress response patterns. PLoS ONE 2016, 11, e0149912. [Google Scholar] [CrossRef] [PubMed]
  44. Zeng, R.; Chen, T.; Wang, X.; Cao, J.; Li, X.; Xu, X.; Chen, L.; Xia, Q.; Dong, Y.; Huang, L.; et al. Physiological and expressional regulation on photosynthesis, starch and sucrose metabolism response to waterlogging stress in peanut. Front. Plant Sci. 2021, 12, 601771. [Google Scholar] [CrossRef]
  45. Zhao, N.; Li, C.; Yan, Y.; Cao, W.; Song, A.; Wang, H.; Chen, S.; Jiang, J.; Chen, F. Comparative transcriptome analysis of waterlogging-sensitive and waterlogging-tolerant Chrysanthemum morifolium cultivars under waterlogging stress and reoxygenation conditions. Int. J. Mol. Sci. 2018, 19, 1455. [Google Scholar] [CrossRef] [PubMed]
  46. Xu, X.; Chen, M.; Ji, J.; Xu, Q.; Qi, X.; Chen, X. Comparative RNA-seq based transcriptome profiling of waterlogging response in cucumber hypocotyls reveals novel insights into the de novo adventitious root primordia initiation. BMC Plant Biol. 2017, 17, 129. [Google Scholar] [CrossRef]
  47. Gill, M.B.; Zeng, F.; Shabala, L.; Zhang, G.; Fan, Y.; Shabala, S.; Zhou, M. Cell-based phenotyping reveals QTL for membrane potential maintenance associated with hypoxia and salinity stress tolerance in barley. Front. Plant Sci. 2017, 8, 1941. [Google Scholar] [CrossRef]
  48. Wang, X.; Yan, L.; Wang, B.; Qian, Y.; Wang, Z.; Wu, W. Comparative proteomic analysis of grapevine rootstock in response to waterlogging stress. Front. Plant Sci. 2021, 12, 749184. [Google Scholar] [CrossRef]
  49. Zhang, Q.; Liu, X.; Zhang, Z.; Liu, N.; Li, D.; Hu, L. Melatonin improved waterlogging tolerance in alfalfa (Medicago sativa) by reprogramming polyamine and ethylene metabolism. Front. Plant Sci. 2019, 10, 44. [Google Scholar] [CrossRef]
  50. Kęska, K.; Szczesniak, M.W.; Makalowska, I.; Czernicka, M. Long-term waterlogging as factor contributing to hypoxia stress tolerance enhancement in cucumber: Comparative transcriptome analysis of waterlogging sensitive and tolerant accessions. Genes 2021, 12, 189. [Google Scholar] [CrossRef]
  51. Lyzenga, W.J.; Stone, S.L. Abiotic stress tolerance mediated by protein ubiquitination. J. Exp. Bot. 2012, 63, 599–616. [Google Scholar] [CrossRef] [PubMed]
  52. Xiao, Y.; Wu, X.; Sun, M.; Peng, F. Hydrogen sulfide alleviates waterlogging-induced damage in peach seedlings via enhancing antioxidative system and inhibiting ethylene synthesis. Front. Plant Sci. 2020, 11, 696. [Google Scholar] [CrossRef] [PubMed]
  53. Pérez-Jiménez, M.; Pérez-Tornero, O. Short-term waterlogging in citrus rootstocks. Plants 2021, 10, 2772. [Google Scholar] [CrossRef] [PubMed]
  54. Gao, J.; Su, Y.; Yu, M.; Huang, Y.; Wang, F.; Shen, A. Potassium alleviates post-anthesis photosynthetic reductions in winter wheat caused by waterlogging at the stem elongation stage. Front. Plant Sci. 2021, 11, 607475. [Google Scholar] [CrossRef] [PubMed]
  55. Barickman, T.C.; Simpson, C.R.; Sams, C.E. Waterlogging causes early modification in the physiological performance, carotenoids, chlorophylls, proline, and soluble sugars of cucumber plants. Plants 2019, 8, 160. [Google Scholar] [CrossRef]
  56. Jurczyk, B.; Pociecha, E.; Janowiak, F.; Kabala, D.; Rapacz, M. Variation in waterlogging-triggered stomatal behavior contributes to changes in the cold acclimation process in prehardened Lolium perenne and Festuca pratensis. Plant Physiol. Biochem. 2016, 109, 280–292. [Google Scholar] [CrossRef]
  57. Zhu, X.; Li, X.; Jiu, S.; Zhang, K.; Wang, C.; Fang, J. Analysis of the regulation networks in grapevine reveals response to waterlogging stress and candidate gene-marker selection for damage severity. R. Soc. Open Sci. 2018, 5, 172253. [Google Scholar] [CrossRef]
  58. Kreuzwieser, J.; Hauberg, J.; Howell, K.A.; Carroll, A.; Rennenberg, H.; Millar, A.H.; Whelan, J. Differential response of gray poplar leaves and roots underpins stress adaptation during hypoxia. Plant Physiol. 2009, 149, 461–473. [Google Scholar] [CrossRef]
  59. Fukao, T.; Xu, K.; Ronald, P.C.; Bailey-Serres, J. A variable cluster of ethylene response factor-like genes regulates metabolic and developmental acclimation responses to submergence in rice. Plant Cell 2006, 18, 2021–2034. [Google Scholar] [CrossRef]
  60. Sasidharan, R.; Mustroph, A.; Boonman, A.; Akman, M.; Ammerlaan, A.M.; Breit, T.; Schranz, M.E.; Voesenek, L.A.; van Tienderen, P.H. Root transcript profiling of two Rorippa species reveals gene clusters associated with extreme submergence tolerance. Plant Physiol. 2013, 163, 1277–1292. [Google Scholar] [CrossRef] [Green Version]
  61. Voesenek, L.A.C.J.; Sasidharan, R.; Weber, A. Ethylene- and oxygen signalling—Drive plant survival during flooding. Plant Biol. 2013, 15, 426–435. [Google Scholar] [CrossRef] [PubMed]
  62. Trebitsh, T.; Goldschmidt, E.E.; Riov, J. Ethylene induces de novo synthesis of chlorophyllase, a chlorophyll degrading enzyme, in Citrus fruit peel. Proc. Natl. Acad. Sci. USA 1993, 90, 9441–9445. [Google Scholar] [CrossRef] [PubMed]
  63. Jacob-Wilk, D.; Holland, D.; Goldschmidt, E.E.; Riov, J.; Eyal, Y. Chlorophyll breakdown by chlorophyllase: Isolation and functional expression of the Chlase1 gene from ethylene-treated Citrus fruit and its regulation during development. Plant J. 1999, 20, 653–661. [Google Scholar] [CrossRef]
  64. Valliyodan, B.; Van Toai, T.; Alves, J.; De Fátima, P.; Goulart, P.; Lee, J.; Fritschi, F.; Rahman, M.; Islam, R.; Shannon, J.; et al. Expression of root-related transcription factors associated with flooding tolerance of soybean (Glycine max). Int. J. Mol. Sci. 2014, 15, 17622–17643. [Google Scholar] [CrossRef]
  65. Ren, C.G.; Kong, C.C.; Yan, K.; Zhang, H.; Luo, Y.M.; Xie, Z.H. Elucidation of the molecular responses to waterlogging in Sesbania cannabina roots by transcriptome profiling. Sci. Rep. 2017, 7, 9256. [Google Scholar] [CrossRef] [PubMed]
  66. Phukan, U.J.; Jeena, G.S.; Tripathi, V.; Shukla, R.K. MaRAP2-4, a waterlogging-responsive ERF from Mentha, regulates bidirectional sugar transporter AtSWEET10 to modulate stress response in Arabidopsis. Plant Biotechnol. J. 2018, 16, 221–233. [Google Scholar] [CrossRef] [PubMed]
  67. Liu, P.; Sun, F.; Gao, R.; Dong, H. RAP2.6L overexpression delays waterlogging induced premature senescence by increasing stomatal closure more than antioxidant enzyme activity. Plant Mol. Biol. 2012, 79, 609–622. [Google Scholar] [CrossRef]
  68. Hinz, M.; Wilson, I.W.; Yang, J.; Buerstenbinder, K.; Llewellyn, D.; Dennis, E.S.; Sauter, M.; Dolferus, R. Arabidopsis RAP2.2: An ethylene response transcription factor that is important for hypoxia survival. Plant Physiol. 2010, 153, 757–772. [Google Scholar] [CrossRef]
  69. Licausi, F.; van Dongen, J.T.; Giuntoli, B.; Novi, G.; Santaniello, A.; Geigenberger, P.; Perata, P. HRE1 and HRE2, two hypoxia-inducible ethylene response factors, affect anaerobic responses in Arabidopsis thaliana. Plant J. 2010, 62, 302–315. [Google Scholar] [CrossRef]
  70. Papdi, C.; Pérez-Salamó, I.; Joseph, M.P.; Giuntoli, B.; Bögre, L.; Koncz, C.; Szabados, L. The low oxygen, oxidative and osmotic stress responses synergistically act through the ethylene response factor VII genes RAP2.12, RAP2.2 and RAP2.3. Plant J. 2015, 82, 772–784. [Google Scholar] [CrossRef] [Green Version]
  71. Borrego-Benjumea, A.; Carter, A.; Tucker, J.R.; Yao, Z.; Xu, W.; Badea, A. Genome-wide analysis of gene expression providesnewinsights into waterlogging responses in barley (Hordeum vulgare L.). Plants 2020, 9, 240. [Google Scholar] [CrossRef] [PubMed]
  72. Dossa, K.; Mmadi, M.A.; Zhou, R.; Zhang, T.; Su, R.; Zhang, Y.; Wang, L.; You, J.; Zhang, X. Depicting the core transcriptome modulating multiple abiotic stresses responses in sesame (Sesamum indicum L.). Int. J. Mol. Sci. 2019, 20, 3930. [Google Scholar] [CrossRef] [PubMed]
  73. Wang, X.; Li, J.; Guo, X.; Ma, Y.; Qiao, Q.; Guo, J. PlWRKY13: A transcription factor involved in abiotic and biotic stress responses in Paeonia lactiflora. Int. J. Mol. Sci. 2019, 20, 5953. [Google Scholar] [CrossRef] [PubMed]
  74. Li, D.; Liu, P.; Yu, J.; Wang, L.; Dossa, K.; Zhang, Y.; Zhou, R.; Wei, X.; Zhang, X. Genome-wide analysis of WRKY gene family in the sesame genome and identification of the WRKY genes involved in responses to abiotic stresses. BMC Plant Biol. 2017, 17, 152. [Google Scholar] [CrossRef]
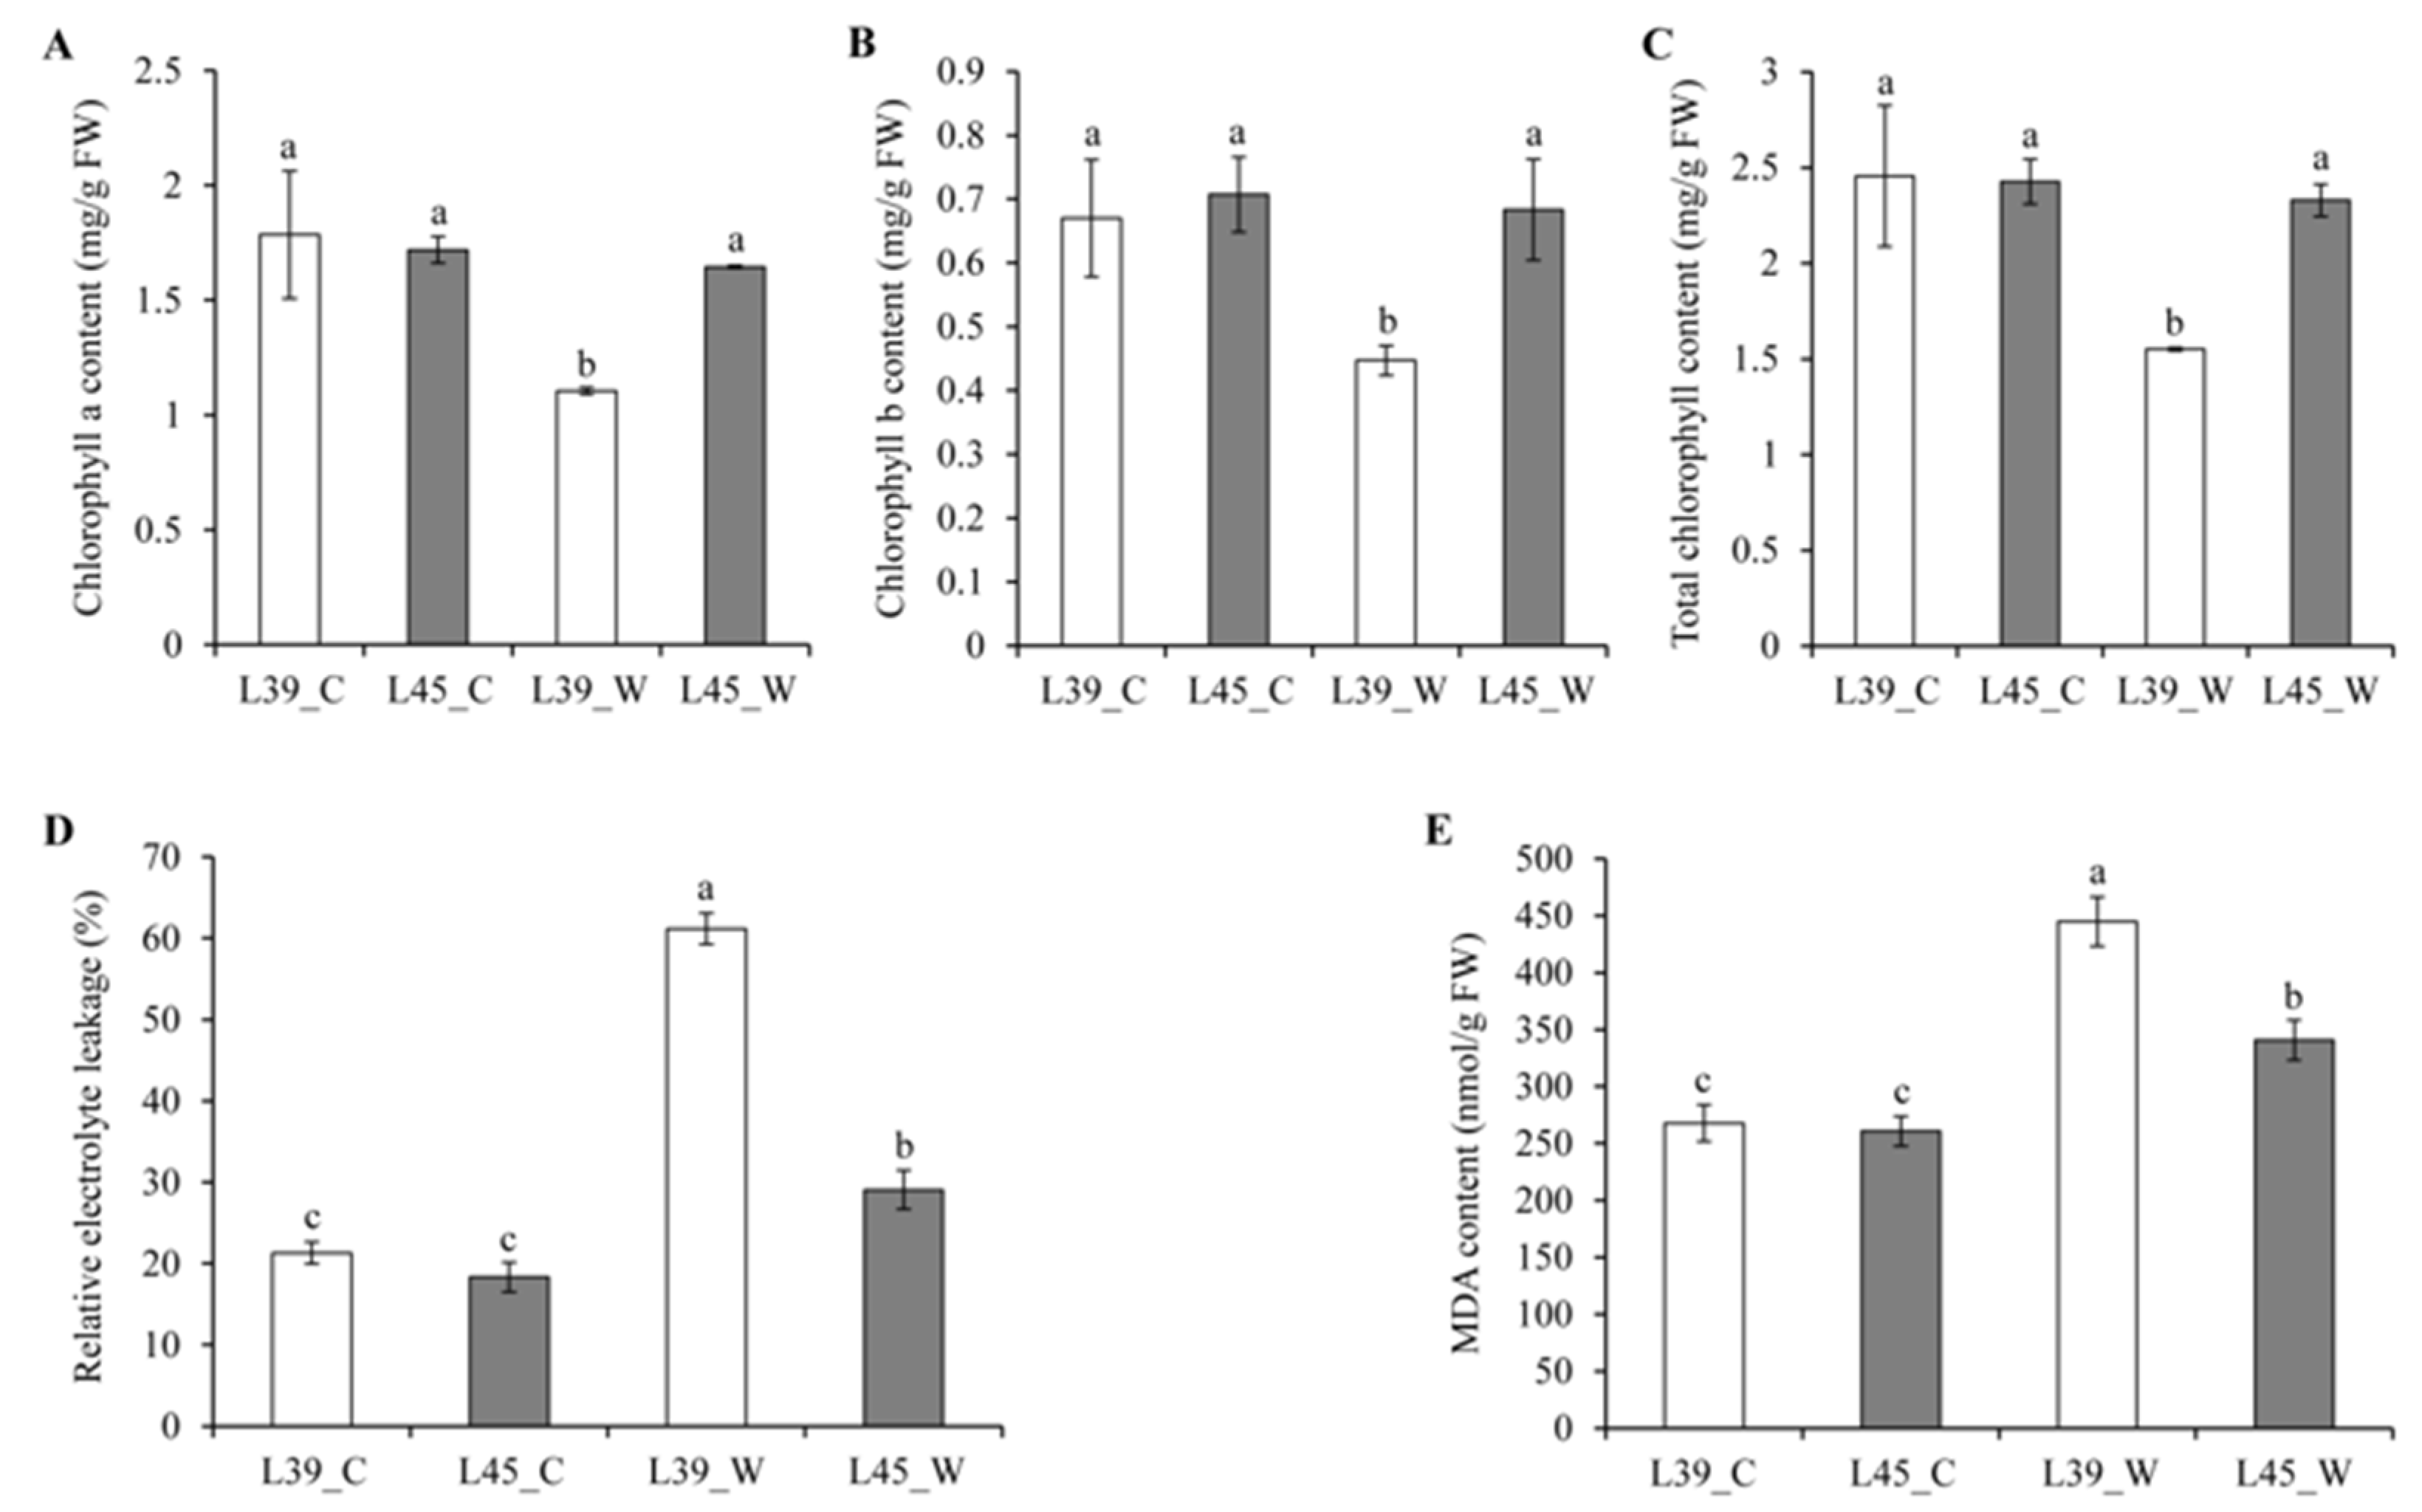
Figure 1. Effects of waterlogging on chlorophyll a content (A), chlorophyll b content (B), total chlorophyll content (C), relative electrolyte leakage (D), and malondialdehyde (MDA) content (E) in ‘L39’ and ‘L45’. Data are presented as means ± standard deviation. Significant differences at p < 0.01 with an LSD test are indicated by different letters.
Horticulturae 08 00891 g001
Figure 2. Transmission electron microscopy observation of ‘L45’ (A,B) and ‘L39’ (C,D) leaves under waterlogging stress for four days.
Horticulturae 08 00891 g002
Figure 3. Scanning electron microscopy observation of ‘L45’ (A,B) and ‘L39’ (C,D) leaves under waterlogging stress for four days.
Horticulturae 08 00891 g003
Figure 4. A survey of gene expression under control and waterlogging stress conditions. (A) Venn diagrams of all expressed genes in the different samples. (B) Statistical histogram of differentially expressed genes (DEGs).
Horticulturae 08 00891 g004
Figure 5. The qRT-PCR (quantitative reverse transcription-PCR) validation of differentially expressed genes under waterlogging stress. The qRT-PCR fold changes log2-values (x-axis) were plotted against the RNA-seq fold changes’ log2-values (y-axis).
Horticulturae 08 00891 g005
Figure 6. Venn diagrams of up-regulated (A) and down-regulated (B) DEGs and the highly enriched KEGG pathways.
Horticulturae 08 00891 g006
Figure 7. Expression of genes relevant to chlorophyll metabolism in ‘L39’ and ‘L45’ under control and waterlogging stress conditions. The levels of gene expression are shown by log10(FPKM+1). GLTX, glutamyl-tRNA synthetase; HEMA, glutamyl-tRNA reductase; CHLH, magnesium-chelatase subunit H; CHLM, magnesium-protoporphyrin O-methyltransferase; CHLE, magnesium-protoporphyrin IX monomethylester oxidative cyclase; POR, protochlorophyllide oxidoreductase; CHLP, geranylgeranyl reductase; CAO, chlorophyllide a oxygenase; PAO, pheophorbide a oxygenase.
Horticulturae 08 00891 g007
Figure 8. Expression of genes associated with sugar cleavage, glycolysis, and fermentation in ‘L39’ and ‘L45’, under control and waterlogging stress conditions. The levels of gene expression are shown by log10(FPKM+1). AMY, α-amylase; BAM, β-amylase; PP, phosphoglucan phosphatase; PHS, α-glucan phosphorylase; SS, sucrose synthase; INV, invertase; HXK, hexokinase; PFK, phosphofructokinase; TPI, triosephosphate isomerase; GAPD, glyceraldehyde-3-phosphate dehydrogenase; PGK, phosphoglycerate kinase; PGM, phosphoglycerate mutase; ENO, enolase; PK, pyruvate kinase; PDC, pyruvate decarboxylase; AlaAT, alanine aminotransferase; ALDH, aldehyde dehydrogenase; ADH, alcohol dehydrogenase.
Horticulturae 08 00891 g008
Figure 9. Analysis of differentially expressed transcription factors. (A) Graphical representations of waterlogging-responsive transcription factors, based on the assigned gene families. (BD) A heatmap analysis of ERF, bHLH and WRKY families in ‘L39’ and ‘L45’, under control and waterlogging stress conditions. The levels of gene expression are shown by log10(FPKM+1).
Horticulturae 08 00891 g009
Table 1. Summary of transcriptome data after filtering.
Sample
Name
Raw Reads NumberClean Reads NumberClean Bases (Gb)Q20 (%)Q30 (%)GC (%)Clean reads Ratio (%)
L39_C147,362,35643,584,0006.54 99.9897.9745.00 92.02
L39_C245,108,81041,493,2786.22 99.9898.0844.00 91.98
L39_W147,284,19641,121,9866.17 99.9997.9045.00 86.97
L39_W245,691,52441,184,5586.18 99.9898.0743.50 90.14
L45_C144,275,17838,287,4945.74 99.9897.9847.00 86.48
L45_C246,621,72842,792,3526.42 99.9898.0345.00 91.79
L45_W145,658,89042,021,1726.30 99.9898.0344.00 92.03
L45_W244,756,74441,165,8626.17 99.9898.0644.00 91.98
Publisher’s Note: MDPI stays neutral with regard to jurisdictional claims in published maps and institutional affiliations.