Article

Signal Intensity of Stem Diameter Variation for the Diagnosis of Drip Irrigation Water Deficit in Grapevine

Key Laboratory of Agricultural Soil and Water Engineering in Arid and Semiarid Areas, Ministry of Education, Northwest A&F University, Yangling 712100, China
*
Author to whom correspondence should be addressed.
Horticulturae 2021, 7(6), 154; https://doi.org/10.3390/horticulturae7060154
Submission received: 16 May 2021 / Revised: 6 June 2021 / Accepted: 9 June 2021 / Published: 15 June 2021

Abstract

:
Precise irrigation management of grapevines in greenhouses requires a reliable method to easily quantify and monitor the grapevine water status to enable effective manipulation of the water stress of the plants. This study describes a study on stem diameter variations of grapevine planted in a greenhouse in the semi-arid area of Northwest China. In order to determine the applicability of signal intensity of stem diameter variation to evaluate the water status of grapevine and soil. The results showed that the relative variation curve of the grapevine stem diameter from the vegetative stage to the fruit expansion stage showed an overall increasing trend. The correlations of MDS (maximum daily shrinkage) and DI (daily increase) with meteorological factors were significant (p < 0.05), and the correlations with SWP, RWC and soil moisture were weak. Although MDS and DI can diagnose grapevine water status in time, SIMDS and SIDI have the advantages of sensitivity and signal intensity compared with other indicators. Compared with MDS and DI, the R2 values of the regression equations of SIMDS and SIDI with SWP and RWC were high, and the correlation reached a very significant level (p < 0.01). Thus, SIMDS and SIDI are more suitable for the diagnosis of grapevine water status. The SIMDS peaked at the fruit expansion stage, reaching 0.957–1.384. The signal-to-noise ratio of SIDI was higher than that of MDS across the three treatments at the vegetative stage. The value and signal-to-noise ratio of SIDI at the flowering stage were similar to those of SIMDS, while the correlation between SIDI and the soil moisture content was higher than that of SIMDS. It can be concluded that that SIDI is suitable as an indicator of water status of grapevine and soil during the vegetative and flowering stages. In addition, the signal-to-noise ratio of SIMDS during the fruit expansion and mature stages was significantly higher than that of SIDI. Therefore, SIMDS is suitable as an indicator of the moisture status of grapevine and soil during the fruit expansion and mature stages. In general, SIMDS and SIDI were very good predictors of the plant water status during the growth stage and their continuous recording offers the promising possibility of their use in automatic irrigation scheduling in grapevine.

1. Introduction

Fruit tree orchards are common in arid and semi-arid areas where water for irrigation is scarce. This, together with an increasing world population that has to be fed and with other water-using sectors competing for the limited water resources, makes the use of precise irrigation techniques in those orchards unavoidable. The response of the scientific community to this challenge has been to invest a substantial amount of research in the development of deficit irrigation approaches [1,2] and of new irrigation technologies based on more-precise, user-friendly water-stress indicators. Some can be continuously and automatically recorded, having a great potential for irrigation scheduling [3].
In recent years, it has become very popular to study the relationship between plant and water based plant water status indicators [4]. There are many ways to monitor and diagnose crop water status. From the perspective of plant physiology, the short-term microchange dynamics of plant organs (stems, leaves, fruits, etc.) are closely related to the water status of plants and have been widely focused on by many scholars [2,3,4]. The most widely used approach for evaluating plant water status has been to determine leaf [5,6], stem water potential [6] and leaf water content [7,8,9,10]. Plant water potential is a significant and reliable indicator of plant water status for scheduling the irrigation of plants. Argyrokastritis et al. [5] established the relationship between leaf water potential and water stress index, which can well characterize the water deficit status of plants. Wang et al. [6] used leaf and stem water potential to characterize the water status of grapevine, which can well judge whether the grapevine is in deficit state and determine when to need irrigation. However, the main disadvantage of plant water potential is the relatively cumbersome measurement procedure, including the necessity of frequent trips to the field and a considerable input of labor. The robustness of the sensors used to measure stem diameter fluctuations have renewed interest in using these parameters as plant water status indicators [1,6,11,12]. Apart from being capable of an early detection of water stress, even if this is mild, these techniques permit continuous and automated recordings of the plant water status and an immediate, consistent and reliable response to water deficit [13,14,15].
Monitoring crop moisture conditions using the stem diameter microchange method has been popular since the mid-1980s. The microchange of plant stem diameter is closely related to its water status, when the root system absorbs enough water, the stem expands gradually, and when the water is deficient, the stem shrinks gradually. Therefore, it is possible to diagnose the water status of the plant with the microchange of stem diameter, which can provide an index for the real-time prediction of crop water shortage and precision irrigation [12,16,17]. Today, in fact, fruit tree orchards and vineyards are being irrigated based on changes in the stem diameter [18,19]. Among them, MDS and DI indexes are commonly studied today as the indicators of plant water content [20,21,22]. According to some previous studies, the ability of an index to be suitable for use as a water diagnosis indicator was mainly evaluated in terms of three qualities: sensitivity, signal intensity and variability. An appropriate indicator should have better sensitivity and signal intensity to water stress and exhibit less variability [4,14,23]. However, the disadvantage of this method is that it cannot determine whether the critical value is independent of crop species or growth stage. In addition, meteorological factors have a great influence on MDS under the same water conditions [24]. The maximum stem diameter over time can be used to diagnose water deficit, but the growth rate of the crop is different at different growth stages. Under high evaporation intensity at the mature stage, crop stems may also shrink even if the crop does not lack water, and the variation in daily MXSD (maximum stem diameter) has no more significance [25]. Therefore, it may be difficult to apply the MDS of stem diameter as a crop moisture stress signal in practice.
The observation of stem diameter and its dynamic changes is beneficial to the study of plant moisture changes under interlaced internal and external factors. However, the observation of stem diameter is easily influenced by meteorological factors [26,27,28]. How to eliminate the interference of external environmental factors on the variation in stem diameter is always the difficulty in determining the most appropriate indicator. Due to the influence of other factors, it was difficult to diagnose plant water content. Only the observed values of stem diameter variation and the prediction values of stem diameter variation under no water stress, should be calculated to assist in the diagnosis. The comparison of MDS and DI with reference factors (relative values) can be used to directly reflect crop water status. The signal intensity is obtained by standardizing the reference value of the stem diameter indicator under fully irrigated conditions and the measured value of actual growth conditions, which can effectively eliminate the influence of meteorological factors [29]. Thus, the accuracy of these equations is very important to future studies, as these equations are the foundation for diagnosing plant water content and making irrigation schemes based on plant stem diameter variations. Currently, existent studies concentrate mostly on the grapevine stem diameter variations in outdoor conditions and seldom did it to grapevines planted in a greenhouse [22,30,31]. In addition, the past research on the variation in stem diameter has mainly focused on the feasibility of moisture diagnosis, maximum daily shrinkage, daily increase, and other stem diameter indicators, which have been verified for use in the moisture status diagnosis of different crops [11,24,32,33,34]. The variation in stem diameter is influenced by environmental factors and the crop growth characteristics. The difference in crop growth at different growth stages may significantly affect the potential of stem diameter variation indicators for use in determining irrigation regimes. Therefore, different indicators should be applied in different growth stages [26]. There have been few reports on this topic, and further research is needed.
For these reasons above mentioned, this research selected the greenhouse grapevine as the study object. Because of its rich nutrition and delicious taste, grapevine has become a kind of world major fruit. In China, grapevines have been widely cultivated as well, and a considerable part among them are planted in sunlight greenhouses. Due to the present water shortage in the Northwest China, it is important to acquire accurate crop water content information and timely plan water-saving irrigation schemes, which benefit the sustainable development of local agriculture. Thus, the main aims of this study were as follows: (1) to explore the relative variation in the changes in MDS and DI in stem diameter during different stages; (2) to clarify the correlation of microchanges in stem diameter with stem water potential, leaf relative water content, and soil water content; (3) to evaluate whether SIMDS and SIDI can be applied to diagnose grapevine moisture and soil moisture status; (4) to analyze the sensitivity of signal intensity indicators and to determine the suitability of SIMDS and SIDI under different stages.

2. Materials and Methods

2.1. Study Area

The experiment was carried out in greenhouse of Yuhe Farm, Shaanxi Province, from March to July 2018 (108.58° E, 37.49° N). The annual average rainfall in this area is 365.7 mm, the annual average temperature is 8.3 °C, the annual relative humidity is 69.37%, and the annual average duration of sunshine is 2893.5 h, which is representative of the typical continental marginal monsoon climate of the area. Table 1 shows the meteorological data (cultivation stage averages) recorded over the experimental year. The test soil was an aeolian sandy soil. The chemical properties of the soil were as follows: the soil ammonium nitrogen was 7.48 mg·kg−1, the nitrate nitrogen was 22.91 mg·kg−1, the available phosphorus was 4.07 mg·kg−1, and the available potassium was 163.47 mg·kg−1. The physical properties of the soil are shown in Table 2.

2.2. Experimental Design

Six-year-old grapevine (early-maturing variety 6–12, which was selected from the scarlet bud transformation in 1998) were planted in greenhouse, and grapevines with good growth and similar shapes were selected for the experiments. The entire growth period of grapevines can be divided into four main growth stages: the vegetative stage, the flowering stage, the fruit expansion stage, and the coloring mature stage, the cultivation period was 121 days during the growth season. The greenhouse was oriented east-west and was 70 m long and 9 m wide. The grapevine row width and row spacing were 0.8 m and 1.5 m, respectively, and the plant spacing was 0.6 m, with 14 grapevines per row. Artificial warming was carried out in greenhouse to ensure the growth temperature of grapevines on 11 March 2018. Drip irrigation was used in the experiment. A single-wing labyrinth drip irrigation belt (produced by Xinjiang Dayu Water Saving Company, Xinjiang, China) was adopted. The inner diameter and wall thickness of drip irrigation belt was 0.02 m and 0.018 m, respectively. the distance between the drippers was 0.3 m, the design flow of the dripper was 4.0 L·h−1, and the laying mode of the drip belt was one row of two pipes.
The experiment was conducted with drip-irrigated grapevines under three irrigation treatments: a full irrigation treatment (T1:100% M) and two regulated deficit irrigation treatment (T2: 80% M; T3: 60% M), M represents the irrigation quota. There were three treatments in total and three plots per treatment (each plot had a length of 8 m, a width of 4.5 m, and an area of 36 m2), with a random block arrangement. The irrigation dates and irrigation amount is shown in Table 3, the grapevines were irrigated 12 times during the entire growth period. The irrigation quota was calculated by Equation (1). The irrigation time was determined according to whether or not T1 reached the lower limit of the water quantity, which was 65% of β 1 at the vegetative and coloring mature stages and 70% of β 1 at the flowering and fruit expansion stage. The predicted wet layer depth of the soil was 0.8 m. The total amount of fertilization during the entire growth period was 0.84 t·ha−1, and the proportion of N:P:K was 1.0:0.6:1.2. Fertilization was carried out over three periods: the germination stage accounted for 20% of the total amount of fertilization, the flowering and fruit expansion stages accounted for 60%, and the coloring mature stage accounted for 20%. The drip irrigation and fertilization were controlled by integrated irrigation and fertilization equipment.
M = 0.1 γ s H P ( β 1 β 2 )
where M represents the irrigation quota, mm; γ s represents the soil dry bulk density, 1.64 g·cm−3 in 0–40 cm soil depth, 1.46 g·cm−3 in 40–80 cm soil depth; H is the predicted wet layer depth of soil, 0.8 m; P is the designed wet soil ratio, 0.8; β 1 is the field water holding capacity, 13.18% in 0–40 cm soil depth, 17.45% in 40–80 cm soil depth; and β 2 is the lower limit of the soil moisture content, 65% of β 1 at the vegetative and coloring mature stages and 70% of β 1 at the flowering and fruit expansion stage.

2.3. Observation Indicators

2.3.1. Meteorological Factors

All meteorological data are automatically measured and recorded every 30 min using a Watchdog micro series (Spectrum Technologies Inc., Chicago, IL, USA) meteorological station in the middle of the greenhouse. The monitoring indicators includes air temperature (Ta), relative humidity (RH), solar radiation (Ra) and other meteorological parameters. The vapor pressure deficit (VPD) was estimated by the RH and Ta and was calculated by the modified Penman formula. The formula [35] was as follows (2):
V P D = 0.6108 × E X P ( 17.27 × T a T a + 237.3 ) × ( 1 R H 100 )

2.3.2. Soil Moisture Content

The soil moisture automatic monitoring system consisted of an EM50 data recorder (Environmental Logging System, Decision Devices, Inc., Pullman, WA, USA) and four ECH2O5TE sensors (Decision Devices, Pullman, WA, USA). The soil moisture automatic monitoring system was installed 30 cm from the base of the grapevines and perpendicular to the planting row. Three representative grapevines were selected, and three monitoring systems were installed for each treatment. A sensor was installed every 20 cm, the buried depth was 80 cm, the soil volume moisture content was recorded every 30 min. Before the beginning of the growing season, in order to ensure the accuracy of the ECH2O5TE sensor, soil samples were taken every 20 cm with a soil drill until 80 cm, and the soil moisture content was calculated by drying method. At the same time, the data recorded by the ECH2O5TE sensor in different soil layers were recorded. Three days of soil moisture data were used to calibrate ECH2O5TE by drying method. The regression equation was established by regression analysis between the soil water content calculated by drying method and the soil water content monitored by ECH2O5TE. In addition, the same method was used to calibration ECH2O5TE every 10 days during grape growth.

2.3.3. Stem Diameter Microchanges

The stem diameter microchanges were automatically monitored continuously using a DEX20 (Dynamax, USA, 0.050 mm) instrument. The instrument was installed at the stem 10 cm above the ground, with a maximum displacement of 5 mm and a recording interval of 30 min. The relative variation (RV) in stem diameter was defined as the change value at the time of probe installation, and the grapevine stem diameters were inconsistent when the sensor was installed due to differences among different plants. To explain the difference in plant growth caused by different water treatments, the initial value of stem diameter at the time of sensor installation in each growth period was set to 1 mm, so that the three treatments could be compared easily. The maximum daily shrinkage (MDS) was calculated by subtracting the minimum stem diameter (MNSD) from the maximum stem diameter (MXSD). Periodic changes in stem diameter were observed daily; MXSD usually occurred in the early morning and MNSD occurred at noon. The daily increase (DI) of stem diameter was obtained by subtracting the daily MXSD from that of the day before.

2.3.4. Stem Water Potential and Relative Water Content of Leaves

The pressure chamber (TP-PW-II, Top Cloud-agri Technology Company, Zhejiang, China) was used to measure the stem water potential ( φ s ) every 5–7 days, and the φ s is measured at 9:00 to 10:00 BJS. Three grapevines were selected for each treatment, and one branch under good growth conditions was selected as the sample on the sunny side outside the crown. The sample was put into a plastic bag containing moist gauze and quickly brought into the laboratory. The sample was clamped in a pressure chamber and pressurized by gas (compressed nitrogen), the pressure used for exudation of tissue fluid was observed. At this time, the pressure value was the stem water potential.
The relative water content (RWC) of leaves was determined by the drying method. The selection and determination of leaves were the same as those used for leaf water potential measurement. After weighing the fresh weight, the leaves were immersed in water for 12 h and then taken out. The water on the surface of the leaves was wiped with absorbent paper and weighed. Then, the leaves were immersed in water for 1 h, taken out, wiped dry and weighed until reaching a consistent weight. After 0.5 h of dehumidification at 105 for 0.5 h, the leaves were dried to constant weight at 80 . Leaf relative water content (RWC) = (initial fresh weight − dry weight)/(saturated fresh weight − dry weight) × 100%.

2.3.5. Signal Intensity Calculation of Stem Diameter Indicator

The reference value is usually calculated by the stem diameter indicator under non-water stressed conditions or by substituting the meteorological indicator into the reference equation [21]. The calculation formulas of SIMDS and SIDI are as follows:
SIMDS = Measured MDS/Reference MD
SIDI = Measured DI/Reference DI
In this study, the regression equation between the MDS and DI of stem diameter and meteorological factors showed that the correlation between the MDS and DI of three treatments and Ta was the best. The soil moisture of the W1 treatment always remained above 65% of the field capacity at the vegetative and mature stages and 70% of the field capacity at the flowering stage and fruit expansion stage. The reference equation for stem diameter was established between the MDS and DI values of the W1 and Ta to calculate the reference value of MDS and DI for each growth stage.

2.3.6. Flexible Evaluation of Signal Intensity

High variability indicators need to be measured many times to reduce error, which increases the costs of such methods. Therefore, the intensity and variability (coefficient of variance, CV) of indicators should also be considered. When soil moisture changes, the ratio of signal intensity (SI) to noise is greater in the short term, indicating that the indicator is more suitable for moisture status diagnosis [36]. The formula for calculating the signal-to-noise ratio is shown in formula (5).
Signal-to-noise ratio = signal intensity/coefficient of variation

2.4. Data Analysis

The correlation and regression analysis were carried out using SPSS 21.0 software (SPSS Inc., Chicago, IL, USA). Multiple comparisons were performed by least significant difference tests, with a significance level of 0.05. Microsoft Excel 2010 Software was used for processing data. The graphs were created by using Origin 2018. Correlation analysis was conducted between MDS, DI, SIDI, SIMDS and meteorological factors; The relationships between MDS, DI, SIDI, SIMDS and SWP, RWC as well as between MDS, DI, SIDI, SIMDS and soil water content were analyzed through regression analyses. In all cases, the coefficient of determination (R2) was used to assess the goodness of fit of the associations among variables.

3. Results

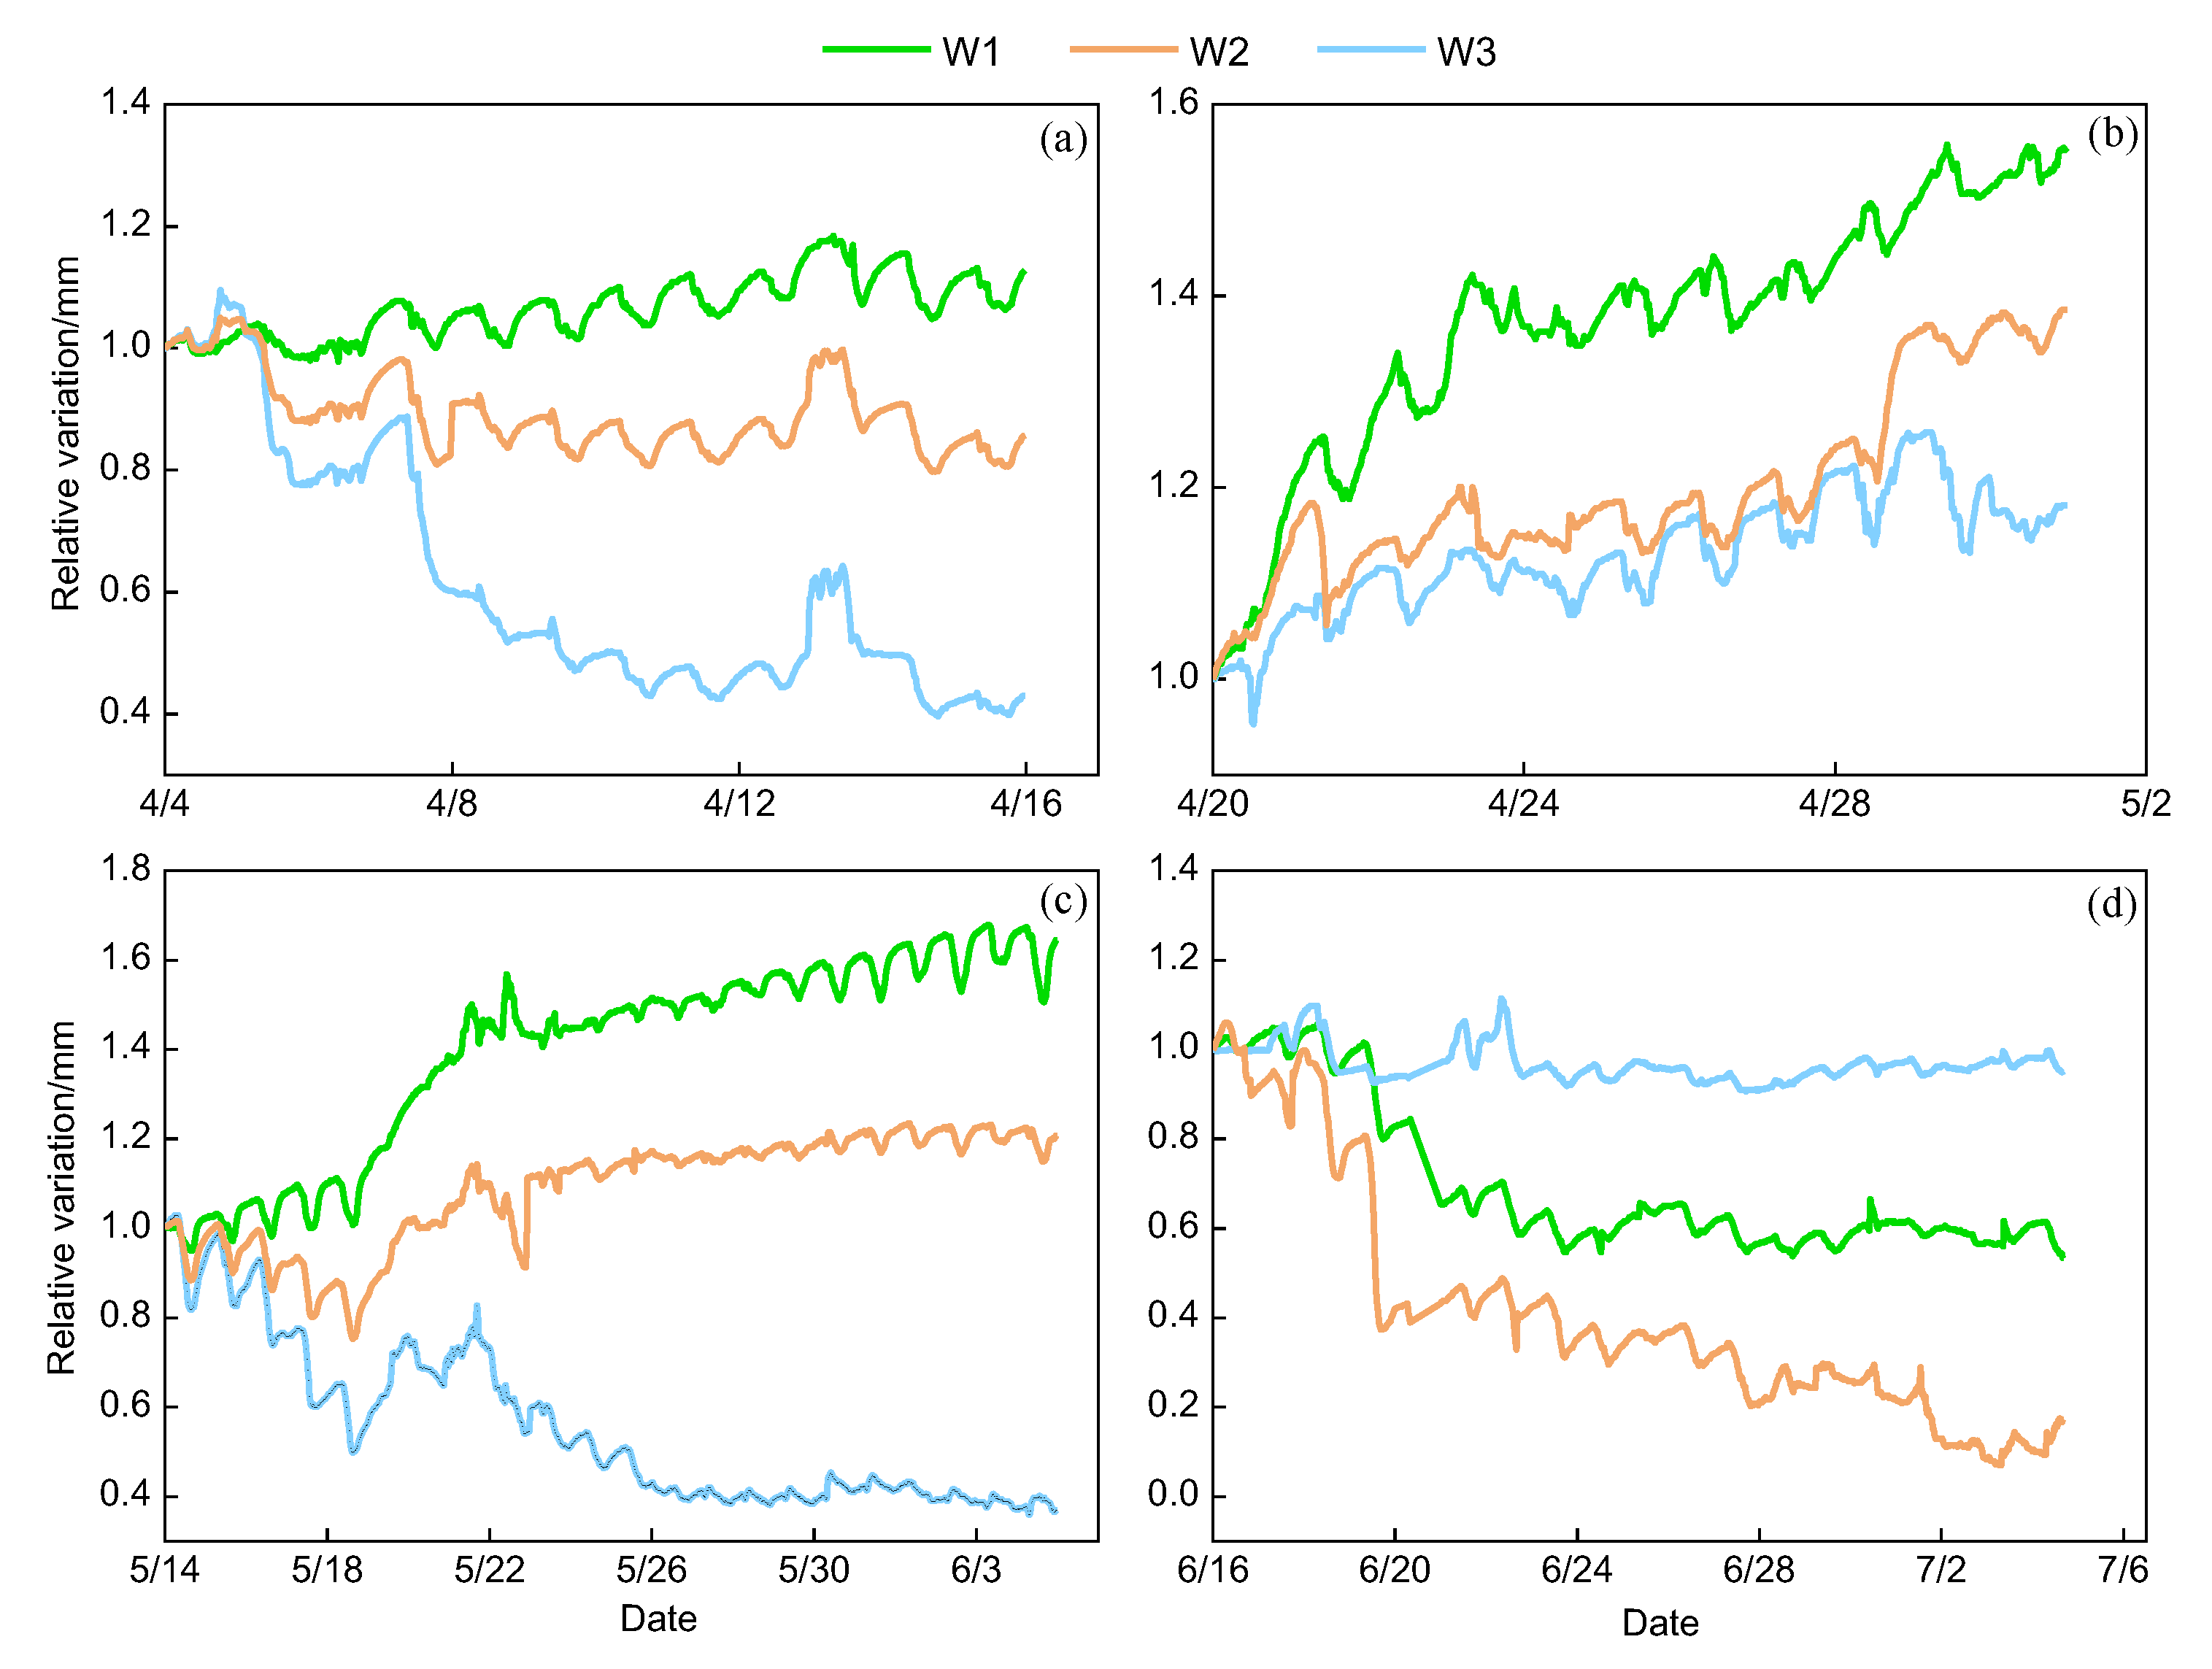
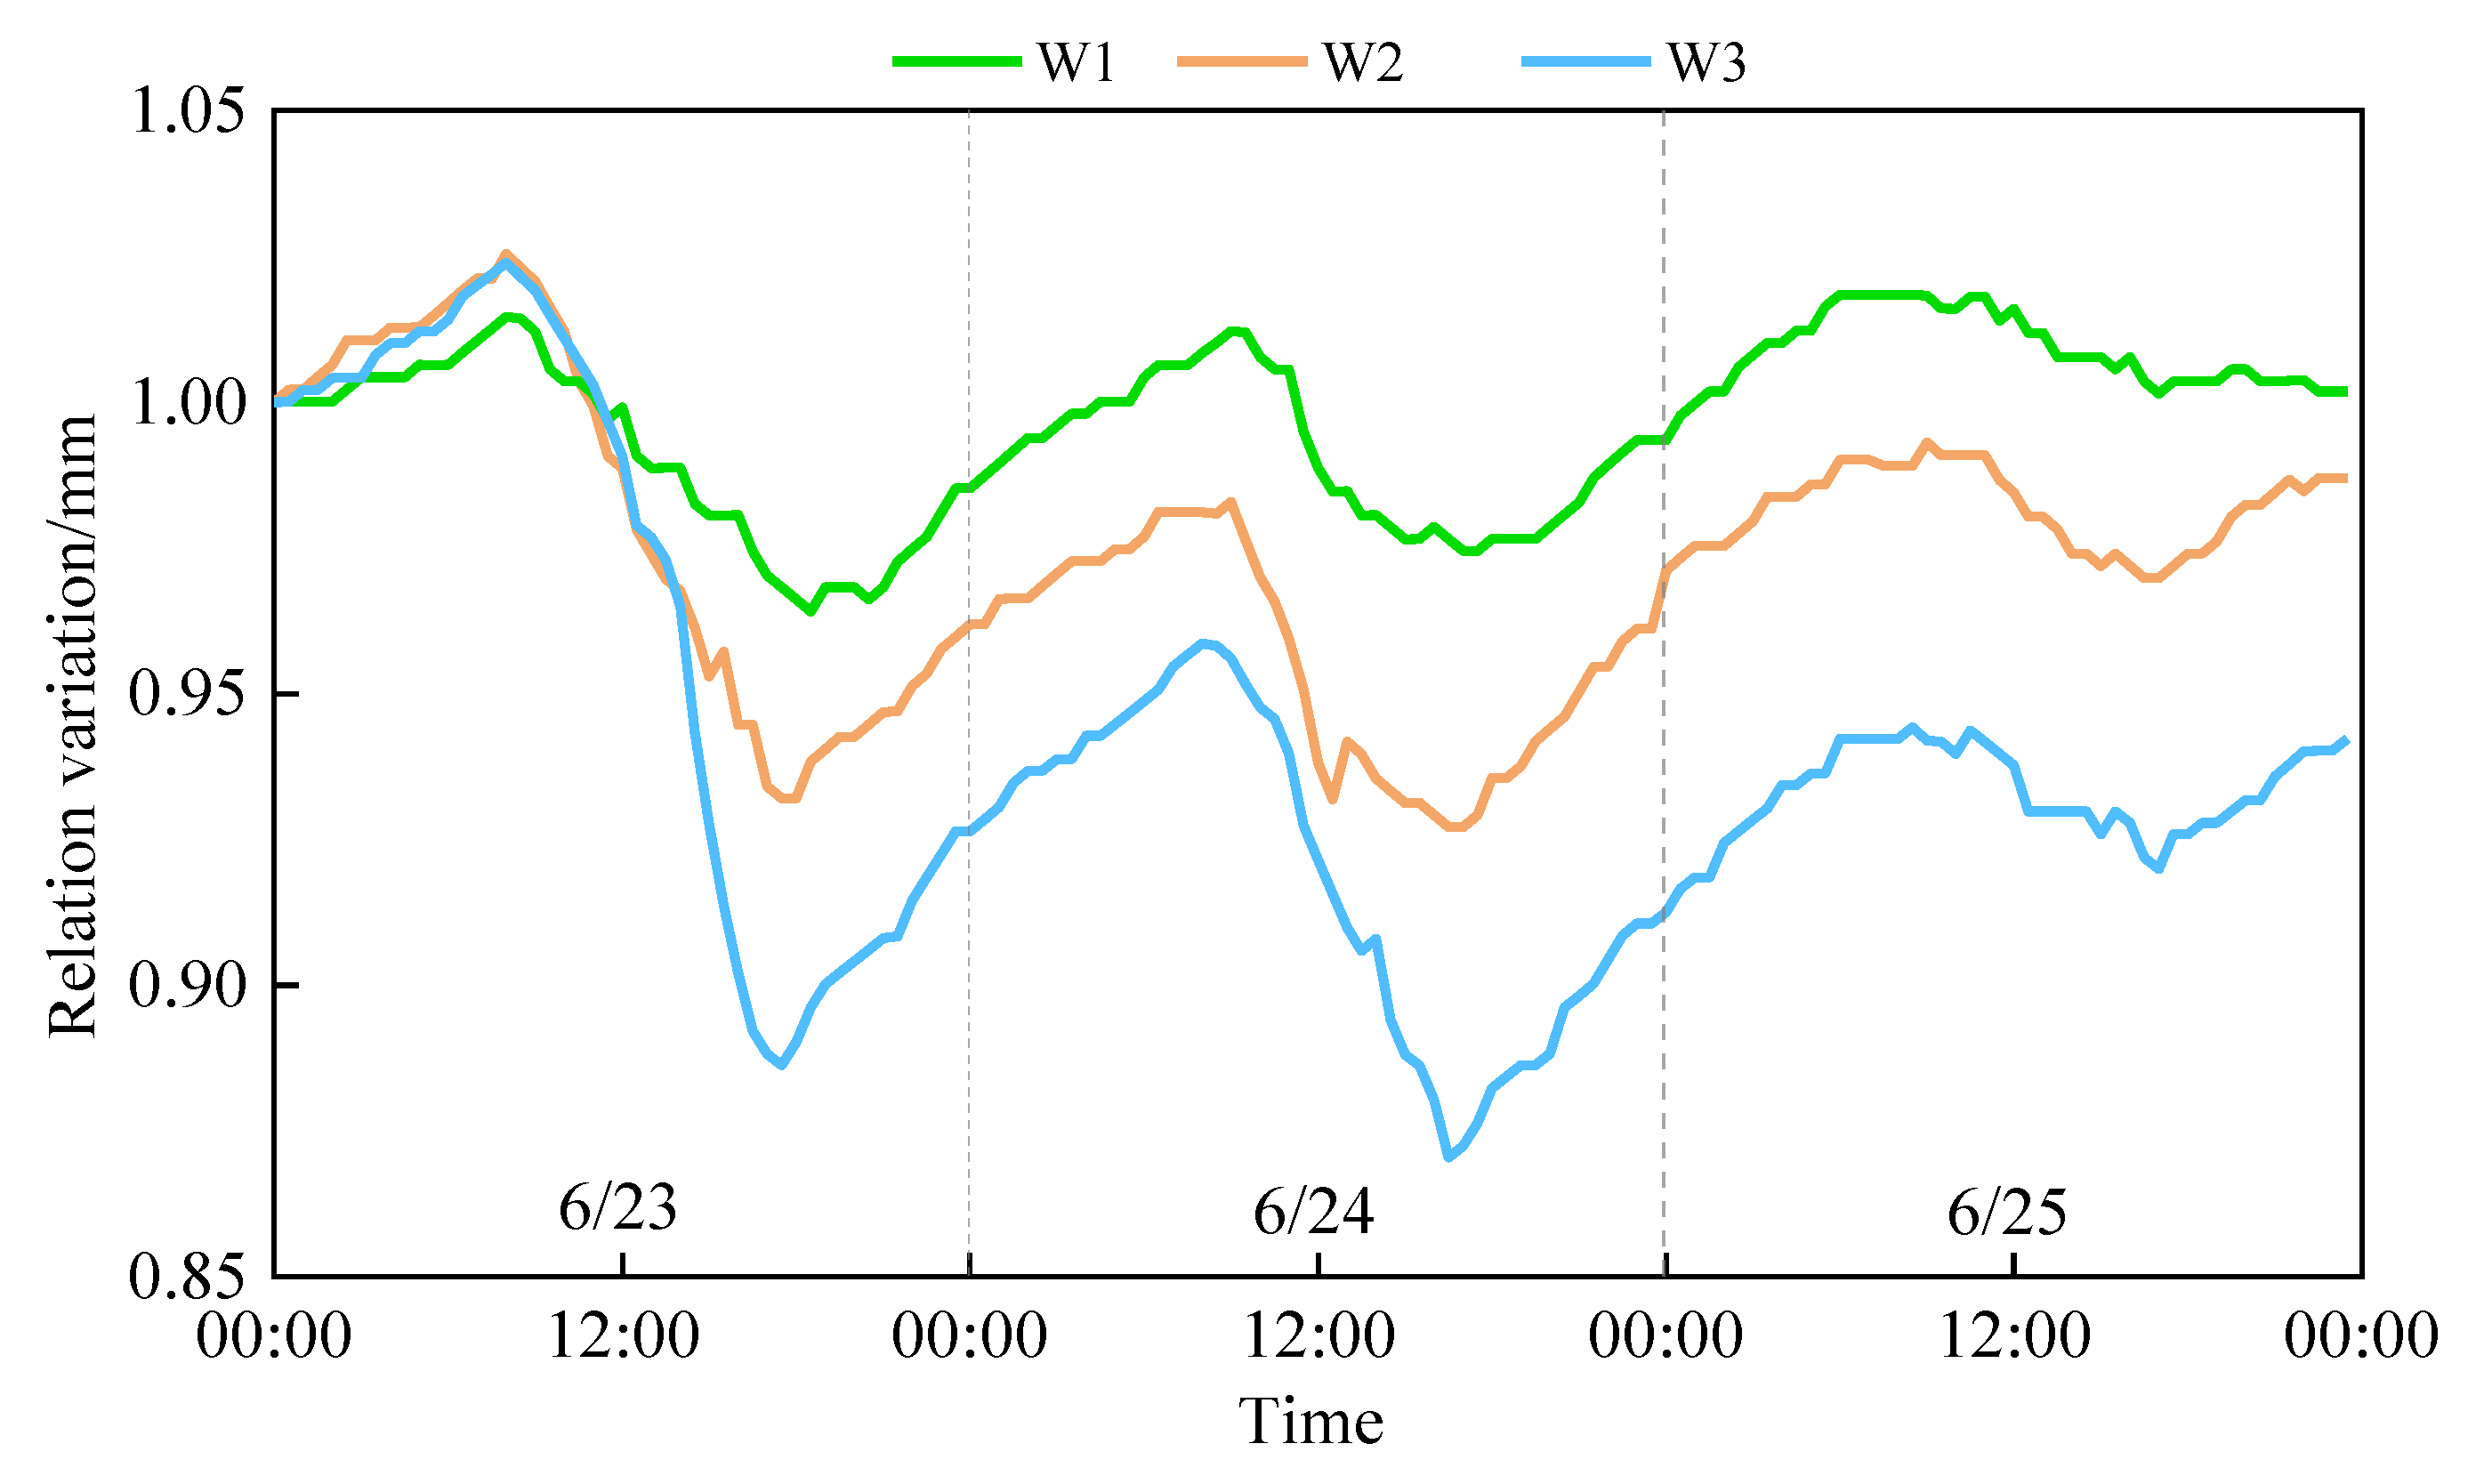
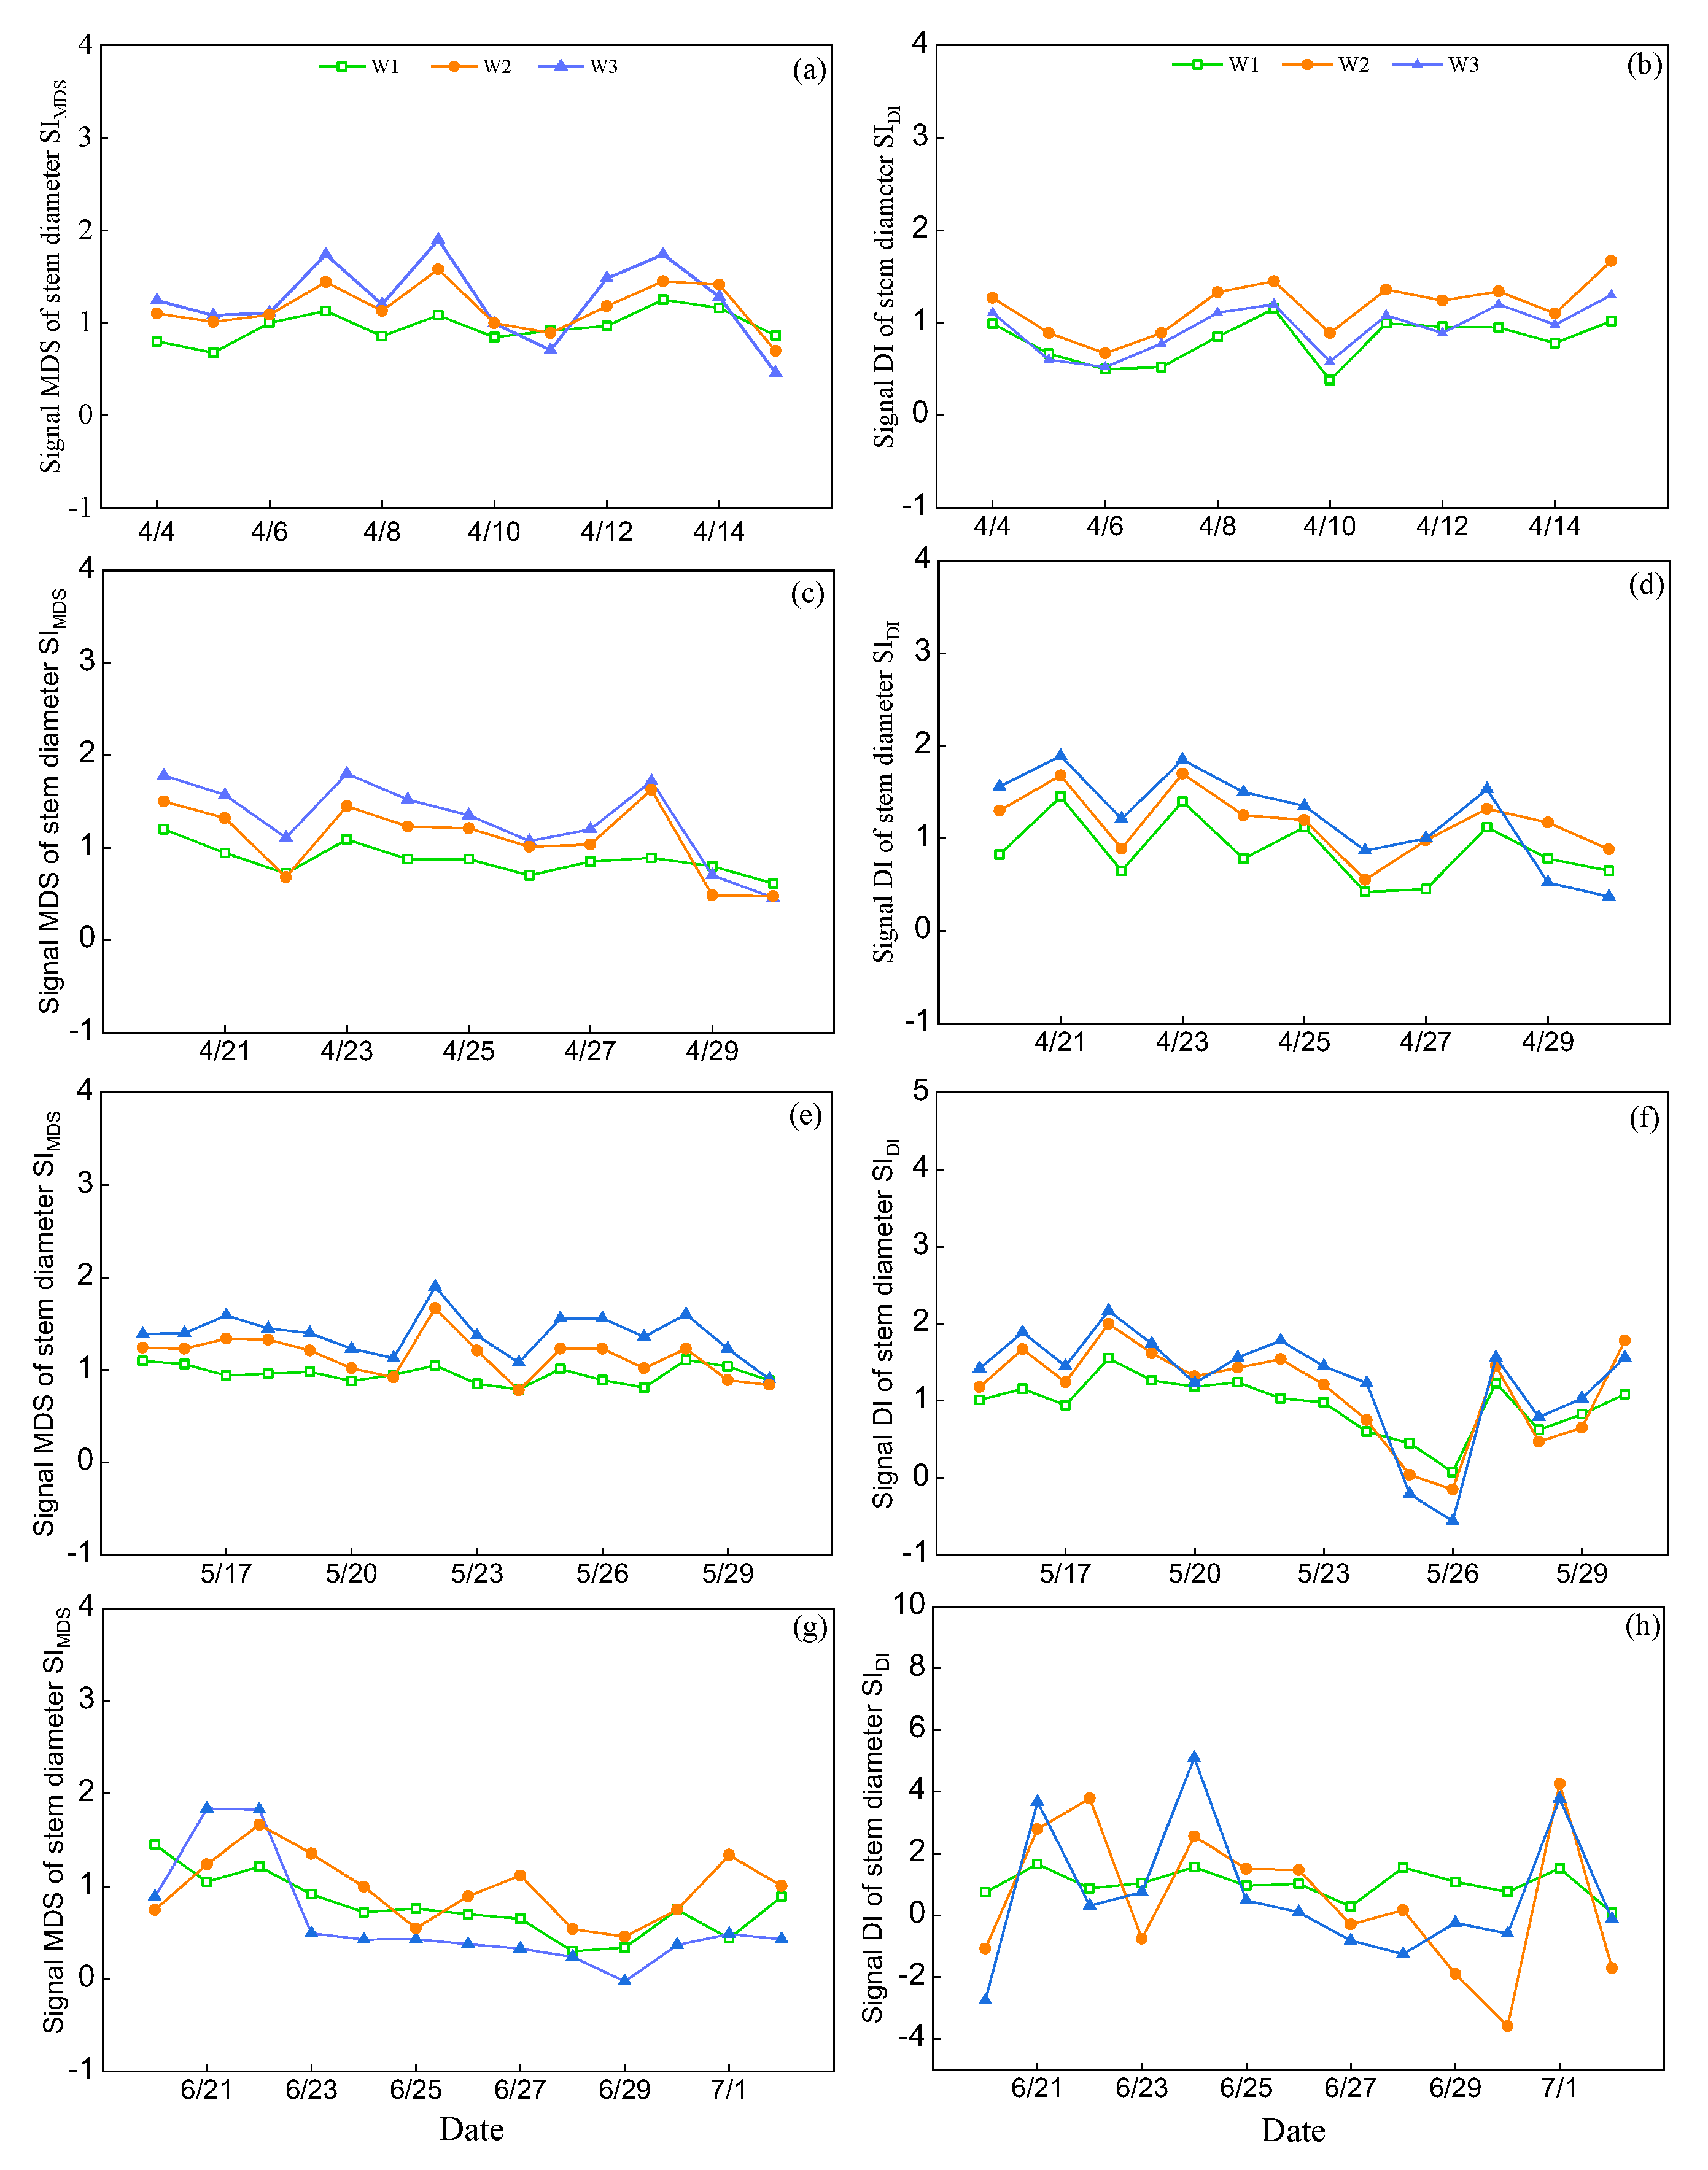
3.1. The Relative Variation of Stem Diameter under Different Stages

The relative variation (RV) curve of stem diameter under different stages showed a 24 h up and down cycle, and different irrigation amounts had different influences on the stem diameter of grapevine (Figure 1). The total increase in stem diameter was 0.128 mm under W1, while those of W2 and W3 fluctuated and decreased. The stem diameter of W3 began to decrease sharply after 7 April, and the total increase in stem diameter under W2 and W3 was −0.143 and −0.570 mm, respectively (Figure 1a). There was a certain difference in the RV curve between the vegetative and flowering stages, and the RV curves of stem diameter under three treatments showed an up and down growth trend (Figure 1b). In terms of the total increase in stem diameter, W1 was the largest (0.555 mm), and W2 and W3 showed values 69.55% and 32.79% of that under W1, respectively.
There were significant differences in the RV curve of stem diameter among different treatments during the fruit expansion stage (Figure 1c). The RV curve of W1 showed an upward trend, and the RV curve of W2 fluctuated by approximately 1 mm. Before irrigation on 20 May, the RV curve of the W3 treatment showed a decreasing fluctuating trend, the diameter of the stem recovered after irrigation, and the recovery effect gradually weakened when the soil moisture content gradually decreased. The stem diameter recovered values under W2 and W3 were 86.28% and 72.79% of that under W1, respectively. The stem diameter RV under W3 remained stable at approximately 0.4 mm after 25 May. The RV curve of W1 and W2 showed a decreasing trend during the mature stage (Figure 1d), the RV curve of W3 fluctuated at 1 mm, but the three treatments still had significant shrinkage. The contractions under W1 and W2 were more pronounced than those under W3. The total increase in stem diameter among the three treatments was negative.
The daily change of stem diameter was the same under three treatments (Figure 2), it showed a trend of first increasing, then decreasing, and then increasing over 24 h. The MDS of the stem diameter showed significant differences under three treatments. The MDS of W3 was the largest at 0.138 mm, and W1 was the lowest at 0.051 mm. The stem diameter of W1 could recovered to the maximum of the previous day and continued to grow. However, the stem diameter under W2, W3 could not recover to the maximum of the previous day owing to moisture stress, and growth of both W1 and W2 appeared negative. The MXSD and MNSD of three treatments appeared at the same time on rainy days, which included that rainy weather had no significant effect on the occurrence time of MXSD and MXSD under different treatments. The variation in Ra, Ta and RH on rainy days was smaller than that on sunny days, and the degree of stem diameter contraction was also lower on rainy days than that on sunny days, which showed meteorological factors may be the main force affecting the variation in stem diameter. We can conclude that MDS decreased with increasing irrigation amount, the influence of meteorological factors and soil moisture on the variation in stem diameter was interactive.

3.2. Evaluation of Applicability as a Moisture Diagnosis Indicator

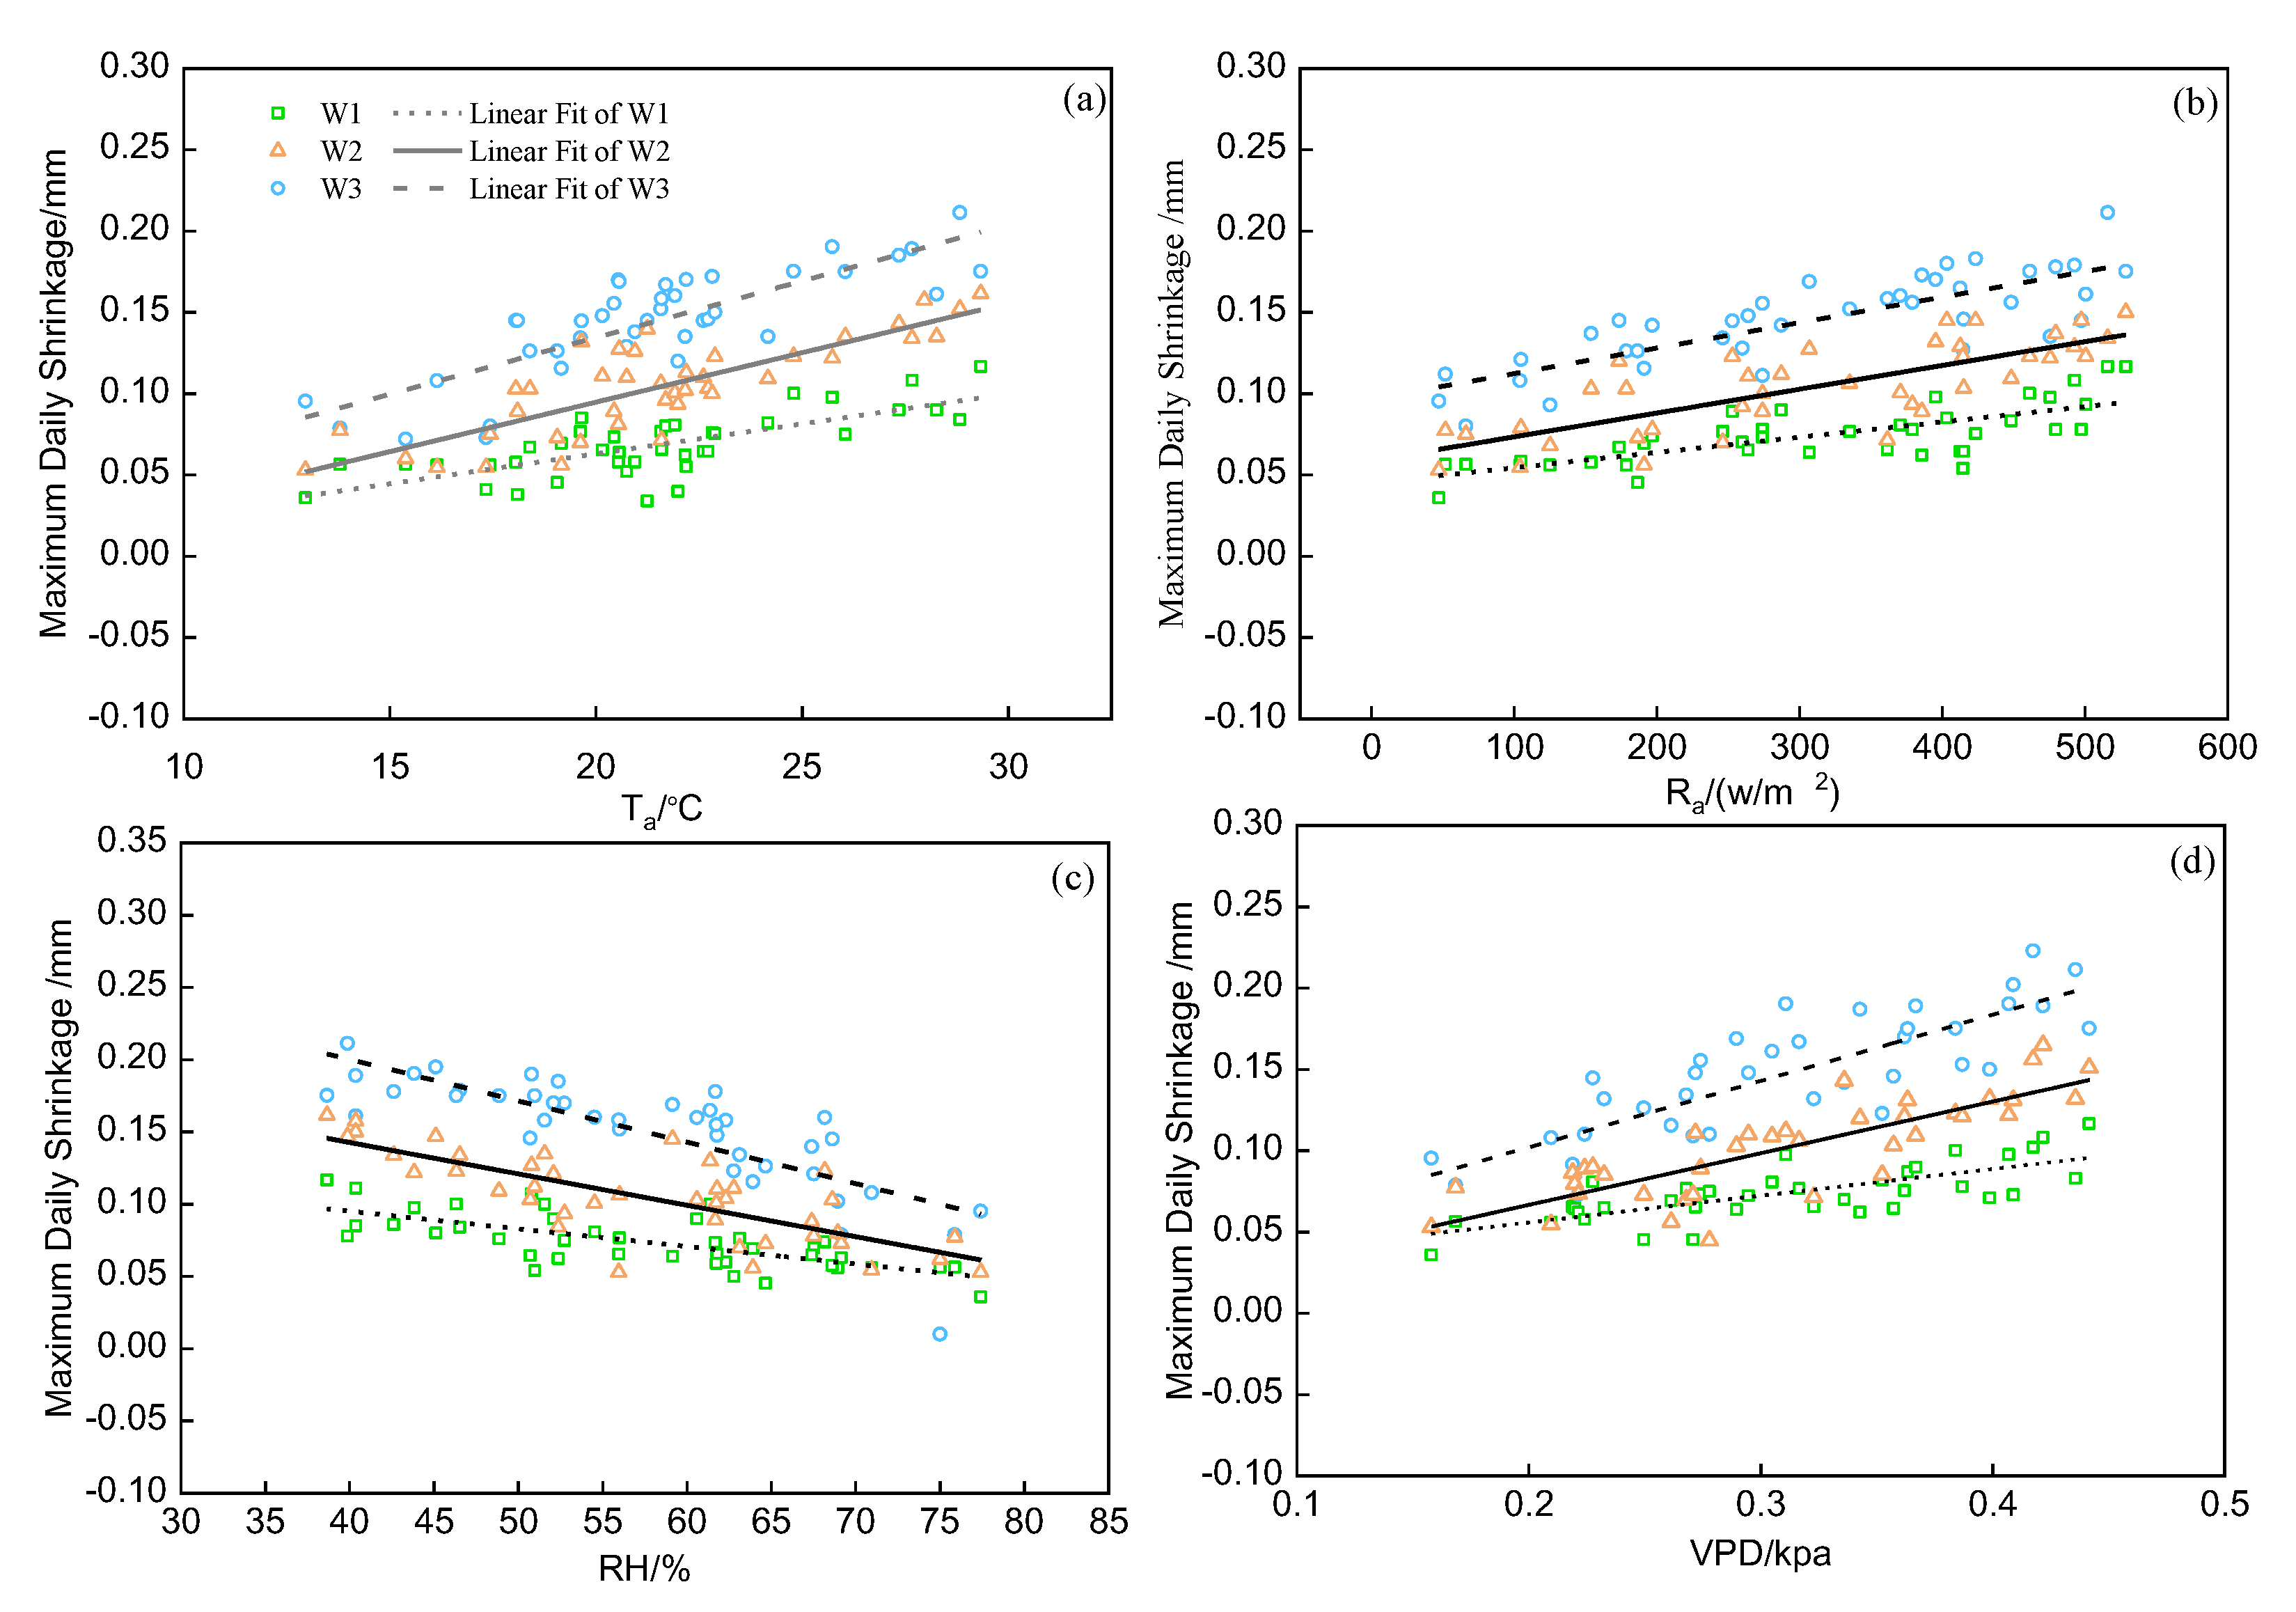
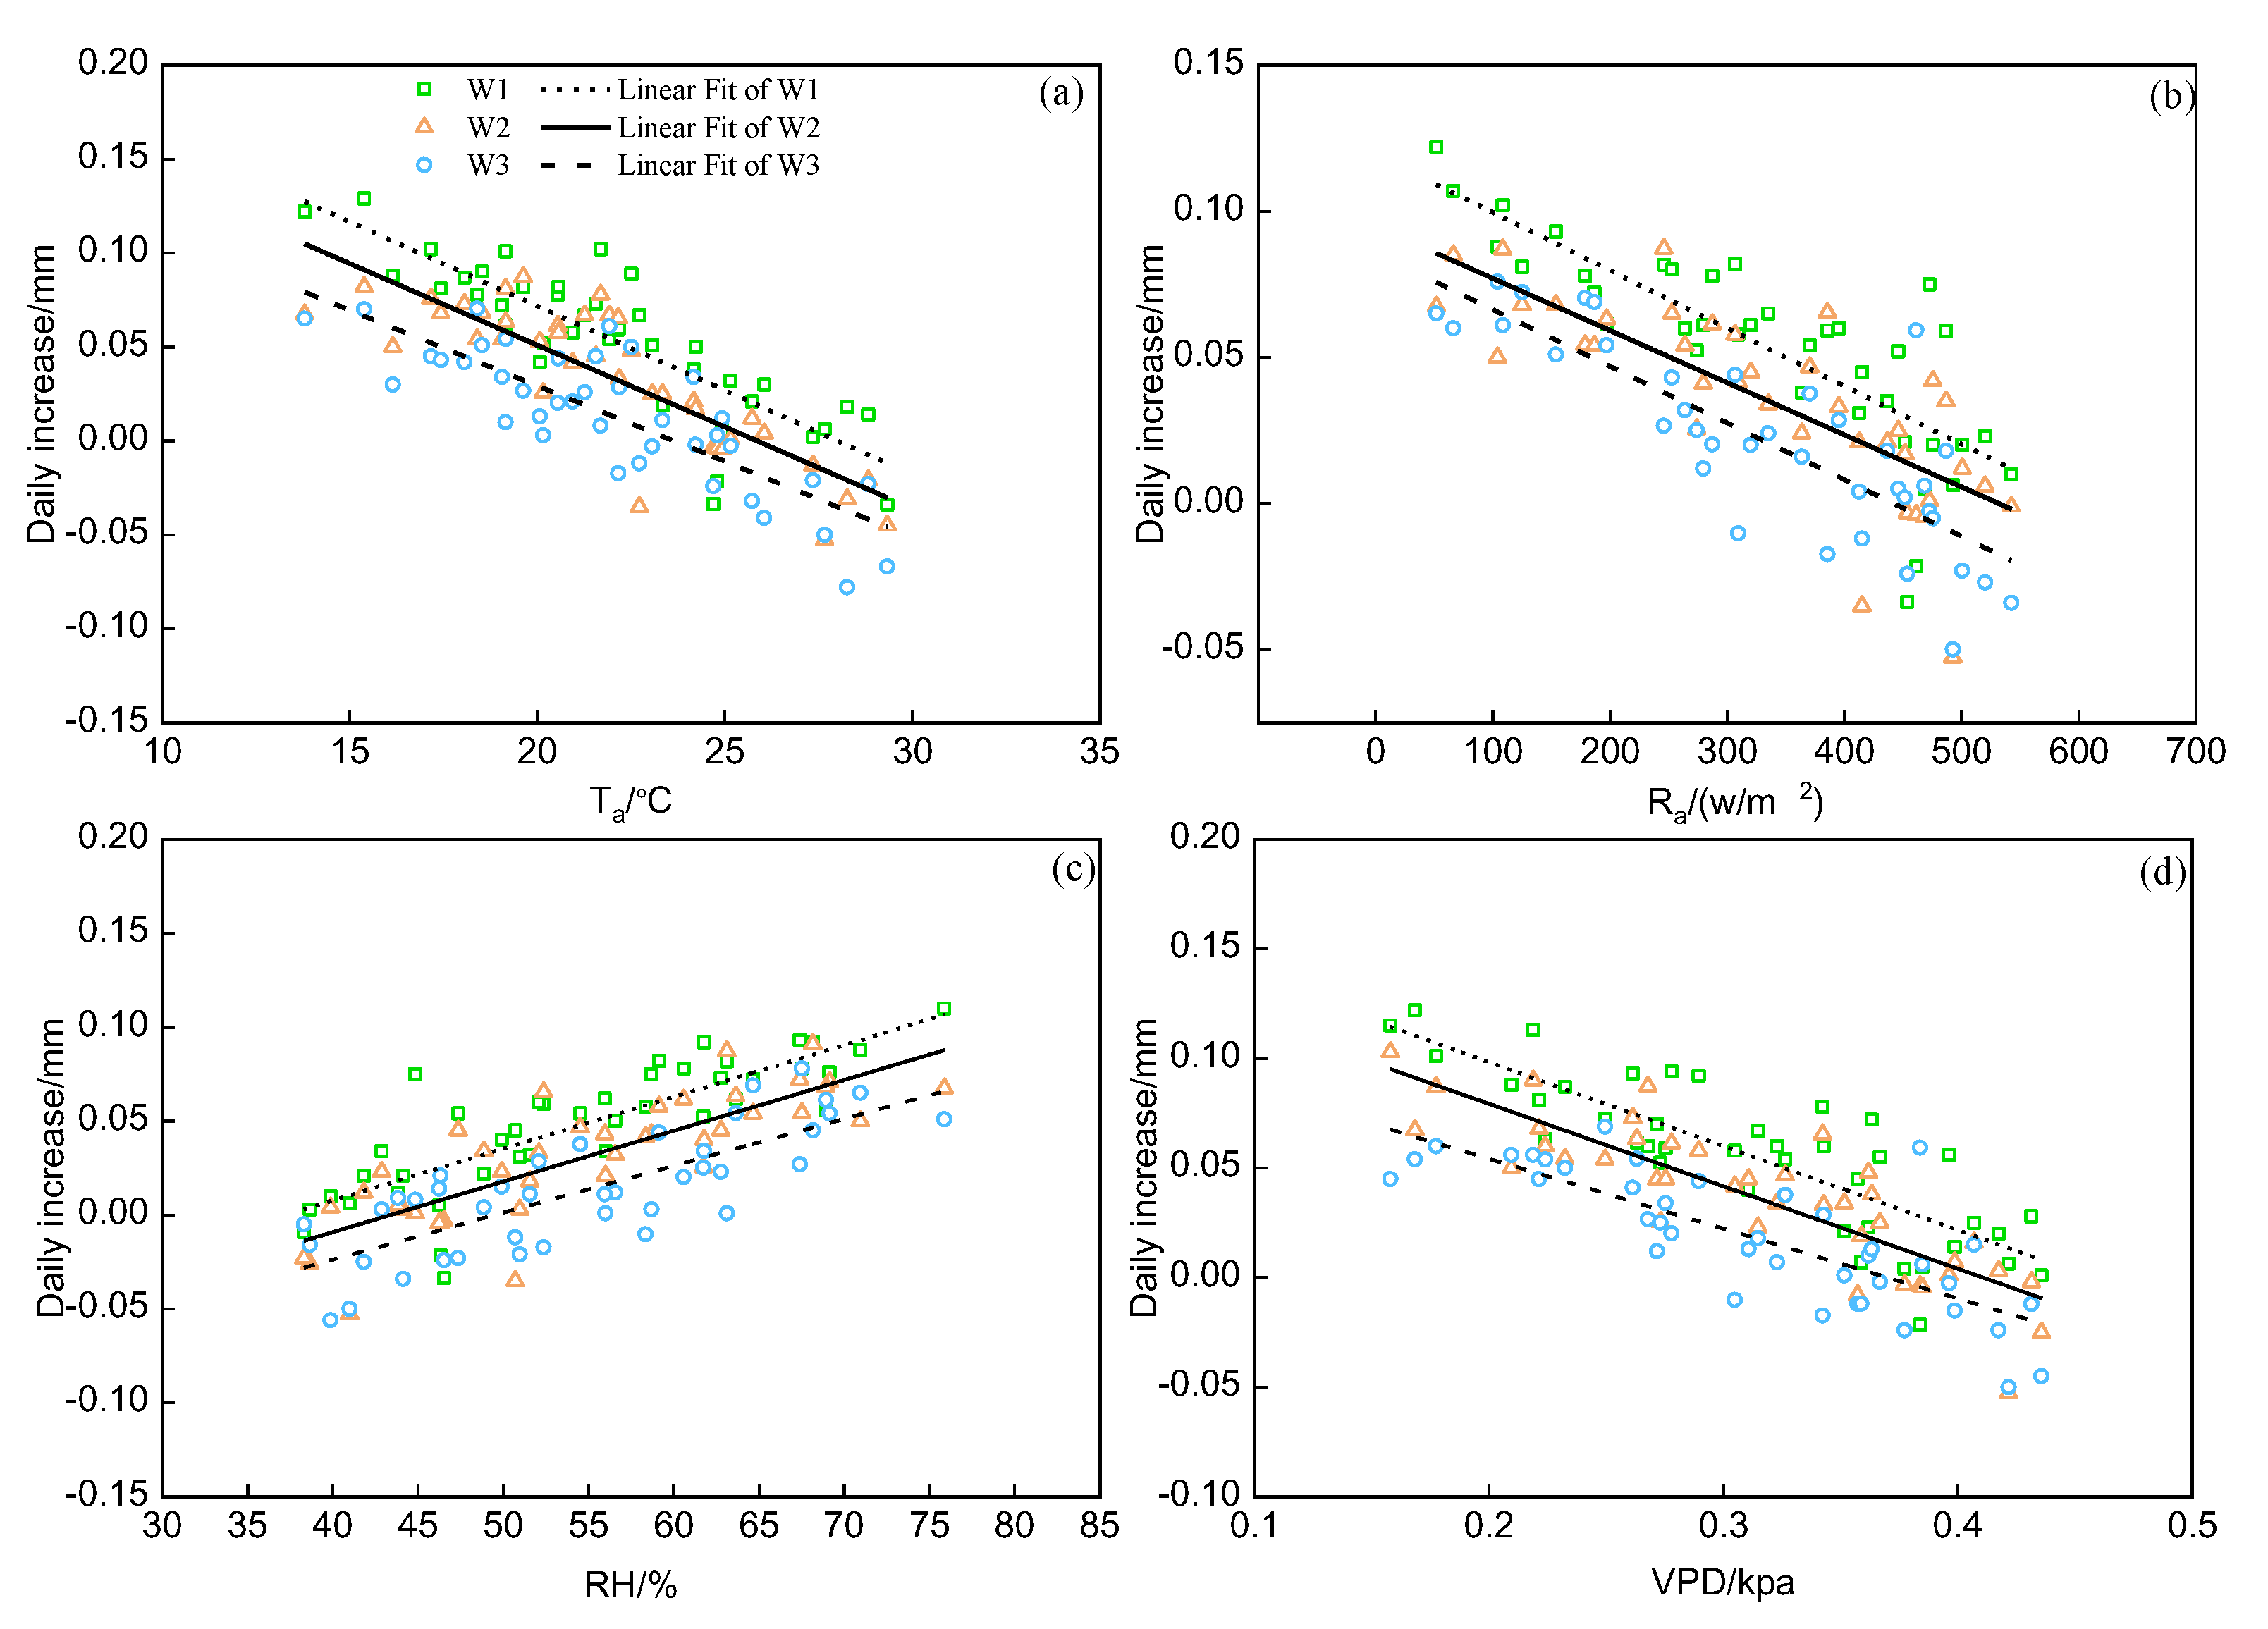
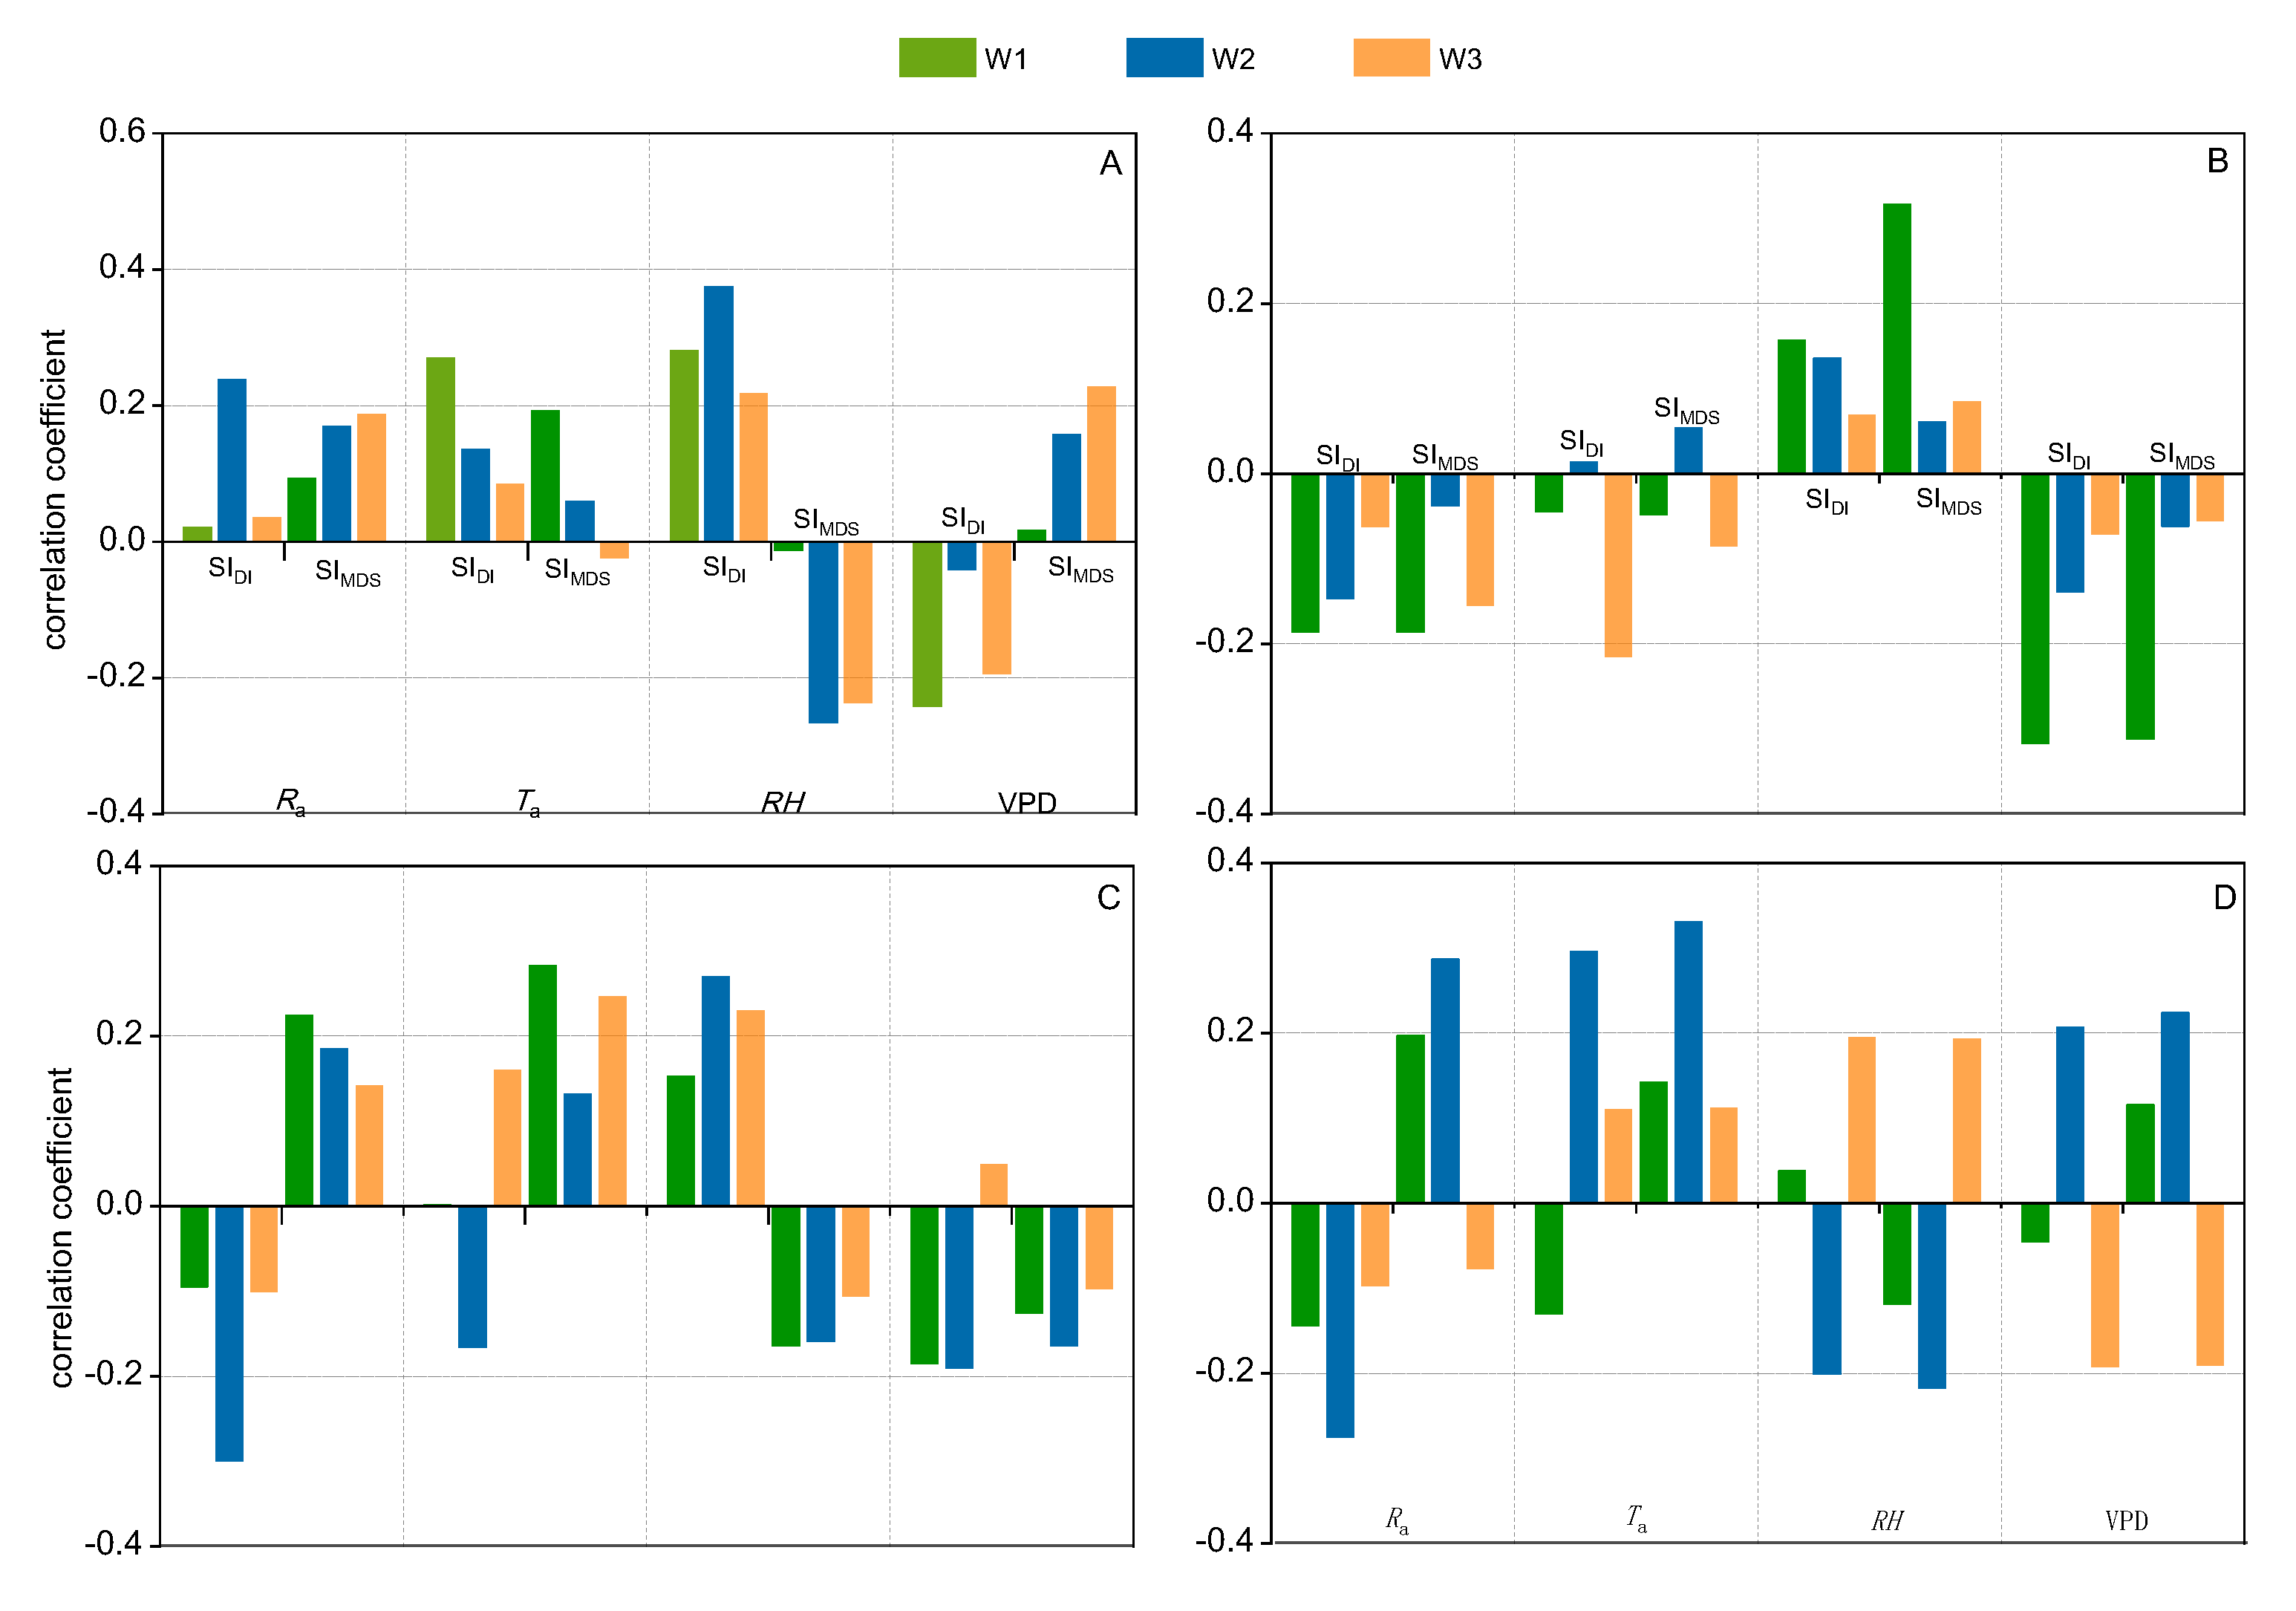
3.2.1. The Correlation of MDS and DI with Meteorological Factors

The MDS and DI are the main components of stem diameter variation and are affected by soil moisture and meteorological factors [22]. Correlation analysis was carried out between MDS (Figure 3) and DI (Figure 4) in stem diameter and meteorological factors. The change in MDS was similar to those in meteorological factors (Ra, Ta and VPD). The MDS increased with increasing Ra, Ta and VPD and decreased with increasing RH. The correlation of DI with meteorological factors was opposite to that of MDS. The correlations between the MDS and DI of the three treatments and meteorological factors were significant (p < 0.05). The correlation between MDS and meteorological factors decreased with increasing irrigation, and the correlation between the DI and meteorological factors increased with increasing irrigation. It can be seen from Table 4 that the correlation coefficients of MDS, DI and Ta were the highest, at 0.601–0.692 and 0.683–0.723, respectively.

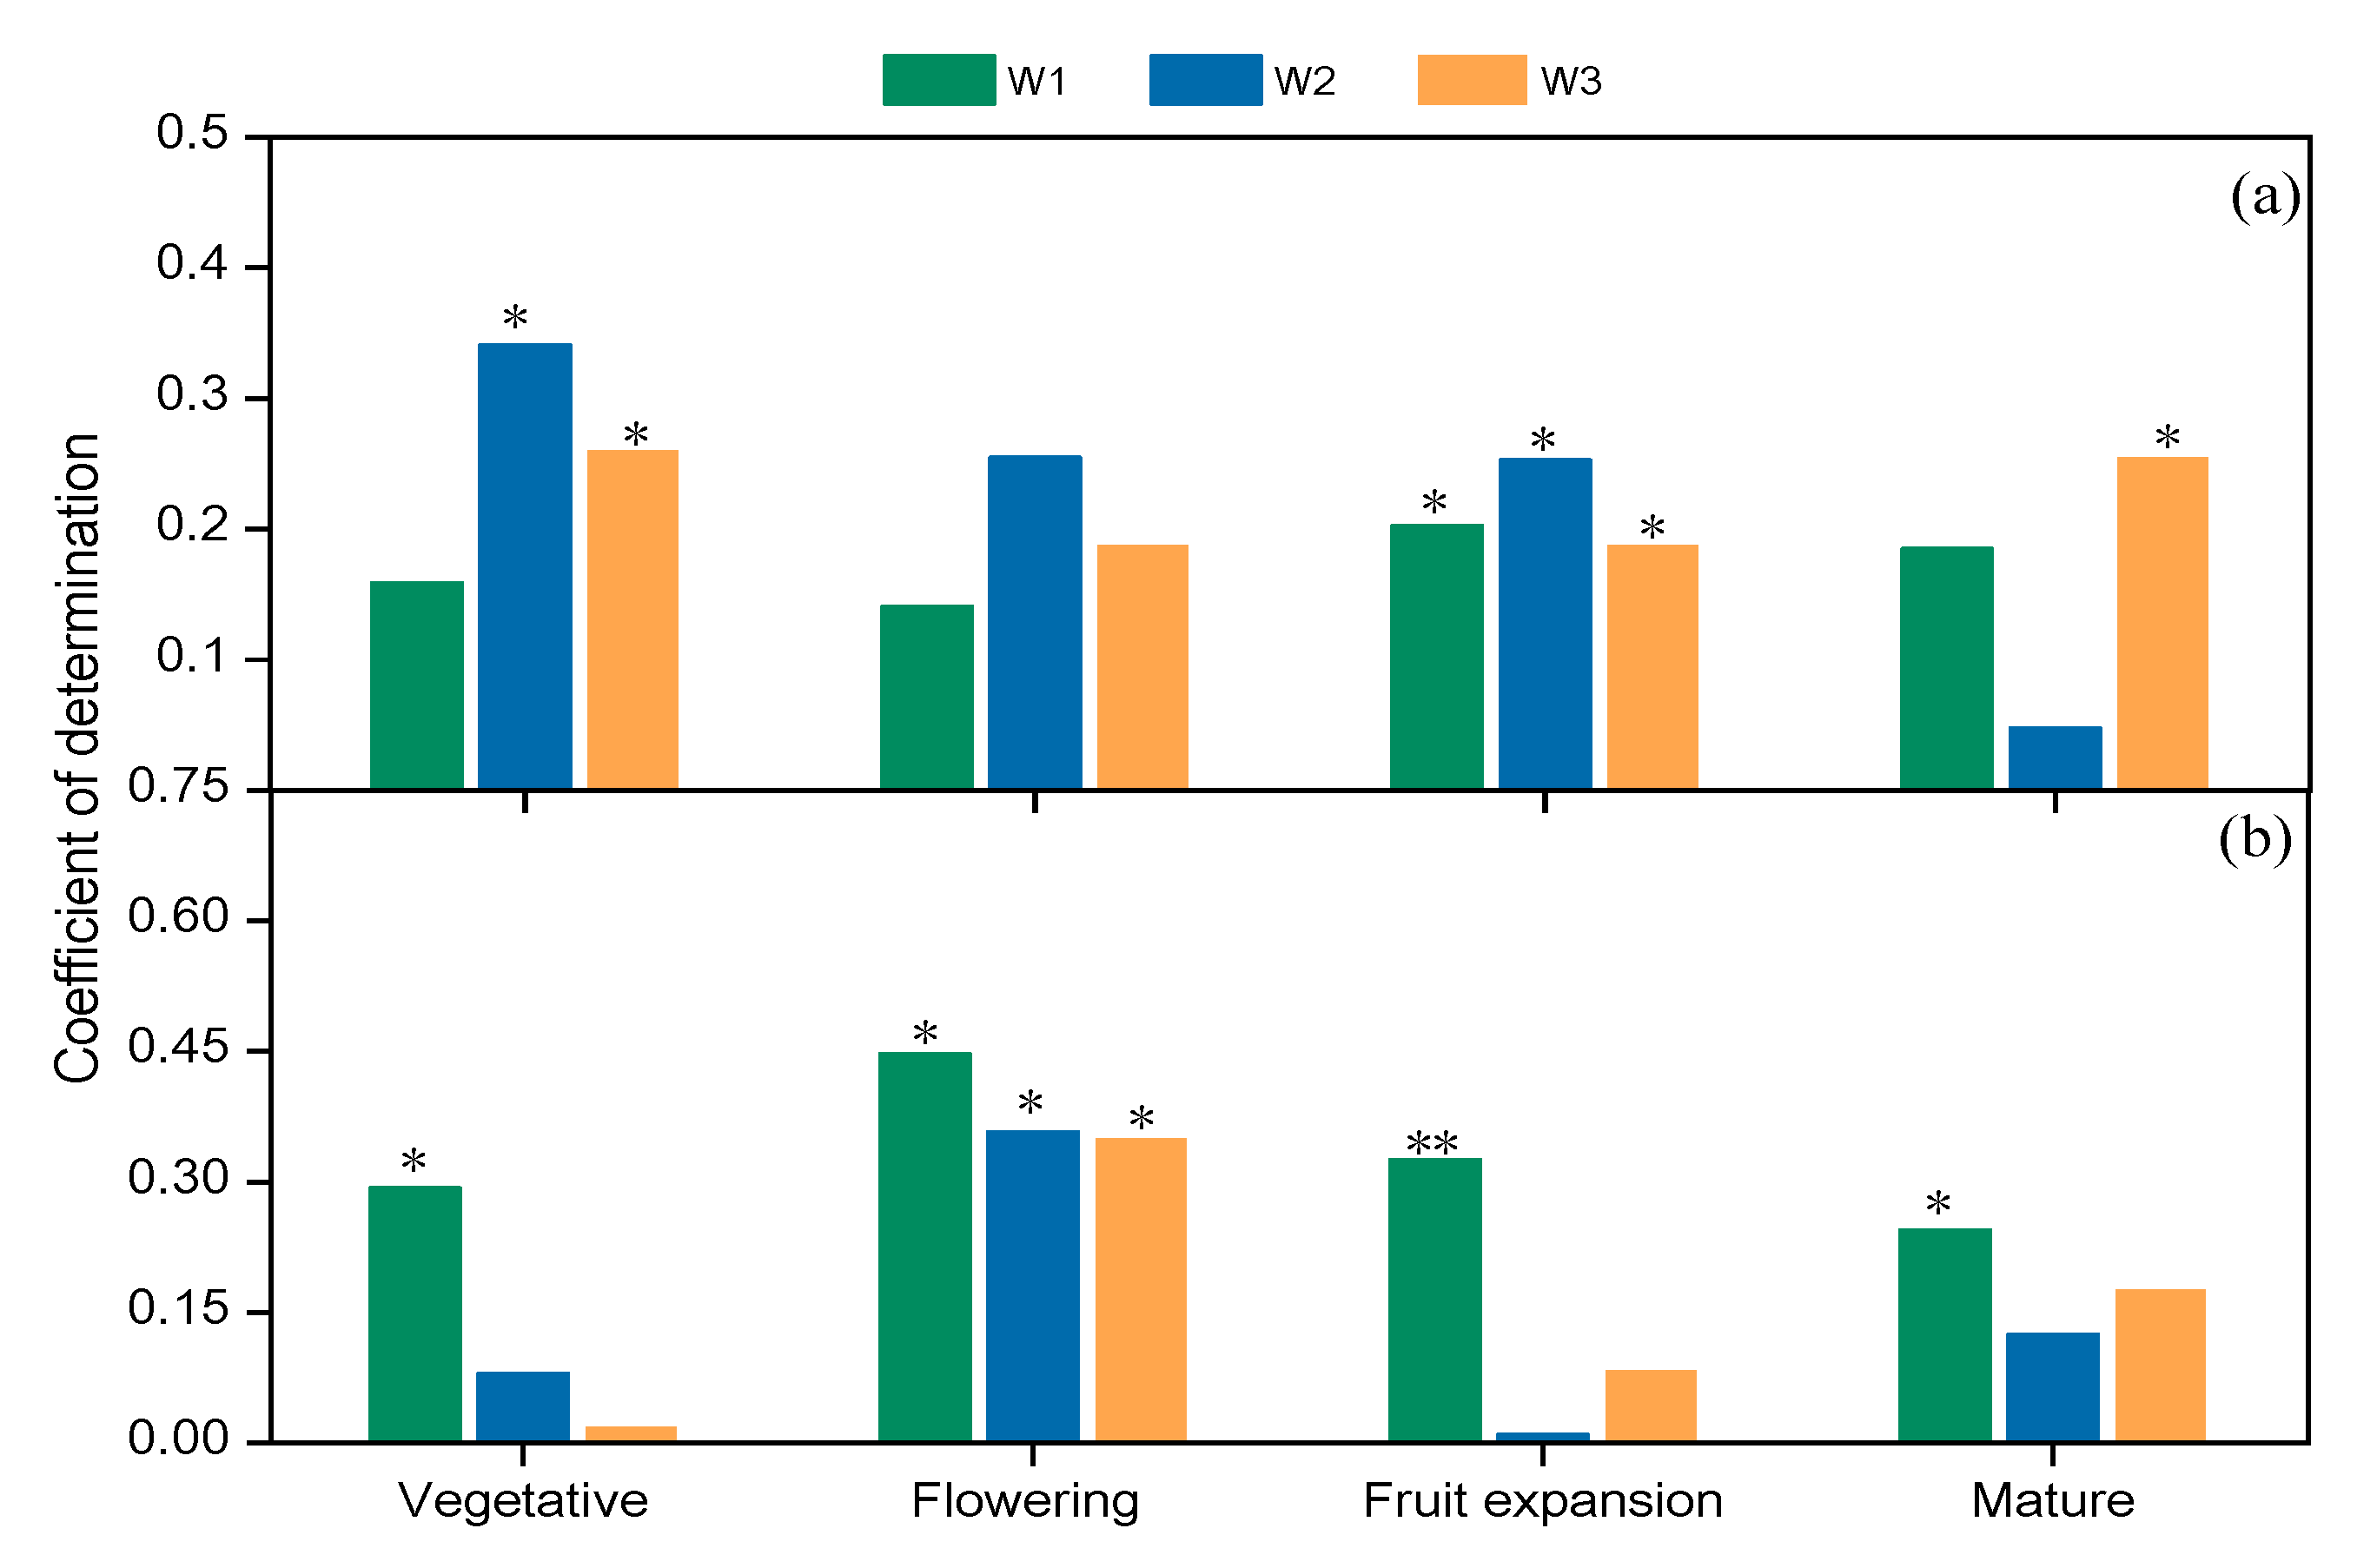
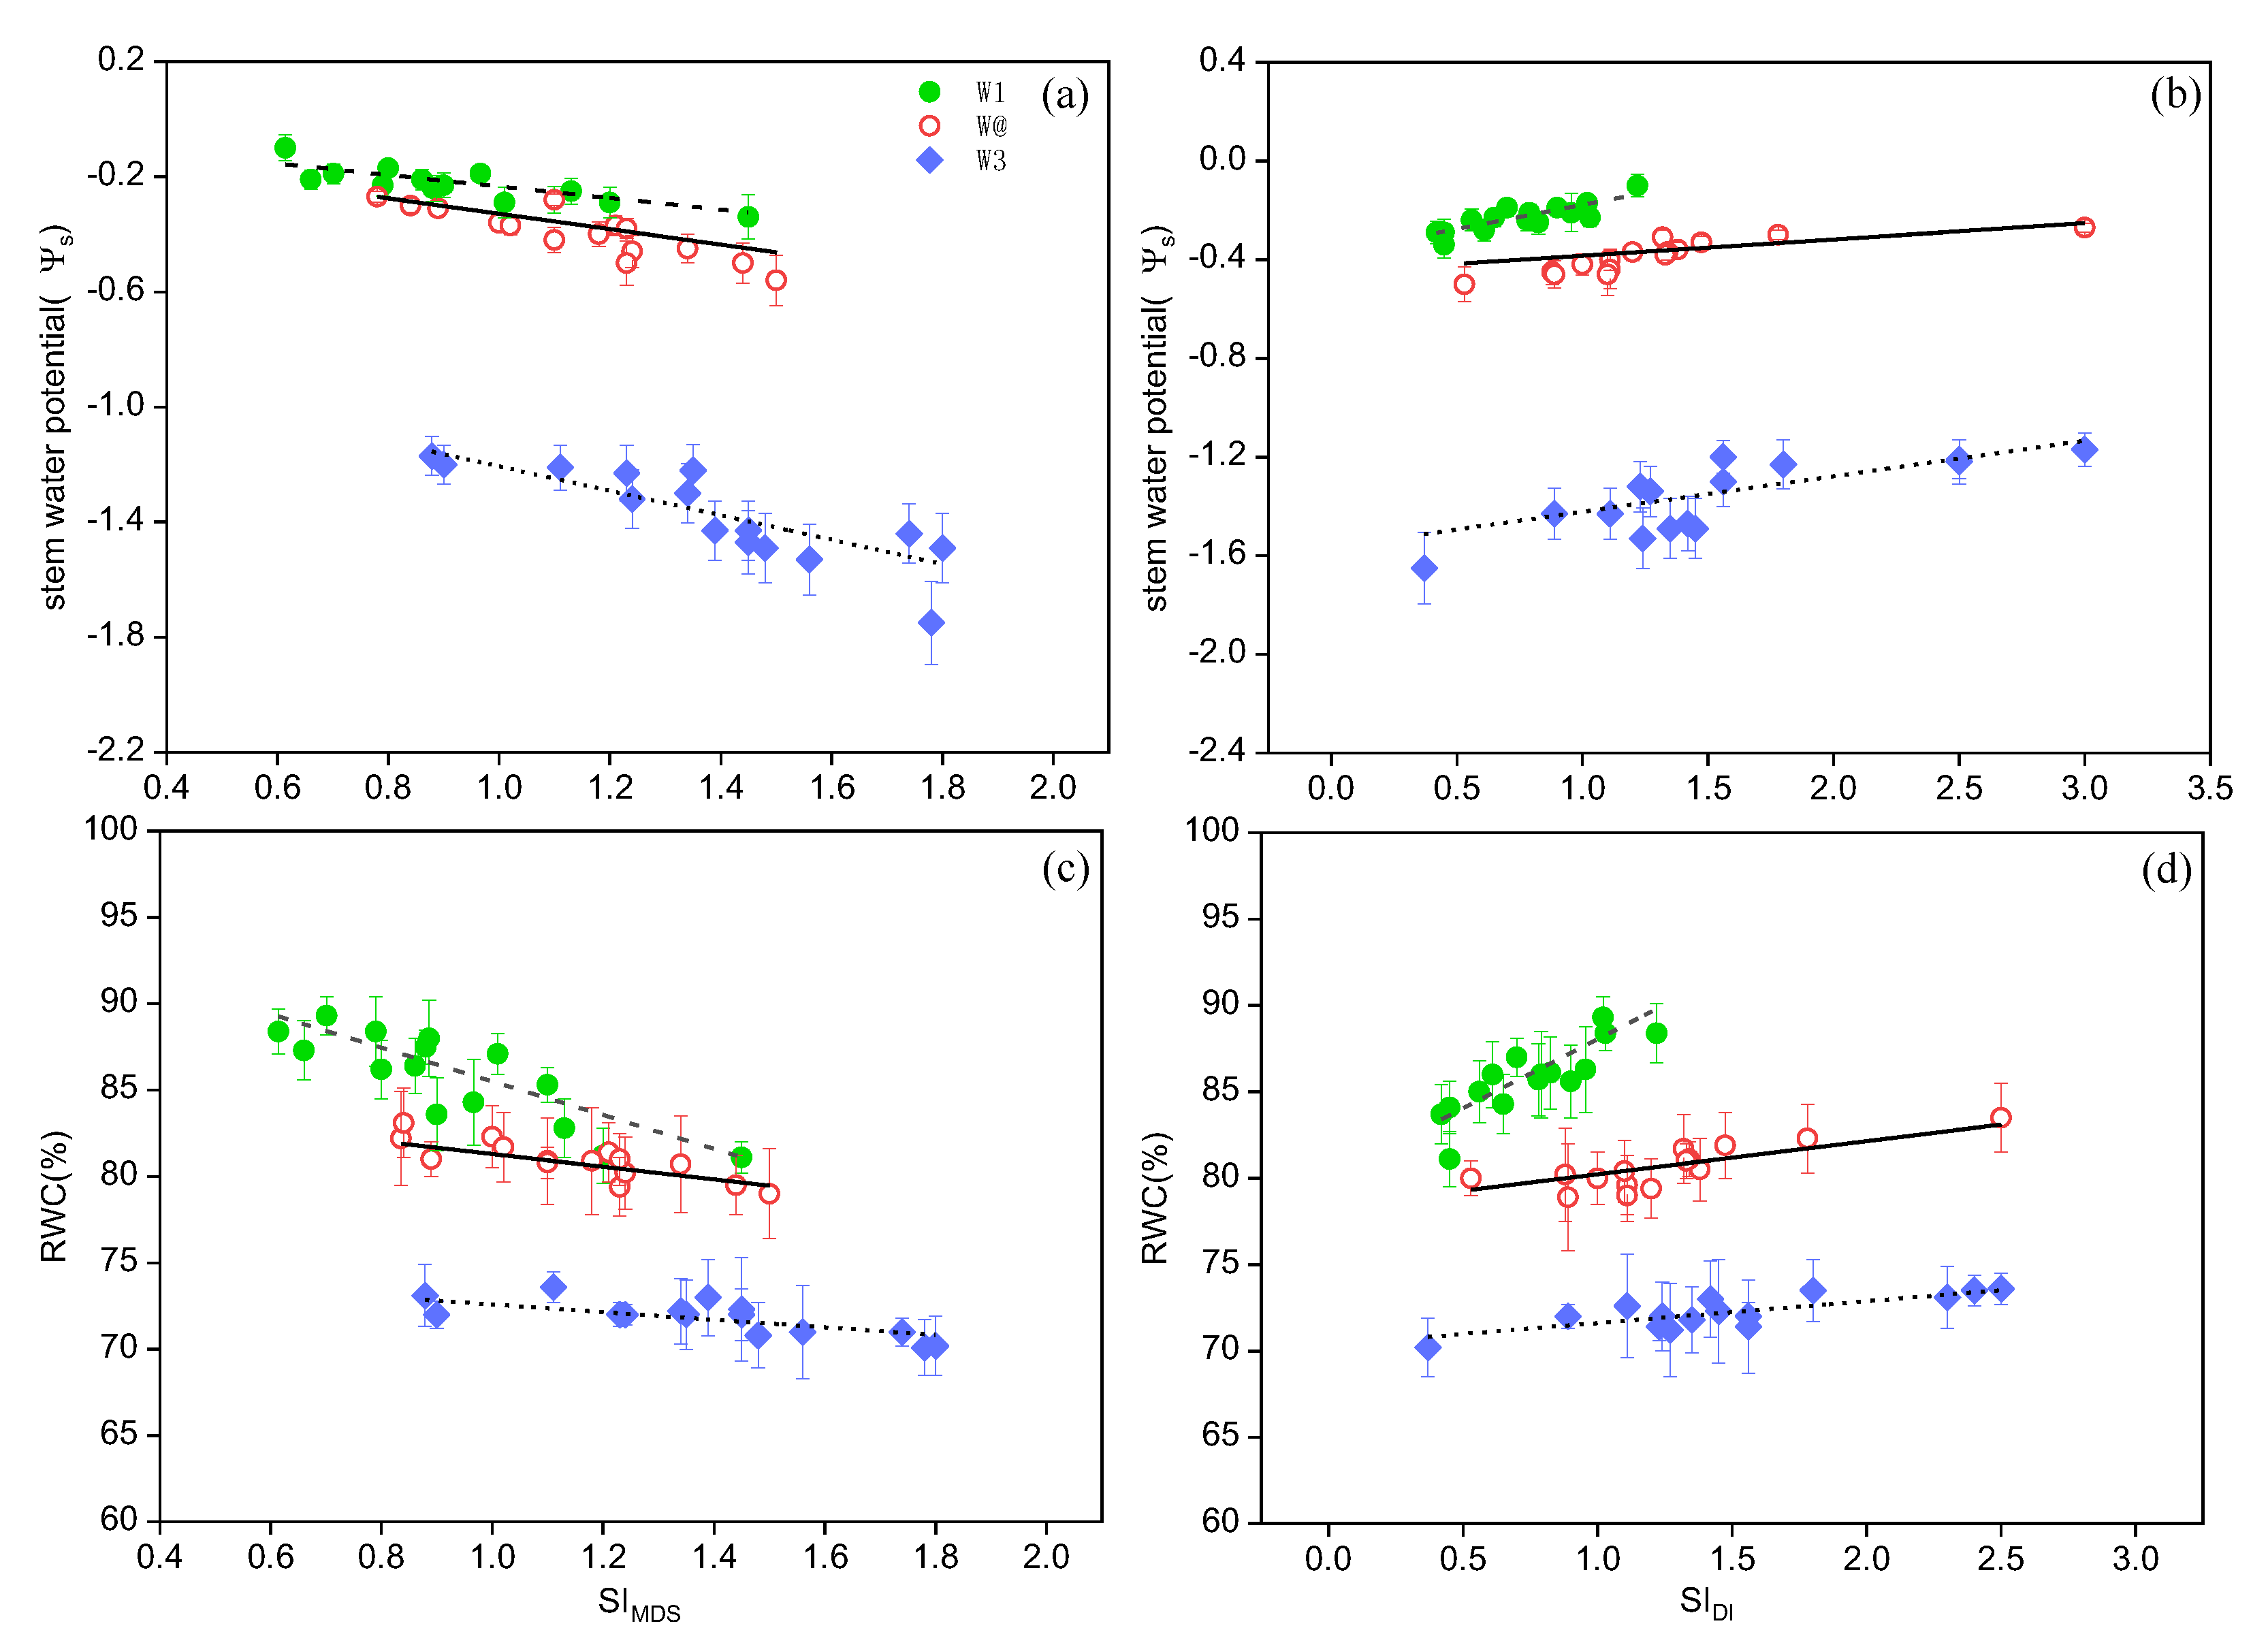
3.2.2. The Correlation of MDS, DI with Stem Water Potential and RWC of Leaves

Stem water potential (SWP) and relative water content (RWC) of leaves are important indicators to characterize plant water status and exhibit the most direct response to drought during crop growth [37,38]. The models of MDS, DI and SWP and RWC were established. The coefficient of determination (R2) is shown in Table 5. The regression equations of MDS and DI with SWP and RWC generally meet the significance test, which shows that both MDS and DI have obvious correlation with SWP and RWC, but R2 values are not high. We found that, compared with W1 and W2, the R2 values of MDS with SWP and RWC in W3 treatment were below 0.20, and the significance was weak. Therefore, MDS and DI were easily disturbed by meteorological factors and could not be directly used for the diagnosis of grapevine water status.

3.2.3. The Correlation of MDS and DI with Soil Moisture under Different Stages

Soil moisture has been widely used as an indirect index of crop water deficit. It can be used to diagnose crop moisture status if stem diameter variation is sensitive to soil moisture. Regression analysis was carried out between MDS and DI in stem diameter and soil moisture (Figure 5). It can be concluded that the response of DI to soil moisture was more sensitive during the flowering stage, while that of MDS was more sensitive during the fruit expansion stage. In general, the R2 values of the MDS and DI models were low under different treatments. The reason for this result is that the MDS and DI in grapevine stem diameter were easily affected by meteorological factors. Therefore, combined with the above conclusion, it is necessary to eliminate the interference of meteorological factors on the stem diameter variation.

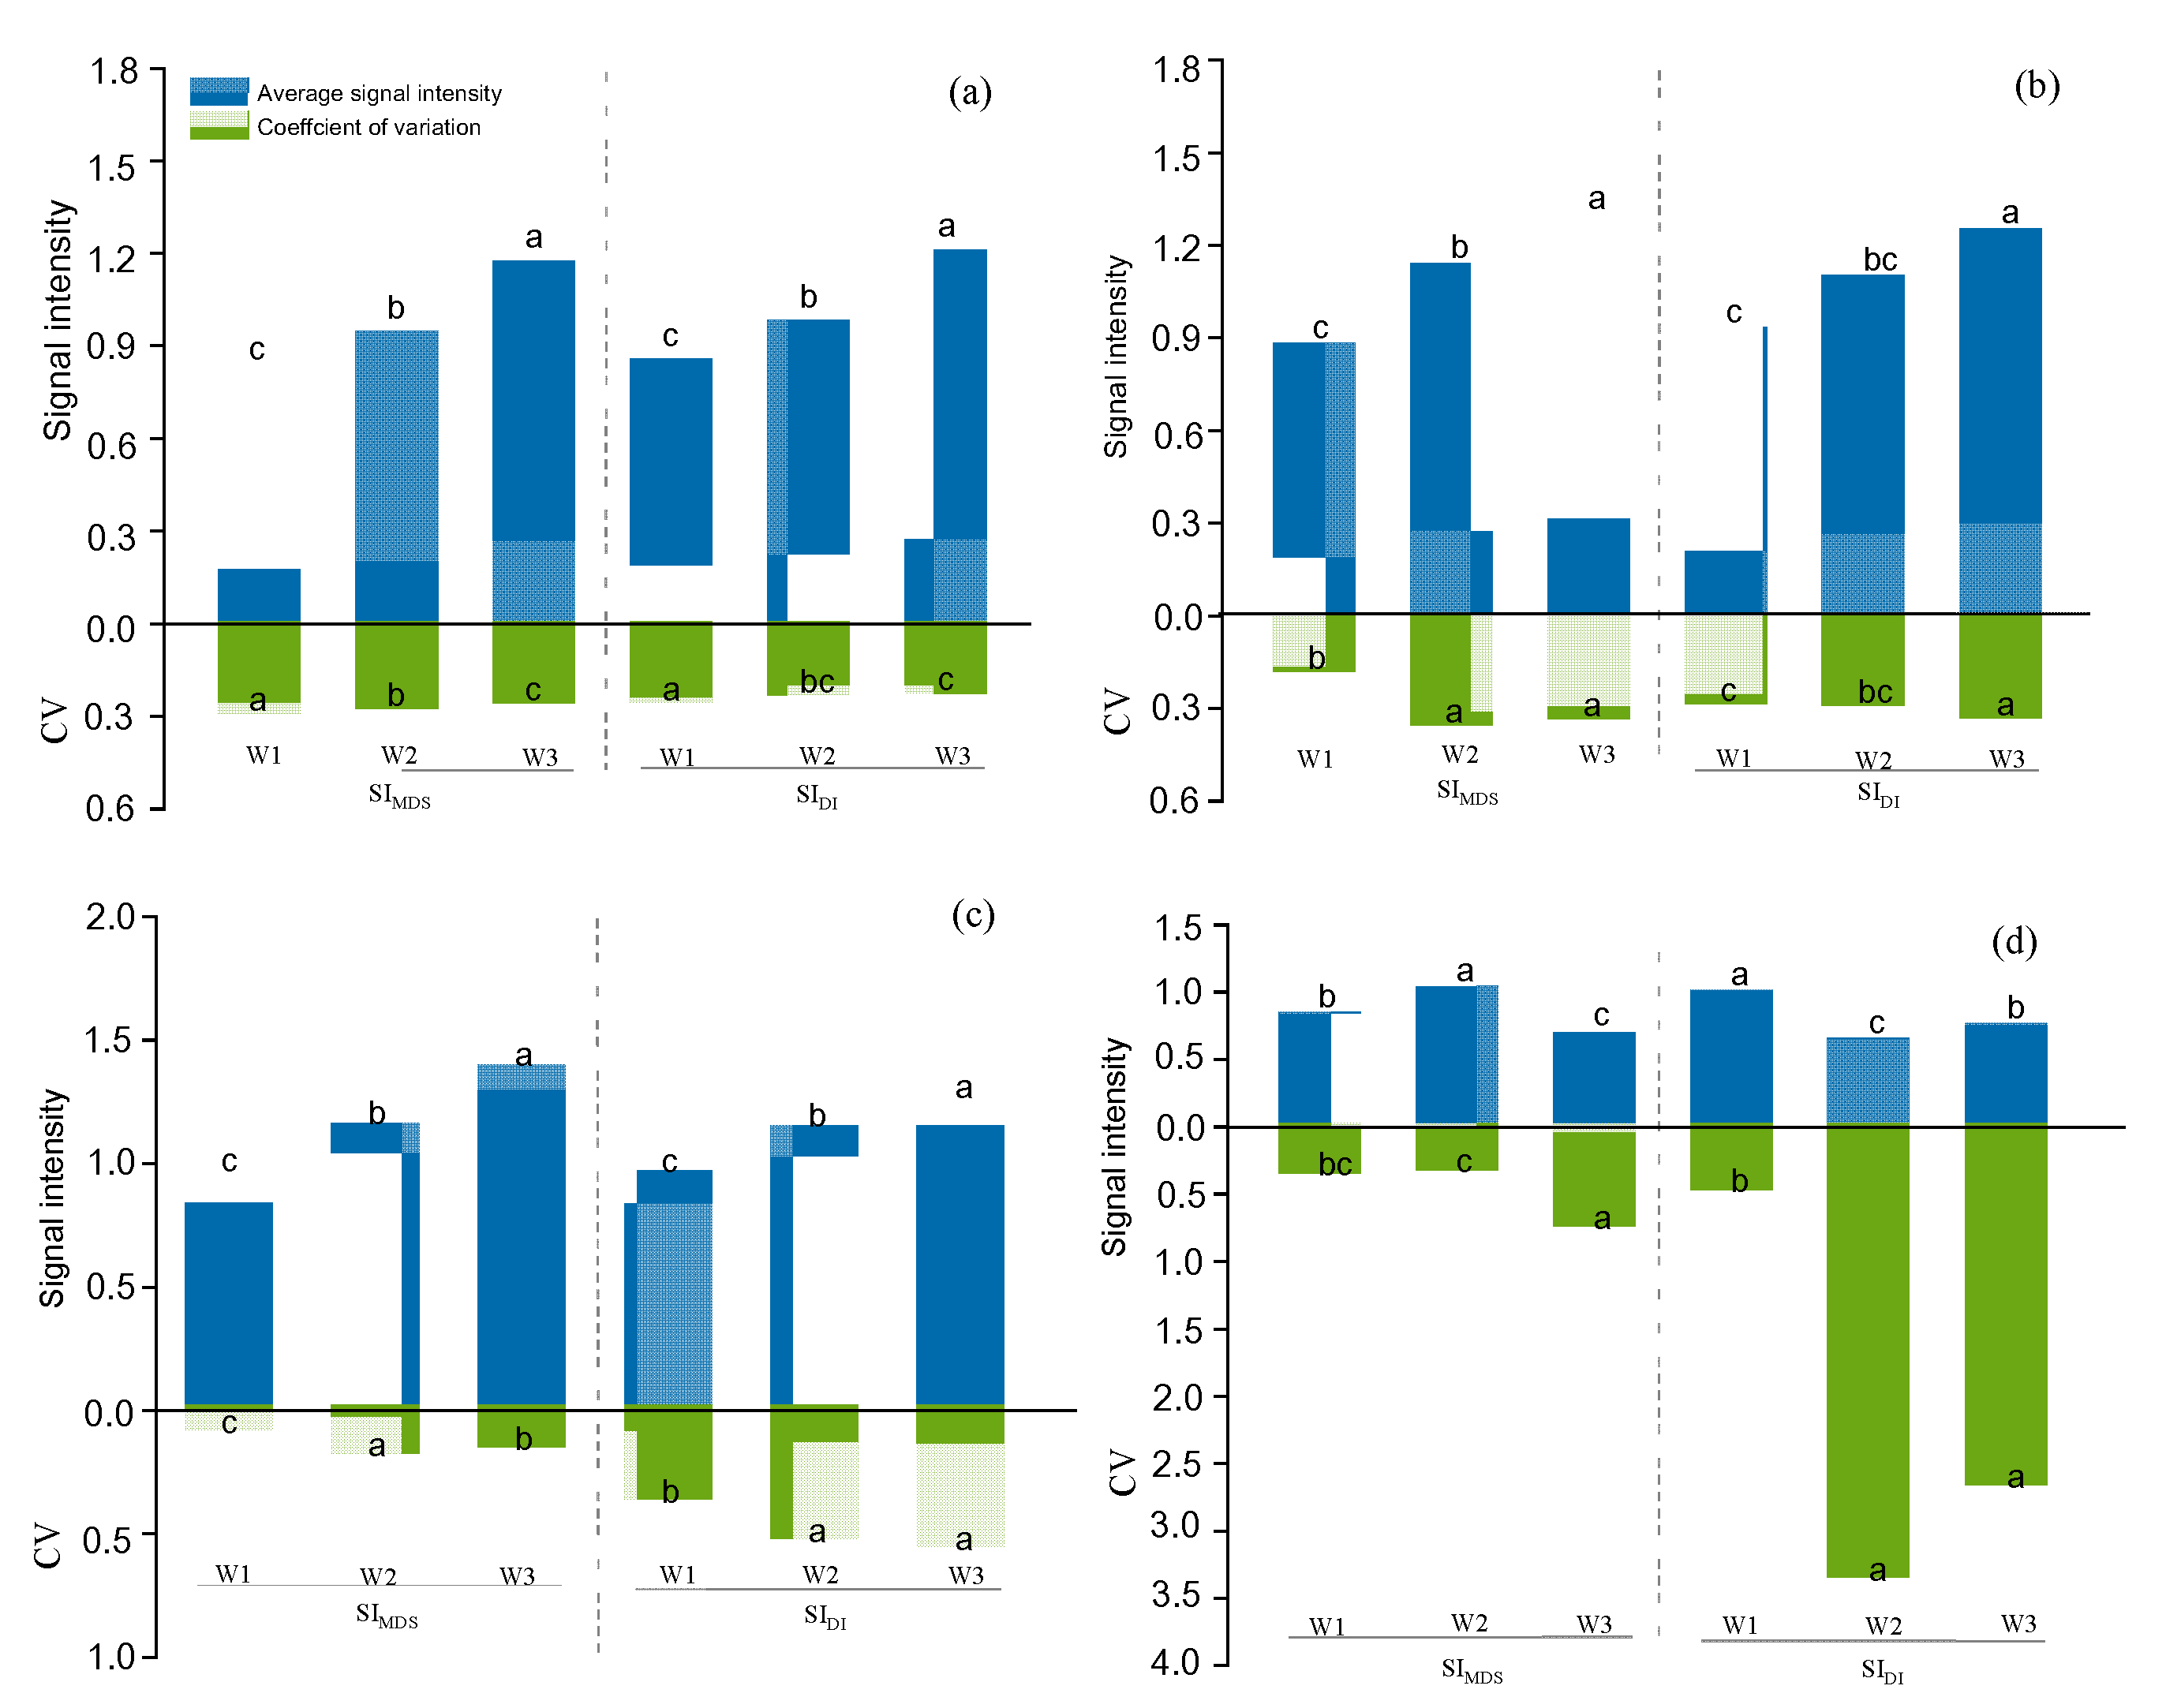
3.2.4. Signal Intensity of Stem Diameter Indicator

The signal intensities of MDS (SIMDS) and DI (SIDI) under different treatments at different stages were significantly different (Figure 6). The SIMDS fluctuated by approximately 1 mm from the vegetative stage to fruit expansion stage under W1, while it mostly fluctuated below 1 mm at the mature stage. The SIDI fluctuated approximately 1 under W1 during the whole growth period. The degree of change in SIMDS and SIDI under W2 and W3 increased sequentially, and the signal values of the same stage were larger than those of the W1. It can be seen that with the increase in irrigation, the SIDI and SIMDS values of stem diameter tended to become stable. The SIMDS of the three treatments peaked during the fruit expansion stage (Figure 6e), followed by the flowering stage (Figure 6c). The SIDI of the W3 dropped sharply to below 0 on 26 May and was restored after rehydration on 27 May. Compared with those under the other growth stages, the SIMDS and SIDI of each treatment decreased to different degrees at the mature stage (Figure 6g,h), and that of W3 treatment decreased most significantly. The SIMDS of the W3 decreased rapidly to below the W1 level within one week after irrigation stopped and then remained stable. The SIDI was difficult to use to distinguish the moisture status of grapevines at the mature stage due to the large fluctuation and instability of the signal values. In conclusion, SIMDS was preliminarily determined to be an appropriate indicator of plant moisture status, and SIDI can be used as an indicator of moisture status at stages other than the mature stage.

3.2.5. The Correlation of SIMDS and SIDI with Meteorological Factors, Stem Water Potential and RWC

The correlation coefficients of the SIMDS and SIDI with meteorological factors during different growth stages are shown in Figure 7. In addition, while the individual correlation coefficient reached a significant level, the correlation of the SIDI and SIMDS of three treatments with meteorological factors during the whole growth period was not significant (Figure 7), which indicated that the influence of meteorological factors on SIDI and SIMDS had been excluded.
It can be seen from Table 5 that the correlations between MDS and DI and SWP and RWC are relatively low. Therefore, after eliminating the interference of meteorological factors, the fitting diagrams and equations of SIMDS and SIDI with SWP and RWC are established (Figure 8 and Table 6). With the increase in SIMDS, SWP under W3 decreased most significantly, RWC under W1 decreased most significantly; with the increase in SIDI, SWP and RWC under W1 had the most significant increase. On the whole, the R2 of each equation was high, and the correlation reached a very significant level (Table 6). We concluded that the ability of SIMDS and SIDI to represent the deficit status of plants is greatly improved after eliminating the interference of meteorological factors.

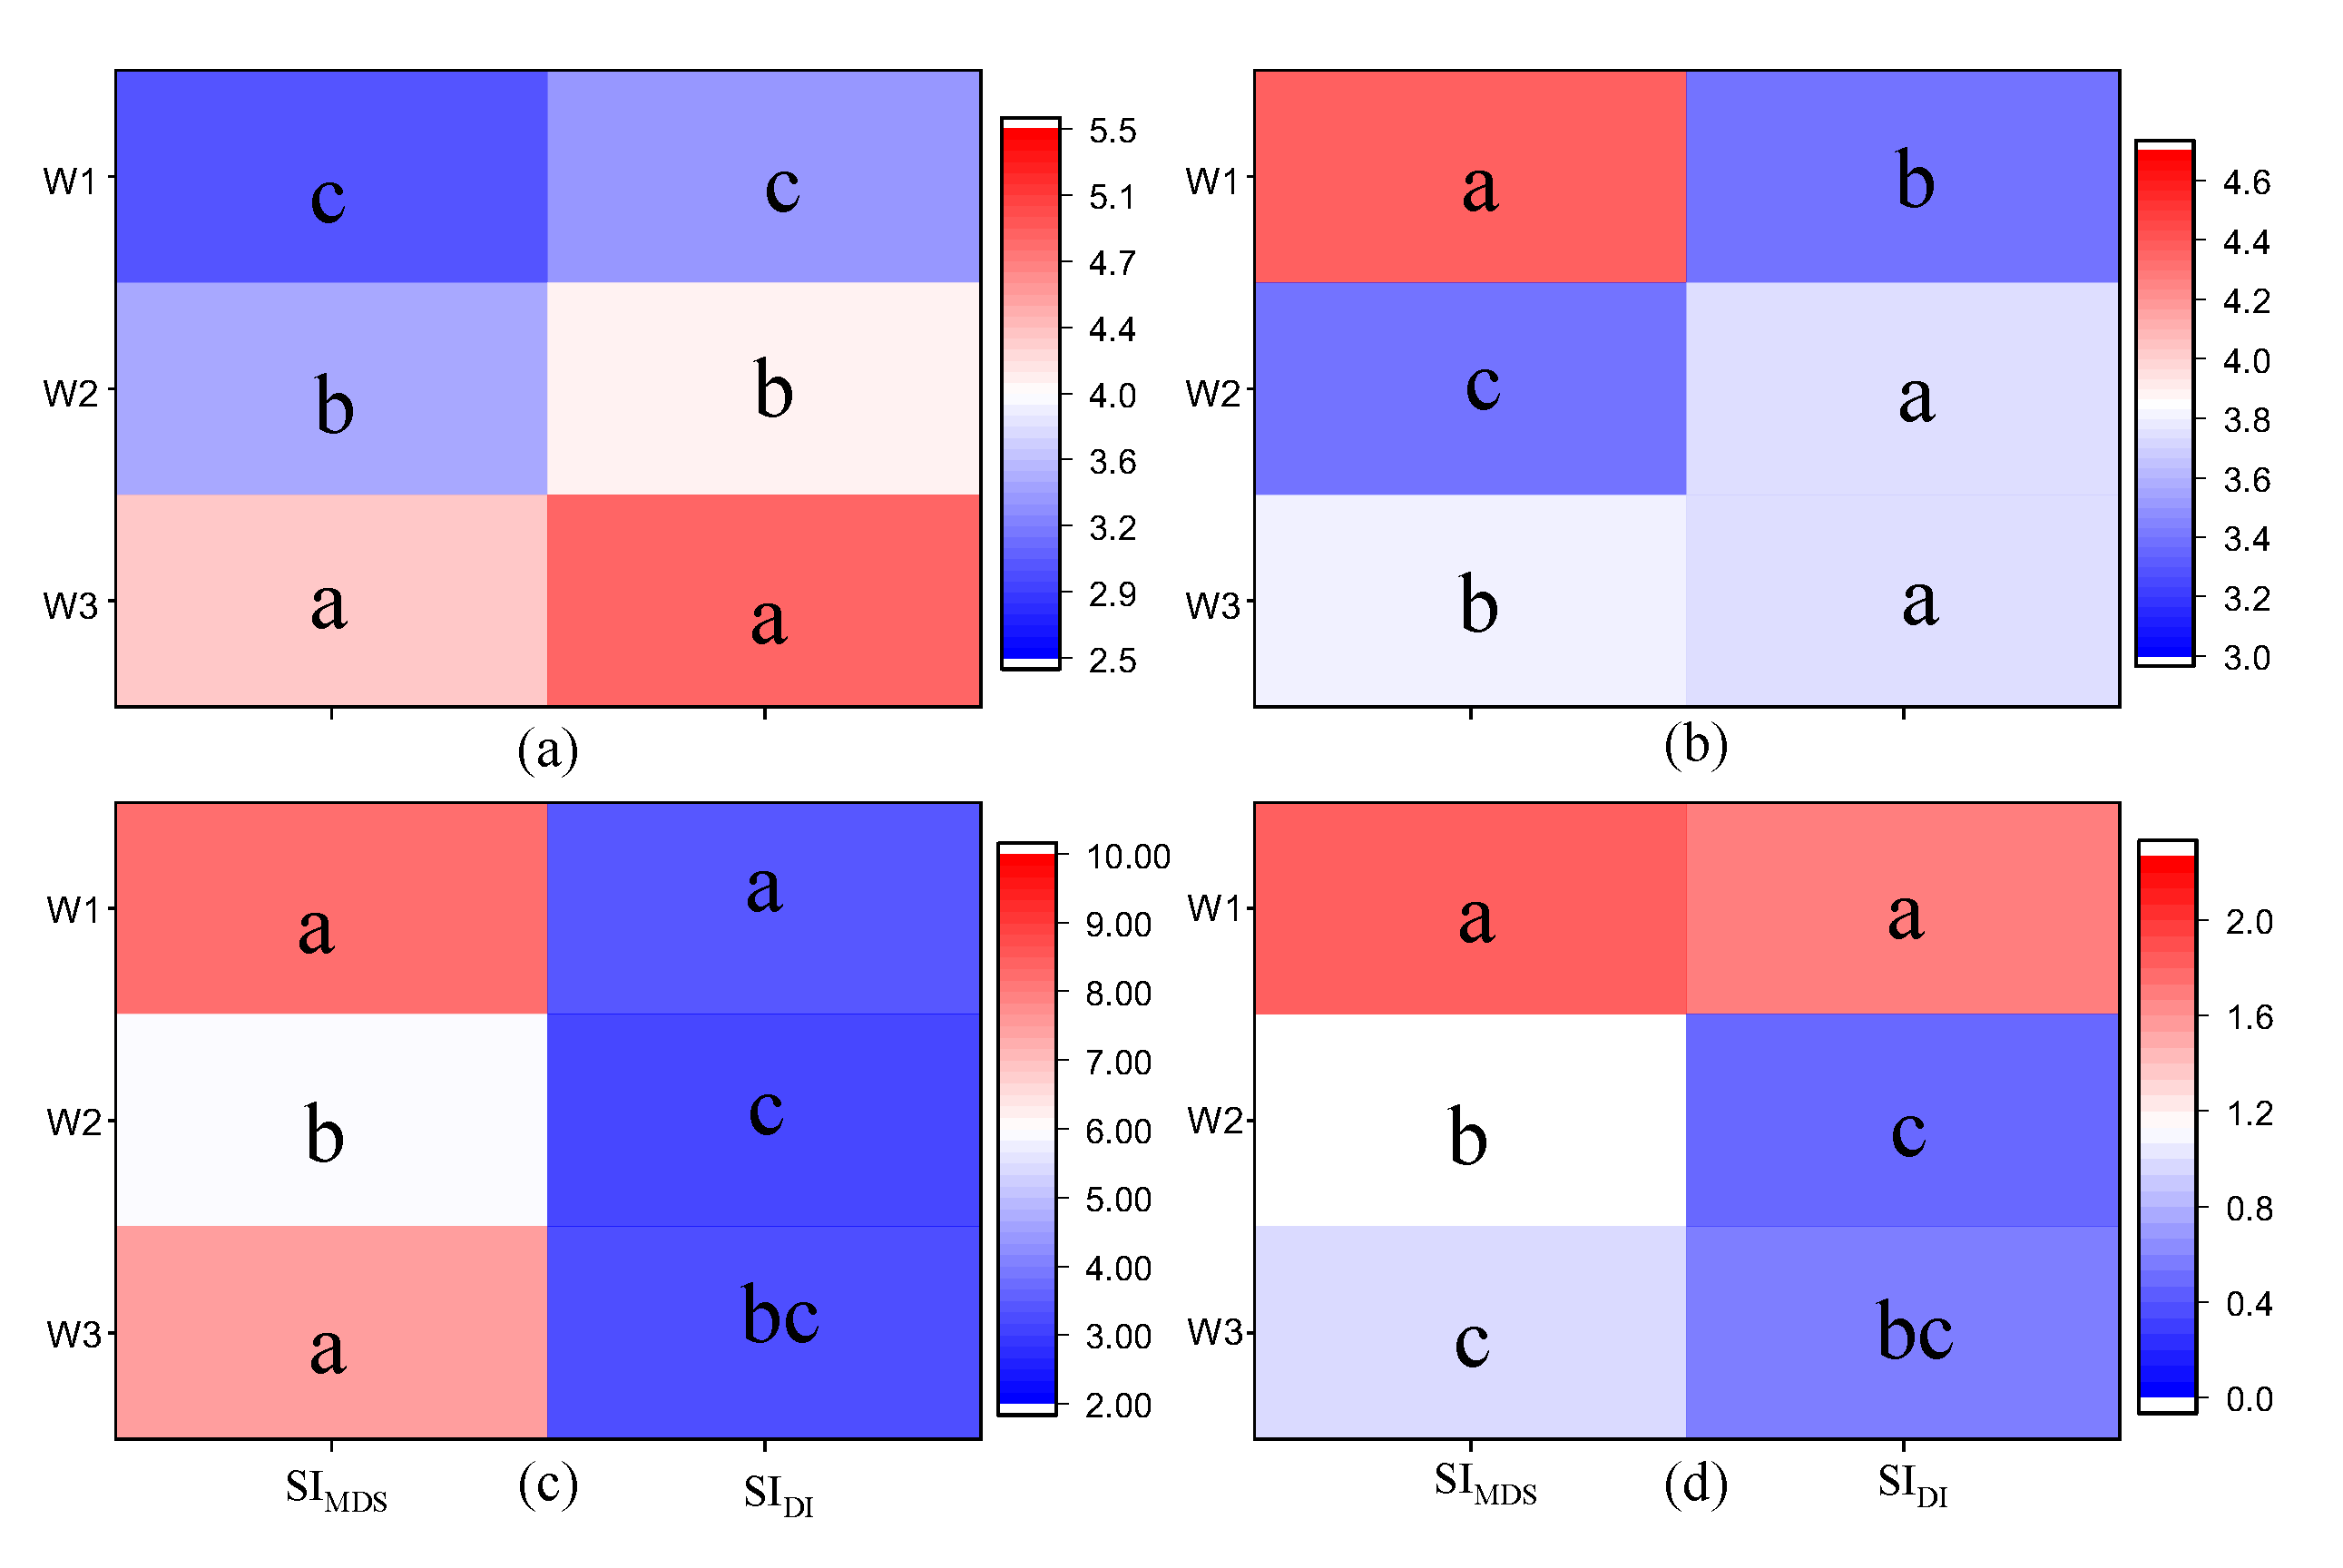
3.2.6. Adaptable Evaluation of Signal Intensity under Different Stages

In addition to using signal intensity of stem diameter to characterize the water status of plants, the signal intensity of stem diameter was also explored to monitor soil water content and diagnose whether grapevines were under water stress in real time. Therefore, the regression model between the SIMDS and SIDI of stem diameter and soil moisture was established (Table 7). It can be seen from Table 7 that the determination coefficient (R2) of the SIMDS model under three treatments were high during the growth stage, which indicated that SIMDS showed a good diagnostic effect on soil moisture status. The R2 of the SIDI model was higher at the vegetative and flowering stages, and R2 decreased to 0.022–0.232 (p > 0.05) at the mature stage. We can conclude that SIMDS and SIDI were more suitable for diagnosing soil water status than MDS and DI. However, the diagnostic effect of the two indicators was quite different under different stages, so it is necessary to further consider the moisture sensitivity under different stages to select the optimum indicator.
The signal intensity of MDS and DI (SIMDS, SIDI) and the coefficient of variation of signal intensity under different stages are shown in Figure 9. The signal-to-noise ratio of SIMDS and SIDI under different treatments at different stages can be seen in Figure 10. The SIMDS and SIDI increased first and then decreased over the whole growth stage (Figure 9). We found that the average values of SIMDS and SIDI under different treatments were similar at the vegetative stage, but the variability of SIMDS was greater than that of SIDI (Figure 10), so SIDI was a more suitable diagnostic indicator of grapevine water status and soil water status during the vegetative stage. The average signal intensity, sensitivity and signal-to-noise ratio were similar at the flowering stage, but SIDI had a better correlation with soil moisture at the flowering stage (Table 7); thus, SIDI should be selected as the diagnostic indicator of grapevine water status and soil water status at the flowering stage. The signal-to-noise ratio of SIMDS during the fruit expansion and the mature stages was higher than those of SIDI (Figure 10), and the sensitivity of SIMDS to soil moisture was better than that of SIDI. Therefore, SIMDS was selected as the most suitable indicator of grapevine water status and soil water status during the fruit expansion and the mature stages.

4. Discussion

4.1. Relative Variation in Grapevine Stem Diameter

To achieve sustainable water use and efficient cultivation of crops, the moisture condition of crops is an important factor. Under both high and low soil moisture conditions, the grapevine stems shrunk in the daytime and recovered or expanded at night, and the microchange in stem diameter was closely related to the water status of the plant [39,40]. The present study showed that the stem diameter under the W3 treatment began to decrease sharply after 7 April, and the total increase in stem diameter was −0.570 mm. Because the growth of new shoots mainly depends on the absorption of soil moisture and nutrients by the root system and transport of these nutrients to the new shoots, the soil moisture under the W3 treatment was low. When transpiration stopped at night, the moisture absorbed by the root system was not sufficient to make up for the transpiration loss during the day, so the increase in stem diameter stopped or stems even exhibited negative growth, similar to the results of Xiong [41].
The difference in the MDS among the three treatments was not significant during the vegetative and flowering stages. The reason for this phenomenon is that the rapid growth rate conceals the short-term variation in stem diameter caused by water deficit, which indicates that MDS is not a suitable indicator of moisture status during early grapevine development [42]. During the mature stage, the growth of the stems slowed with the seasonal process. At the fruit growth stage, the stems also ceased growth or shrunk without water stress [43,44]. The results showed that the relative variations in stem diameter among the three treatments decreased gradually, similar to the results of Intrigliolo and Castel [44] and Girón et al. [44]. With the increase in water stress, the MDS under the W3 treatment was the lowest at the flowering and fruit expansion stages. This effect may be the result of the combination of the degree of water stress on the plant and the ability of the tissue to hold water against the water potential gradient [12]. Further research is needed to more accurately explain these findings.

4.2. The Correlations of MDS and DI with Meteorological Factors

Numerous studies have shown that MDS is sensitive to soil and plant moisture status, and this measure has been applied in production as a key indicator to guide fruit tree irrigation [31,45,46,47]. The DI reflects the growth rate of the stem, which is affected by the water supply in the root zone and the intensity of transpiration. The DI is also sensitive to the plant moisture status during the rapid growth stage of crops. Therefore, it is particularly important to analyze stem diameter microchanges for diagnosing crop water deficit. Previous studies have shown that the key meteorological factors affecting stem diameter of fruit trees under outdoor conditions are daily mean water pressure deficit (VPD) or daily maximum temperature (Tmax) [16,23,48]. In the current study, we found that Tmax and VPD are the key meteorological factors affecting MDS and DI, which is consistent with previous studies on outdoor fruit trees. In addition, the plastic film on the top of the greenhouse has good light transmittance, which can well transmit sunlight into the grapevine of the greenhouse, which also explains the reason why the indoor and outdoor results are similar.
Our results showed (Figure 3 and Figure 4) that the positive correlation between MDS and VPD was extremely significant (p < 0.01), and the negative correlation between DI and VPD was significant (p < 0.05). Goldhamer et al. [16] indicated that VPD was the main factor affecting the stem diameter variation of almond trees. Moriana et al. [49] showed that Ta had the best correlation with MDS, followed by VPD, which was different from the results of this study, and these discrepancies may have been caused by the differences in plant type and test sites. Therefore, when the crop growth environment is changed, the relationship between the indicator of stem diameter and meteorological factors may change, so the reference equation obtained under a specific condition cannot be used to calculate the reference value, which needs to be further referenced with local meteorological data.
In addition, under the same experimental conditions, due to the different responses of different grapevine varieties to water stress, there may be differences in the stomatal resistance, transpiration rate, and photosynthetic rate under different varieties following water deficit, which may cause changes in sap flow in the stem, resulting in differences in the stem diameter indicators of different grapevine varieties [50,51]. Therefore, the reference equation obtained on a certain grapevine variety and the SIMDS and SIDI irrigation threshold values may no longer be applicable. When calculating the crop reference value, it is better to use the same crop variety under the same growth conditions as the reference crop.

4.3. Signal Value and Signal-to-Noise Ratio of the Stem Diameter

The stem diameter indicator is greatly affected by external meteorological factors. The model of the correlations between MDS and DI and stem water potential, RWC and soil moisture cannot exclude the interference of external factors [14]. According to the experimental results, the SIMDS and SIDI had better sensitivity, signal intensity and reliability in diagnosing the grapevine water content. In addition, the diagnostic applicability of SIMDS and SIDI was different in different growth stages of grapevine. A possible explanation might be the great coefficient of variation among grapevine plants growth rates masked the differences created by water stress on SIMDS at early and middle growth stage. Thus, the SIDI is a more appropriate indicator of the grapevine water content than SIMDS during the vegetative and flowering stages, but as important plant growth indexes, the variation of SIMDS and SIDI should be taken into full consideration in practice as well. The signal value of the stem diameter variation indicator can eliminate the interference of meteorological factors, so an accurate reference value is critical for the use of signal intensities for guiding crop irrigation [52,53]. The SIMDS and SIDI values of the W1 treatment fluctuated up and down by approximately 1 (Figure 6). The SIMDS and SIDI maximum of the W2 and W3 treatments under water stress was approximately 2.0, and the water deficit led to a significant increase in SIMDS and SIDI compared with the full irrigation treatment. The reason for these findings may be related to the water absorption by the root system and the ability of the stem to transport water following water stress, but the details of these mechanisms should be researched in the future. The SIDI at the mature stage showed an irregular curve with large fluctuations, which may have been caused by the large fluctuation of meteorological factors at the mature stage. However, the variation curve of SIMDS at the mature stage was relatively stable, which may have been related to the stem growth characteristics of grapevine at the later growth stage; the relevant internal physiological mechanism needs to be further explored.
Although stem water potential and RWC measurements require frequent trips to the field and a considerable input of labor, these parameters are reliable plant-based water status indicators and have been used for irrigation scheduling in fruit trees [43,54,55,56]. The present results showed that there were weak correlations between MDS, DI and stem water potential and RWC. These results were due to the unstable meteorological factors during this period, which affected the short-term grapevine stem growth to a certain extent, resulting in the unstable changes in stem diameter. However, when the interference of meteorological factors on MDS and DI were eliminated, SIMDS and SIDI were not sensitive to meteorological factors. According to the fitting equations of grape stem water potential and RWC with SIMDS and SIDI, the fitting effect of each equation is good (Figure 8). The coefficient of determination (R2) is approximately 0.7, which indicates that it is feasible to use the signal intensity of stem diameter variation to characterize crop water status. This approach can not only substantially reduce the labor required but also can be used to continuously and nondestructively carry out index observation, which is consistent with the research results of Badal et al. [17]. Furthermore, when using this index to diagnose the plant water content, the best time is on a fine day, as the stem diameter microchange indexes were small and not significantly different (p > 0.05) between stress and full irrigation treatments under poor weather conditions in this experiment [6].
It can be seen from Figure 9 and Figure 10 that the larger coefficient of variation (CV) of SIMDS during the vegetative and flowering stages, which resulted in lower signal-to-noise ratio. While SIDI has a greater variability in the late growth stage, the larger CV of SIMDS and SIDI increased the uncertainty of judging water stress in grapevine. In order to further explore the applicability of SIMDS and SIDI at different growth stages, more sensors should be installed to acquire the real water content message in practice. Previous studies have shown that some factors could affect the plant CV of MDS such as the crop load, location of sensor installation, and so on [43,48,49,57]. The relative researches should be studied further in future experiments to facilitate practical operation of this technic.

5. Conclusions

This work shows that there were significant differences in stem diameter variation under different irrigation levels. Water shortage resulted in larger maximum daily shrinkage and smaller daily increase. The stem water potential and leaf relative water content of stress plants (W2 and W3 treatment) were significantly lower than that of the W1 treatment. Regression analysis between MDS, DI and meteorological factors revealed that the MDS of stem diameter was positively correlated with Ra, Ta and VPD and negatively correlated with RH, and the DI among three treatments decreased with the increase in Ra, Ta and VPD and increased with the increase in RH. The key meteorological factors influencing grapevine stem diameter variation in a greenhouse were VPD and Ta. The MDS and DI had a weak correlation with stem water potential and RWC, thus these measures cannot be directly applied as indicators of the moisture status of grapevine and soil. SIMDS and SIDI can distinguish the differences in the grapevine stem diameter indicators under different soil moisture conditions, eliminate the interference of meteorological factors, and were highly correlated with stem water potential, RWC and soil moisture content. At the vegetative and flowering stages, SIDI has less variability and greater reliability than SIMDS, it is more suitable for the diagnosis of grapevine water status in these two periods. At the fruit expansion and the mature stages, the signal-to-noise ratio of SIMDS is significantly higher than that of SIMDS, so it is more suitable to be used as a diagnostic index of water status in late growth stage of grapevine. In sum, compared with other plant water diagnosing indexes, the SIMDS and SIDI indexes had the advantages of sensitivity, signal intensity and reliability and were good indicators of the grapevine water content.

Author Contributions

C.R., X.H., W.W. and H.R. designed the experiments, C.R., Y.G. and T.S. performed research and date analysis, C.R. wrote the manuscript with contributions from all authors. All authors have read and agreed to the published version of the manuscript.

Funding

This work was supported by the National Key Research and Development Program of China (2017YFD0201508), the National Natural Science Foundation of China (51179163), Shaanxi Key Science and Technology Innovation Team Project (2016KTZDNY-01–05).

Institutional Review Board Statement

Not applicable.

Informed Consent Statement

Not applicable.

Data Availability Statement

Data is available upon request to the corresponding author.

Acknowledgments

The authors would like to acknowledge all the team members of key Laboratory of Agricultural Soil and Water Engineering in Arid and Semiarid Areas, Ministry of Education.

Conflicts of Interest

The authors declare that they have no conflict of interest.

References

  1. Goodwin, I.; Boland, A.M. Scheduling deficit irrigation of fruit trees for optimizing water use efficiency. In Deficit Irrigation Practices, Water Reports; FAO: Quebec City, QC, Canada, 2002; Volume 22, p. 109. [Google Scholar]
  2. Naor, A.; Gal, Y.; Peres, M. The inherent variability of water stress indicators in apple, nectarine and pear orchards, and the validity of a leaf-selection procedure for water potential measurements. Irrig. Sci. 2005, 24, 129–135. [Google Scholar] [CrossRef]
  3. Jones, H.G. Irrigation scheduling: Advantages and pitfalls of plant-based methods. J. Exp. Bot. 2004, 407, 2427. [Google Scholar] [CrossRef] [Green Version]
  4. Fernández, J.E.; Cuevas, M.V. Irrigation scheduling from stem diameter variations: A review. Agric. For. Meteorol. 2010, 150, 135–151. [Google Scholar] [CrossRef]
  5. Argyrokastritis, I.G.; Papastylianou, P.T.; Alexandris, S. Leaf Water Potential and Crop Water Stress Index variation for full and deficit irrigated cotton in Mediterranean conditions. Agric. Agric. Sci. Procedia 2015, 4, 463–470. [Google Scholar] [CrossRef] [Green Version]
  6. Wang, X.; Meng, Z.; Chang, X.; Deng, Z.; Li, Y.; Lv, M. Determination of a suitable indicator of tomato water content based on stem diameter variation. Sci. Hortic. 2017, 215, 142–148. [Google Scholar] [CrossRef]
  7. Ojeda, H.; Deloire, A.; Carbonneau, A. Influence of water deficits on grape berry growth. Vitis 2001, 40, 141–145. [Google Scholar] [CrossRef]
  8. González-Fernández, A.B.; Rodríguez-Pérez, J.R.; Marcelo, V.; Valenciano, J.B. Using field spectrometry and a plant probe accessory to determine leaf water content in commercial vineyards. Agric. Water Manag. 2015, 156, 43–50. [Google Scholar] [CrossRef]
  9. Gao, Y.; Qiu, J.W.; Miao, Y.L.; Qiu, R.C.; Li, H.; Zhang, M. Prediction of Leaf Water Content in Maize Seedlings Based on Hyperspectral Information. IFAC-Pap. 2019, 52, 263–269. [Google Scholar] [CrossRef]
  10. Li, B.; Zhao, X.T.; Zhang, Y.; Zhang, S.J.; Luo, B. Prediction and monitoring of leaf water content in soybean plants using terahertz time-domain spectroscopy. Comput. Electron. Agric. 2020, 170, 105239. [Google Scholar] [CrossRef]
  11. Jiménez, M.N.; Navarro, F.B.; Sánchez-Miranda, A.; Ripoll, M.A. Using stem diameter variations to detect and quantify growth and relationships with climatic variables on a gradient of thinned Aleppo pines. For. Ecol. Manag. 2019, 442, 53–62. [Google Scholar] [CrossRef]
  12. Ortuño, M.F.; García-Orellana, Y.; Conejero, W.; Ruiz-Sanchez, M.C.; Mounzer, O.; Alarcon, J.J.; Torrecillas, A. Relationships Between Climatic Variables and Sap Flow, Stem Water Potential and Maximum Daily Trunk Shrinkage in Lemon Trees. Plant Soil 2006, 279, 229–242. [Google Scholar] [CrossRef]
  13. Leperen, W.V.; Volkov, V.S.; Meeteren, U.V. Distribution of xylem hydraulic resistance in fruiting truss of tomato influenced by water stress. J. Exp. Bot. 2003, 54, 317–324. [Google Scholar] [CrossRef] [Green Version]
  14. Ortuño, M.F.; Conejero, W.; Moreno, F.; Moriana, A.; Intrigliolo, D.S.; Biel, C.; Mellisho, C.D.; Pérez-Pastor, A.; Domingo, R.; Ruiz-Sánchez, M.C.; et al. Could trunk diameter sensors be used in woody crops for irrigation scheduling? A review of current knowledge and future perspectives. Agric. Water Manag. 2010, 97, 1–11. [Google Scholar] [CrossRef]
  15. Schepper, V.D.; Dusschoten, D.V.; Copini, P.; Jahnke, S.; Steppe, K. MRI links stem water content to stem diameter variations in transpiring trees. J. Exp. Bot. 2012, 63, 2645–2653. [Google Scholar] [CrossRef] [Green Version]
  16. Goldhamer, D.A.; Fereres, E. Irrigation scheduling of almond trees with trunk diameter sensors. Irrig. Sci. 2004, 23, 11–19. [Google Scholar] [CrossRef]
  17. Badal, E.; Buesa, I.; Guerra, D.; Bonet, L.; Ferrer, P.; Intrigliolo, D.S. Maximum diurnal trunk shrinkage is a sensitive indicator of plant water, stress in Diospyros kaki (Persimmon) trees. Agric. Water Manag. 2010, 98, 143–147. [Google Scholar] [CrossRef]
  18. Doltra, J.; Oncins, J.A.; Bonany, J.; Cohen, M. Evaluation of plant-based water status indicators in mature apple trees under field conditions. Irrig. Sci. 2007, 25, 351–359. [Google Scholar] [CrossRef]
  19. Velez, J.E.; Intrigliolo, D.S.; Castel, J.R. Scheduling deficit irrigation of citrus trees with maximum daily trunk shrinkage. Agric. Water Manag. 2007, 90, 197–204. [Google Scholar] [CrossRef]
  20. Moriana, A.; Fereres, E. Plant indicators for scheduling irrigation of young olive trees. Irrig. Sci. 2002, 21, 83–90. [Google Scholar] [CrossRef]
  21. Fereres, E.; Goldhamer, D.A. Suitability of stem diameter vriations and water potential as indicators for irrigation scheduling of almond trees. J. Hortic. Sci. Biotechnol. 2003, 78, 139–144. [Google Scholar] [CrossRef]
  22. Intrigliolo, D.S.; Castel, J.R. Continuous measurement of plant and soil water status for irrigation scheduling in plum. Irrig. Sci. 2004, 23, 93–102. [Google Scholar] [CrossRef]
  23. Ortuño, M.F.; García-Orellana, Y.; Conejero, W.; Pérez-Sarmiento, F.; Torrecillas, A. Assessment of maximum daily trunk shrinkage signal intensity threshold values for deficit irrigation in lemon trees. Agric. Water Manag. 2008, 96, 80–86. [Google Scholar] [CrossRef]
  24. Katerji, N.; Itier, B.; Ferreira, I. Etude de quelques criteres indicateurs de l’etat hydrique d’une culture de tomate en region semi-aride. Agronomie 1988, 8, 425–433. [Google Scholar] [CrossRef] [Green Version]
  25. Rötzer, T.; Biber, P.; Moser, A.; Schäfer, C.; Pretzsch, H. Stem and root diameter growth of European beech and Norway spruce under extreme drought. For. Ecol. Manag. 2017, 406, 184–195. [Google Scholar] [CrossRef]
  26. Matimati, I.; Musil, C.F.; Raitt, L.; February, E.C. Diurnal stem diameter variations show CAM and C3 photosynthetic modes and CAM-C3 switches in arid South African succulent shrubs. Agric. For. Meteorol. 2012, 161, 72–79. [Google Scholar] [CrossRef]
  27. Tognetti, R.; Giovannelli, A.; Lavini, A.; Morelli, G.; Fragnito, F.; d’Andria, R. Assessing environmental controls over conductances through the soil-plant-atmosphere continuum in an experimental olive tree plantation of southern Italy. Agric. For. Meteorol. 2009, 149, 1229–1243. [Google Scholar] [CrossRef]
  28. Devine, W.D.; Harrington, C.A. Factors affecting diurnal stem contraction in young Douglas-fir. Agric. For. Meteorol. 2011, 151, 414–419. [Google Scholar] [CrossRef]
  29. Du, S.Q.; Tong, L.; Zhang, X.T.; Kang, S.Z.; Du, T.S.; Li, S.; Ding, R.S. Signal intensity based on maximum daily stem shrinkage can reflect the water status of apple trees under alternate partial root-zone irrigation. Agric. Water Manag. 2017, 190, 21–30. [Google Scholar] [CrossRef]
  30. Tuccio, L.; Piccolo, E.L.; Battelli, R.; Matteoli, S.; Remorini, D. Physiological indicators to assess water status in potted grapevine (Vitis vinifera L.). Sci. Hortic. 2019, 255, 8–13. [Google Scholar] [CrossRef]
  31. Conesa, M.R.; Torres, R.; Domingo, R.; Navarro, H.; Soto, F.; Pérez-Pastor, A. Maximum daily trunk shrinkage and stem water potential reference equations for irrigation scheduling in table grapes. Agric. Water Manag. 2016, 172, 51–61. [Google Scholar] [CrossRef]
  32. Gallardo, M.; Thompson, R.B.; Valdez, L.C.; Fernandez, M.D. Use of stem diameter variations to detect plant water stress in tomato. Irrig. Sci. 2006, 24, 241–255. [Google Scholar] [CrossRef]
  33. Goldhamer, D.A.; Fereres, E. Irrigation scheduling protocols using continuously recorded trunk diameter measurements. Irrig. Sci. 2001, 20, 115–125. [Google Scholar] [CrossRef]
  34. Miralles, J.; Franco, J.A.; Sánchez-Blanco, M.J.; Bañón, S. Effects of pot-in-pot production system on water consumption 0034, stem diameter variations and photochemical efficiency of spindle tree irrigated with saline water. Agric. Water Manag. 2016, 170, 167–175. [Google Scholar] [CrossRef]
  35. Allen, R.G. Using the FAO-56 dual crop coefficient method over an irrigated region as part of an evapotranspiration intercomparison study. J. Hydrol. 2000, 229, 27–41. [Google Scholar] [CrossRef]
  36. Abdelfatah, A.; Aranda, X.; Savé, R.; Herralde, F.D.; Biel, C. Evaluation of the response of maximum daily shrinkage in young cherry trees submitted to water stress cycles in a greenhouse. Agric. Water Manag. 2013, 118, 150–158. [Google Scholar] [CrossRef]
  37. Kramer, P.J. Water Relations of Plants; Academic Press: New York, NY, USA, 1983. [Google Scholar]
  38. Turner, N.C. Techniques and experimental approaches for the measurement of plant water status. Plant Soil 1981, 58, 339–366. [Google Scholar] [CrossRef]
  39. Zhang, J.G.; He, Q.Y.; Shi, W.Y.; Otsuki, K.; Yamanaka, N.; Du, S. Radial variations in xylem sap flow and their effect on whole-tree water use estimates. Hydrol. Process. 2015, 29, 4993–5002. [Google Scholar] [CrossRef]
  40. Irvine, J.; Grace, J. Continuous measurements of water tensions in the xylem of trees based on the elastic properties of wood. Planta 1997, 202, 455–461. [Google Scholar] [CrossRef]
  41. Xiong, W.; Wang, Y.H.; Yu, P.T.; Liu, H.L.; Shi, Z.J.; Guan, W. Growth in stem diameter of Larix principis-rupprechtii and its response to meteorological factors in the south of Liupan Mountain, China. Acta Ecol. Sin. 2007, 27, 432–440. [Google Scholar] [CrossRef]
  42. Zhang, J.Y.; Duan, A.W.; Meng, Z.J.; Liu, Z.G. Stem diameter variations of cotton under different water conditions. Trans. Chin. Soc. Agric. Eng. 2005, 21, 7–11. [Google Scholar]
  43. Intrigliolo, D.S.; Castel, J.R. Evaluation of grapevine water status from trunk diameter variations. Irrig. Sci. 2007, 26, 49–59. [Google Scholar] [CrossRef] [Green Version]
  44. Girón, I.F.; Corell, M.; Martín-Palomo, M.J.; Galindo, A.; Torrecillas, A.; Moreno, F.; Moriana, A. Feasibility of trunk diameter fluctuations in the scheduling of regulated deficit irrigation for table olive trees without reference trees. Agric. Water Manag. 2015, 161, 114–126. [Google Scholar] [CrossRef] [Green Version]
  45. De la Rosa, J.M.; Conesa, M.R.; Domingo, R.; Torres, R.; Pérez-Pastor, A. Feasibility of using trunk diameter fluctuation and stem water potential reference lines for irrigation scheduling of early nectarine trees. Agric. Water Manag. 2013, 126, 133–141. [Google Scholar] [CrossRef]
  46. Kanai, S.; Adu-Gymfi, J.; Lei, K.; Lto, J.; Ohkura, K.; Moghaieb, R.E.A.; El-shemy, H.; Mohapatra, R.; Mohapatra, P.K.; Saneoka, H.; et al. N-deficiency damps out circadian rhythmic changes of stem diameter dynamics in tomato plant. Plant Sci. 2008, 174, 183–191. [Google Scholar] [CrossRef]
  47. Swaef, T.D.; Steppe, K.; Lemeur, R. Raoul Lemeur. Determining reference values for stem water potential and maximum daily trunk shrinkage in young apple trees based on plant responses to water deficit. Agric. Water Manag. 2009, 96, 541–550. [Google Scholar] [CrossRef]
  48. Conejero, W.; Mellisho, C.D.; Ortuo, M.F.; Moriana, A.; Moreno, F.; Torrecillas, A. Using trunk diameter sensors for regulated deficit irrigation scheduling in early maturing peach trees-ScienceDirect. Environ. Exp. Bot. 2011, 71, 409–415. [Google Scholar] [CrossRef]
  49. Moriana, A.; Moreno, F.; Girón, I.F.; Conejero, W.; Ortuño, M.F.; Morales, D.; Corell, M.; Torrecillas, A. Seasonal changes of maximum daily shrinkage reference equations for irrigation scheduling in olive trees: Influence of fruit load. Agric. Water Manag. 2011, 99, 121–127. [Google Scholar] [CrossRef]
  50. King, G.; Fonti, P.; Nievergelt, D.; Büntgen, U.; Frank, D. Climatic drivers of hourly to yearly tree radius variations along a 6 °C natural warming gradient. Agric. For. Meteorol. 2013, 168, 36–46. [Google Scholar] [CrossRef]
  51. Janbek, B.M.; Stockie, J.M. Asymptotic and numerical analysis of a porous medium model for transpiration-driven sap flow in trees. Siam J. Appl. Math. 2017, 78, 2028–2056. [Google Scholar] [CrossRef] [Green Version]
  52. De la Rosa, J.M.; Conesa, M.R.; Domingo, R.; Pérez-Pastor, A. A new approach to ascertain the sensitivity to water stress of different plant water indicators in extra-early nectarine trees. Sci. Hortic. 2014, 169, 147–153. [Google Scholar] [CrossRef]
  53. De la Rosa, J.M.; Domingo, R.; Gómez-Montiel, J.; Pérez-Pastor, A. Implementing deficit irrigation scheduling through plant water stress indicators in early nectarine trees. Agric. Water Manag. 2015, 152, 207–216. [Google Scholar] [CrossRef]
  54. Shackel, K.A.; Ahmadi, H.; Biasi, W.; Buchner, R.; Goldhamer, D.; Gurusinghe, S.; Hasey, J.; Kester, D.; Krueger, B.; Lampinen, B.; et al. Plant water status as an index of irrigation need in deciduous fruit trees. HortTechnology 1997, 7, 23–29. [Google Scholar] [CrossRef] [Green Version]
  55. Naor, A. Midday stem water potential as a plant water stress indicator for irrigation scheduling in fruit trees. Acta Hortic. 2000, 537, 447–454. [Google Scholar] [CrossRef]
  56. Choné, X.; Cornelis, V.L.; Denis, D.; Gaudillère, J.P. Stem Water Potential is a Sensitive Indicator of Grapevine Water Status. Ann. Bot. 2001, 4, 477–483. [Google Scholar] [CrossRef] [Green Version]
  57. Cuevas, M.V.; Torres-Ruiz, J.M.; Álvarez, R.; Jiménez, M.D.; Cuerva, J.; Fernández, J.E. Assessment of trunk diameter variation derived indices as water stress indicators in mature olive trees. Agric. Water Manag. 2010, 97, 1293–1302. [Google Scholar] [CrossRef]
Figure 1. Relative variation curve of stem diameter during different stages. (a) Represents the vegetative stage, (b) represents the flowering stage, (c) represents the fruit expansion stage, and (d) represents the coloring mature stage.
Horticulturae 07 00154 g001
Figure 2. The daily change in stem diameter of grapevine under different weathers. Sunny days: 6/23, 6/24; Rainy day: 6/25.
Horticulturae 07 00154 g002
Figure 3. The relationship of MDS with Ta (a), Ra (b), RH (c) and VPD (d).
Horticulturae 07 00154 g003
Figure 4. The relationship of DI with Ta (a), Ra (b), RH (c) and VPD (d).
Horticulturae 07 00154 g004
Figure 5. The correlation of MDS and DI with soil moisture content under different stages. (a) Represents the correlation of MDS with soil moisture content; (b) represents the correlation of DI with soil moisture content. * indicates a significance level of p = 0.05; ** indicates a significance level of p = 0.01.
Horticulturae 07 00154 g005
Figure 6. The change in SIMDS and SIDI under different stages of grapevine. SIMDS represents signal MDS of stem diameter, and SIDI represents signal DI of stem diameter. (a,c,e,g) Represents SIMDS at the vegetative, flowering, fruit expansion and mature stage, respectively. (b,d,f,h) Represents SIDI at the vegetative, flowering, fruit expansion and mature stage, respectively.
Horticulturae 07 00154 g006
Figure 7. The correlation coefficients between SIMDS, SIDI and meteorological factors under different treatments at different stages.
Horticulturae 07 00154 g007
Figure 8. Relationships between SIMDS and SIDI and SWP and RWC under different treatments. (a) Represents the relationship between SWP and SIMDS, (b) represents the relationship between SWP and SIDI, (c) represents the relationship between RWC and SIMDS, and (d) represents the relationship between RWC and SIDI.
Horticulturae 07 00154 g008
Figure 9. The average value of SIMDS and SIDI and coefficient of variation of signal strength under different growth stages. (a) Represents the vegetative stage, (b) represents the flowering stage, (c) represents the fruit expansion stage, and (d) represents the mature stage. Different lowercase letters indicate that there is a statistical difference at P0.05 under different treatments.
Horticulturae 07 00154 g009
Figure 10. The signal-to-noise ratio of SIMDS and SIDI under different treatments at different stages. (a) Represents the vegetative stage, (b) represents the flowering stage, (c) represents the fruit expansion stage, and (d) represents the mature stage. Different lowercase letters indicate that there is a statistical difference of signal-to-noise ratio at P0.05 in the same column.
Horticulturae 07 00154 g010
Table 1. Meteorological data of different cultivation stages in greenhouse.
Cultivation StageTaRaRHVPD
vegetative stage18.8301.053.80.33
flowering stage19.7327.950.40.35
fruit expansion stage22.3421.151.20.34
coloring mature stage25.1362.355.70.32
Note: Ta ( ): air temperature; Ra (w·m−2): solar radiation; RH (%): relative humidity; VPD (kpa): vapor pressure deficit.
Table 2. Physical properties of the soil.
Depth (cm)Textural AnalysisFC
(g·g−1)
PWP
(g·g−1)
Bulk Density
(g·cm−3)
Sand (%)Clay (%)Silt (%)Texture Class
0–4087.545.277.19Aeolian soil13.182.311.64
40–8070.2319.5310.24Sandy loam17.456.381.46
Note: FC: field capacity; PWP: permanently wilting point.
Table 3. Irrigation amount of grapevine under different cultivation stages.
Cultivation Stage Irrigation DateIrrigation Amount (m3∙ha−1)
T1T2T3
vegetative stage3/11293.61234.80176.02
3/19293.61234.65175.55
3/27293.60234.60175.34
4/06293.62234.65175.62
Flowering stage4/15341.40273.05204.60
4/25341.39273.04204.15
Fruit expansion stage5/05341.39273.00204.20
5/13341.37272.58204.14
5/20341.42272.69204.47
5/27341.41273.10204.34
Coloring mature stage6/05293.60234.50175.59
6/15293.61234.55176.30
Total irrigation amount381030452280
Table 4. Correlation analysis of MDS and DI in different stages under different treatments.
TreatmentAir TemperatureSolar RadiationRelative HumidityVapor Pressure Difference
MDSDIMDSDIMDSDIMDSDI
W10.601 **0.723 **0.534 **0.671 **0.498 **0.672 **0.547 **0.705 **
W20.674 **0.710 **0.594 **0.606 **0.585 **0.663 **0.673 **0.721 **
W30.692 **0.683 **0.642 **0.664 **0.635 **0.623 **0.686 **0.631 **
Note: The correlation between MDS and meteorological factors. ** Correlation is significant at the 0.01 level.
Table 5. Stem water potential and leaf relative water content model with MDS and DI.
IndexStem Water PotentialRelative Water Content of Leaves
ModelR2pModelR2p
MDSSWPW1 = −0.162MDS + 0.0270.338 *0.023RWCW1 = −0.004MDS + 0.4380.315 *0.030
SWPW2 = −0.302MDS − 0.0240.498 **0.003RWCW2 = −0.014MDS + 1.2040.385 *0.014
SWPW3 = −0.064MDS + 0.0170.1440.163RWCW3 = −0.010MDS + 0.8370.1670.130
DISWPW1 = 0.215DI + 0.1050.391 *0.013RWCW1 = 0.005DI − 0.3820.296 *0.036
SWPW2 = 0.126DI + 0.0810.356 *0.019RWCW2 = 0.006DI − 0.4840.338 *0.023
SWPW3 = 0.023DI + 0.0460.299 *0.035RWCW3 = 0.005DI − 0.3080.410 *0.010
* indicates a significance level of p = 0.05; ** indicates a significance level of p = 0.01.
Table 6. Stem water potential and leaf relative water content model with SIMDS and SIDI.
IndexStem Water PotentialRelative Water Content of Leaves
ModelR2pModelR2p
SIMDSSWPW1 = −0.221SIMDS − 0.0250.723 ***<0.001RWCW1 = −0.100SIDI + 0.9510.710 ***<0.001
SWPW2 = −0.362SIMDS + 0.0170.762 ***<0.001RWCW2 = −0.045SIDI + 0.8610.695 ***<0.001
SWPW3 = −0.484SIMDS − 0.7110.719 ***<0.001RWCW3 = −0.028SIDI + 0.7570.599 **0.001
SIDISWPW1 = 0.205SIMDS − 0.3860.717 ***<0.001RWCW1 = 0.073SIDI + 0.8030.705 ***<0.001
SWPW2 = 0.101SIMDS − 0.5190.691 ***<0.001RWCW2 = 0.024SIDI + 0.7760.685 ***<0.001
SWPW3 = 0.172SIMDS − 1.6330.640 ***<0.001RWCW3 = 0.015SIDI + 0.7000.660 ***<0.001
Note: ** indicates a significance level of p = 0.01; *** indicates a significance level of p < 0.001.
Table 7. The model of SIDI and SIMDS with soil water content at different growth stages.
StageTreatmentSIMDSR2pSIDIR2p
Vegetative stage W1SIMDS = −39.485θ + 6.3040.688 ***<0.001SIDI = 39.961θ − 4.2860.739 ***<0.001
W2SIMDS = −36.246θ + 5.8480.566 ***<0.001SIDI = 187.96θ − 22.0770.448 *0.023
W3SIMDS = −53.413θ + 7.6390.3580.067SIDI = 162.48θ − 19.6970.451 *0.019
Flowering stageW1SIMDS = −45.420θ + 7.0950.514 ***<0.001SIDI = 83.604θ − 9.6260.631 ***<0.001
W2SIMDS = −37.140θ + 5.3820.652 ***<0.001SIDI = 72.731θ − 7.05310.762 ***<0.001
W3SIMDS= −18.224θ + 3.0420.565 ***<0.001SIDI = 137.85θ − 14.0410.676 ***<0.001
Fruit expansion stageW1SIMDS = −37.788θ + 5.7950.589 ***<0.001SIDI = 37.116θ − 3.6870.389 *0.038
W2SIMDS = −34.848θ + 4.9830.560 ***<0.001SIDI = 27.010θ − 3.1400.3130.087
W3SIMDS = −53.532θ − 8.8700.575 ***<0.001SIDI = 74.046θ − 8.7380.495 *0.016
Mature stageW1SIMDS = −13.717θ + 2.2590.409 *0.027SIDI = 80.714θ − 7.3680.0220.433
W2SIMDS = −94.494θ + 12.9670.621 ***<0.001SIDI = 143.48θ − 15.6370.1480.121
W3SIMDS = −18.736θ+ 2.3870.646 ***<0.001SIDI = 146.91θ − 16.0310.2320.885
Note: θ represents the soil moisture content. * indicates a significance level of P0.05; *** indicates a significance level of p < 0.001.
Publisher’s Note: MDPI stays neutral with regard to jurisdictional claims in published maps and institutional affiliations.

