Article

Decoupling of P from C, N, and K Elements in Cucumber Leaves Caused by Nutrient Imbalance under a Greenhouse Continuous Cropping System

1
College of Horticulture, Shenyang Agricultural University, Shenyang 110866, China
2
National & Local Joint Engineering Research Center of Northern Horticultural Facilities Design & Application Technology (Liaoning), Shenyang 110866, China
3
Key Laboratory of Protected Horticulture, Ministry of Education, Shenyang 110866, China
4
College of Land and Environment, Shenyang Agricultural University, Shenyang 110866, China
*
Authors to whom correspondence should be addressed.
Horticulturae 2021, 7(12), 528; https://doi.org/10.3390/horticulturae7120528
Submission received: 29 September 2021 / Revised: 21 November 2021 / Accepted: 23 November 2021 / Published: 29 November 2021
(This article belongs to the Special Issue Advances in Protected Vegetable Cultivation)

Abstract

:
There is insufficient information regarding the stoichiometric variation and coupling status of carbon (C), nitrogen (N), phosphorus (P), and potassium (K) in the leaves of nutrient-enriched greenhouse agroecosystems with increasing planting time. Therefore, we assessed the variation in elemental stoichiometry ratios in soil and cucumber (Cucumis sativus L.) leaves, and the coupling status of elemental utilization in the leaves under continuous cropping systems using natural (only soil; i.e., control soil, CO) and artificial (soil + straw + chicken + urea; i.e., straw mixture soil, ST) soil via monitoring studies for 11 years in a solar greenhouse. Soil organic C, total N, and total P concentrations increased by 63.4%, 72.7%, and 144.3% in the CO, respectively, after 11 years of cultivation (compared to the first year), and by 18.1%, 24.3%, and 117.7% in the ST under continuous cropping conditions, respectively. Total K concentrations remained unchanged in both soils. Moreover, the availability of these soil elements increased to different degrees in both soils after 11 years of planting. Additionally, the leaf P concentration increased by 9.8% in the CO, while leaf N and K concentrations did not change, suggesting decoupling of P utilization from that of N and K in leaves under a continuous cropping system. These findings suggest that imbalanced soil nutrients under continuous cropping conditions results in decoupling of P from N and K in the utilization of leaf nutrients.

1. Introduction

Ecological stoichiometry focuses on the elemental balance of organisms from the subcellular to the ecosystem level and has been widely applied for the analysis of the structure and function of different ecosystems (e.g., energy flow and material cycling of carbon (C), nitrogen (N), and phosphorus (P)) [1]. In the process of biogeochemical cycling, the equilibrium state between elements (elemental coupling) plays an important role in the primary productivity of ecosystems [2,3,4]. Subject to biotic and abiotic factors, C, N, and P cycling can become decoupled. In terrestrial ecosystems, decoupled of N or P in plants can affect plant growth [5,6]. In contrast, in anthropogenically disturbed agroecosystems, K may also become decoupled, which subsequently affects crop growth and yield [7,8].
The coupled utilization of plant elements is influenced by soil elemental changes and plant nutrient demand. In agroecosystems, large amounts of organic and chemical fertilizers are applied to the soil to produce higher economic crop yields [9]. However, regular fertilization, together with the frequent use of arable land, inevitably alters soil C, N, P, and K concentrations [10] as well as their stoichiometric ratios [11,12], consequently impacting nutrient uptake by plants [13,14]. In addition, as crop nutrient uptake is selective (plant nutrient requirements), preferential uptake by crops can cause an imbalance in the concentration and ratio of multiple soil elements, which subsequently impacts nutrient utilization by crops. For example, soybean and wheat require more K than N and P [15], which may cause soil K deficiency during crop growth. Therefore, exogenous nutrient input during long-term tillage can affect the concentration of soil elements, as well as their availability [9,16,17], which in turn can alter the coupled utilization process of elements between soil and plants. Although plant nutrient utilization and its coupling status have been studied [18,19,20], it is unclear how elements in plants leaves, which are photosynthetic organs, respond to such changes over successive planting time gradients.
Greenhouse cultivation is a common method of vegetable production in China, characterized by high nutrient inputs and continuous cultivation [21]. It has been estimated that the fertilizer content in greenhouses in China is approximately 4.1 times higher than that in open fields, which greatly exceeds the requirements of crops [22]. However, the fertilizer utilization rate of plants is less than 10% [23]. In such a system with frequent changes in soil nutrients, the coupled utilization status of crop nutrients is uncertain. Therefore, it is necessary to clarify the changes in C, N, P, and K concentrations in soil and crop leaves and their coupled status in greenhouse ecosystems. Supplementing this information will help to improve the management of soil balance fertilization in intensive greenhouse agricultural systems and provide a theoretical basis for maintaining the sustainability of continuous cropping systems for vegetables in solar greenhouses.
In this study, we aimed to assess the variation in elemental stoichiometric ratios in soil and cucumber (Cucumis sativus L.) leaves using natural soils and artificial soils for up to 11 years under continuous cropping systems. We further explored the coupling effects of elemental utilization in leaves. As such, the study hypotheses were: (1) the elements, and their stoichiometric ratios in soil and plant leaves, are uniquely altered under continuous tillage, as evidenced by accumulation of soil organic C, total N, total P, and total K concentrations and their increased availability in soil with increasing planting time. Meanwhile, the stoichiometric ratios of elements in leaves remain stable due to their regulatory capacity. (2) Imbalanced soil nutrients, caused by fertilizer application under continuous tillage, induces the decoupling of element utilization in leaves.

2. Materials and Methods

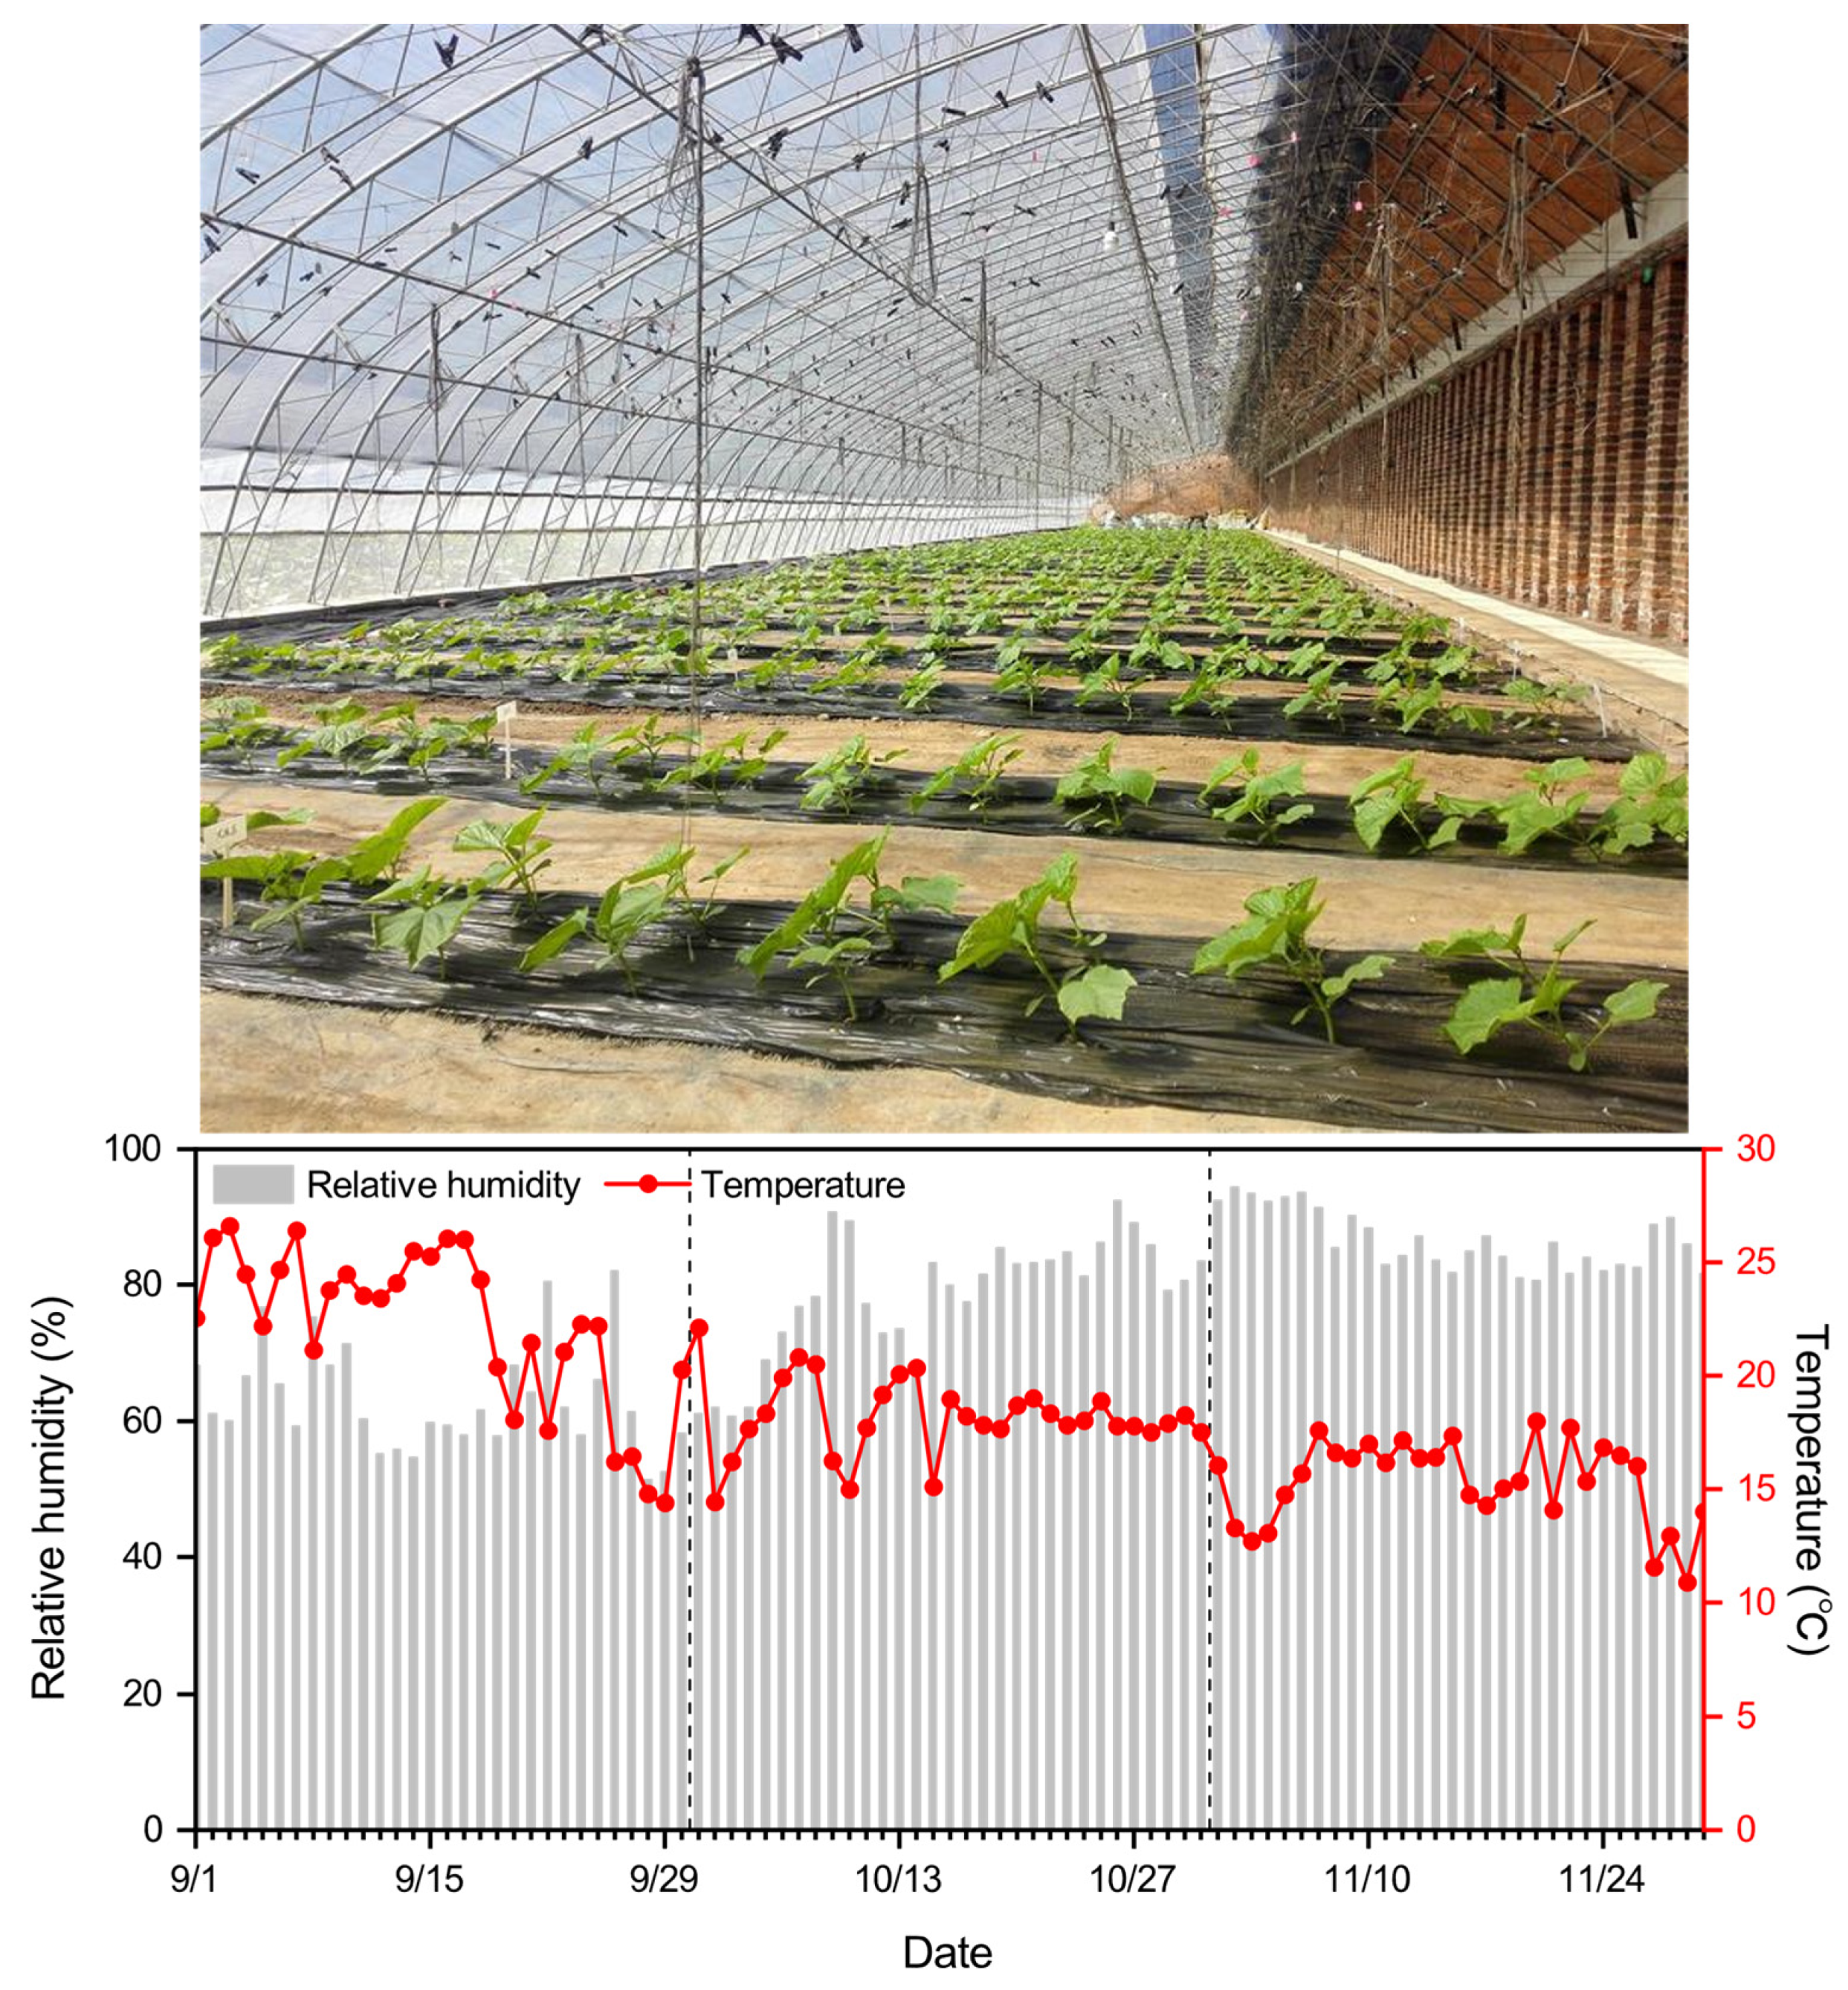
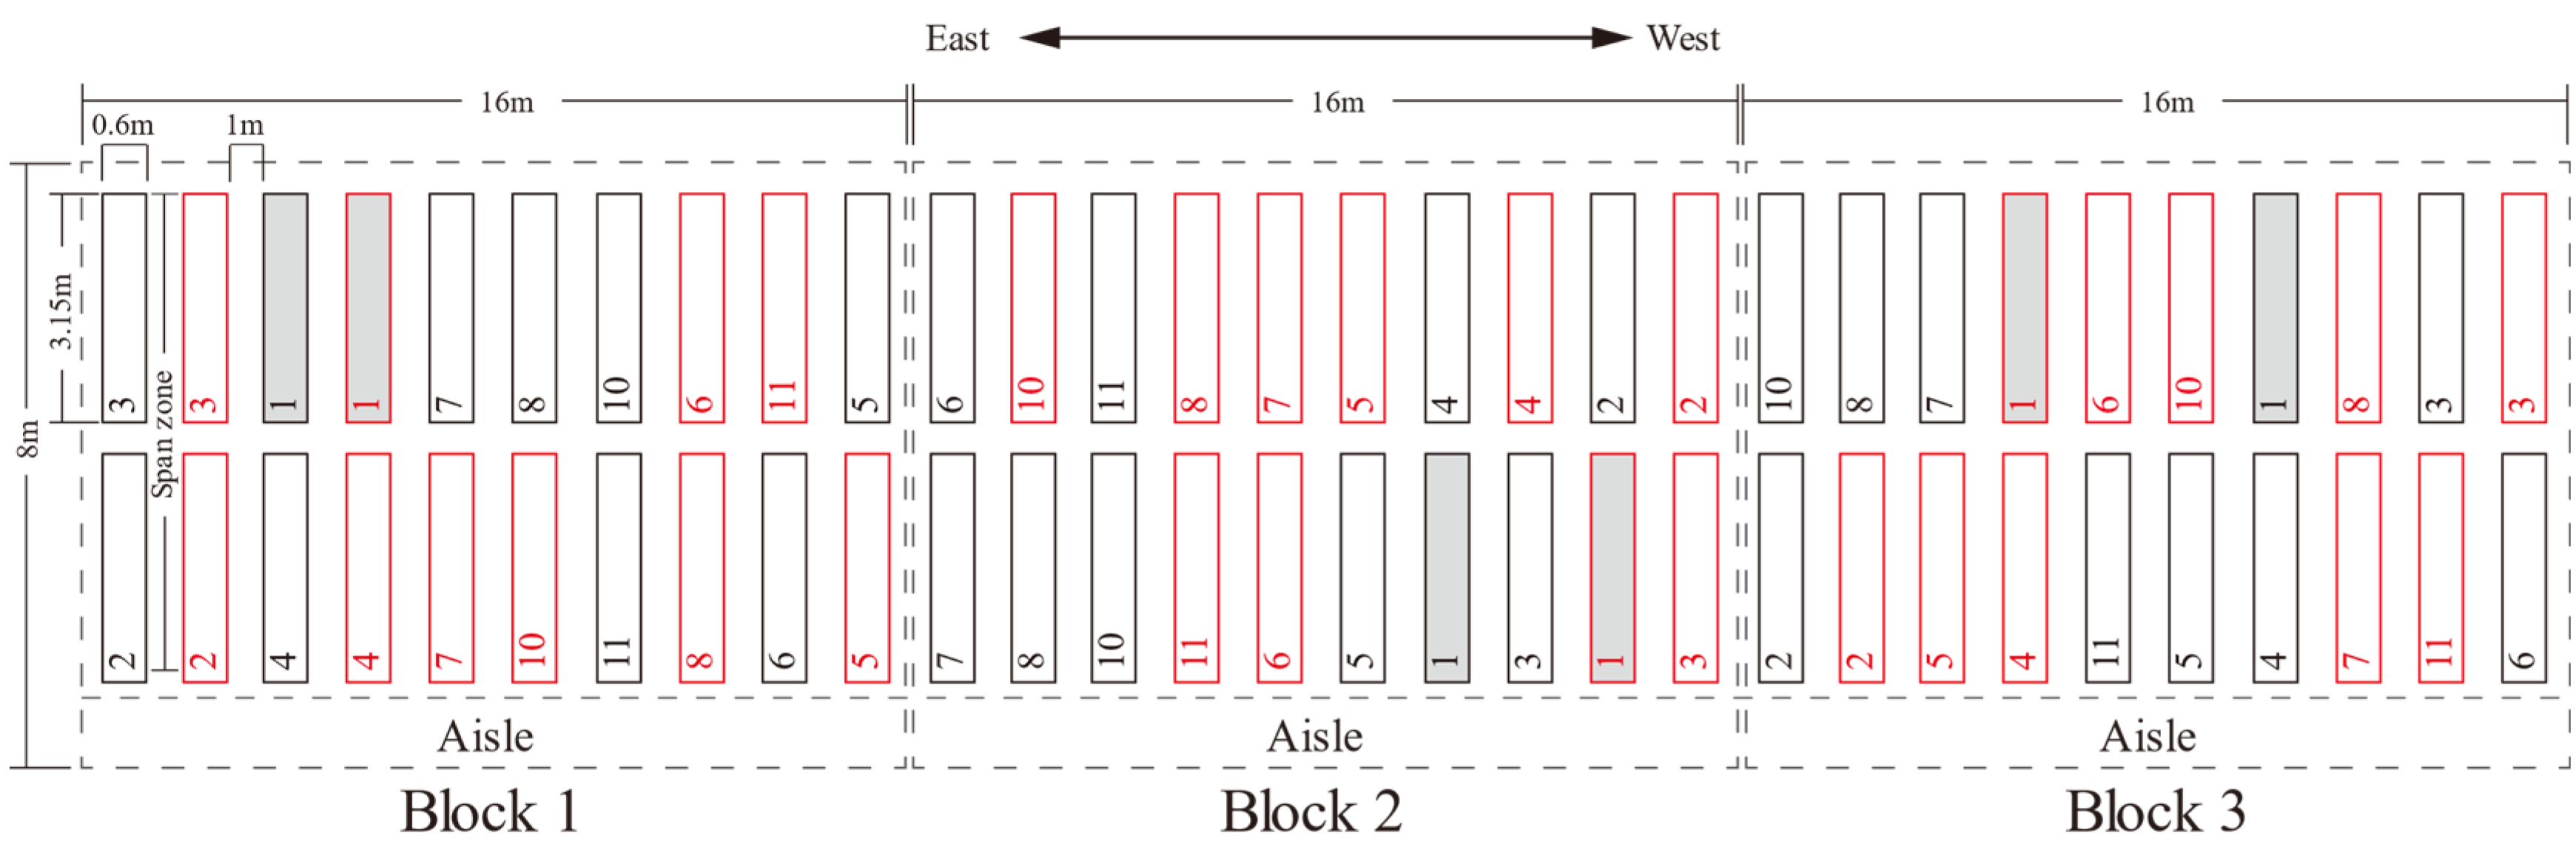
2.1. Study Site and Experimental Design

The experiment was conducted in a solar greenhouse (60 m length and 8 m span) at the Shenyang Agricultural University, Shenyang, Liaoning Province, China (41°49′ N, 123°33′ E). The temperature and relative humidity in the solar greenhouse during the experiment in autumn 2017 are shown in Figure 1. The tested cultivar of cucumber (Cucumis sativus L.) was “Jin You 30”, which was provided by the Tianjin Kernel Vegetable Research Institute, and is characterized by rapid plant growth, high nodal rate of female plants, straight melon strips, and excellent resistance to low temperatures and weak light.
The experiment was initiated in September 2006. The soil materials for the study were collected from an adjacent fallow field planted with maize, classified as Hapli-Udic Cambisols according to the Food and Agriculture Organization (FAO) classification [24]. The basic chemical properties of the soils are presented in Table 1. In this study, the soil treatment mixed with rice straw mixture (straw + chicken + urea) was designated as the straw mixture soil (soil + straw + chicken + urea, ST; i.e., artificial soil), while the treatment with soil only was designated the control soil (CO; i.e., natural soil). Before the start of the experiment in autumn 2006, a portion of the collected soil was mixed with rice straw (air-dried and cut into 3 cm pieces) at a mass ratio of 1:11 (straw:soil), and 5.1% chicken manure (ratio of the dry weight of the tested soil). The soil mixture (soil + straw + chicken) was maintained at 60% moisture content and fermented at 60 °C for approximately 1.5 months. To accelerate the fermentation process, 0.51% urea was added to the soil mixture, which was then subjected to a single mixing process before planting the cucumber plants; this mixing process was not repeated afterward. The two soil materials (440 kg dry weight) were equally loaded into two plots (length × width × depth = 3.15 m × 0.6 m × 0.3 m). This loading was repeated three times; that is, a total of six new plots were added each year in the CO and ST. To separate the soil materials from the native soil, a plastic membrane with two rows of drainage holes (2 cm diameter) was laid at the bottom of each plot (i.e., at a plot depth of 0.3 m). All CO and ST treatments were performed in a randomized block design (i.e., one replicate of all treatments arranged within a block, for a total of three blocks). A span zone with a width of 1 m was set between two adjacent plots. The above process the accompanying cucumber cultivation process were repeated in September from 2006 to 2010 and in March from 2012 to 2017, and soil materials and plant materials with different planting time from 1 to 11 years were obtained in the CO and ST treatments at the end of the autumn 2017 experiment (Figure 2; Methods S1). Given that soil and plant materials with different planting years were collected from all treatments (CO and ST) in each year’s experiment, only soil and plant materials with different planting time from 1 to 11 years collected at the end of the autumn 2017 experiment were analyzed in this study.
Cucumbers were cultivated twice per year, from March to May (spring) and from September to November (autumn). Before transplanting the cucumber seedlings, 4.5 kg of commercial chicken manure was added to each plot as a base fertilizer (the basic chemical properties are shown in Table 1). Cucumber seedlings with three leaves were transplanted to each plot in early March and early September, in two rows (eight plants per row) with a plant spacing of 0.4 m × 0.4 m. The plants were irrigated by drip irrigation to ensure uniform water content in each plot during the growth period (approximately three months). To adjust for cucumber growth, the total fertilizer application for one block in autumn consisted of 346 kg ha−1 N, 109 kg ha−1 phosphorus pentoxide (P2O5), and 456 kg ha−1 potassium oxide (K2O) (added eight times), and the fertilizer application in spring was 1.3 higher than that in spring (Table S1).
The total fertilizer application was calculated using Equation (1):
M i ( kg   ha 1   year 1 ) = m i × 10,000 8 × 16 ,
where Mi is the total fertilizer application of elements in the fertilizer (i = N, P or K); mi is the amount of fertilizer applied to elements in the block (N = 4.43 kg area−1, P = 1.40 kg area−1, or K = 5.84 kg area−1); 10,000 is the coefficient of conversion for m2 to ha; and (8 × 16) is a block (width × length, m2).
The total fertilizer application of elements in chicken manure was calculated using Equation (2)
M c ( kg   ha 1   year 1 ) = c c × 4.5 × 20 × 10,000 ( 8 × 16 ) × 1000 ,
where Mc is the total amount of fertilizer applied to elements in the chicken manure (c = N, P, or K); cc is the concentration of elements in the chicken manure (N = 51.4 g kg−1, P = 21.6 g kg−1, or K = 35.4 g kg−1); 4.5 is the amount of chicken manure added to a single plot (kg); 20 is the number of plots contained in a block; 10,000 is the coefficient of conversion for m2 to ha; (8 × 16) is a block (width × length, m2); and 1000 is the factor for converting g to kg.

2.2. Sampling

The cumulative cucumber fruit weight was measured continuously in each plot during the fruiting period. When the end of November 2017, all fruit were harvested from each plant, and the cucumber yield per plant (total yield per plant) was calculated. Typical plants were harvested from each plot for biomass measurement (plant biomass, except for fruit). The total plant biomass per plant was equal to the plant biomass plus total yield per plant. The percentage of leaf biomass in the total plant biomass per plant was calculated. The harvest index was expressed as the ratio of total yield per plant to the total plant biomass per plant (defined as cucumber yield per unit biomass). The leaves of the plants were dried at 75 °C for 48 h to determine the dry weight and were ground into a fine powder to determine the concentrations of C, N, P, and K in leaves.
At the end of November 2017, soil samples were collected from the 0–20 cm soil layer and passed through the pore of a 2 mm sieve to remove visible plant residues and gravel. Five sampling points were randomly selected within each plot and mixed to form a composite soil sample (Methods S2). Each sample was then divided into two portions: one was air-dried for determining chemical properties while the other was stored directly at 4 °C for analyzing soil dissolved organic C and inorganic N.

2.3. Chemical Parameters Analysis in Soils and Leaves

The soil pH was determined with a pH meter (PB-10, Sartorius, Goettingen, Germany) after shaking the soil suspension (soil:water = 1:5, w:v) for 30 min [25]. The soil electronic conductivity (EC, soil:water = 1:5, w:v) was determined using a conductivity meter (DDS-307A, INESA Scientific Instrument, Shanghai, China). The soil organic C (SOC) concentration was determined using the sulfuric acid-potassium dichromate (H2SO4–K2Cr2O7) oxidation method [25]. After the dry soil and cucumber leaf samples were passed through a 100-mesh sieve, the total N concentration in the soil and C and N concentrations in the leaves were determined directly using an elemental analyzer (EA3000, EuroVector, Pavia, Italy). The soil dissolved organic C (DOC) was extracted with 0.5 M potassium sulfate (K2SO4) (soil:liquid, 1:4) for 1 h, filtered through a 0.45 μm membrane filter, and then determined with a TOC analyzer (Multi C/N®3000, Analytik Jena, Jena, Germany) [26]. The soil inorganic N (including ammonium nitrogen [NH4+−N] and nitrate nitrogen [NO3−N]) was extracted with 2 M potassium chloride (KCl) and quantified using a continuous flow analysis system (San++, SKALAR, Breda, The Netherlands). The total P in the soil was extracted using the H2SO4–perchloric acid (HClO4) method, the total P in the leaves was extracted by the H2SO4–hydrogen peroxide (H2O2) method, and the available P in the soil was extracted using 0.5 M sodium bicarbonate (NaHCO3; pH = 8.5). The concentration of P in the three extracts was then determined using the molybdenum blue colorimetric method [25]. The available soil K was extracted using 1 M ammonium acetate (NH4OAc), and the total K in the leaves was extracted using the H2SO4–H2O2 method; the concentrations of the two extracts were determined by atomic absorption spectrometry (iCE3000, Thermo Fisher Scientific, Waltham, MA, USA) [25]. The total K concentration in the soils was measured using the nitric acid (HNO3)–hydrofluoric acid (HF)–hydrochloric acid (HCl) digestion method. Briefly, 0.2 g of the soil samples were weighed at the beginning of digestion, and then 5 mL of HNO3, 2 mL of HF, and 2 mL of HCl were added sequentially to the Teflon vessels. The vessels were placed into a microwave digestion unit (MARS6, CEM Corporation, Matthews, CA, USA), and digested using a two-step digestion program. The temperature of the vessels was increased to 190 °C in 20 min, and maintained for another 30 min to allow digestion to be completed. Samples were then diluted to 50 mL in a 50 mL volumetric flask and filtered; the soil K concentration was determined by atomic absorption spectrometry (iCE3000, Thermo Fisher Scientific, Waltham, MA, USA).

2.4. Statistical Analysis

The Kolmogorov–Smirnov test and Levene’s test were used to test the normality and homogeneity of the data. Linear regression analysis and polynomial regression were used to fit the data with increasing planting time, wherein the R2 and k of the model represent the coefficient of determination and slope, respectively (R21 and k1 for CO; R22 and k2 for ST). The Student’s t-test was used to assess differences in the CO and ST data (P < 0.05). All statistical analyses were performed using SPSS 24.0 (SPSS Inc., Chicago, IL, USA). To explore the relationship between plant parameters and soil parameters, Spearman’s correlation was conducted with the ‘psych’ package in R v.4.0.4 (R Development Core Team, 2021).

3. Results

3.1. Response of Elemental Stoichiometry to Planting Time

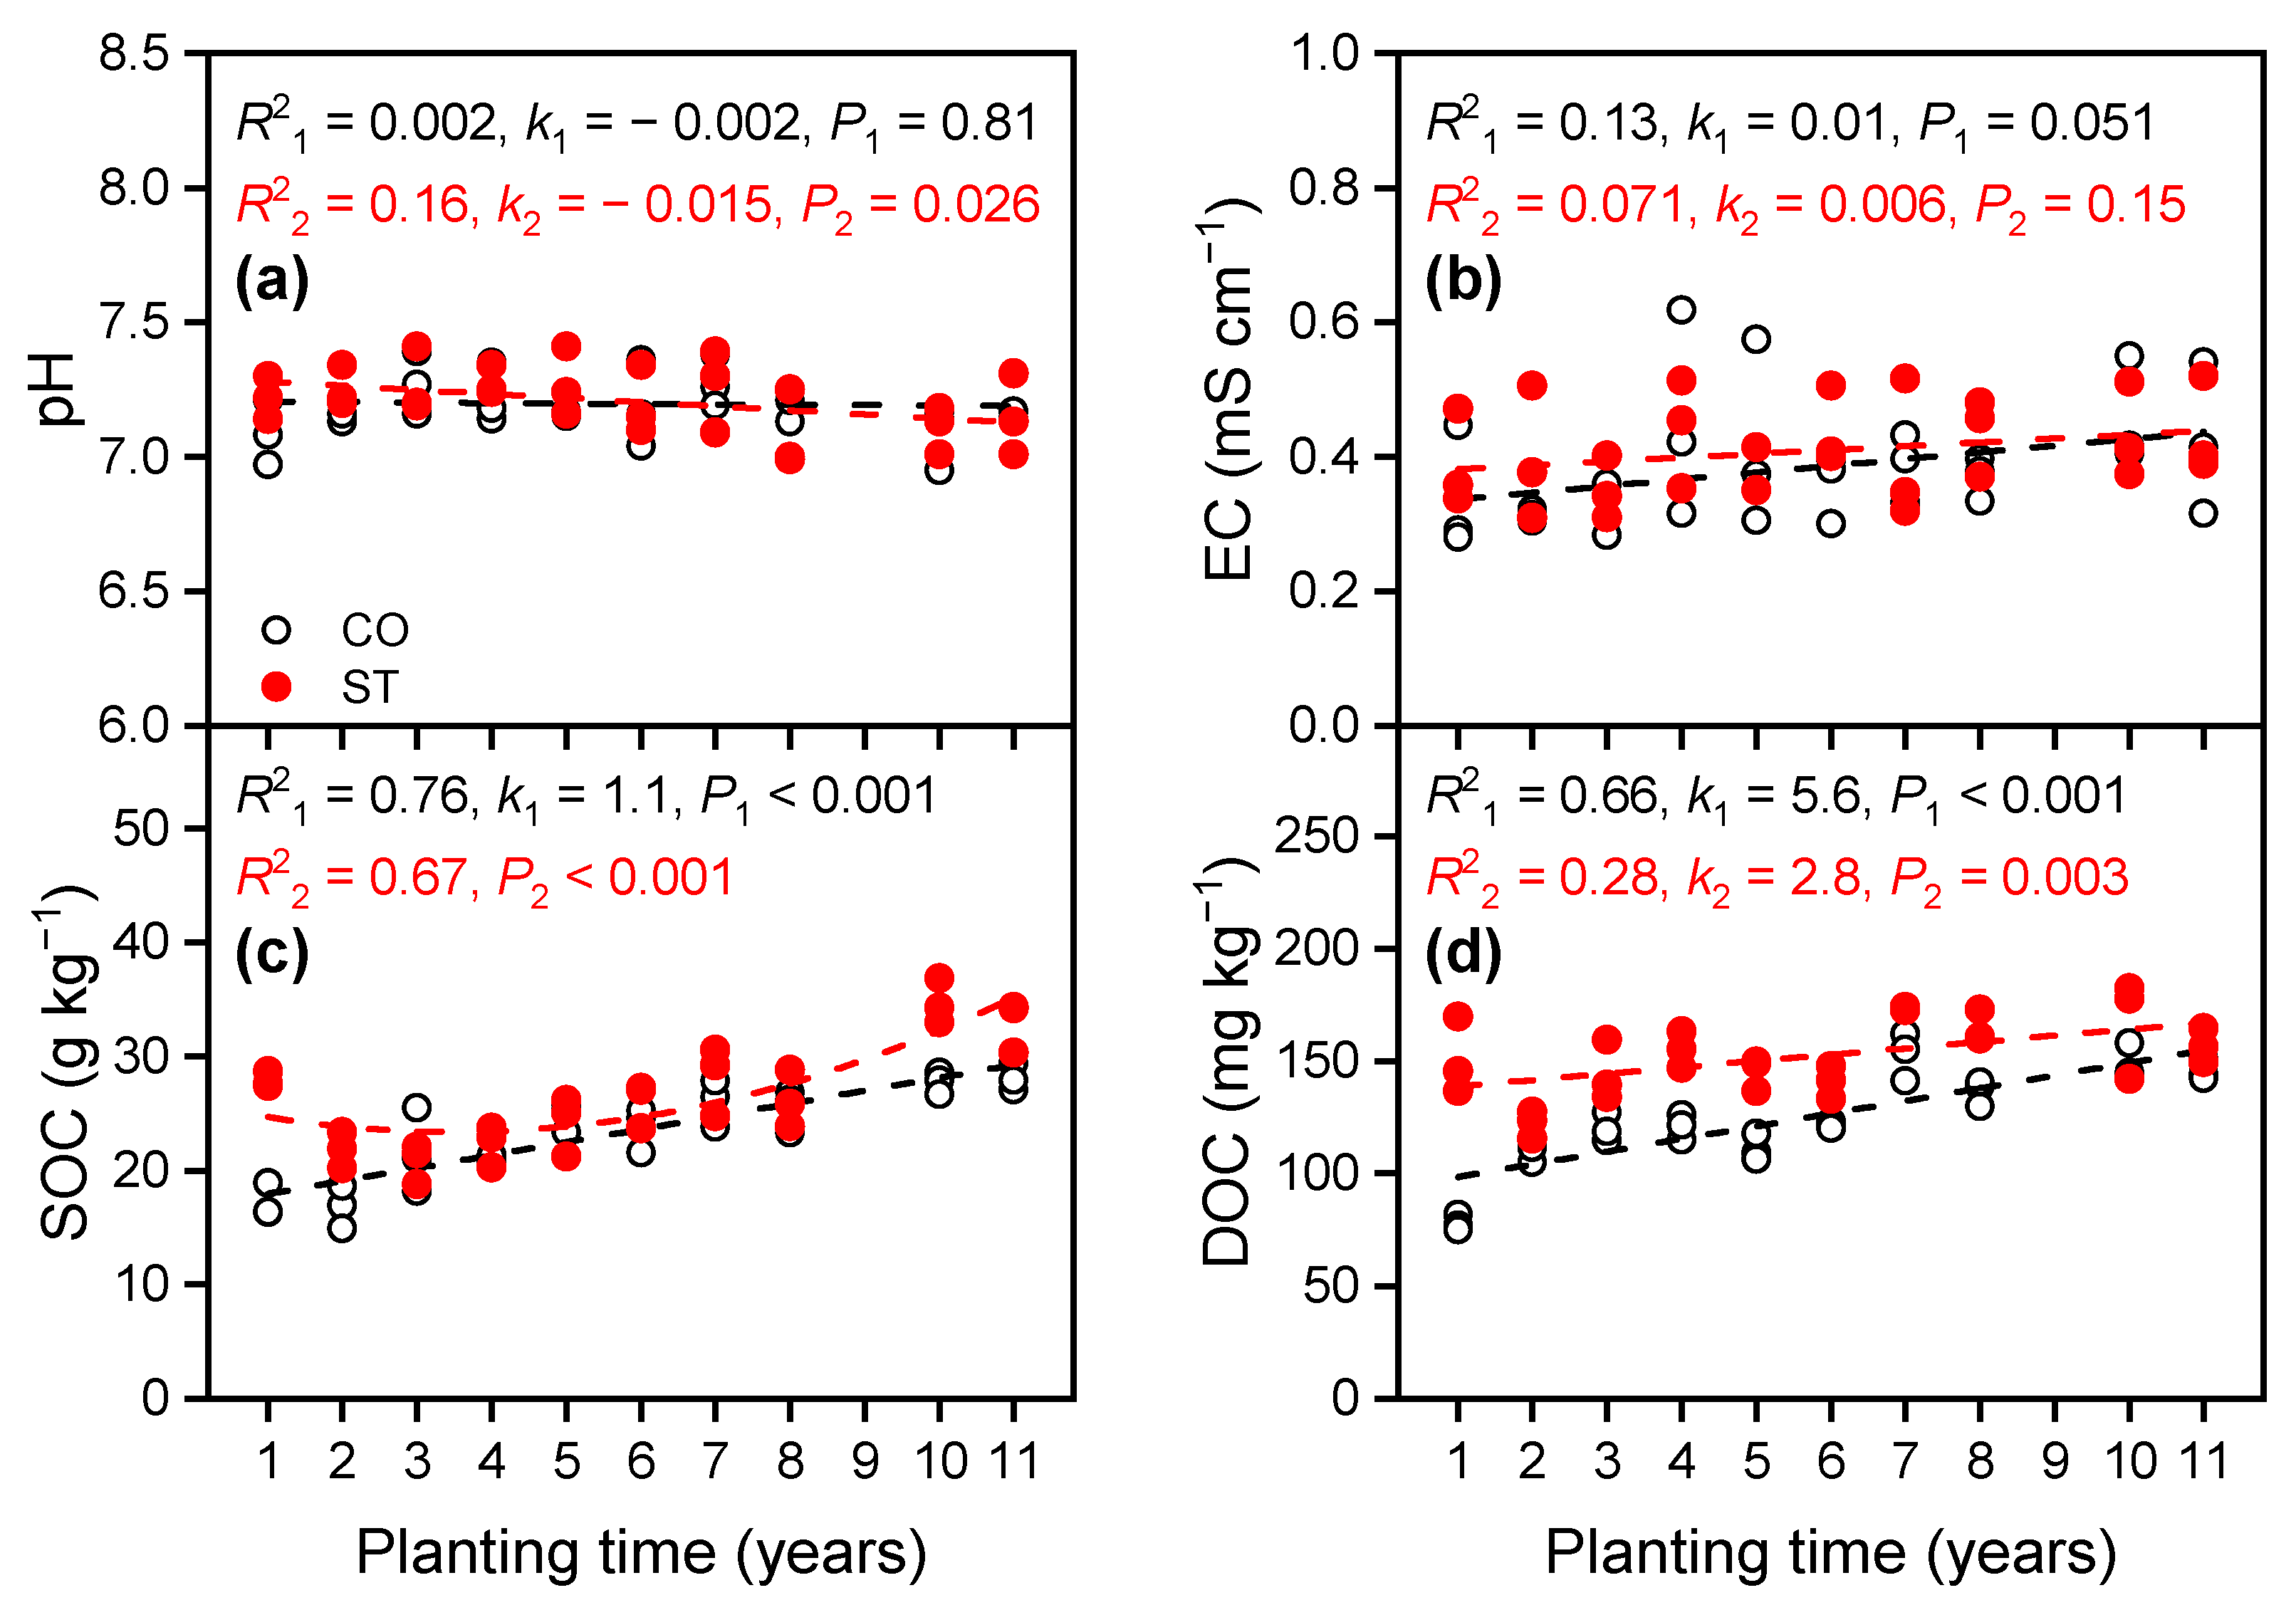
3.1.1. Variations in Chemical Properties in the Soil

As the planting time increased, no significant trend was observed in the pH or electrical conductivity (EC) of the CO; however, the SOC and DOC showed a linear increase (k1 > 0, P1 < 0.05; Figure 3 and Table S2); whereas in the ST, the pH slightly decreased (k2 < 0, P2 < 0.05), and the SOC and DOC showed a non-linear (second-order polynomial, P2 < 0.05) and linear increase (k2 > 0, P2 < 0.05), respectively. Compared to the first year, the SOC and DOC in the CO increased by 63.4% and 87.0%, respectively, after 11 years of planting, while they increased by 18.1% and 4.2% in the ST, respectively.

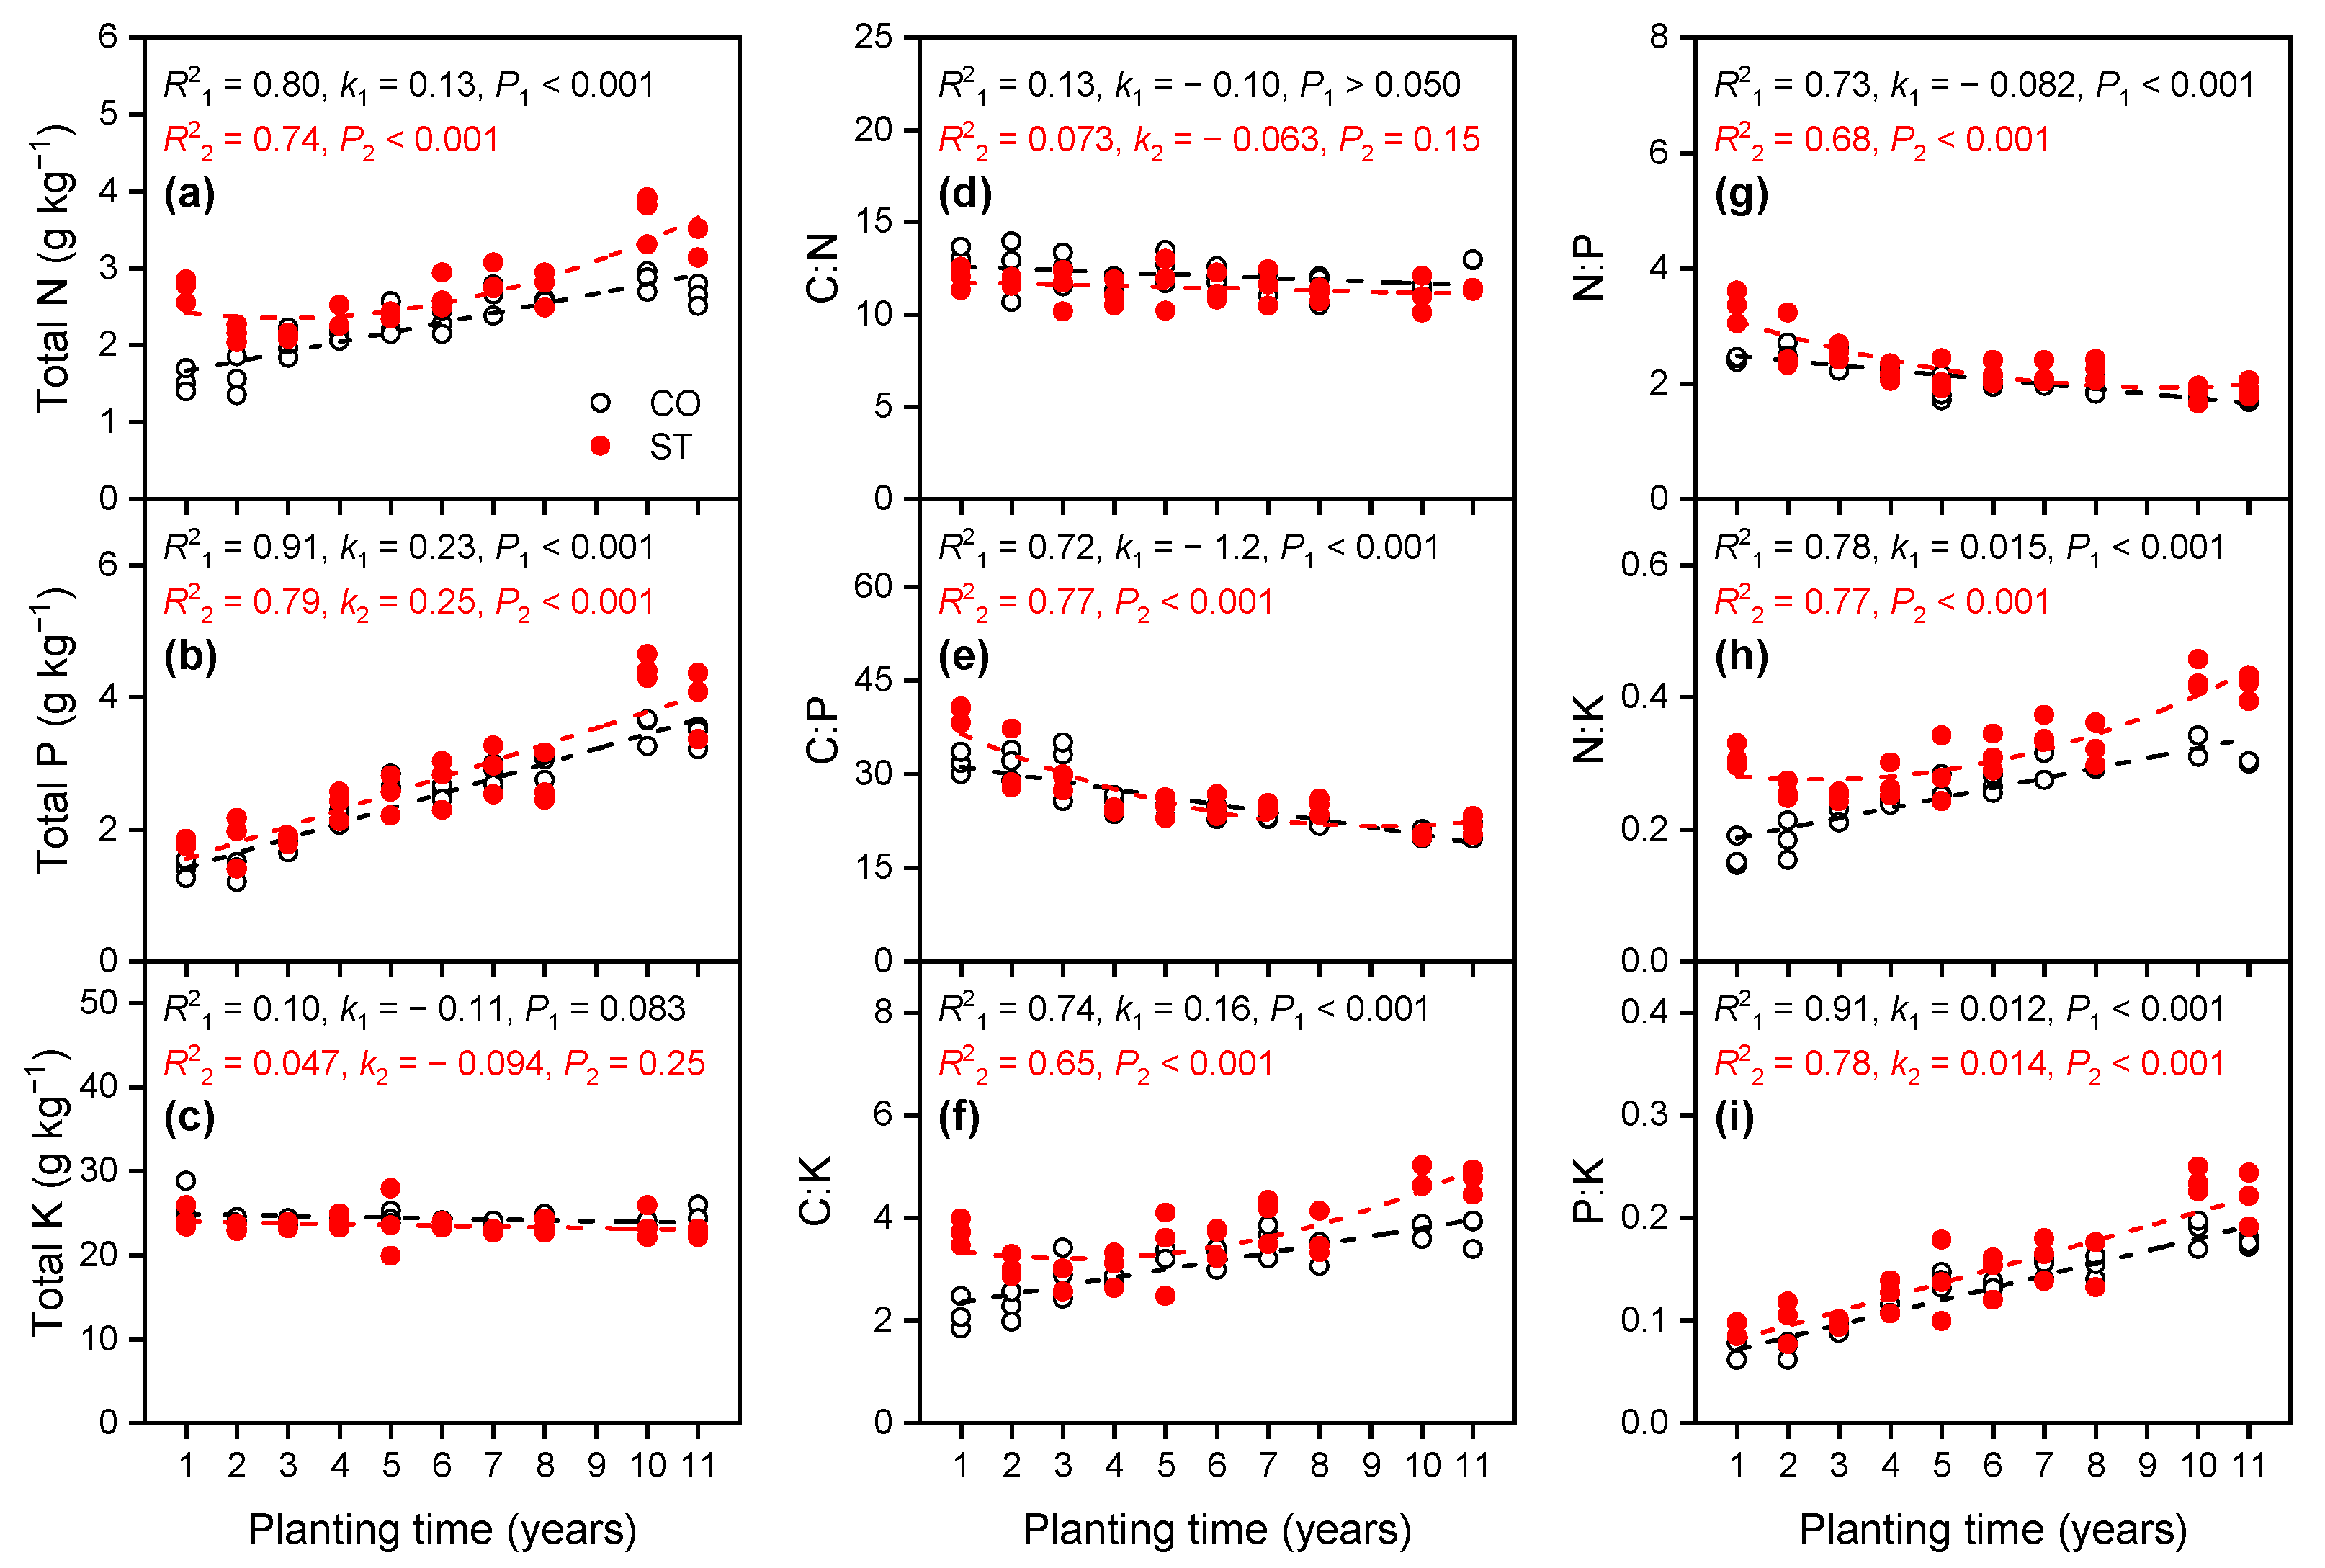
3.1.2. Variations in Total Nutrient Concentrations in the Soil

In the CO, as the planting time increased, the soil total N and total P increased linearly (k1 > 0, P1 < 0.05; Figure 4, Tables S3 and S4), while the soil total K did not change significantly. Additionally, the soil C:P and N:P showed a linear decrease (k1 < 0, P1 < 0.05), and the soil C:K, N:P, and P:K showed a linear increase (k1 > 0, P1 < 0.05). In the ST, the soil total N, total P, and total K, as well as all elemental stoichiometric ratios, exhibited similar trends as those recorded for the CO, wherein the soil total N, C:K, and N:K showed a nonlinear increase (P2 < 0.05), while the soil C:P and N:P showed a nonlinear decrease (P2 < 0.05). Compared to that of the first year, after 11 years of planting, the soil total N and total P increased by 72.7% and 144.3% in the CO, respectively, while they increased by 24.3% and 117.7% in the ST, respectively.

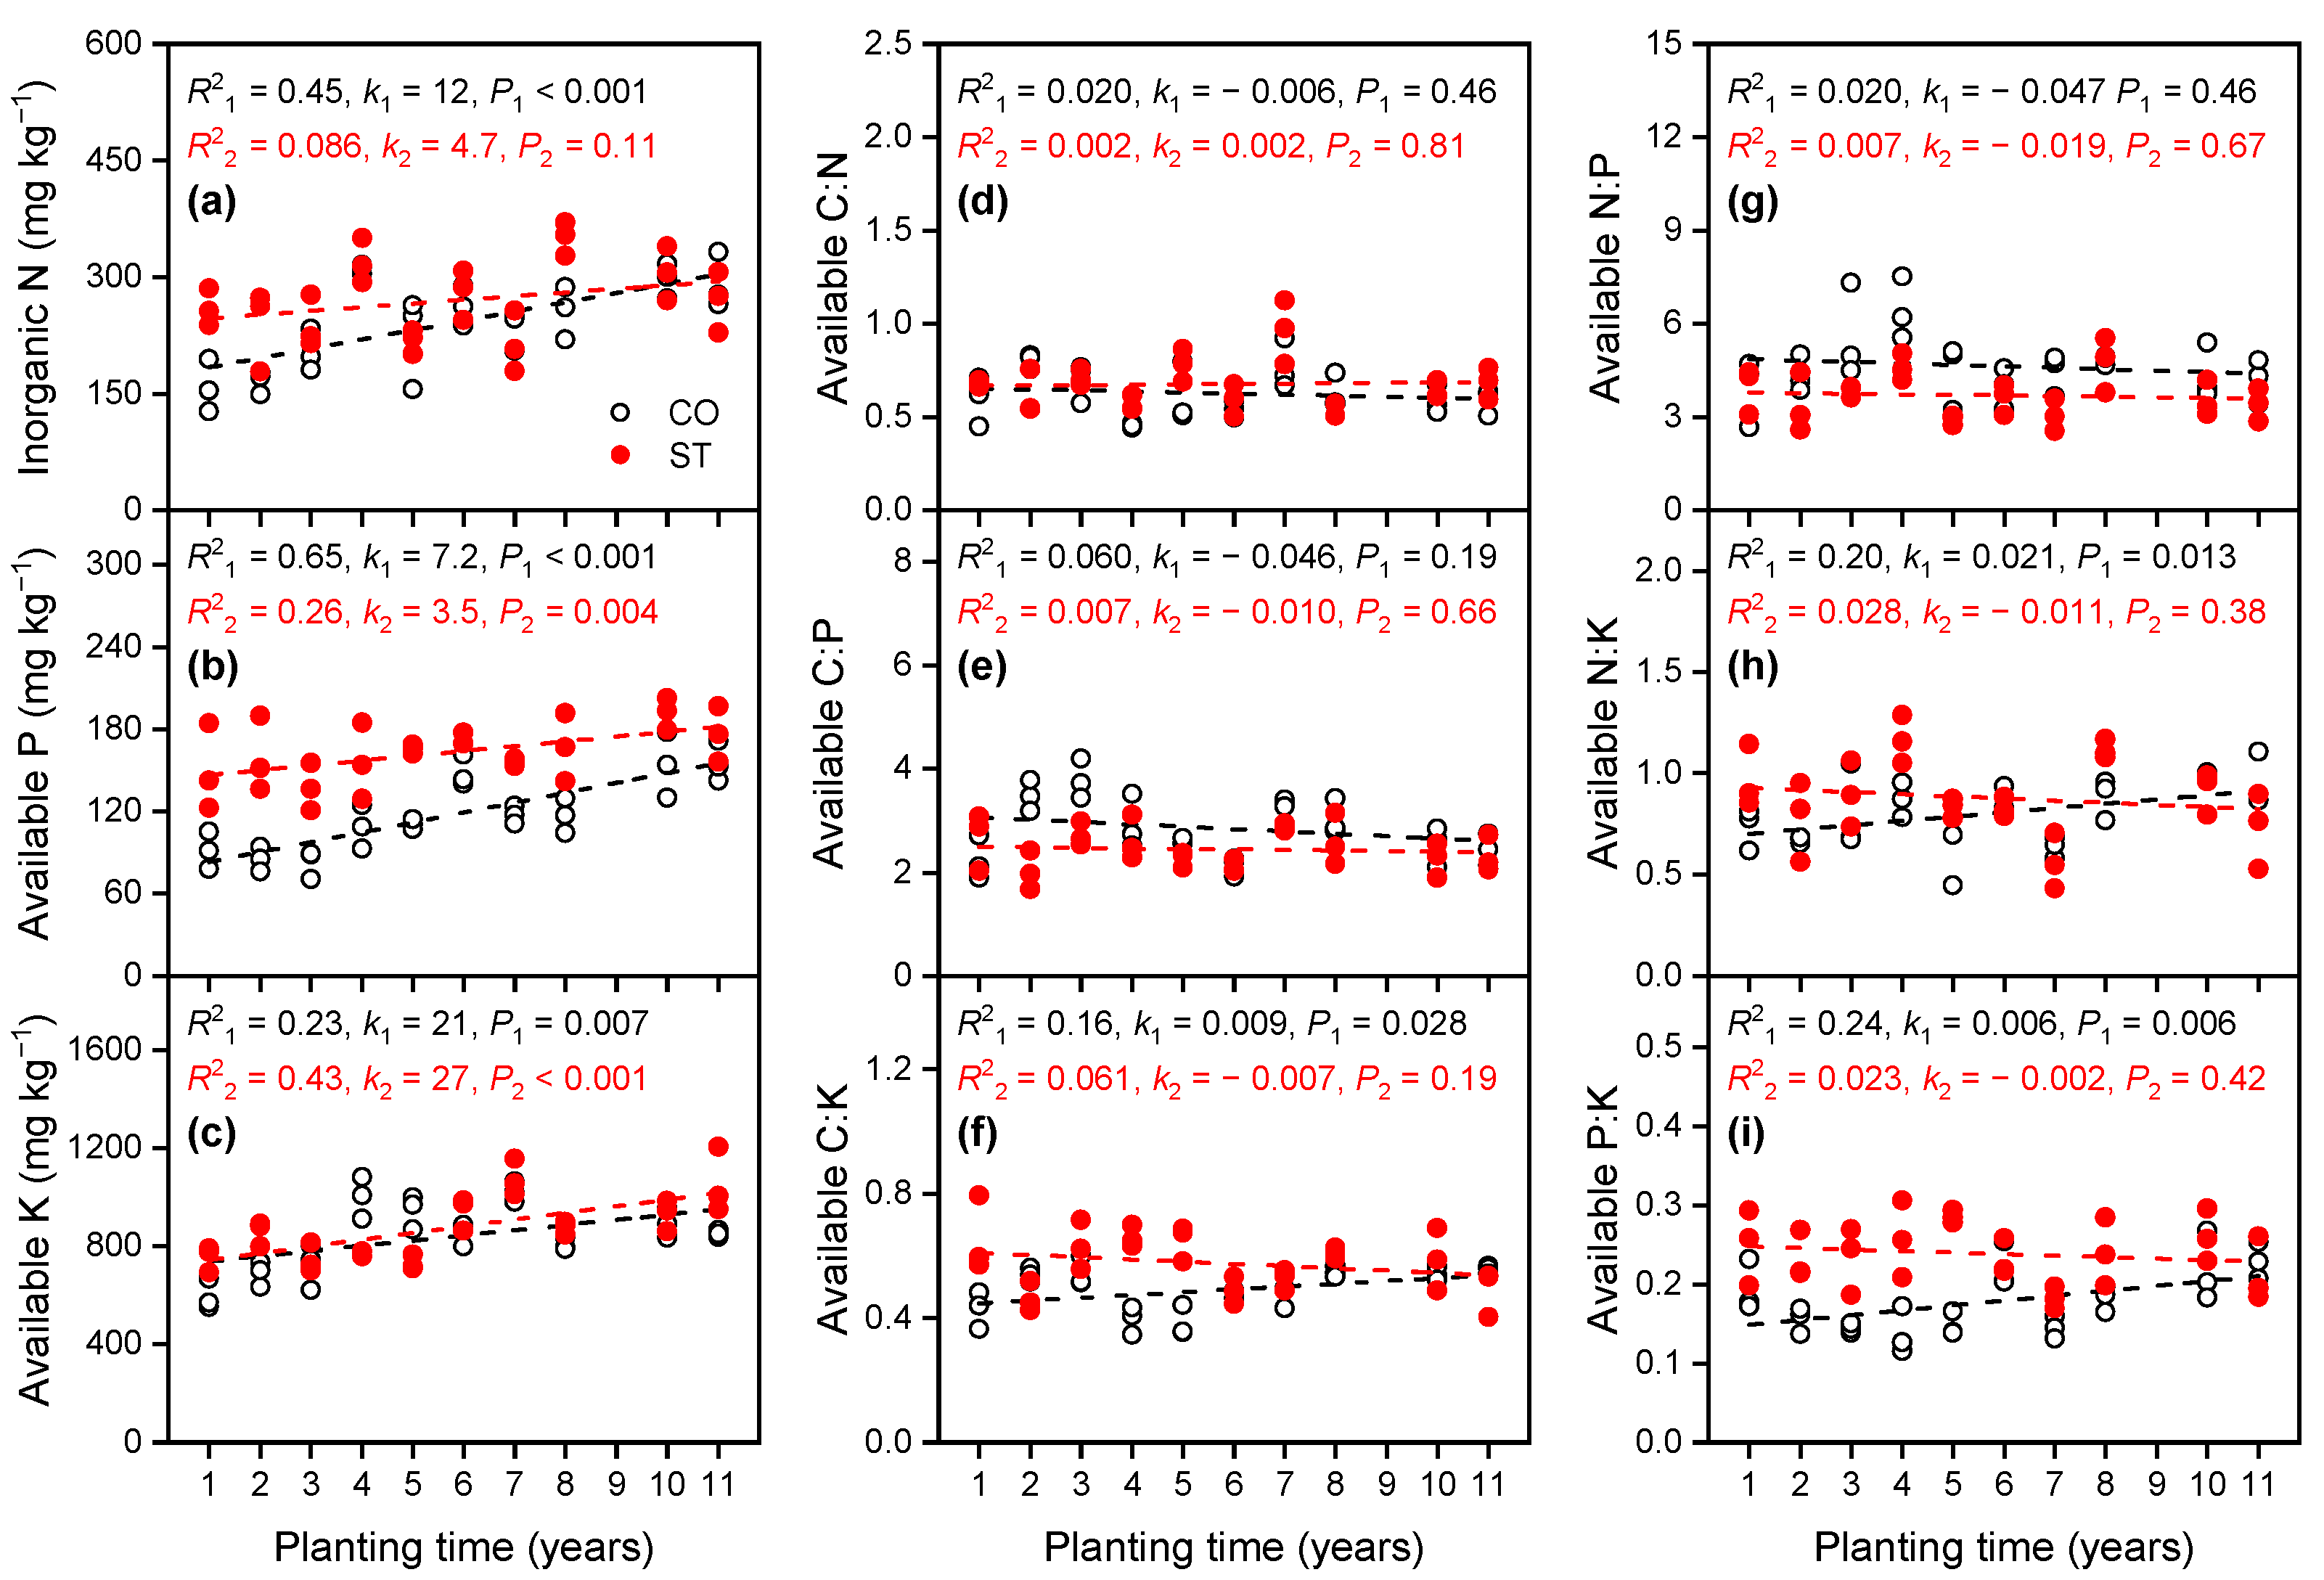
3.1.3. Variations in Available Nutrient Concentrations in the Soil

As the planting time increased in the CO, the soil inorganic N, available P, and available K increased linearly (k1 > 0, P1 < 0.05; Figure 5 and Table S5), and only the soil available C:K, N:K, and P:K showed a linear increase (k1 > 0, P1 < 0.05). Moreover, only the soil available P and available K increased linearly in ST (k2 > 0, P2 < 0.05), whereas the soil available element stoichiometry ratio did not significantly change. Compared to the first year, after 11 years of planting, the soil inorganic N, available P, and available K increased by 84.0%, 69.8%, and 42.5%, respectively, in the CO, while they increased by 3.9%, 17.8%, and 39.5% in the ST, respectively.

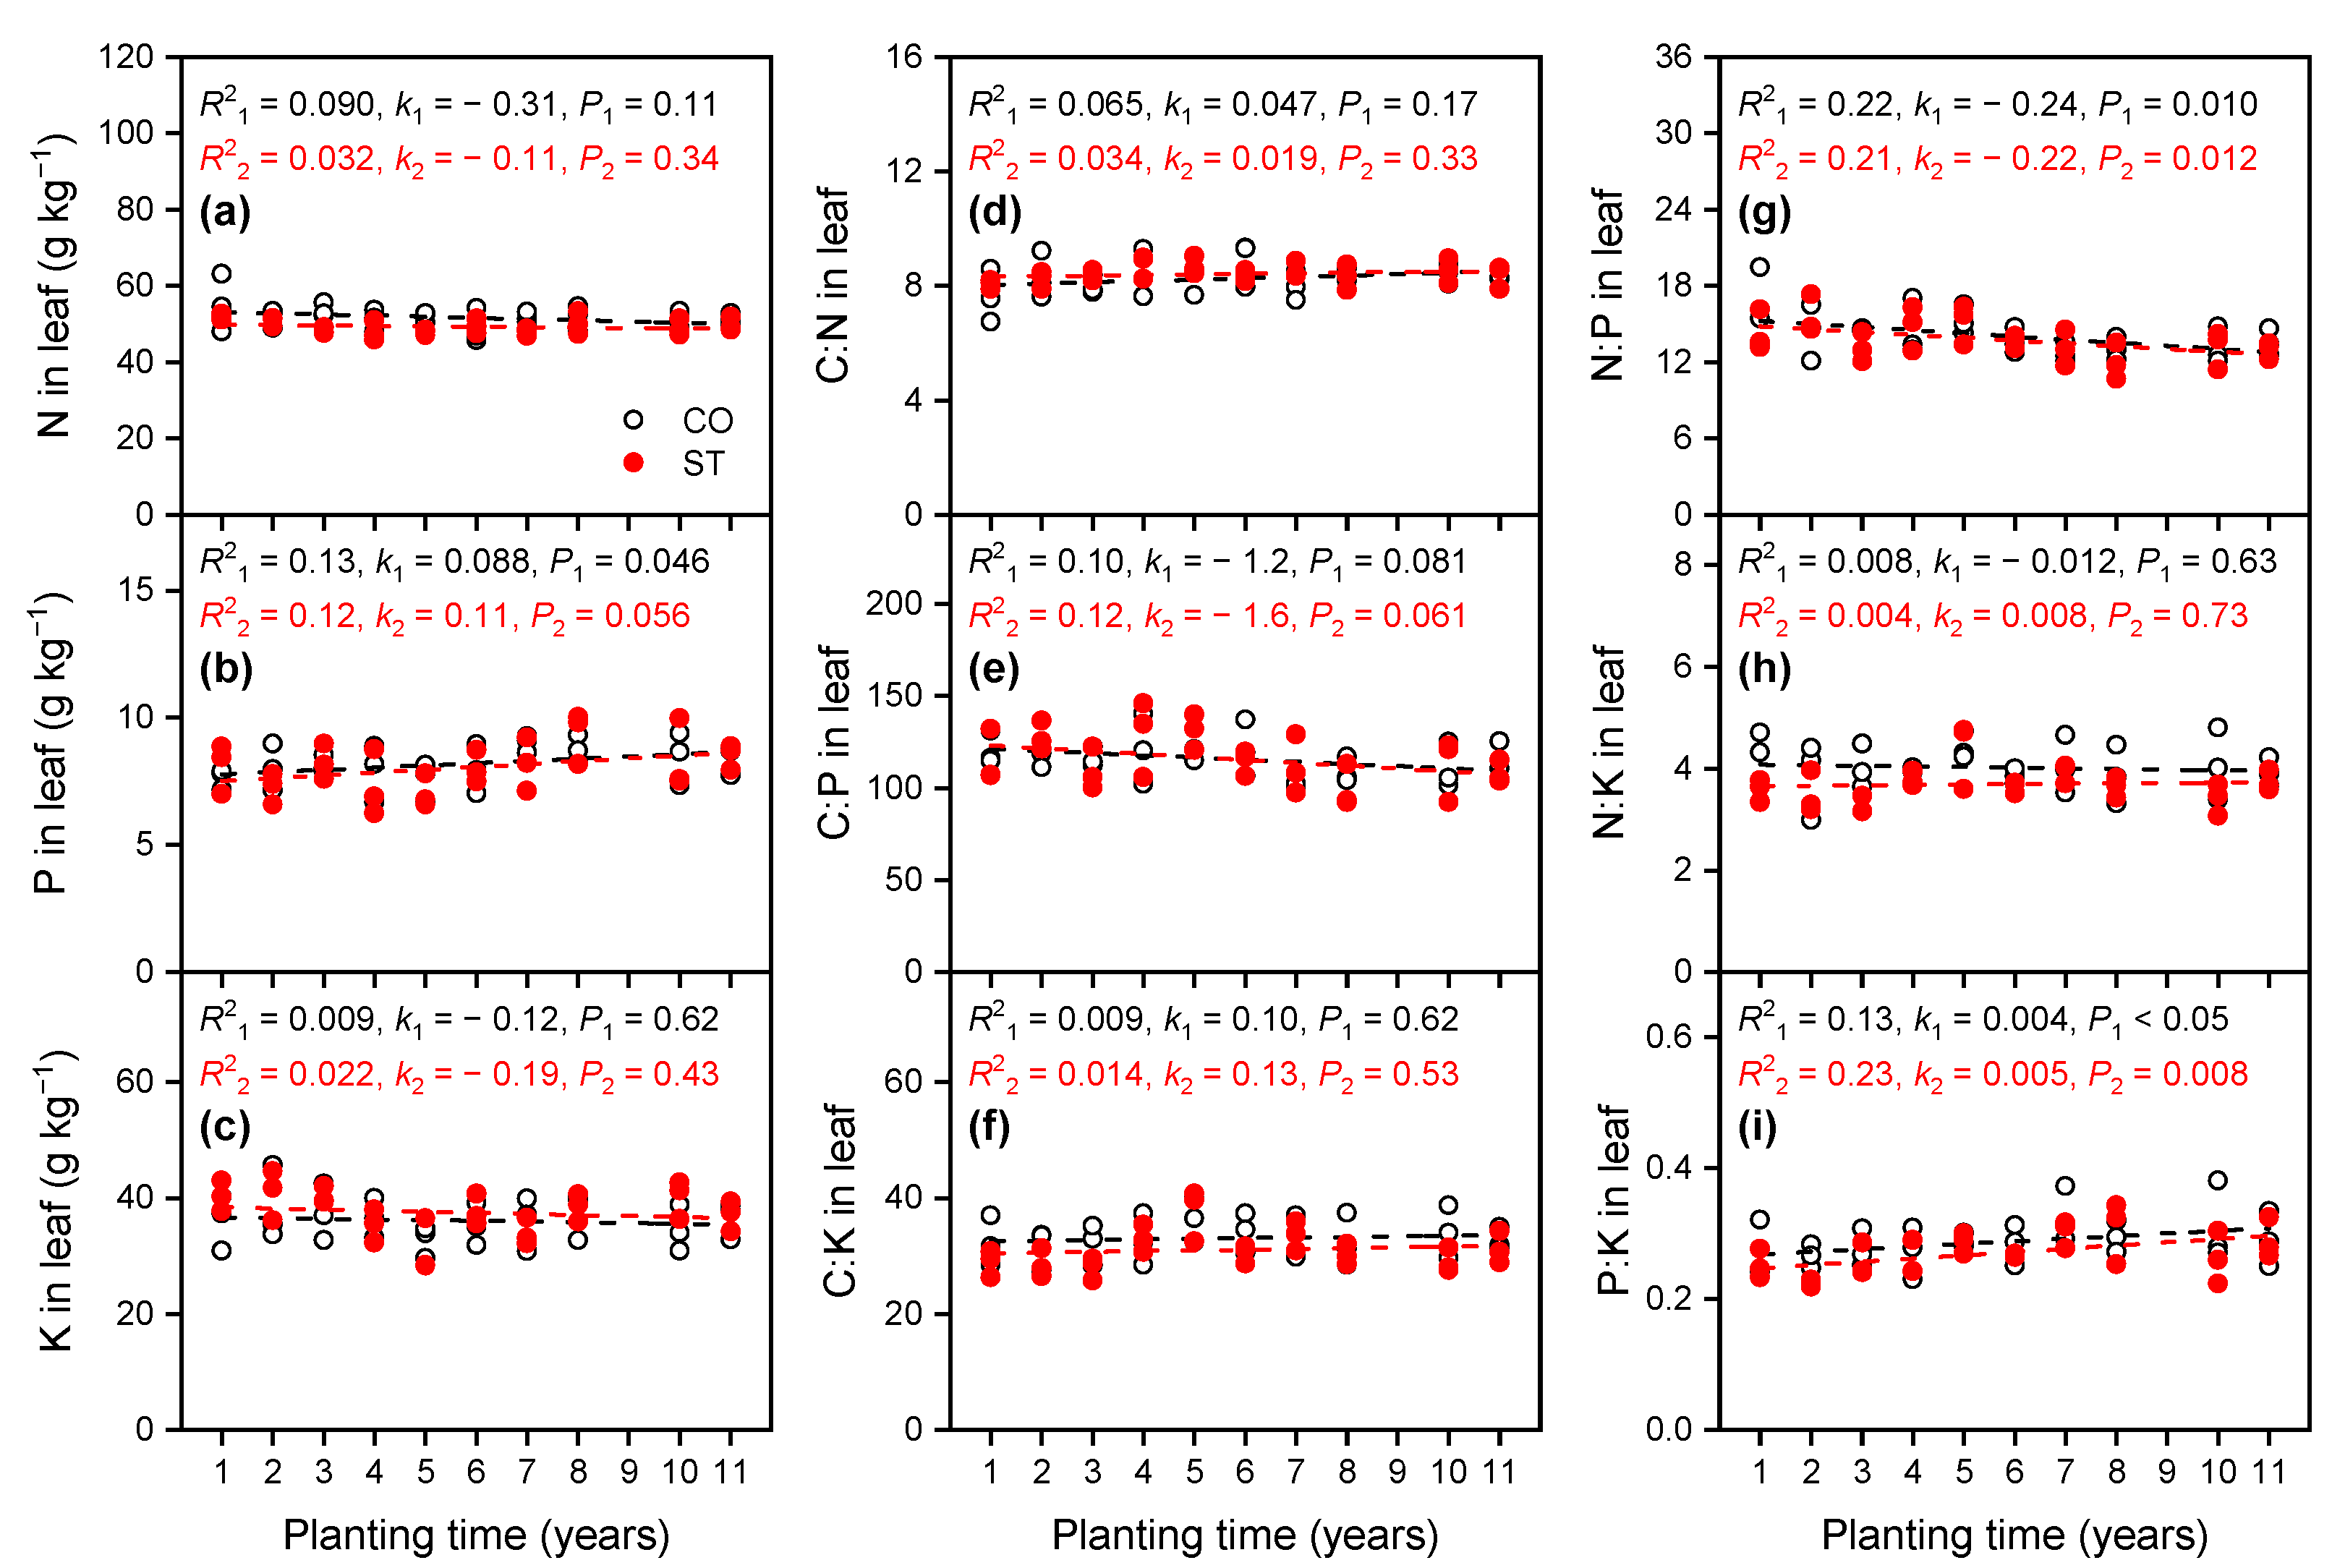
3.1.4. Variations in Nutrient Concentrations in Leaf

As the planting time increased, the leaf P concentration in CO showed a linear increase (k1 > 0, P1 < 0.05; Figure 6, Tables S6 and S7), the N and K concentrations in the leaves did not change significantly, while the N:P decreased linearly (k1 < 0, P1 < 0.05), and the P:K increased linearly (k1 > 0, P1 < 0.05). No significant changes were detected in the ratios of other elements. In the ST, the trends of N, P, and K concentrations and elemental stoichiometric ratios in the leaves were similar to those observed in CO; however, the P concentration in the leaves did not change significantly. Compared to that of the first year, the P concentration in the leaves increased by 9.8% and 5.3% in the CO and ST, respectively, after 11 years of planting.

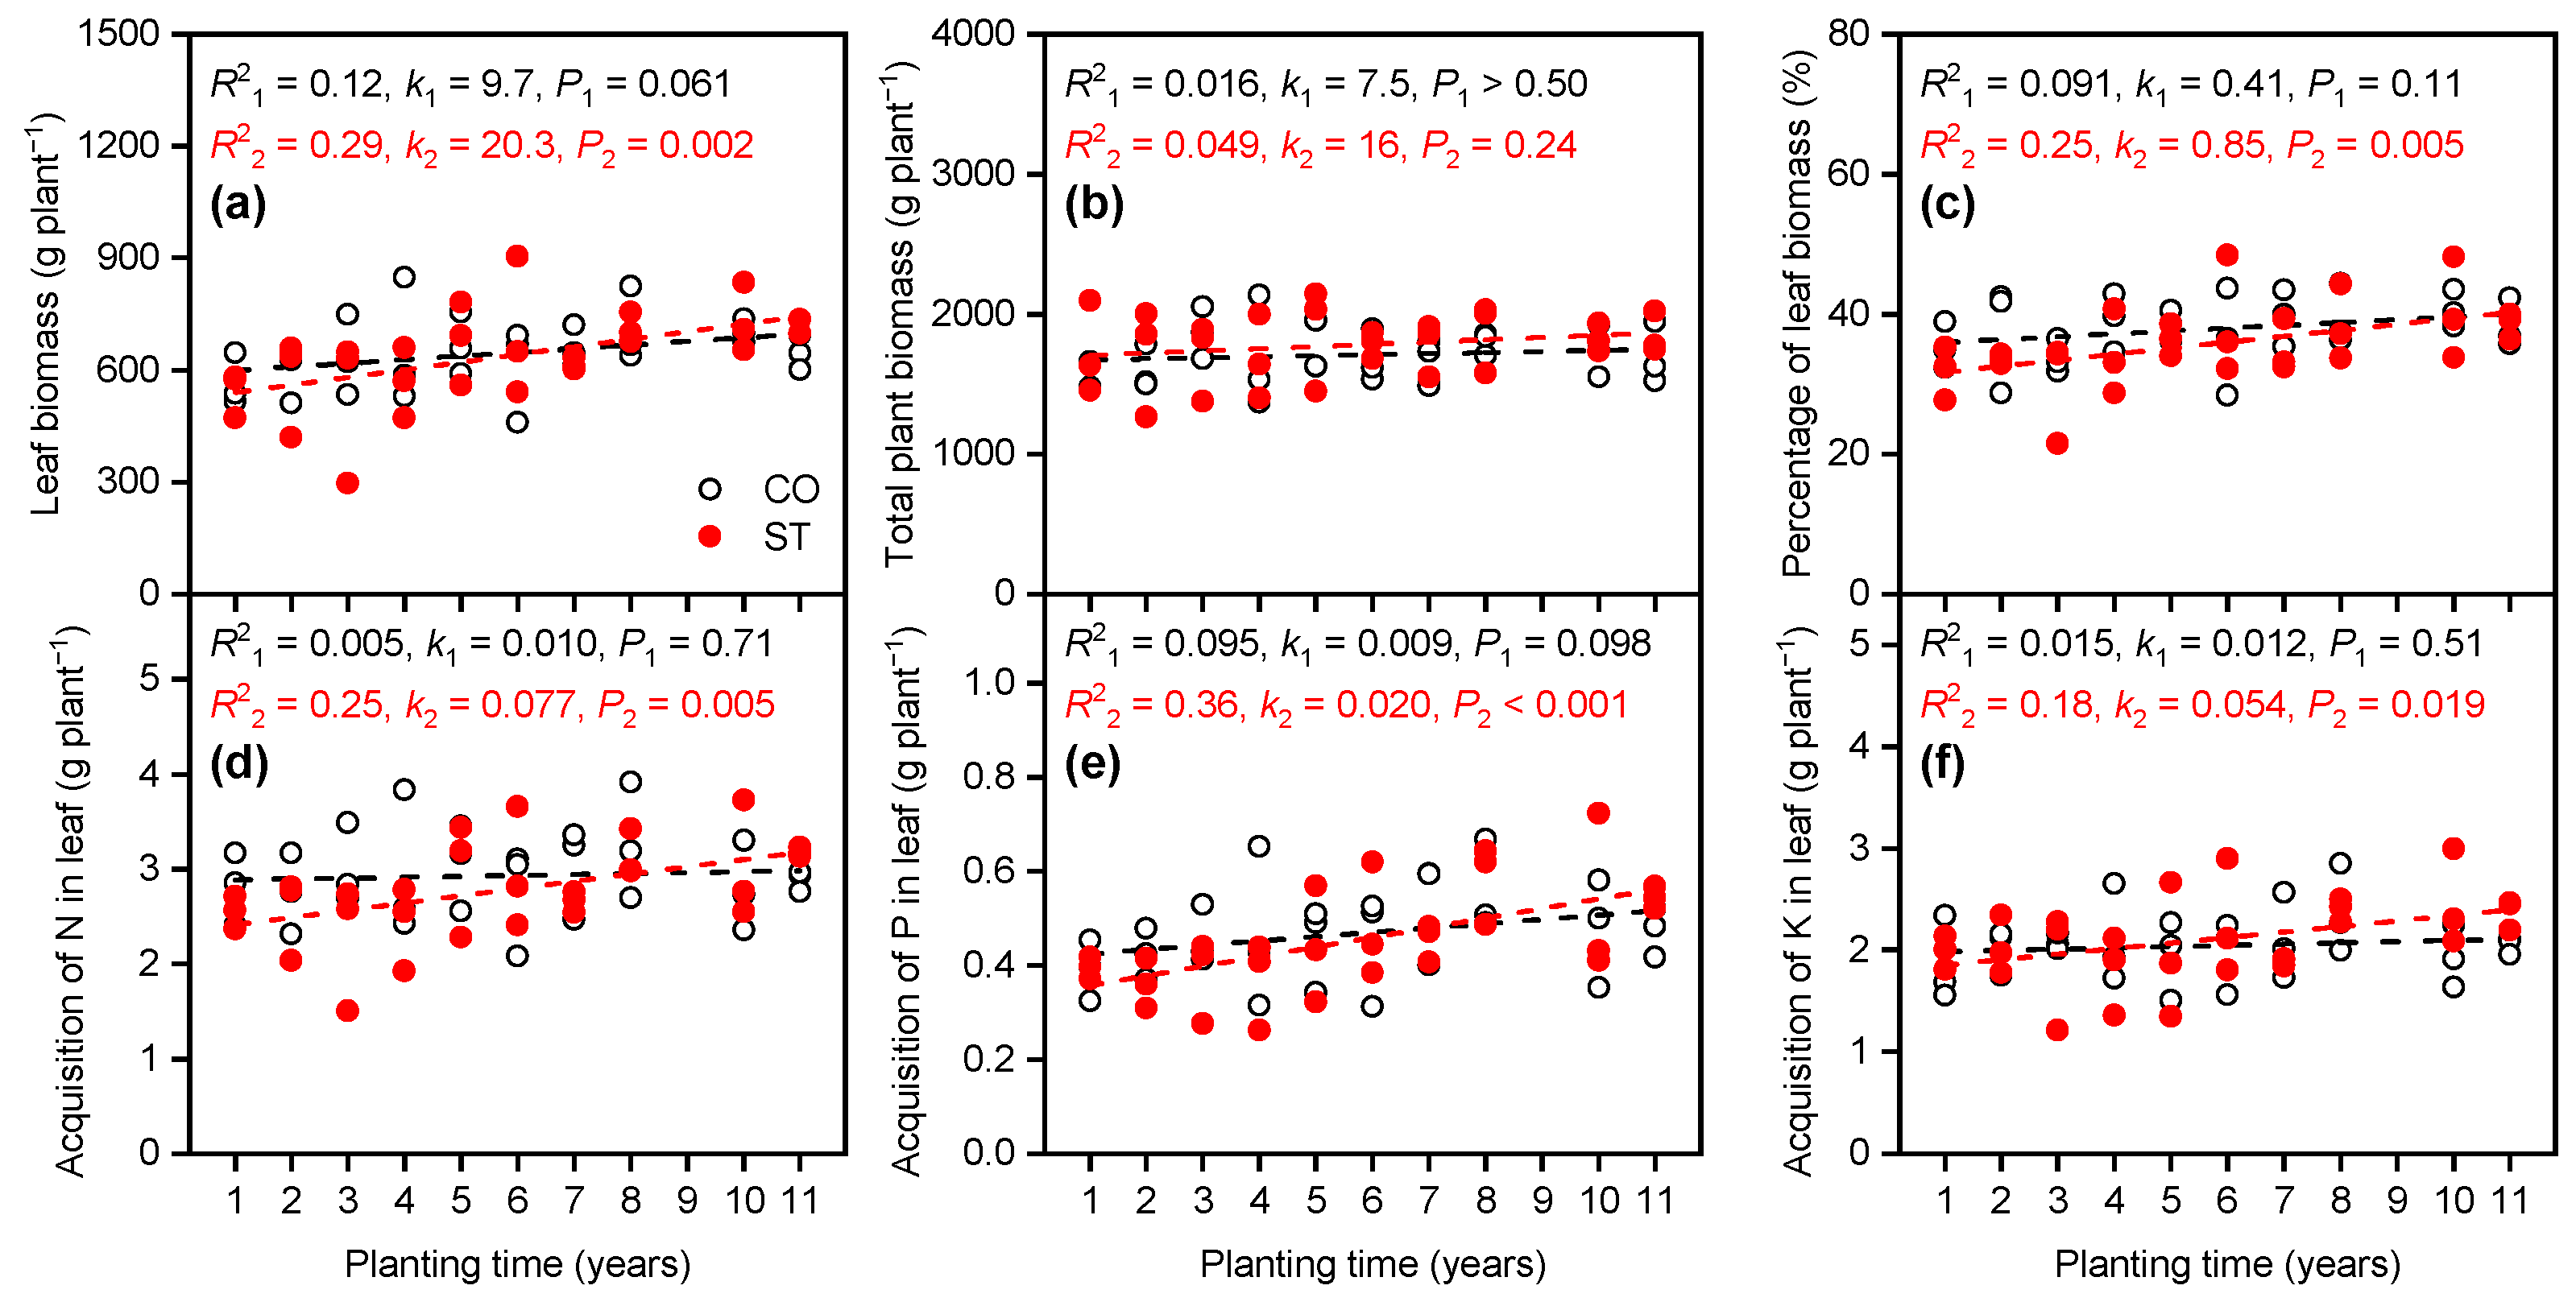
3.2. Response of Elemental Absorption in Leaf to Planting Time

In the CO, as the planting time increased, no significant trend was observed in the leaf biomass, total plant biomass, percentage of leaf biomass, and acquisition of N, P, and K in the leaves, whereas in the ST, these parameters all exhibited a linear increase (except total plant biomass; k2 > 0, P2 < 0.05; Figure 7 and Table S6). We also observed a linear decrease in the harvest index in CO and ST (k1 and k2 < 0, P1 and P2 < 0.05; Figure 8 and Table S8).

3.3. The Relationships between Elements in the Leaf, Leaf Growth, and Soil Parameters

In the CO, the P concentration and acquisition of P in the leaves (APL) were positively correlated with total P (Table 2). And P:K in the leaf was positively correlated with P:K, while N:K in the leaf was negatively correlated with available N:K (Table S9). However, in the ST, the leaf P concentration was negatively correlated with pH, and APL was positively correlated with total P (Table 2). And N:P in the leaf was positively correlated with N:P, and P:K in the leaf was positively correlated with and P:K (Table S9).
In the CO, the leaf biomass per plant (LB) was positively correlated with total N, total P, C:K, N:K, P:K, NO3−N, inorganic N, P:K, acquisition of N in leaves (ANL), APL, and acquisition of K in leaves (AKL), while being negatively correlated with C:P and N:P (Table 3). The percentage of leaf biomass in total plant biomass (PLB) was positively correlated with EC, total N, N:K, NH4+−N, and P in leaves, ANL, APL, and AKL, however, was negatively correlated with C:N and C:P in leaves. In the ST, the LB was positively correlated with total N, total P, C:K, N:K, P:K, available P, ANL, APL, and AKL, however, was negatively correlated with C:P and N:P. The PLB was positively correlated with the total N, total P, C:K, N:K, P:K, and P in leaves, P:K in leaves, ANL, APL, and AKL, but negatively correlated with C:P, N:P, C:P in leaves and N:P in leaves (Table 3).

4. Discussion

4.1. Variation in the Stoichiometric Ratios of C, N, P, and K in the Soil and Cucumber Leaf with Increasing Planting Time

Due to the continuous annual application of large amounts of organic manure and chemical fertilizers, with increasing planting time, the concentration of total N and total P elements increased in both the CO and ST, which was reflected in the increased supply capacity of N and P, while no significant changes were observed in the soil K (Figure 4). In solar greenhouses, farmers often supply more nutrients than the plants need to obtain higher yields; the excess nutrients are then fixed and stored in the soil and accumulate (e.g., N, P, and K) [9], which is partially consistent with the results of the nutrient enrichment in this study (e.g., enrichment of soil total N and total P). Although the absolute concentration of total soil K was high (approximately 24 g kg−1), accumulation did not occur with increasing planting time, which was attributed to plant K utilization and fertilization differences between crops [27,28]. For example, the cucumber in this study was fertilized with 1519 kg ha−1 year−1 N; 556 kg ha–1 year–1 P2O5; and 1547 kg ha–1 year–1 K2O (Table S1); whereas the leafy vegetables and tomatoes in the study by Li, et al. [9] were fertilized with 842 kg ha–1 year–1 N, 809 kg ha–1 year–1 P2O5, and 932 kg ha–1 year–1 K2O.
Soil organic C concentrations can be used to characterize soil fertility and health. The accumulation of SOC in soils with increasing planting time showed no deterioration tend in the soil quality (Figure 3), which was consistent with the finding that organic matter input causes a linear increase in soil SOC with cropping time [11]. The main sources of SOC in agricultural cultivation systems include exogenous fertilizers, plant residues, and root secretions [12,13,29]. Meanwhile, chicken manure has a high organic matter concentration, however, is not fully mineralized and utilized during the current crop season [30,31], which is one of the sources of SOC. Non-economic nutrient tissues are removed after crop harvesting; however, a small amount of senescent flowers and roots remain in the soil, which also contribute to SOC accumulation. In addition, root secretions contribute to SOC accumulation. The input of these SOC sources exceed the output, causing accumulation of SOC with increasing planting time.
As the planting time increased, the increase in SOC, total N, and total P concentrations (relative to the soil total K concentration) resulted in an increase in the ratio of elements: K (C:K, N:K, and P:K) (Figure 4). The decrease in soil C:P and N:P ratios showed that the accumulation of total P in the soil was greater than that of SOC and total N. This suggests that the accumulation of elements caused by continuous cropping was the primary factor causing the decrease in soil elemental ratios. The mean ratios of soil C:N (11.8), C:P (26.0), and N:P (2.2) in this study were lower than the global cropland values (C:N (12.5), C:P (63.9), and N:P (4.4)) [32], and the Chinese soil mean (C:N (14.4), C:P (136), and N:P (9.3)) [33], indicating that the accumulation of total soil N and total P resulted in a decrease in the ratio of these elements (Figure 4; Table S3). Similarly, a previous study reported that the excessive application of P in the northwest agriculture and animal husbandry zone resulted in lower SOC, total N, and total P elemental ratios [10]. Similar results were obtained in another study in a paddy region [34]. As the planting time increased, the soil available elements (e.g., DOC, inorganic N, available P, and available K) in both the CO and ST showed an increasing trend, indicating a positive effect elicited by planting time on the available elements in the soil (Figure 5 and Figure S1). However, the ratios of available C:N, available C:P, and available N:P did not change significantly (Figure 5). The increase in inorganic N and available P was greater than that of available K in the CO, which resulted in an increase in the ratio of available elements: K (available C:K, available N:K, and available P:K). This suggests a further increase in the imbalance of available elements with increasing planting time, which was not observed in the ST. Due to the specific utilization of greenhouse soils, a significant imbalance in both the total and available elements (N, P, K) accumulates in the soil [35,36], which has also been reflected in the present study.
As the planting time increased, the variation pattern of elements in the leaves differed from the soil elemental variation. Carbon is the basic building block material of plants and is relatively stable [37]; therefore, C in leaves is stable and did not change significantly with increasing planting time (Figure S2). Plants obtain their nutrients from the soil, however, they can maintain the relative stability of their elemental composition, which results in relatively stable plant element ratios [1]. Accordingly, we expected that the elemental ratios in leaves would be stable and not influenced by the available elements in the soil. However, the concentration of P in the leaves increased slightly with increasing planting time, relative to the stable N and K concentrations, which resulted in a reduced N:P ratio and an increased P:K ratio in the leaves (Figure 6). This is likely due to plants using more P for nutritional growth (Figure 7). The positive correlation between P in the leaves and PLB (the percentage of leaf biomass in total biomass) in the CO supports this supposition (Table 3). The growth rate hypothesis also states that plants with high growth rates tend to require more P for ribonucleic acid (RNA) synthesis to support rapid plant growth [38] and long-term nutrient enrichment (e.g., N) can promote the absorption of P by plants [39,40]. As the planting time increased, the ratios of nutrients in the leaves (N:P (16.1–12.7), N:K (3.85–4.43), and P:K (0.27–0.32) in the leaves) of plants within CO were higher than the corresponding total soil nutrient ratios (N:P (2.54–1.71), N:K (0.16–0.33), and P:K (0.07–0.19)) and ratios of soil available nutrients (available N:P (3.92–6.43), available N:K (0.64–0.96), and available P:K (0.14–0.23)), which was also observed for ST (Tables S4, S5, and S7). Hence, the N and P supply to the plants was lower than that of K at all time points; that is, the supply capacity of soil available elements was in the following order: K > P > N (note, if the element ratio of soil is lower than the corresponding ratio of elements in the leaves, the element abundance represented by the antecedent will be smaller than that of the consequent, e.g., N:P in soil < N:P in leaves, then the supply capacity of the elements is N < P). Our results showed that the elemental requirements of the leaves did not match the elemental abundance in the soil.
In summary, the continuous cropping resulted in different patterns of soil elements and nutrients in plant leaves, as well as changes in their stoichiometric ratios; that is, there was an accumulation of SOC, total N, and total P without significant changes detected in total K with increasing planting time. The availability of these elements increased to different degrees, with no significant changes in the C, N, and K concentrations in the leaves. Meanwhile, a slight increase in P concentration in the leaves resulted in a decrease in the N:P ratio and an increase in the P:K ratio in the leaves. Thus, these results partially support our first hypothesis. In a continuous fertilization solar greenhouse cultivation system, the discordant nutrient supply and demand between soil and cucumber plants may further exacerbate the imbalance between soil elements, which may negatively impact soil quality and the normal operation of the cucumber cultivation system. Therefore, proper fertilizer application, according to the nutrient requirements of cucumber, is an important aspect of cucumber cultivation and production that should not be neglected.

4.2. Decoupling of Element Utilization in Leaf with Increasing Planting Time

In the CO and ST, as the planting time increased, although no significant correlation was detected between P concentration in the leaves and soil available P, a similarly increased pattern was observed, while the N and K concentrations in the leaves were not affected by the increased concentrations of soil available elements. These results indicated that the absorption and utilization of P by the leaf were regulated by soil available P, while N and K in the leaves were not regulated by soil inorganic N or soil available K, with increasing planting time (Figure 5 and Figure 6; Table 2). Thus, the concentrations of N, P, and K in the leaves underwent different patterns of change (inter-elemental decoupling) with increasing planting time, which was supported by the lack of correlation between the elemental concentrations in the leaf and available elements in the soil (Table 2). The degree of coupling of nutrient concentrations (N, P, and K in leaves) and their ratios in the plant leaves are inextricably linked to both soil nutrient availability and plant requirements in leaves [41]. The availability of soil elements can directly affect nutrient utilization by plants, which in turn alters the stoichiometric ratio and degree of plant element coupling, such as the utilization of P by leaves. The nutrient requirements of plants can also influence the coupling status of their element utilization due to specific physiological and structural functions of plants that determine the characteristics of plant requirements for different nutrients [42]. For example, the nutrient utilization of leaves (N and K in leaves) in this study was independent of the increase in soil available elements; however, leaves increased the absorption and utilization of P. As plant leaf biomass and elemental acquisition increased with increasing planting time (Figure 7), the discrepancy between plant demand in leaves and soil nutrient availability may further exacerbate the soil nutrient imbalance, resulting in the decoupling of P from other elements.
The biomass of cucumber plants (TPB) did not change significantly during the decoupling of elements in the leaves, however, the percentage of cucumber leaves (PLB) and the harvest index of plants (HI) exhibited opposite trends in variation with increasing planting time (Figure 7 and Figure 8). This was likely caused by the utilization of P promoting accumulation of cucumber leaf biomass, which resulted in a decrease in HI. Since plants maintain the optimal ratio of their elemental concentrations, they can maintain a relative balance of elements by adjusting their morphological structure in response to environmental changes [42,43]. To some extent, this explains the variation in P decoupling from other elements in the cucumber leaf. Another possibility is that under conditions of nutrient sufficiency, the utilization of nutrients by the leaf can proceed in a luxury uptake and nutrient storage pattern [44,45], however, the precise mechanism is not known.
In summary, during the continuous cultivation of greenhouse cucumbers, affected by the imbalance of soil elements, the P in the leaves was decoupled from the other elements. This resulted in the growth adjustment of the leaf biomass. Thus, these results support our second hypothesis that the imbalance of soil nutrient elements induced by fertilizers resulted in the decoupling of elemental utilization (especially for P utilization) in the leaves. Greenhouse cucumber cultivation is aimed at obtaining economic yields, while nutrient uptake and overgrowth of cucumber leaves may result in wasted soil nutrients and negatively impact cucumber production. Therefore, in the long term, the decoupling of P in cucumber leaves may not be conducive to the acquisition of high greenhouse cucumber yields.

5. Conclusions

In this study, we investigated the variations of C, N, P, and K concentrations and their stoichiometric ratios in soil and cucumber leaves under a continuous cropping system in a solar greenhouse and clarified the coupling status between elements in cucumber leaves. The results showed that the successive cropping resulted in the accumulation of SOC, total N, and total P (especially total P) with increasing planting time; however, no changes in total K were observed. The soil available nutrient concentrations were elevated to some degree. Moreover, N and K concentrations in leaves remained unchanged with increasing planting time, while P concentration increased. These results suggest that the patterns of elemental changes in soil and cucumber leaves differ with increasing planting time. In addition, the increase in leaf P concentration also indicated that the state of P coupled with N and K in cucumber leaves changed with increasing planting time, which is closely related to an imbalance in soil nutrients and the nutrient demand of plant leaves. Although the decoupling of leaf P during continuous cropping of solar greenhouse cucumber can promote the acquisition of soil P by cucumber leaves to some extent, it increases the biomass allocation of non-economically productive tissues thus causing unnecessary loss of cucumber yield (reduced harvest index). Accordingly, we conclude that imbalanced soil nutrients under continuous cropping conditions causes the decoupling of P from N and K in leaf nutrient utilization. This study highlights the importance of P fertilizer management for nutrient utilization in cucumber in continuous cultivation and provides a theoretical basis for the management of soil balance fertilization and sustainability of vegetable production in solar greenhouse vegetable systems. In the next study, it may be interesting to investigate how to reduce or even avoid yield losses caused by P decoupling in leaves and whether the nutrient acquisition ratio of plants can be altered by appropriately adjusting the supply of P fertilizer.

Supplementary Materials

The following are available online at https://www.mdpi.com/article/10.3390/horticulturae7120528/s1, Methods S1: Additional information on the experiment, Methods S2: Sampling point location diagram, Table S1: Annual fertilizers and manure applied to the greenhouse cucumber cropping systems, Table S2: The Student’s t-test of pH, EC, SOC, and DOC between the control soil (CO) and straw mixture soil (ST), Table S3: The Student’s t-test of soil total N, total P, total K, NO3−N, NH4+–N, inorganic N, available P, and available K concentrations between the control soil (CO) and straw mixture soil (ST), Table S4: The Student’s t-test of the molar ratio of C:N, C:P, N:P, C:K, N:K, and P:K in the soil between the control soil (CO) and straw mixture soil (ST), Table S5: The Student’s t-test of the molar ratio of available C:N, available C:P, available N:P, available C:K, available N:K, and available P:K in the soil between the control soil (CO) and straw mixture soil (ST), Table S6: The Student’s t-test of the concentrations of C, N, P, and K in leaf and ANL, APL, and AKL between the control soil (CO) and straw mixture soil (ST), Table S7: The Student’s t-test of the molar ratio of C:N, C:P, N:P, C:K, N:K, and P:K in leaf between the control soil (CO) and straw mixture soil (ST), Table S8: The Student’s t-test of TY, TPB, HI, LB, and PLB between the control soil (CO) and straw mixture soil (ST), Table S9: Spearman’s correlation of C:N, C:P, N:P, C:K, N:K, and P:K between leaf and soil in the control soil (CO) and straw mixture soil (ST), Figure S1: Variations in NH4+−N (a) and NO3−N (b) with increasing planting time in the control soil (CO) and straw mixture soil (ST), Figure S2: Variations in C concentrations in leaf with increasing planting time in the control soil (CO) and straw mixture soil (ST).

Author Contributions

Conceptualization, S.Z., Y.Z., H.F. and Z.S.; formal analysis, S.Z.; funding acquisition, H.F.; investigation, S.Z., T.B., S.W., X.Z. and X.L.; project administration, Z.S.; visualization, S.Z. and Y.Z.; writing—original draft, S.Z.; writing—review and editing, S.Z., Y.Z., H.F. and Z.S. All authors have read and agreed to the published version of the manuscript.

Funding

This study was financially supported by the National Key R&D Program of China (no. 2019YFD1001900) and the National Natural Science Foundation of China (no. 31902093).

Institutional Review Board Statement

Not applicable.

Informed Consent Statement

Not applicable.

Data Availability Statement

It can be obtained upon reasonable request from the corresponding author.

Acknowledgments

The authors would like to thank De-Hui Zeng and Murad Ali for their contributions in revising the manuscript.

Conflicts of Interest

The authors declare no competing interests.

References

  1. Sterner, R.W.; Elser, J.J. Ecological Stoichiometry: The Biology of Elements From Molecules to The Biosphere; Princeton University Press: Princeton, NJ, USA, 2002. [Google Scholar]
  2. Hättenschwiler, S.; Jørgensen, H.B. Carbon quality rather than stoichiometry controls litter decomposition in a tropical rain forest. J. Ecol. 2010, 98, 754–763. [Google Scholar] [CrossRef]
  3. Qiu, X.; Wang, H.; Peng, D.; Liu, X.; Yang, F.; Li, Z.; Cheng, S. Thinning drives C:N:P stoichiometry and nutrient resorption in Larix principis-rupprechtii plantations in North China. For. Ecol. Manag. 2020, 462, 117984. [Google Scholar] [CrossRef]
  4. Ren, C.; Zhao, F.; Kang, D.; Yang, G.; Han, X.; Tong, X.; Feng, Y.; Ren, G. Linkages of C:N:P stoichiometry and bacterial community in soil following afforestation of former farmland. For. Ecol. Manag. 2016, 376, 59–66. [Google Scholar] [CrossRef]
  5. Olde Venterink, H. Does phosphorus limitation promote species-rich plant communities? Plant Soil 2011, 345, 1–9. [Google Scholar] [CrossRef] [Green Version]
  6. Zhan, S.; Wang, Y.; Zhu, Z.; Li, W.; Bai, Y. Nitrogen enrichment alters plant N:P stoichiometry and intensifies phosphorus limitation in a steppe ecosystem. Environ. Exp. Bot. 2017, 134, 21–32. [Google Scholar] [CrossRef]
  7. Lu, Z.; Ren, T.; Pan, Y.; Li, X.; Cong, R.; Lu, J. Differences on photosynthetic limitations between leaf margins and leaf centers under potassium deficiency for Brassica napus L. Sci. Rep. 2016, 6, 21725. [Google Scholar] [CrossRef] [Green Version]
  8. Singh, V.K.; Dwivedi, B.S.; Yadvinder, S.; Singh, S.K.; Mishra, R.P.; Shukla, A.K.; Rathore, S.S.; Shekhawat, K.; Majumdar, K.; Jat, M.L. Effect of tillage and crop establishment, residue management and K fertilization on yield, K use efficiency and apparent K balance under rice-maize system in north-western India. Field Crops Res. 2018, 224, 1–12. [Google Scholar] [CrossRef]
  9. Li, J.; Wan, X.; Liu, X.; Chen, Y.; Slaughter, L.C.; Weindorf, D.C.; Dong, Y. Changes in soil physical and chemical characteristics in intensively cultivated greenhouse vegetable fields in North China. Soil Tillage Res. 2019, 195, 104366. [Google Scholar] [CrossRef]
  10. Liu, X.; Ma, J.; Ma, Z.-W.; Li, L.-H. Soil nutrient contents and stoichiometry as affected by land-use in an agro-pastoral region of northwest China. Catena 2017, 150, 146–153. [Google Scholar] [CrossRef]
  11. Li, Z.; Liu, M.; Wu, X.; Han, F.; Zhang, T. Effects of long-term chemical fertilization and organic amendments on dynamics of soil organic C and total N in paddy soil derived from barren land in subtropical China. Soil Tillage Res. 2010, 106, 268–274. [Google Scholar] [CrossRef]
  12. Phillips, R.P.; Finzi, A.C.; Bernhardt, E.S. Enhanced root exudation induces microbial feedbacks to N cycling in a pine forest under long-term CO2 fumigation. Ecol. Lett. 2011, 14, 187–194. [Google Scholar] [CrossRef]
  13. Malhi, S.S.; Nyborg, M.; Goddard, T.; Puurveen, D. Long-term tillage, straw management and N fertilization effects on quantity and quality of organic C and N in a Black Chernozem soil. Nutr. Cycl. Agroecosyst. 2011, 90, 227–241. [Google Scholar] [CrossRef]
  14. Zafar, M.; Abbasi, M.K.; Khaliq, A. Effect of different phosphorus sources on the growth, yield, energy content and phosphorus utilization efficiency in maize at Rawalakot Azad Jammu and Kashmir, Pakistan. J. Plant Nutr. 2013, 36, 1915–1934. [Google Scholar] [CrossRef]
  15. Das, D.; Dwivedi, B.S.; Datta, S.P.; Datta, S.C.; Meena, M.C.; Agarwal, B.K.; Shahi, D.K.; Singh, M.; Chakraborty, D.; Jaggi, S. Potassium supplying capacity of a red soil from eastern India after forty-two years of continuous cropping and fertilization. Geoderma 2019, 341, 76–92. [Google Scholar] [CrossRef]
  16. Galloway, J.N.; Leach, A.M.; Bleeker, A.; Erisman, J.W. A chronology of human understanding of the nitrogen cycle. Philos. Trans. R. Soc. B 2013, 368, 20130120. [Google Scholar] [CrossRef] [Green Version]
  17. Shenker, M.; Bloom, P.R. Comments on “Amounts, Forms, and Solubility of Phosphorus in Soils Receiving Manure”. Soil Sci. Soc. Am. J. 2005, 69, 1353–1354. [Google Scholar] [CrossRef]
  18. Fan, H.; Wu, J.; Liu, W.; Yuan, Y.; Hu, L.; Cai, Q. Linkages of plant and soil C:N:P stoichiometry and their relationships to forest growth in subtropical plantations. Plant Soil 2015, 392, 127–138. [Google Scholar] [CrossRef]
  19. Han, W.; Fang, J.; Guo, D.; Zhang, Y. Leaf nitrogen and phosphorus stoichiometry across 753 terrestrial plant species in China. New Phytol. 2005, 168, 377–385. [Google Scholar] [CrossRef] [PubMed]
  20. Peng, Y.; Li, F.; Zhou, G.; Fang, K.; Zhang, D.; Li, C.; Yang, G.; Wang, G.; Wang, J.; Yang, Y. Linkages of plant stoichiometry to ecosystem production and carbon fluxes with increasing nitrogen inputs in an alpine steppe. Glob. Change Biol. 2017, 23, 5249–5259. [Google Scholar] [CrossRef]
  21. Chen, P.; Wang, Y.-z.; Liu, Q.-z.; Zhang, Y.-t.; Li, X.-y.; Li, H.-q.; Li, W.-h. Phase changes of continuous cropping obstacles in strawberry (Fragaria × ananassa Duch.) production. Appl. Soil Ecol. 2020, 155, 103626. [Google Scholar] [CrossRef]
  22. Huang, S.W.; Tang, J.W.; Li, C.H.; Zhang, H.Z.; Yuan, S. Reducing potential of chemical fertilizers and scientific fertilization countermeasure in vegetable production in China. J. Plant Nutr. Fertil. 2017, 23, 1480–1493. (In Chinese) [Google Scholar]
  23. Guo, J.H.; Liu, X.J.; Zhang, Y.; Shen, J.L.; Han, W.X.; Zhang, W.F.; Christie, P.; Goulding, K.W.T.; Vitousek, P.M.; Zhang, F.S. Significant Acidification in Major Chinese Croplands. Science 2010, 327, 1008–1010. [Google Scholar] [CrossRef] [PubMed] [Green Version]
  24. IUSS Working Group WRB. World Reference Base for Soil Resources 2006; FAO: Rome, Italy, 2006. [Google Scholar]
  25. Bao, S.D. Soil and Agricultural Chemistry Analysis, 3rd ed.; China Agriculture Press: Beijing, China, 2000. (In Chinese) [Google Scholar]
  26. Deng, L.; Peng, C.; Huang, C.; Wang, K.; Liu, Q.; Liu, Y.; Hai, X.; Shangguan, Z. Drivers of soil microbial metabolic limitation changes along a vegetation restoration gradient on the Loess Plateau, China. Geoderma 2019, 353, 188–200. [Google Scholar] [CrossRef]
  27. Al-Qurashi, A.D.; Awad, M.A.; Ismail, S.M. Growth, yield, fruit quality and nutrient uptake of tissue culture-regenerated ‘Barhee’ date palms grown in a newly established orchard as affected by NPK fertigation. Sci. Hortic. 2015, 184, 114–122. [Google Scholar] [CrossRef]
  28. Xue, X.; Lu, J.; Ren, T.; Li, L.; Yousaf, M.; Cong, R.; Li, X. Positional difference in potassium concentration as diagnostic index relating to plant K status and yield level in rice (Oryza sativa L.). Soil Sci. Plant Nutr. 2016, 62, 31–38. [Google Scholar] [CrossRef] [Green Version]
  29. Zechmeister-Boltenstern, S.; Keiblinger, K.M.; Mooshammer, M.; Peñuelas, J.; Richter, A.; Sardans, J.; Wanek, W. The application of ecological stoichiometry to plant–microbial–soil organic matter transformations. Ecol. Monogr. 2015, 85, 133–155. [Google Scholar] [CrossRef] [Green Version]
  30. Hernández, T.; Chocano, C.; Moreno, J.-L.; García, C. Use of compost as an alternative to conventional inorganic fertilizers in intensive lettuce (Lactuca sativa L.) crops—Effects on soil and plant. Soil Tillage Res. 2016, 160, 14–22. [Google Scholar] [CrossRef]
  31. Urra, J.; Alkorta, I.; Lanzén, A.; Mijangos, I.; Garbisu, C. The application of fresh and composted horse and chicken manure affects soil quality, microbial composition and antibiotic resistance. Appl. Soil Ecol. 2019, 135, 73–84. [Google Scholar] [CrossRef]
  32. Xu, X.; Thornton, P.E.; Post, W.M. A global analysis of soil microbial biomass carbon, nitrogen and phosphorus in terrestrial ecosystems. Glob. Ecol. Biogeogr. 2013, 22, 737–749. [Google Scholar] [CrossRef]
  33. Tian, H.; Chen, G.; Zhang, C.; Melillo, J.M.; Hall, C.A.S. Pattern and variation of C:N:P ratios in China’s soils: A synthesis of observational data. Biogeochemistry 2010, 98, 139–151. [Google Scholar] [CrossRef]
  34. Zheng, S.; Xia, Y.; Hu, Y.; Chen, X.; Rui, Y.; Gunina, A.; He, X.; Ge, T.; Wu, J.; Su, Y.; et al. Stoichiometry of carbon, nitrogen, and phosphorus in soil: Effects of agricultural land use and climate at a continental scale. Soil Tillage Res. 2021, 209, 104903. [Google Scholar] [CrossRef]
  35. Guo, W.L.; Dang, J.X.; Lv, J.L.; Guo, J.W.; Quan, D.G.; Liu, S.C.; Ma, Q.A. Soil properties and fertilization in vegetable greenhouse at different ages. Agric. Res. Arid. Areas 2005, 23, 85–89. (In Chinese) [Google Scholar]
  36. Ning, D.F.; Kong, L.Q.; Tang, N.; Zhou, P. Variations of Soil Nutrients in Vegetable Garden with Different Cultivation Years. J. Sichuan Agric. Univ. 2016, 34, 67–72. (In Chinese) [Google Scholar]
  37. Zhang, W.; Gao, D.; Chen, Z.; Li, H.; Deng, J.; Qiao, W.; Han, X.; Yang, G.; Feng, Y.; Huang, J. Substrate quality and soil environmental conditions predict litter decomposition and drive soil nutrient dynamics following afforestation on the Loess Plateau of China. Geoderma 2018, 325, 152–161. [Google Scholar] [CrossRef]
  38. Ågren, G.I. The C:N:P stoichiometry of autotrophs—Theory and observations. Ecol. Lett. 2004, 7, 185–191. [Google Scholar] [CrossRef]
  39. Li, Y.; Niu, S.; Yu, G. Aggravated phosphorus limitation on biomass production under increasing nitrogen loading: A meta-analysis. Glob. Change Biol. 2016, 22, 934–943. [Google Scholar] [CrossRef] [PubMed]
  40. Yuan, Z.Y.; Chen, H.Y.H. Decoupling of nitrogen and phosphorus in terrestrial plants associated with global changes. Nat. Clim. Change 2015, 5, 465–469. [Google Scholar] [CrossRef]
  41. Tian, D.; Reich, P.B.; Chen, H.Y.H.; Xiang, Y.; Luo, Y.; Shen, Y.; Meng, C.; Han, W.; Niu, S. Global changes alter plant multi-element stoichiometric coupling. New Phytol. 2019, 221, 807–817. [Google Scholar] [CrossRef] [PubMed]
  42. Feng, X.; Wang, R.; Yu, Q.; Cao, Y.; Zhang, Y.; Yang, L.; Dijkstra, F.A.; Jiang, Y. Decoupling of plant and soil metal nutrients as affected by nitrogen addition in a meadow steppe. Plant Soil 2019, 443, 337–351. [Google Scholar] [CrossRef]
  43. Hermans, C.; Hammond, J.P.; White, P.J.; Verbruggen, N. How do plants respond to nutrient shortage by biomass allocation? Trends Plant Sci. 2006, 11, 610–617. [Google Scholar] [CrossRef]
  44. Parzych, A.; Jonczak, J.; Sobisz, Z. Bioaccumulation of Macronutrients in the Herbaceous Plants of Mid-forest Spring Niches. Balt. For. 2017, 23, 384–393. [Google Scholar]
  45. Xing, W.; Wu, H.; Shi, Q.; Hao, B.; Liu, H.; Wang, Z.; Liu, G. Multielement stoichiometry of submerged macrophytes across Yunnan plateau lakes (China). Sci. Rep. 2015, 5, 10186. [Google Scholar] [CrossRef] [PubMed] [Green Version]
Figure 1. Relative humidity (gray) and temperature (red) in the greenhouse during the experiment in autumn 2017.
Horticulturae 07 00528 g001
Figure 2. Field experimental design in 2017. Dashed outlines represent blocks (i.e., statistical replicates), boxes outlined in black represent the control soil (CO, only soil) plot, boxes outlined in red represent the straw mixture soil (ST, soil + straw + chicken + urea) plot, boxes filled in dark represent the newly added plots, and the numbers represent different planting times. Block width = 8 m, block length = 16 m. The bidirectional arrows represent the orientation of the three blocks arranged in the greenhouse.
Horticulturae 07 00528 g002
Figure 3. Variations in soil pH (a), EC (b), SOC (c), and DOC (d) with increasing planting time in the control soil (CO) and straw mixture soil (ST). EC, electrical conductivity; SOC, soil organic carbon (C); DOC, dissolved organic C. Dashed lines indicate the linear model or the non-linear model (black for CO and red for ST).
Horticulturae 07 00528 g003
Figure 4. Variation in the concentrations of soil total N (a), total P (b), and total K (c) and the molar ratios of C:N (d), C:P (e), C:K (f), N:P (g), N:K (h), and P:K (i) with increasing planting time in the control soil (CO) and straw mixture soil (ST). Dashed lines indicate the linear model or the non-linear model (black for CO and red for ST).
Horticulturae 07 00528 g004
Figure 5. Variation in the concentrations of soil inorganic N (a), available P (b), and available K (c) and the molar ratios of available C:N (d), available C:P (e), available C:K (f), available N:P (g), available N:K (h), and available P:K (i) with increasing planting time in the control soil (CO) and straw mixture soil (ST). Dashed lines indicate the linear model (black for CO and red for ST).
Horticulturae 07 00528 g005
Figure 6. Variation in the concentrations of soil total N (a), total P (b), and total K (c) and the molar ratios of C:N (d), C:P (e), C:K (f), N:P (g), N:K (h), and P:K (i) in the leaf with increasing planting time in the control soil (CO) and straw mixture soil (ST). Dashed lines indicate the linear model (black for CO and red for ST).
Horticulturae 07 00528 g006
Figure 7. Variation in leaf biomass (a), total plant biomass (b), and percentage of leaf biomass (c) and the acquisition of N (d), P (e), and K (f) in the leaf with increasing planting time in the control soil (CO) and straw mixture soil (ST). Dashed lines indicate the linear model (black for CO and red for ST).
Horticulturae 07 00528 g007
Figure 8. Variations in total yield (a) and harvest index (b) with increasing planting time in the control soil (CO) and straw mixture soil (ST). Dash lines indicate the linear model (black for CO and red for ST).
Horticulturae 07 00528 g008
Table 1. Basic properties of the tested materials.
MaterialspHECTotal CTotal NTotal PTotal KTotal C:Total N:Total P:Total K
mS cm−1g kg−1g kg−1g kg−1g kg−1
Control soil7.50.2121.30.910.63.7:0.3:0.1:1
Straw mixture soil6.90.9222.81.711.66.1:0.7:0.2:1
Straw41311.00.517.477.0:1.8:0.04:1
Chicken manure29551.421.635.427.0:4.0:0.8:1
Control soil, only soil; straw mixture soil, soil + straw + chicken + urea. The elemental molar ratios were computed using: m C 12 : m N 14 : m P 31 : m K 39 , where mC, mN, mP, and mK represent the mass amounts in g of carbon (C), nitrogen (N), phosphorus (P), and potassium (K), respectively. The analysis of the parameters in the Table 1 is referred to Bao [25].
Table 2. Spearman’s correlation between the elemental concentrations in the leaf and soil parameters.
C in LeafN in LeafP in LeafK in LeafANLAPLAKL
COpH−0.258−0.109−0.101−0.208−0.021−0.003−0.087
EC0.1240.0670.2590.0390.1160.1740.002
SOC0.160−0.2120.411 *−0.0560.1430.368 *0.078
Total N0.196−0.1850.500 **−0.0470.2320.460 *0.149
Total P0.097−0.2530.382 *−0.0870.1510.372 *0.099
Total K0.1110.310−0.259−0.0290.101−0.143−0.045
NO3−N0.041−0.1450.2050.0640.0530.2460.138
NH4+−N0.099−0.0790.1340.0280.0420.1390.008
DOC−0.003−0.0480.554 **0.0710.2030.413 *0.159
Inorganic N0.049−0.1540.1970.0420.0500.2450.124
Available P0.083−0.3390.200−0.1120.0390.2440.018
Available K−0.063−0.0990.261−0.2600.1520.295−0.046
STpH0.017−0.272−0.607 **−0.198−0.126−0.340−0.201
EC0.0470.1230.231−0.0390.1710.1960.071
SOC0.0270.0800.487 **0.0680.2960.498 **0.390 *
Total N0.0320.0620.379 *−0.0390.3480.469 **0.359
Total P0.015−0.2360.348−0.1650.385 *0.562 **0.375 *
Total K0.2070.289−0.0480.1720.039−0.034−0.038
NO3−N0.128−0.0350.1760.0350.1130.1080.141
NH4+−N0.1120.2060.363 *0.378 *−0.360−0.137−0.161
DOC−0.075−0.1850.430 *−0.1230.0910.3220.173
Inorganic N0.112−0.0430.1920.0360.0940.1000.123
Available P0.127−0.091−0.0460.0360.3470.2150.264
Available K−0.049−0.0160.195−0.1410.2040.2970.137
CO, control soil. ST, straw mixture soil. ANL, acquisition of N in leaf; APL, acquisition of P in leaf; AKL, acquisition of K in leaf; EC, electrical conductivity; SOC, soil organic carbon (C); DOC, dissolved organic C. The values in the table represent Spearman’s correlation coefficients. * and ** represent significant levels of Spearman’s correlation coefficient at p < 0.05 and 0.01, respectively.
Table 3. Spearman’s correlation of the leaf growth with the elemental parameters in the leaf and soil parameters.
CO ST
LBPLBTPBTYHILBPLBTPBTYHI
pH0.029−0.3230.2830.3590.308−0.196−0.3040.2480.372 *0.249
EC0.2260.453 *−0.148−0.424 *−0.504 **0.1520.151−0.050−0.163−0.180
Total N0.450 *0.457 *0.090−0.269−0.470 **0.446 *0.363 *0.082−0.160−0.364 *
Total P0.451 *0.3410.176−0.174−0.383 *0.565 **0.553 **0.011259−0.574 **
Total K−0.0800.160−0.182−0.221−0.211−0.143−0.2200.1180.1210.248
C:N−0.360−0.521 **0.1010.3450.527 **−0.0750.193−0.253−0.236−0.139
C:P−0.458 *−0.347−0.1560.1700.390 *−0.425 *−0.485 **0.0760.2960.543 **
N:P−0.380 *−0.193−0.2230.0550.249−0.495 **−0.597 **0.0710.3090.609 **
C:K0.391 *0.2100.238−0.035−0.2150.402 *0.469 **−0.070−0.279−0.444 *
N:K0.446 *0.370 *0.137−0.181−0.374 *0.369 *0.409 *−0.059−0.257−0.402 *
P:K0.453 *0.3360.178−0.161−0.374 *0.484 **0.517 **−0.051−0.275−0.538 **
NO3−N0.407 *0.3560.158−0.151−0.380 *0.1910.148−0.098−0.255−0.277
NH4+−N0.1970.364 *−0.141−0.350−0.363 *−0.320−0.088−0.362 *−0.2070.175
Inorganic N0.405 *0.3540.159−0.148−0.375 *0.1730.133−0.111−0.257−0.257
Available P0.3280.2300.051−0.159−0.2220.385 *0.1520.2110.004−0.281
Available K0.3240.3520.032−0.224−0.425 *0.2570.1430.059−0.055−0.139
Available C:N−0.170−0.046−0.168−0.0550.057−0.0080.0510.0550.1380.094
Available C:P0.0290.1610.034−0.018−0.176−0.1900.031−0.266−0.1620.082
Available N:P0.1500.0860.2030.074−0.119−0.143−0.028−0.264−0.251−0.007
Available C:K0.1140.1540.061−0.038−0.095−0.0710.022−0.095−0.060−0.035
Available N:K0.2340.1040.2210.037−0.100−0.0300.026−0.142−0.187−0.119
Available P:K0.059−0.036−0.014−0.0160.1020.112−0.0130.1450.068−0.117
N in leaf−0.0660.357−0.386 *−0.481 **−0.337−0.0110.137−0.119−0.275−0.122
P in leaf0.3580.471 **0.073−0.212−0.474 **0.2340.489 **−0.321−0.522 **−0.395 *
K in leaf−0.2570.047−0.248−0.240−0.1050.0490.114−0.146−0.191−0.057
C:N in leaf0.033−0.2240.2840.3320.2130.133−0.1430.2160.3170.053
C:P in leaf−0.358−0.395 *−0.1010.1600.406 *−0.243−0.529 **0.3210.522 **0.401 *
N:P in leaf−0.349−0.270−0.229−0.0260.266−0.300−0.543 **0.2700.470 **0.421 *
C:K in leaf0.2610.0300.2030.1740.021−0.031−0.1280.1710.2070.055
N:K in leaf0.1880.0680.0470.028−0.010−0.126−0.0820.0910.0700.030
P:K in leaf0.562 **0.3460.3210.052−0.2990.2190.449 *−0.180−0.381 *−0.414 *
ANL0.710 **0.608 **0.226−0.117−0.481 **0.911 **0.512 **0.629 **0.179−0.523 **
APL0.794 **0.589 **0.392 *0.001−0.484 **0.816 **0.733 **0.327−0.119−0.657 **
AKL0.563 **0.441 *0.3050.007−0.366 *0.881 **0.576 **0.516 **0.107−0.523 **
CO, control soil. ST, straw mixture soil. LB, leaf biomass per plant; PLB, the percentage of leaf biomass in the total plant biomass (LB:TPB); TPB, total plant biomass; TY, total yield per plant; HI, harvest index (TY:TPB); EC, electrical conductivity; ANL, acquisition of N in leaf; APL, acquisition of P in leaf; AKL, acquisition of K in leaf. The values in the table represent Spearman’s correlation coefficients. * and ** represent significant levels of Spearman’s correlation coefficient at p < 0.05 and 0.01, respectively.
Publisher’s Note: MDPI stays neutral with regard to jurisdictional claims in published maps and institutional affiliations.

