Abstract
Per capita apple consumption is falling in many European countries while overall fruit intake is growing or is stable, and consumption of other fruits is increasing. The reasons for the consumption decline of the world’s third most produced fruit are unclear. Based on an extensive literature review and a logit regression of data from a postal survey of 153 apple consumers in South Tyrol, Italy, the purpose of this study is to explain this trend. We show that (i) the increasing average age of consumers, (ii) economic factors such as consumer incomes and apple prices in combination with other demographic characteristics at least for some population segments, (iii) the dissatisfaction of some consumers with available mainstream apple varieties, and (iv) the below-average nutrient content of apples as compared to other fruits for health-conscious consumers are among the main causes. For the European apple growing industry, the decline in local per capita apple consumption may not be an economic problem if the industry decides to focus on emerging markets in the future. However, innovating fruit quality and better satisfying apple consumer preferences in high-income markets may prove to be more challenging.
1. Introduction
Apples (Malus domestica Borkh., 1803) are one of the world’s highest appreciated fruits. In 2018, commercially grown in 96 countries around the globe, apples were the third most produced fruit by weight, after bananas and watermelons but before grapes, oranges and mangoes, according to FAOSTAT (Production Crops database, online). Apples are harvested in both hemispheres (August through November north and April/May south of the equator). Moreover, they can be kept in cold storage for up to one year [1]. Hence, for decades, consumers have been able to buy apples nearly everywhere and at any time during the year in most places of the world [2].
“Eating an apple a day …” used to be a formula for a healthy life. As all fruits, apples are a source of sugar, fibre, minerals and bioactive compounds such as vitamins, organic acids, phenolics and antioxidants. Recent reviews have demonstrated the health benefits of apples [3,4]. However, according to the USDA’s FoodData Central database (online), raw apples (with skin) are well below the average of the other raw fruits and berries in total minerals, total vitamins and dietary fibre content (per 100 g). In particular, oranges, mangoes, bananas, watermelons and grapes all contain, in some cases significantly, higher amounts of micronutrients than apples, and similar amounts of fibre. While the nutritional value of apples is below average, their convenience in terms of being relatively shelf stable and ‘portable’, having a suitable portion size for snacking and their affordability is rated high by consumers [5]. Therefore, the good reputation of apples as an effective means to “… keep the doctor away” is probably due to their high availability and consumption convenience rather than their actual health properties [2].
Despite the historically high consumer appreciation of apples, in many countries, their per capita consumption is in fact stagnant or declining. This contrasts with growing or stable overall per capita fruit consumption and the often-significant growth for some fruits or fruit categories other than apples. However, the reasons for the consumption decline of apples as one of the world’s most important fruits are unclear.
In this article, we review the literature related to fruit and in particular apple consumption behaviour. Moreover, we present findings from a household survey pointing to potential reasons for the fall in per capita apple consumption. The data were collected in South Tyrol, a small province in northern Italy at the border to Austria and a significant apple production region. For our analysis, we used a large set of self-reported variables related to apple consumption resulting from 1000 posted print questionnaires in 2012. Bossi Fedrigotti and Fischer [6] provided a summary of the general survey results based on the 216 valid responses. We conducted a logit regression analysis with interaction effects to determine the socio-economic, demographic, altitudinal and behavioural factors that discriminate between consumers with stable apple consumption and those who report that their apple intake has decreased over the last 10 years.
The aims of the research described in this article were to identify and to describe the main reasons underlying the widely observed decline in per capita apple consumption and to reflect on potential remedies to halt this trend. While our empirical results are specific to the region of South Tyrol, by combining them with insights from the international scientific and industry literature, our findings may be indicative for explaining the general decrease in apple consumption observed in many countries.
2. Current Consumption Situation and Apple Consumer Literature
2.1. Per Capita Apple Consumption Trends
Worldwide, the per capita consumption of apples is growing. According to FAOSTAT (Food Balance Sheets database, online), the global yearly per capita supply of apples and apple products such as juice was 8.6 kg in 2017 (the most recent year currently available) and continuously increased from about 4 kg in 1961. These supply data can be regarded as a useful and valid proxy measure for human per capita consumption. They reflect the total supply of a food item in a country (production + imports – exports + changes in stocks) available for human consumption in a particular year, divided by the total population of that country in that year [7]. However, it is a calculated average indicator rather than a measured one at individual or household level. An added advantage of per capita supply data in the case of apples is that they also include processed apple products and thus account for a potential consumption shift away from raw fruits to processed items that is common for modern affluent consumers.
In the different world macro-regions, there are large differences in apple consumption levels and trends. According to FAOSTAT (Food Balance Sheets database, online) in 2017, Europe was the region with the highest yearly per capita consumption of apples and products at 13.2 kg. In 2014, it was 15.7 kg and historically peaked at 24.1 kg in 1984 (The FAOSTAT Food Balance Sheet database distinguishes between the 1961–2013 and the 2014 to today periods due to changes in methodology. In particular, underlying country population numbers have been revised which affects per capita values. In general, the new-methodology numbers are somewhat lower than the historical ones. However, these structural breaks in the data series do not affect the conclusions of this article.). In Oceania, per capita consumption was 11.7 kg in 2017, slightly up from 11.1 kg in 2014 and down from its peak of 25.7 kg in 2005. In the Americas, per capita consumption in 2017 was 10.0 kg, up from 8.5 kg in 2014 but down from the long-term peak of 13.6 kg in 1987. Asia and Africa saw continuous growth in per capita consumption of apples and products from 1961 to 2013 and were at their peaks in 2013 at 10.0 kg and 2.8 kg, respectively. In the period 2014 to 2017, the consumption quantities did not change much from year to year and in 2017 were at 9.0 kg in Asia and 2.2 kg in Africa.
Within Europe, also according to FAOSTAT (Food Balance Sheets database, online), most countries are down from their historical apple consumption peaks. In Germany, average per capita apple consumption was 18.5 kg in the period 2010–2013, a drop of almost 60% from its peak average yearly consumption of 45.7 kg in the period 1980–1989. During the 2014–2017 period, apple consumption fell further to 13.7 kg in 2017. In France, consumption fell by 55% to 9.7 kg in 2010–2013 from its peak of 21.7 kg in 1961–1969. In 2017 it was 9.3 kg. Italy is down by 38% to 14.9 kg in 2010–2013 from 24.0 kg in 1961–1969, and consumption fell further to 7.2 kg in 2017. Spain decreased by 44% to 10.7 kg in 2010–2013 from 18.9 kg in 1990–1999. In 2017, consumption was 10.0 kg. The only countries that increased their average yearly per capita apple consumption during 2014–2017 were Portugal (from 23.6 kg in 2014 to 29.5 kg in 2017) and the UK (from 14.9 kg in 2014 to 16.2 kg in 2017).
These trends contrast with the ones in total fruit consumption in Europe. Again, according to FAOSTAT (Food Balance Sheets database, online) in 2017, average yearly per capita consumption of total fruit was highest in Portugal (135.6 kg), followed by Greece (119.9 kg) and Italy (113.4 kg). It was lowest in Poland (55.0 kg), Denmark (59.8 kg) and Sweden (67.8 kg). During the 2014–2017 period, total fruit consumption increased in Portugal (compound average annual growth rate, CAGR, 5.8%), Greece (4.1%), Spain (2.5%), France (2.1%), Finland (0.6%) and the UK (0.5%). Total fruit consumption fell in the Netherlands (CAGR: –4.4%), Austria (–2.1%), Poland (–1.7%), Italy (–1.6%), Sweden (–0.9%), Norway (–0.6%) and Germany (–0.5%).
In several countries with falling apple consumption, the consumption of some other fruits increased or remained stable, according to the same data source. For instance, during the 2014–2017 period, in the Netherlands, the consumption of grapefruit (and grapefruit products) increased by a CAGR of 15.1%, in Greece the consumption of “other fruits” (defined by FAO of all fruits but oranges/mandarins, lemons/limes and products, grapefruit and products, other citrus, apples and products, grapes and products (excluding wine), pineapples and products, dates, bananas or plantains) increased by 12.3%, and in Poland the consumption of pineapples (and products) increased by 8.1%. Figure 1 shows the consumption growth situation for the selected European countries of total fruits, apples (and products) and the fruit category with the highest CAGR during the 2014–2017 period. It becomes clear that while some of the decreases in apple consumption may be attributed to a general decline in fruit consumption in some countries, the latter cannot fully explain the widespread and steep drop of apple consumption in most cases.
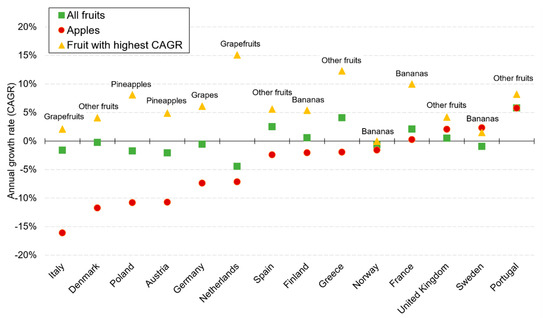
Figure 1.
Average annual growth (2014–2017) in yearly per capita consumption (in kg) of total fruits, apples and the fastest growing fruit category, selected European countries (CAGR = compound annual growth rate).
2.2. Reasons for the Decline in Per Capita Fruit and Apple Consumption
The reasons for the widespread decline in the consumption of apples are not known [2]. Thus far, virtually no academic studies have investigated this phenomenon. Konopacka et al. [8] in their survey of apple and peach consumers in seven European countries, recently reported lower apple intake by younger than older people from which they anticipate falling future per capita consumption of the fruit without discussing further reasons. Contrarily, for Canadian food consumers, for the period 2004–2015, Tugault-Lafleur and Black [9] found stagnant fresh fruit and declining fruit juice intake for adults and a slightly increased intake of fresh fruit for children. The authors do not provide reasons for these trends. Some recent industry publications point to the phenomenon of falling fruit and in particular apple consumption. Lin and Mentzer Morrison [10] tooke a closer look at declining fruit and vegetable consumption in the US between 1994–1998 and 2007–2008. They founnd that a strong decline in the consumption of orange juice was the biggest factor behind the drop of total fruit consumption across all age and gender groups. Some substitution occurred between fruit types, as the consumption of bananas and citrus fruits fell while the one of berries increased. The study found that socio-economic and demographic factors such as education, income and ethnicity are associated with differences in fruit consumption levels and trends. Moreover, the authors mention lifestyle changes and time constrains as well as price developments as potential reasons for the observed fall in fruit consumption. In Japan, falling fruit consumption between 2008 and 2017 was mainly attributed to the high and rising purchasing costs for consumers [11]. In contrast, in Australia, the decline in apple consumption went hand in hand with a decline in apple prices and growers are pinning their hopes for a market recovery to the introduction of a new, red-fleshed apple variety [12]. Overall, all these studies and articles suggest that the reasons for the decline in apple consumption are not well understood.
2.3. Previous Studies on Apple Consumption Determinants
In the literature, various determinants of apple consumption behaviour related to purchase decisions, consumption choices, consumption frequency, consumer preferences or perceptions are discussed. Table 1 summarises recent studies on apple consumption, with a worldwide coverage. The findings are summarised according to the type of determinant investigated such as economic, socio-demographic, cultural, attitudinal, ethical, behavioural factors, apple varieties, apple attributes or health properties. The study results can contradict each other, depending on the location (country), the methodologies used or the apple varieties under consideration. This makes the derivation of conclusions regarding potential causes for the decline in per capita apple consumption difficult.

Table 1.
Literature review—main determinants of apple consumption.
Higher income discriminated between apple buyers and non-buyers, as in the case of Fotopoulos and Krystalliis [14], as well as between organic and conventional apples or between local and imported apples. The highest price surpluses that consumers are ready to pay for their favourite products are to be found in Italy, ranging from around +0.20 €/kg to +3.64 €/kg, while the Danish and Albanian stated price surpluses settled on intermediate values: +2.54 €/kg and +1.11 €/kg, respectively [13,15,16,17].
Gender and age are the most frequently investigated socio-demographic determinants related to apple consumption. Belonging to the male gender significantly affected, for instance, the choice of consuming fewer apples [8,20] or the visual preference for red-coloured apples [19]. However, elderly consumers and males were an exception in Mediterranean countries, where their apple intake was higher than for females [8]. Being female accentuated a rejection of green apples [13], whereas in a Hungarian study, gender did not influence any preference at all [21]. An increasing age indicated a higher likelihood of consumers eating fewer apples, even though age indicated a much higher frequency of consumption among loyal consumers [20]. Older consumers considered production methods (conventional vs. genetically modified) to be twice as important than younger consumers whereas younger consumers considered apple origin much more relevant than older consumers [22].
Cultural factors significantly influenced apple preferences and intake, too. For instance, different geographical backgrounds revealed diverse consumption behaviours. Konopacka et al. [20] compared apple consumption habits in seven European countries and showed a higher per capita intake in Poland and a lower apple intake in the Netherlands. Galmarini et al. [23] highlighted differences between Argentinean and French consumers, the latter consuming almost twice as many apples as the former. Growing up in a communistic political system affected the choice of apple provenance and encouraged the consumption of domestic apples [24]. Familiarity with apples and with apple varieties was the main determinant in van der Merwe et al. [25]: apple consumption was generally lower when varieties were associated with an unfamiliar image.
Attitudinal or ethical factors affect daily lifestyles and choices that positively interfere with the wellbeing of humans and of the environment. In Italy, organic production was generally considered a positive criterion by apple consumers [16]. In Denmark, preferences towards organic apples also influenced preferences for local apples, however, there was no relationship the other way [17]. Preferences for local apples, rather than imported ones, was also reported by Jensen and Mørkbak [18], Ceschi et al. [13] and Pénau et al. [20]. Suboptimal appearance standards such as spotted apple skins negatively influenced the decision to purchase apples by consumers, whereas, once at home, suboptimal fruits were consumed first [26]. In the USA, the conventional production system was preferred over the use of genetically modified organisms [22].
Behavioural factors indicate the way apples are bought or consumed. Patterson and Richards [27] point to the presence of big visual advertisements as a determinant that encourage apple purchases. As to consumption patterns, Thybo et al. [19] and Endrizzi et al. [28] highlighted the importance of the season: almost half of consumers only ate apples in autumn and winter. Moreover, the same studies indicated a preference for peeled apples by some consumers.
Preferences for apple varieties significantly differ from country to country. ‘Golden Delicious’ was the most popular variety in Italy [16] and the most preferred in Romania, together with ‘Jonagold’ [31]. The latter was also the most appreciated variety in Denmark [19]. Bonany et al. [32] mapped preferences for eleven apple varieties in France, Netherlands, Germany, Poland, Switzerland, Italy and Spain: 62% of consumers expressed their preferences for the same four varieties, i.e., ‘Goldchief’, ‘Rubens’, ‘Fuji’ and ‘Pink Lady’. Moreover, modern varieties such as ‘Fuji’ and ‘Pink Lady’ were also preferred in South Africa and the USA [25,29,30].
The relationship between apple attributes and consumption behaviour has been studied intensively. Texture characteristics such as apple crunchiness as well as the juiciness and sweetness of the flesh were important for French consumers [33]. Taste and fruit flavour were the most cited and the most important attribute in numerous studies [20,21,24]. As for size, small apples were preferred by 50% of children in Denmark [19] and fruit size affected consumer perceptions in Albania, where big apples were preferred by more than 85% of consumers, but small apples were preferred by medium income consumers [15]. Apple colour is another important characteristic. For instance, red or bicoloured apples were preferred in Denmark, in Canada and in New Zealand [17,34].
Finally, three European studies have investigated how health benefits of apples affect consumption behaviour. In Italy, Endrizzi et al. [28] found that information on antioxidant content increased desirability among older consumers and those with a thorough understanding of antioxidants and their health benefits. Information on fibre content increased desirability by those who use food as a reward. In Switzerland, Péneau et al. [20] showed that additional information on apples’ nutritional value provided to consumers enhanced the frequency of apple intake. Hypoallergenic apple varieties such as Santana also positively increased apple consumption by allergy sufferers [35].
Overall, the literature does not yet provide clear indications on the causality of the decline of per capita apple consumption. Despite the identification of numerous characteristics for which apples are preferred, determinants do not highlight specific reasons for apple abandonment, nor do they accurately profile the consumers who admit to eating fewer apples than in the past.
3. Materials and Methods
3.1. Study Area
The Autonomous Province of Bozen-Bolzano (also known as South Tyrol or Alto Adige) is located in the Eastern Alps, in the northernmost region of Italy, covers an area of 7400 km2 and 37% of its surface is situated 2000 m above sea level [36]. In 2016, apple orchards occupied an area of about 18,700 hectares and 1.1 million tons of apples were harvested, almost half of the Italian and around one tenth of the European apple production [37]. Together with the adjacent Province of Trento, Bolzano forms the region Trentino-Alto Adige, accounting for 65% of national apple production. The output has been increasing 10-fold during the last 65 years [38]. The most popular cultivar is Golden Delicious with a production of 374,380 tons of apples in 2016, followed by Gala (154,521 tons) and Red Delicious (100,647 tons), as reported by the chamber of commerce of Bolzano. Currently, about 50% of the production is sold in Italy, whereas the most important foreign market is Germany, representing 25% of all exports [39].
In the Province of Bolzano live 528,000 people, divided into three linguistic groups: German (70%), Italian (27%) and Ladin (3%). Bolzano is the main city, counting 107,000 inhabitants [36].
3.2. The Apple Consumption Survey (Questionnaire and Sampling)
The questionnaire consisted of five sections: (i) shopping and storage of apples, (ii) consumption of apples and apple juice, (iii) processing and use in cooking, (iv) health aspects and image of apples, and (iv) socioeconomic information. Most of the questions were closed ended, including multiple-choice answer option (with one or multiple answers allowed), yes/no questions as well as questions with Likert-type answering scales. The total list of included variables together with summary statistics is provided in Appendix A.
The survey was conducted between October and November 2012 when 1000 questionnaires were randomly distributed, together with a cover letter and a prepaid return envelope, into the household mailboxes all around the Province of Bolzano. University students were sent to locations all over the province where the students randomly selected households to which the envelopes were delivered into the mailboxes. The cover letter indicated the scientific nature of the data collection and carried the logo of the local university. To raise the motivation to participate, a prize draw was carried out in which three of the respondents could win €100 each.
A total of 216 valid questionnaires were returned, resulting in a response rate of 22%. Taking into account that the Province of Bolzano counts around 500,000 inhabitants and that several previous studies on apple consumer preferences coped with similar proportions in local case studies [13,15,16,23,40], we considered a response rate of 22% as adequate.
3.3. Statistical Analysis
The status of survey respondents of belonging to either the group of declining apple consumers (y = 1) or to the group of constant apple consumers (y = 0) was regressed on the variables from the collected response dataset. All tested variables were recoded to binary (dummy) specifications (i.e., taking either 0 or 1 values). We specified the regression models with main effects and second-order interaction effects (i.e., the product of two variables) which resulted in a very large number of available regressor variables relative to the size of the response dataset. Therefore, we used a stepwise model specification procedure where we entered a selection of relevant variables into the regression model and retained only those that displayed stable significance over a large set of model specifications. Variables that remained insignificant in several model specifications were removed. The statistical software Stata (version 14, Stata Corp LLC, College Station, TX, USA) and its logistic regression routine was used to obtain regressor coefficients. These coefficients represent the additive marginal effect of a unit change of the independent variable on the probability of being a declining consumer, and their (default) standard errors. We used the logit routine to estimate odd ratios, i.e., the multiplicative effect of a unit change in an explanatory variable on the probability of being a declining consumer relative to the probability of being a constant one [41]. Both effect measures are strictly related to each other since one is calculated from the other. The difference is in the depiction in the effects: negative marginal coefficients relate to odd ratios smaller than one and positive marginal effects to odd ratios larger than one. In the interpretation of results, odd ratios are often preferred since they better reflect effect sizes.
4. Results
4.1. Sample Description and Sociodemographic Profile
The sociodemographic attributes of our sample in comparison to the official data of the Provincial Institute of Statistics [42] are reported in Table 2. Females were overrepresented if compared to the population data (68.4% versus 50.6%). However, in reality, females are at a large majority in charge of food shopping and cooking [43], therefore the sample imbalance may not be problematic. The average age of the sample was higher (48.8 years) than the overall population’s age (42.4 years) but the difference is not large. The sample proportions of the German and Italian speaking responders reflect the total population reality. However, the sample does not include answers from the Ladin language group minority. In the sample, the educational level is higher than in the population, whereas the distribution between rural and urban areas is representative. Given the absence of large discrepancies in Table 2, we considered the sample as sufficiently representative for the provincial population.
Table 2.
Sociodemographic characteristics of the sample compared to the population data for the Province of Bolzano.
4.2. Consumption Patterns and Habits
In general, apples were preferably bought at the supermarket, loose and once a week or less and eventually stored at home, in a cellar. Important to consumers were predominantly the localness of production, the firmness of the flesh and the fruit’s perceived vitamin content. The preferred variety was ‘Golden Delicious’ and the favourite time of the day for consuming an apple was the afternoon, more frequently during the week rather than on weekends. Consumers also tended to keep a stock of apples at home and to wash and cut the fruits before eating them. The sub-samples of consumers with stable apple consumption patterns and consumers with declining consumption were formed by the answers to the question “Were you consuming more/less apples than 10 years ago?”. The two subgroups of the sample represent 82% (constant consumption) and 18% (declining consumption) of the respondents. Appendix A reports the mean values for all the variables used in the survey, for the whole sample as well as for the sub-samples of consumers with a constant and declining apple intake.
4.3. Determinants of Apple Consumption Decline
From the consumers who stated that today they consume fewer apples than 10 years ago, the majority of them (61%) gave as reason for their declining apple intake the fact that there is now a wider range of other fruits available from which to choose than in the past. The second most selected reason (27% of all respondents) was the perception that apples have become less tasty, followed by the statements that apple prices have increased (10%) and that apples have become less healthy (5%) (Table 3).
Table 3.
Reasons given by declining apple consumers for their lower intake.
Next, we assessed the impact of the collected survey variables on the likelihood of respondents belonging to the consumer group with decreasing apple consumption by estimating logistic/logit regression models. Table 4 provides the results from the final model specification.
Table 4.
Logit regression—variables affecting the likelihood of being a declining apple consumer.
The results show that socio-economic and demographic factors had the highest influence on the probability of being a declining apple consumer. However, there were almost no simple main effects and combinations of socio-economic and demographic characteristics were mostly associated with declining apple consumption. Being male, German speaking, older than 65 years, or having a low income (i.e., less than 2000 euros monthly household income) in themselves had no statistically significant impact on the likelihood of being a declining apple consumer. The only exception was low education (i.e., less than high school) which generally decreased the odds of being a declining apple consumer to 12% of the odds of belonging to this group when consumers had a higher education. The highest probability of having reduced apple intake was consumers with a higher income and a low education. Such consumers had almost 27 times higher odds (chances) of showing reduced apple consumption as compared to other consumers. A similar strong increase in odds was shown in Italian speaking South Tyroleans who were older than 65 years (25 times) and females with low income (20 times).
Moreover, some attitudinal and behavioural consumer characteristics increased the likelihood of being a declining apple consumer. The strongest effect resulted from variety preferences. Consumers whose favourite apple variety was Braeburn had almost 13 times higher odds of decreased apple consumption as compared to consumers who preferred other apple varieties. We also found that these odds were higher for consumers who stored their apples inside the apartment (but not in the fridge, cellar or garage) (six times), who bought apples less than once a week (five times) and who rate kiwis as the healthiest fruit (four times). Finally, consumers who preferred to eat apples for pleasure only had 29% of the odds of reduced apple consumption as compared to consumers who eat apples for other reasons.
The model fit was satisfactory overall. With a likelihood ratio chi-square (LR chi2) of 42.2 and a P-value of 0.0001 the presented model as a whole fit significantly better than an empty model (i.e., a model with no predictors). The Pseudo R2 value of 0.303 was acceptable and was not directly comparable to the coefficient of determination in standard linear regression models.
5. Discussion
The combination of evidence presented (literature summary and survey results) points to multiple reasons for the decline in per capita apple consumption in South Tyrol. However, these reasons may also be indicative for the more general situation in Europe. There are demographic shifts, economic factors as well as changing preferences and higher health awareness of consumers.
Europe’s (including South Tyrol’s) aging population leads to a reduction in per capita calorie intake across all food categories including fruits due to age-related reduced physical activity and energy metabolism. In general, the European population is “greying” with a median age of 43.3 years in 2019 increasing steadily, according to Eurostat data (online). Among the 10 countries with declining per capita apple consumption of Figure 1, half are even above the median EU population age (Italy, Austria, Germany, Spain and Greece), according to the same source. Our literature review (Table 1) confirmed the influence of age as a factor of declining apple consumption (e.g., Péneau et al. [20]). The survey logit regression results revealed how old age (i.e., being older than 65 years) in combination with being part of the Italian language group significantly and highly increased the likelihood of being a declining apple consumer. A related issue may be the comparably hard flesh and skin texture of apples which are among the crunchiest and crispiest among all fruits [44,45]. This otherwise generally appreciated texture characteristic may cause eating problems for elderly consumers who have lost (part of) their teeth. The removal of the apple skin (peeling) may partly help and is common practice among older people. In fact, our survey results indicated a statistically highly significant higher average age of consumers who regularly peeled apples before eating them. Hence, per capita apple consumption in Europe is falling partly because its population on average is getting older and older people generally eat less and in particular they eat fewer apples.
Fruit demand is generally inelastic to price and income changes. In a recent meta-analysis, Femenia [46] reported an average own-price elasticity for fruit and vegetables, based on 668 individual estimates of –0.61 and an income elasticity of 0.61 (based on 694 observations). This means that a price increase of 1% would decrease fruit demand by 0.61% while an increase of consumer incomes of 1% would increase fruit demand by 0.61%. While being inelastic (i.e., in absolute terms smaller than one) this average own-price elasticity is larger than for other stable food categories such as meat and fish, dairy products, cereals, and oils and fats. This indicates that the fruit and vegetable category is still more price-sensitive than the other food categories. The income elasticity of fruit and vegetables is somewhat lower than the ones for meat and fish, and dairy products but higher than the ones for cereals, and oils and fats. This indicates that consumers rather prefer to spend additional income on animal-based food than on fruit and vegetables. For individual fruits, the average own-price elasticity of apples has been found to be lower (–0.33) than the ones for bananas (–0.46) or oranges (–0.79) [47]. Average income (or “expenditure”) elasticities for apples have also been found to be lower (0.12) than the ones for bananas (0.47) and oranges (0.60) [48]. All this indicates that economic factors do not greatly influence apple consumption decisions. Indeed, this is confirmed by our survey results where only 11% of consumers with declining apple consumption indicated price increases as a reason (Table 3) and where the consumer income variable in itself (i.e., as a main effect) has turned out to be non-significant (Table 4). However, the income variable in combination with other demographic characteristics strongly and highly significantly increased the odds of being a declining apple consumer. Higher income combined with a low education increased these odds by almost 27 times, possibly representing time-poor consumers who need to work hard because of lower qualifications to earn more. Moreover, in our logit regression estimates, low income in combination with being female increased the odds of decreased apple consumption by almost 20 times, possibly pointing again at particular socially disadvantaged population segments. Hence, while economic factors in general may not contribute much to the explanation of declining per capita consumption in South Tyrol and perhaps more generally in Europe, they provide valuable insights in combination with other demographic characteristics. Moreover, economic factors help to explain apple consumer preferences for a certain production method, fruit origin, colour or size (Table 1).
Changing consumer preferences also contribute to explain the declining per capita apple intake. In our survey logit regression results, consumers who preferred the apple variety/cultivar Braeburn had almost 13 times higher odds of declining apple consumption. This may point to the dissatisfaction of at least some consumers with the currently available mainstream apple varieties. In South Tyrol, almost 80% of all produced (and locally sold) apples (by weight) are the international standard varieties ‘Golden Delicious’, ‘Gala’ and ‘Red Delicious’. Only 5% of production constitutes of ‘Braeburn’ apples. This variety is known as the first modern apple cultivar with a red-yellow bicolour, and is sensorially quite distinct in taste and texture from the three local mainstream varieties [28]. As our literature review has shown, consumers had distinct preferences for certain apple varieties and these preferences are changing. Our survey results (Table 3) also indicated that a bigger choice of other fruits is the main reason given by declining apple consumers. Hence, if consumers are dissatisfied with the available offering of apples, they may abandon them and turn to other fruits.
Finally, a higher health awareness of consumers than in the past may also contribute to the apple exodus. Our literature review has shown that health is an issue for apple consumers in several countries. In our survey logit regression results, people who consume apples for other reasons than for pleasure were more likely to be in the group of declining apple consumption. Other reasons include eating apples because of hunger, health or convenience, where health is the most important one (see Appendix A “Health aspects and image”). The logit regression results also showed that consumers who rated kiwis as the healthiest fruit had 4.4 higher odds of declining apple consumption. In fact, according to USDA’s FoodData Central database (online), kiwis (green) are the fruit with the second highest all-vitamin density after black currants (apples, with skin, come at the 44th position in this measure). This indicates that at least some of the declining apple consumers may choose other fruits for better health benefits. Moreover, as food-related allergies are on the rise and eating apples can cause allergies [49], a growing number of consumers may stop eating them, thus causing average population per capita intake to fall.
In summary, we found that the increasing average age of consumers, economic factors such as consumer incomes and apple prices in combination with other demographic characteristics at least for some population segments, the dissatisfaction of some consumers with available mainstream apple varieties and the below-average nutrient content of apples as compared to other fruits for health-conscious consumers were among the main reasons for declining per capita apple consumption in South Tyrol and likely elsewhere in Europe.
6. Conclusions
Declining per capita apple consumption in Europe may not be an economic problem for the European apple growing industry. The world population is still growing, particularly in Asia and Africa, where per capita apple consumption is also still increasing or at least not declining. In fact, according to FAOSTAT production data (online), the world apple production and hence consumption increased from about 71 million tonnes in 2010 to 83 million tonnes in 2017. For European apple growers, this may mean fewer local sales and more extra-European exports. Given the long-term storability and good logistical properties of apples, the fruit may become a de-seasonalised and globalised commodity, filling supermarket shelves worldwide, 365 days a year. Because of the low own-price elasticity of apples and therefore attracting rather price insensitive apple buyers, with a focus on serving emerging markets and with competent sales management, the industry may be able to continue generating profits in the future.
However, in high-income markets where more local food production and consumption is desired, where consumers are increasingly conscious about seasonality, product variety and health issues, the traditional apple may not have a bright future. In fact, the rather low income elasticity of apples reflects the fruit’s low attractiveness to food consumers. Strategies of the apple industry to win back lost buyers in such markets may include variety innovation specifically pointing to improve on the fruit’s health properties (e.g., red-fleshed cultivars), and smaller and softer fruits to cater for the needs of aging consumers. In addition, consumer excitement may be improved by giving up on the idea of long-term storage for focusing on product freshness and re-establishing seasonality by voluntarily reducing the length of after-harvest sales periods. Further research to support such industry transformation will certainly be needed. However, whether the industry is willing and able to ‘reinvent’ itself remains to be seen.
Author Contributions
Project design and research questions development: C.F. and V.B.F.; Data collection: V.B.F. and C.F.; Data analysis: V.B.F. and C.F.; Manuscript preparation: V.B.F. and C.F.; Editing of the manuscript: C.F. All authors have read and agreed to the published version of the manuscript.
Funding
This research received no external funding.
Conflicts of Interest
The authors declare no conflict of interest.
Appendix A
Table A1.
Variables used in the consumer survey and descriptive statistics.
Table A1.
Variables used in the consumer survey and descriptive statistics.
| Questionnaire Section | Variable | Unit/Scale | Mean all Sample | SD all Sample | Mean Constant Consumers (n = 172) | Mean Declining Consumers (n = 37) | Significance of Differences |
|---|---|---|---|---|---|---|---|
| Purchase and storage of apples | Buy_or_grow | 1 = buy, 2 = grow, 3 = grow partly | 1.26 | 0.613 | 1.25 | 1.31 | p = 0.587 |
| Purchase_frequency | 1 = daily, 2 = weekly, 3 = monthly, 4 = once a year | 2.48 | 0.677 | 2.41 | 2.72 | p = 0.018 | |
| Purchase_quantity | 1 = below 1 kg, 2 = 1 to 5 kg, 3 = above 5 kg | 1.54 | 0.551 | 1.61 | 1.19 | p = 0.000 | |
| Purchase_location_market | 1 = no, 2 = yes | 1.17 | 0.380 | 1.18 | 1.12 | p = 0.384 | |
| Purchase_location_supermarket | 1 = no, 2 = yes | 1.42 | 0.495 | 1.41 | 1.45 | p = 0.621 | |
| Purchase_location_greengrocer | 1 = no, 2 = yes | 1.37 | 0.485 | 1.37 | 1.39 | p = 0.773 | |
| Purchase_location_producer | 1 = no, 2 = yes | 1.26 | 0.438 | 1.27 | 1.22 | p = 0.569 | |
| Max_price_1kg | 1 = below €1, 2 = €1–2, 3 = €2–3, 4 = above €3 | 2.21 | 0.654 | 2.21 | 2.21 | p = 0.204 | |
| Loose_or_packaged | 1 = loose, 2 = packaged | 1.04 | 0.199 | 1.04 | 1.03 | p = 0.501 | |
| Importance_of_taste | 1 = not at all, 2 = somewhat, 3 = important, 4 = very important | 3.83 | 0.463 | 3.84 | 3.76 | p = 0.373 | |
| Importance_of_colour | – as above – | 2.38 | 0.908 | 2.37 | 2.55 | p = 0.309 | |
| Importance_of_shape | – as above – | 2.85 | 0.750 | 2.84 | 2.94 | p = 0.536 | |
| Importance_of_storability | – as above – | 2.91 | 0.927 | 2.97 | 2.74 | p = 0.185 | |
| Importance_of_fruit_size | – as above – | 1.96 | 0.845 | 1.95 | 2.00 | p = 0.757 | |
| Importance_of_variety | – as above – | 2.96 | 0.928 | 2.95 | 3.06 | p = 0.553 | |
| Importance_of_flesh_firmness | – as above – | 3.33 | 0.715 | 3.35 | 3.32 | p = 0.863 | |
| Importance_of_quality_class | – as above – | 2.97 | 0.927 | 3.01 | 2.81 | p = 0.261 | |
| Importance_of_local_production | – as above – | 3.44 | 0.839 | 3.45 | 3.38 | p = 0.639 | |
| Importance_of_organic_production | – as above – | 2.60 | 1.074 | 2.64 | 2.45 | p = 0.379 | |
| Importance_of_price | – as above – | 2.88 | 0.817 | 2.90 | 2.87 | p = 0.858 | |
| Preferred_taste | 1 = sweet, 2 = tart, 3 = balanced | 2.37 | 0.836 | 2.43 | 2.12 | p = 0.049 | |
| Preferred_colour | 1 = red, 2 = green, 3 = yellow, 4 = bicoloured | 3.10 | 1.181 | 3.17 | 2.91 | p = 0.259 | |
| Preferred_size | 1 = small (below 100g), 2 = medium (100–200g), 3 = large (above 200g) | 1.84 | 0.412 | 1.82 | 1.90 | p = 0.351 | |
| Preferred_variety_Golden Delicious | 1 = no, 2 = yes | 1.61 | 0.489 | 1.60 | 1.71 | p = 0.200 | |
| Preferred_variety_Granny Smith | – as above – | 1.18 | 0.385 | 1.18 | 1.17 | p = 0.960 | |
| Preferred_variety_Gala | – as above – | 1.51 | 0.501 | 1.54 | 1.37 | p = 0.065 | |
| Preferred_variety_Fuji | – as above – | 1.33 | 0.471 | 1.33 | 1.31 | p = 0.847 | |
| Preferred_variety_Pink Lady | – as above – | 1.36 | 0.480 | 1.36 | 1.31 | p = 0.639 | |
| Preferred_variety_Braeburn | – as above – | 1.09 | 0.287 | 1.08 | 1.17 | p = 0.075 | |
| Preferred_variety_Red Delicious | – as above – | 1.10 | 0.301 | 1.09 | 1.14 | p = 0.320 | |
| Preferred variety_Jonathan | – as above – | 1.13 | 0.343 | 1.14 | 1.11 | p = 0.650 | |
| Preferred variety_other | – as above – | 1.21 | 0.408 | 1.23 | 1.17 | p = 0.487 | |
| Storage_place | 1 = fridge, 2 = cellar, 3 = garage, 4 = in-house, 5 = other | 2.83 | 1.194 | 2.76 | 3.15 | p = 0.087 | |
| Storage_time | 1 = few days, 2 = below one month, 3 = above one month, 4 = above six months | 2.00 | 0.879 | 2.00 | 1.97 | p = 0.861 | |
| Consumption of apples | Main_consumers_children (<18) | 1 = no, 2 = yes | 1.22 | 0.418 | 1.19 | 1.35 | p = 0.034 |
| Main_consumers_adults | – as above – | 1.67 | 0.472 | 1.68 | 1.59 | p = 0.319 | |
| Main_consumers_seniors (>65) | – as above – | 1.23 | 0.421 | 1.23 | 1.22 | p = 0.831 | |
| Apple_preferred_fruit | 1 = strongly disagree, 2 = somewhat disagree, 3 = neutral, 4 = somewhat agree, 5 = strongly agree | 3.53 | 1.045 | 3.64 | 3.03 | p = 0.002 | |
| Consume_daily | – as above – | 3.58 | 1.204 | 3.72 | 2.97 | p = 0.001 | |
| Consume_when_travelling | – as above – | 3.45 | 1.345 | 3.54 | 3.03 | p = 0.034 | |
| Always_have_stock_home | – as above – | 4.11 | 1.125 | 4.26 | 3.41 | P = 0.000 | |
| Preferred_moment_morning | 1 = no, 2 = yes | 1.11 | 0.316 | 1.12 | 1.05 | p = 0.232 | |
| Preferred_moment_midday | – as above – | 1.14 | 0.343 | 1.16 | 1.05 | p = 0.101 | |
| Preferred_moment_afternoon | – as above – | 1.44 | 0.498 | 1.44 | 1.46 | p = 0.796 | |
| Preferred_moment_evening | – as above – | 1.29 | 0.452 | 1.30 | 1.24 | p = 0.476 | |
| Preferred_moment_anytime | – as above – | 1.22 | 0.415 | 1.21 | 1.24 | p = 0.651 | |
| Modality_snack | – as above – | 1.57 | 0.496 | 1.55 | 1.70 | p = 0.082 | |
| Modality_dessert | – as above – | 1.30 | 0.459 | 1.34 | 1.16 | p = 0.036 | |
| Season_spring_summer | – as above – | 1.08 | 0.278 | 1.08 | 1.11 | p = 0.601 | |
| Season_autumn_winter | – as above – | 1.58 | 0.494 | 1.56 | 1.68 | p = 0.213 | |
| Season_no preference | – as above – | 1.40 | 0.490 | 1.42 | 1.27 | p = 0.083 | |
| During_week | – as above – | 1.60 | 0.490 | 1.60 | 1.59 | p = 0.962 | |
| During_weekend | – as above – | 1.41 | 0.493 | 1.45 | 1.22 | p = 0.008 | |
| Before_Consuming_wash | – as above – | 1.85 | 0.354 | 1.83 | 1.97 | p = 0.025 | |
| Before_Consuming_peel | – as above – | 1.63 | 0.484 | 1.62 | 1.67 | p = 0.599 | |
| Before_Consuming_cut | – as above – | 1.82 | 0.381 | 1.81 | 1.89 | p = 0.279 | |
| Processing and cooking | Recently_baked_applecake | – as above – | 1.53 | 0.500 | 1.52 | 1.54 | p = 0.841 |
| Cooking_frequency | 1 = below once a month, 2 = monthly, 3 = weekly, 4 = daily, 0 = never | 1.66 | 1.151 | 1.76 | 1.27 | p = 0.019 | |
| Baking_frequency | – as above – | 1.56 | 1.069 | 1.58 | 1.54 | p = 0.044 | |
| Making_juice_frequency | – as above – | 0.43 | 0.805 | 0.48 | 0.24 | p = 0.104 | |
| Drying_frequency | – as above – | 0.31 | 0.687 | 0.32 | 0.30 | p = 0.883 | |
| Apples_used | 1 = overripe apples, 2 = apples specifically for this use, 3 = self-grown apples, 4 = others | 1.75 | 0.975 | 1.74 | 1.83 | p = 0.673 | |
| Existence_of_dedicated_variety | 1 = no, 2 = yes | 1.34 | 0.473 | 1.33 | 1.40 | p = 0.412 | |
| Health aspects and image | Reason_pleasure | – as above – | 1.67 | 0.472 | 1.70 | 1.54 | p = 0.066 |
| Reason_hunger | – as above – | 1.10 | 0.298 | 1.09 | 1.14 | p = 0.442 | |
| Reason_health | – as above – | 1.42 | 0.494 | 1.44 | 1.32 | p = 0.191 | |
| Reason_convenience | – as above – | 1.06 | 0.239 | 1.05 | 1.11 | p = 0.204 | |
| Healthiest_fruit_banana | – as above – | 1.08 | 0.278 | 1.09 | 1.08 | p = 0.905 | |
| Healthiest_fruit_lemon | – as above – | 1.08 | 0.278 | 1.07 | 1.16 | p = 0.070 | |
| Healthiest_fruit_orange | – as above – | 1.21 | 0.412 | 1.21 | 1.24 | p = 0.651 | |
| Healthiest_fruit_blueberry | – as above – | 1.16 | 0.371 | 1.16 | 1.19 | p = 0.698 | |
| Healthiest_fruit_currant | – as above – | 1.20 | 0.398 | 1.19 | 1.24 | p = 0.482 | |
| Healthiest_fruit_apple | – as above – | 1.54 | 0.499 | 1.59 | 1.38 | p = 0.020 | |
| Healthiest_fruit_kiwi | – as above – | 1.20 | 0.402 | 1.19 | 1.30 | p = 0.130 | |
| Main_quality_vitamins | – as above – | 1.67 | 0.470 | 1.69 | 1.65 | p = 0.660 | |
| Main_quality_anticancer | – as above – | 1.10 | 0.298 | 1.10 | 1.08 | p = 0.741 | |
| Main_quality_minerals | – as above – | 1.13 | 0.333 | 1.12 | 1.16 | p = 0.512 | |
| Main_quality_antioxidants | – as above – | 1.17 | 0.379 | 1.16 | 1.24 | p = 0.209 | |
| Main_quality_low_fat | – as above – | 1.16 | 0.366 | 1.15 | 1.22 | p = 0.333 | |
| Healthier_green | 1 = strongly disagree, 2 = somewhat disagree, 3 = neutral, 4 = somewhat agree, 5 = strongly agree | 2.37 | 1.052 | 2.36 | 2.42 | p = 0.770 | |
| Healthier_sour | – as above – | 2.55 | 1.056 | 2.53 | 2.67 | p = 0.475 | |
| Healthier_organic | – as above – | 3.70 | 1.270 | 3.72 | 3.67 | p = 0.828 | |
| Healthier_local | – as above – | 4.07 | 1.055 | 4.14 | 3.80 | p = 0.083 | |
| Healthier_unpeeled | – as above – | 3.98 | 1.222 | 4.01 | 3.89 | p = 0.586 | |
| Healthier_washed | – as above – | 4.17 | 1.172 | 4.18 | 4.16 | p = 0.922 | |
| Test_apple_variety | 1=correct, 2=incorrect | 1.20 | 0.398 | 1.20 | 1.19 | p = 0.869 | |
| Test_colour_Granny Smith | – as above – | 1.16 | 0.366 | 1.17 | 1.11 | p = 0.384 | |
| Test_club_variety | – as above – | 1.59 | 0.492 | 1.59 | 1.57 | p = 0.788 | |
| Test_Fuji_taste | – as above – | 1.65 | 0.479 | 1.62 | 1.73 | p = 0.215 | |
| Test_apple_contents | – as above – | 1.65 | 0.478 | 1.66 | 1.62 | p = 0.686 | |
| Socio-demographic information | Gender | 1 = male, 2 = female | 1.69 | 0.465 | 1.70 | 1.62 | p = 0.389 |
| Language | 1 = German, 2 = Italian | 1.26 | 0.483 | 1.27 | 1.26 | p = 0.964 | |
| Age | Mean | 54.5 | 15.53 | 54.6 | 55.1 | p = 0.862 | |
| Household_members | Mean | 2.79 | 1.231 | 2.84 | 2.62 | p = 0.344 | |
| Net_monthly_income | 1 = below €1000, 2 = €1000–2000, 3 = €2001–3000, 4 = €3001–4000, 5 = above €4000 | 3.02 | 1.117 | 3.07 | 2.82 | p = 0.250 | |
| Education | 1 = primary and middle school, 2 = high school, 3 = university | 1.89 | 1.244 | 1.88 | 1.95 | p = 0.624 | |
| Area_residence_size | 1 = below 20,000 inhabitants, 2 = above 20,000 inhabitants | 1.35 | 0.478 | 1.34 | 1.43 | p = 0.267 | |
| Area_residence_altitude | 1 = below 1000 m a.s.l., 2 = above 1000 m a.s.l. | 1.30 | 0.461 | 1.33 | 1.19 | p = 0.094 | |
| Involved_apple_production | 1 = no, 2 = yes | 1.09 | 0.290 | 1.10 | 1.05 | p = 0.364 |
Entries in bold indicate statistically significant sub-sample differences at a confidence level of at least 90%. One-way ANOVA test was performed to identify differences between constant and declining consumers.
References
- Mditshwa, A.; Fawole, O.; Opara, U.L. Recent Developments on Dynamic Controlled Atmosphere Storage of Apples–A Review. Food Packag. Shelf Life 2018, 16, 59–68. [Google Scholar] [CrossRef]
- Fischer, C.; Bossi Fedrigotti, V. ‘An Apple A Day’… Is Going Away. What Can We Do to Stop the Decline in Per Capita Apple Consumption? Am. J. Biomed. Sci. Res. 2020, 10, 226–227. [Google Scholar]
- Bondonno, N.P.; Bondonno, C.P.; Ward, N.C.; Hodgson, J.M.; Croft, K.D. The Cardiovascular Health Benefits of Apples: Whole Fruit vs. Isolated Compounds. Trends Food Sci. Technol. 2017, 69, 243–256. [Google Scholar] [CrossRef]
- Hyson, D.A. A Comprehensive Review of Apples and Apple Components and Their Relationship to Human Health. Adv. Nutr. 2011, 2, 408–420. [Google Scholar] [CrossRef] [PubMed]
- Jack, F.R.; O’Neill, J.; Piacentini, M.G.; Schröder, M.J.A. Perception of Fruit as a Snack: A Comparison with Manufactured Snack Foods. Food Qual. Prefer. 1997, 8, 175–182. [Google Scholar] [CrossRef]
- Bossi Fedrigotti, V.; Fischer, C. Ein Apfel am Tag? Obstbau Weinbau Fachmag. Berat. 2018, 55, 9–13. [Google Scholar]
- FAO (Food and Agriculture Organization of the United Nations). Food Balance Sheets: A Handbook; FAO: Rome, Italy, 2001. [Google Scholar]
- Konopacka, D.; Jesionkowska, K.; Kruczyńska, D.; Stehr, R.; Schoorl, F.; Buehler, A.; Egger, S.; Codarin, S.; Hilaire, C.; Höller, I.; et al. Apple and Peach Consumption Habits Across European Countries. Appetite 2010, 55, 478–483. [Google Scholar] [CrossRef] [PubMed]
- Tugault-Lafleur, C.N.; Black, J.L. Differences in the Quantity and Types of Foods and Beverages Consumed by Canadians between 2004 and 2015. Nutrients 2019, 11, 526. [Google Scholar] [CrossRef]
- Lin, B.; Mentzer Morrison, R. A Closer Look at Declining Fruit and Vegetable Consumption Using Linked Data Sources. Amber Waves Feature: Food Choices and Health. United States Department of Agriculture Economic Research Service. Available online: https://www.ers.usda.gov/amber-waves/2016/july/a-closer-look-at-declining-fruit-and-vegetable-consumption-using-linked-data-sources/ (accessed on 22 July 2020).
- Aebischer, C. Cost a Key Factor in Falling Japan Consumption. Available online: http://www.fruitnet.com/asiafruit/article/174931/why-japan-wont-eat-more-fruit/ (accessed on 12 May 2020).
- Nancarrow, T. Could Australia’s First Red Flesh Apples Turn Around Decline in Apple Consumption? ABC Rural. Available online: https://www.abc.net.au/news/rural/2018-04-11/industry-pushes-red-fleshed-apple-to-revive-consumption-woes/9641050/ (accessed on 20 May 2020).
- Ceschi, S.; Canavari, M.; Castellini, A. Consumer’s Preference and Willingness to Pay for Apple Attributes: A Choice Experiment in Large Retail Outlets in Bologna (Italy). J. Int. Food Agribus. Mark. 2017, 1–18. [Google Scholar] [CrossRef]
- Fotopoulos, C.; Krystallis, A. Quality Labels as a Marketing Advantage. The Case of the “PDO Zagora” Apples in the Greek Market. Eur. J. Mark. 2001, 37, 1352–1374. [Google Scholar]
- Skreli, E.; Imami, D. Analyzing Consumers’ Preferences for Apple Attributes in Tirana, Albania. Int. Food Agribus. Manag. Rev. 2012, 15, 137–156. [Google Scholar]
- Moser, R.; Raffaelli, R. Consumer Preferences for Sustainable Production Methods in Apple Purchasing Behaviour: A Non-Hypothetical Choice Experiment. Int. J. Consum. Stud. 2012, 36, 141–148. [Google Scholar] [CrossRef]
- Denver, S.; Jensen, J.D. Consumer Preferences for Organically and Locally Produced Apples. Food Qual. Prefer. 2014, 31, 129–134. [Google Scholar] [CrossRef]
- Jensen, J.; Mørkbak, M.R. Role of Gastronomic, Externality and Feasibility Attributes in Consumer Demand for Organic and Local Foods: The Case of Honey and Apples. Int. J. Consum. Stud. 2013, 37, 634–641. [Google Scholar] [CrossRef]
- Thybo, A.K.; Kühn, B.F.; Martens, H. Explaining Danish Children’s Preferences for Apples Using Instrumental, Sensory and Demographic/Behavioural Data. Food Qual. Prefer. 2004, 15, 53–63. [Google Scholar] [CrossRef]
- Péneau, S.; Hoehn, E.; Roth, H.; Escher, F.; Nuessli, J. Importance and Consumer Perception of Freshness of Apples. Food Qual. Prefer. 2006, 17, 9–19. [Google Scholar] [CrossRef]
- Racskó, J.; Miller, D.D.; Duarte, E.E.; Szukics, J.; Szabó, Z.; Soltész, M.; Nyéki, J. Is Consumer Preference for Apple Driven Only by Fruit Quality? Acta Hortic. 2009, 831, 331–338. [Google Scholar] [CrossRef]
- Novotorova, N.K.; Mazzocco, M.A. Consumer Preferences and Trade-Offs for Locally Grown and Genetically Modified Apples: A Conjoint Analysis Approach. Int. Food Agribus. Manag. Rev. 2008, 11, 31–53. [Google Scholar]
- Galmarini, M.V.; Symoneaux, R.; Chollet, S.; Zamora, M.C. Understanding Apple Consumers’ Expectations in Terms of Likes and Dislikes. Use of Comment Analysis in a Cross-Cultural Study. Appetite 2013, 62, 27–36. [Google Scholar] [CrossRef]
- Moor, U.; Moor, A.; Põldma, P.; Heinmaa, L. Consumer Preferences of Apples in Estonia and Changes in Attitudes Over Five Years. Agric. Food Sci. 2014, 23, 135–145. [Google Scholar] [CrossRef]
- Van der Merwe, A.; Muller, M.; van der Rijst, M.; Labuschagné, I.F.; Næs, T.; Steyn, W.J. Impact of Appearance on Degree of Liking and Eating Quality Expectations of Selected Apple Cultivars. Int J Food Sci Technol. 2015, 50, 492–499. [Google Scholar] [CrossRef]
- De Hooge, I.E.; Oostindjer, M.; Aschemann-Witzel, J.; Normann, A.; Loose, S.M.; Almli, V.L. This Apple is Too Ugly for Me! Consumer Preferences for Suboptimal Food Products in the Supermarket and at Home. Food Qual. Prefer. 2017, 56, 80–92. [Google Scholar] [CrossRef]
- Patterson, P.M.; Richards, T.J. Newspaper Advertisement Characteristics and Consumer Preferences for Apples: A Mimic Model Approach. Agribusiness 2000, 16, 159–177. [Google Scholar] [CrossRef]
- Endrizzi, I.; Torri, L.; Corollaro, M.L.; Demattè, M.L.; Aprea, E.; Charles, M.; Biasioli, F.; Gasperi, F. A Conjoint Study on Apple Acceptability: Sensory Characteristics and Nutritional Information. Food Qual. Prefer. 2015, 40, 39–48. [Google Scholar] [CrossRef]
- Schechter, L. The Apple and Your Eye: Visual and Taste Rank-Ordered Probit Analysis with Correlated Errors. Food Qual. Prefer. 2010, 21, 112–120. [Google Scholar] [CrossRef]
- Harker, F.R.; Kupferman, E.M.; Marin, A.B.; Gunson, F.A.; Triggs, C.M. Eating Quality Standards for Apples Based on Consumer Preferences. Postharvest Biol. Technol. 2008, 50, 70–78. [Google Scholar] [CrossRef]
- Dan, C.; Serban, C.; Sestras, A.F.; Militaru, M.; Morariu, P.; Sestras, R.E. Consumer Perception Concerning Apple Fruit Quality, Depending on Cultivars and Hedonic Scale of Evaluation–A Case Study. Not. Sci. Biol. 2015, 7, 140–149. [Google Scholar] [CrossRef]
- Bonany, J.; Buehler, A.; Carbó, J.; Codarin, S.; Donati, F.; Echeverria, G.; Egger, S.; Guerra, W.; Hilaire, C.; Höller, I.; et al. Consumer Eating Quality Acceptance of New Apple Varieties in Different European Countries. Food Qual. Prefer. 2013, 30, 250–259. [Google Scholar] [CrossRef]
- Symoneaux, R.; Galmarini, M.V.; Mehinagic, E. Comment Analysis of Consumer’s Likes and Dislikes as an Alternative Tool to Preference Mapping. A Case Study on Apples. Food Qual. Prefer. 2012, 24, 59–66. [Google Scholar] [CrossRef]
- Cliff, M.; Sanford, K.; Wismer, W.; Hampson, C. Use of Digital Images for Evaluation of Factors Responsible for Visual Preference of Apples by Consumers. Hort. Sci. 2002, 37, 1127–1131. [Google Scholar] [CrossRef]
- Schenk, M.F.; van der Maas, M.P.; Smulders, M.J.M.; Gilissen, L.J.W.J.; Fischer, A.R.H.; van der Lans, I.A.; Jacobsen, E.; Frewer, L.J. Consumer Attitudes Towards Hypoallergenic Apples That Alleviate Mild Apple Allergy. Food Qual. Prefer. 2011, 22, 83–91. [Google Scholar] [CrossRef]
- Provincia Autonoma di Bolzano. Relazione Agraria e Forestale 2019. Available online: http://www.provinz.bz.it/agricoltura/flip/raf2019/ (accessed on 12 August 2020).
- BLS Südtirol South Tyrol. Food Technology. Available online: http://neu.bls.info/upload/file/BLS_food_technology_brochure.pdf (accessed on 10 August 2020).
- ASTAT L’Alto Adige in Cifre-2017. Available online: https://astat.provincia.bz.it/downloads/Siz_2017(11).pdf (accessed on 10 November 2019).
- IRE L’export Come Fattore di Successo nell’Euregio Tirolo-Alto Adige-Trentino. Available online: https://issuu.com/wifobz/docs/2015_export_erfolgsfaktor_it?e=37359578/70065632 (accessed on 10 July 2020).
- Bytyqi, N.; Skreli, E.; Verçuni, A.; Imami, D.; Zhllima, E. Analyzing Consumers’ Preferences for Apples in Pristina, Kosovo. Bodenkultur 2015, 66, 61–69. [Google Scholar]
- Buis, M. Stata Tip 87: Interpretation of Interactions in Nonlinear Models. Stata J. 2010, 10, 305–308. [Google Scholar] [CrossRef]
- ASTAT Serie Storica Sull’agricoltura 1929–2016. Available online: https://astat.provincia.bz.it/it/news-pubblicazioni-info.asp?news_action=4&news_article_id=617593 (accessed on 22 July 2020).
- Mascarello, G.; Pinto, A.; Parise, N.; Crovato, S.; Ravarotto, L. The Perception of Food Quality. Profiling Italian Consumers. Appetite 2015, 89, 175–182. [Google Scholar] [CrossRef]
- Fillion, L.; Kilcast, D. Consumer Perception of Crispness and Crunchiness in Fruits and Vegetables. Food Qual. Prefer. 2002, 13, 23–29. [Google Scholar] [CrossRef]
- Tunick, M.H.; Onwulata, C.I.; Thomas, A.E.; Phillips, J.G.; Mukhopadhyay, S.; Sheen, S.; Liu, C.-K.; Latona, N.; Pimentel, M.R.; Cooke, P.H. Critical Evaluation of Crispy and Crunchy Textures: A Review. Int. J. Food Prop. 2013, 16, 949–963. [Google Scholar] [CrossRef]
- Femenia, F. A Meta-Analysis of the Price and Income Elasticities of Food Demand. HAL Id: Hal-02103880. Available online: https://hal.archives-ouvertes.fr/hal-02103880 (accessed on 20 August 2020).
- Durham, C.; Eales, J. Demand Elasticities for Fresh Fruit at the Retail Level. Appl. Econ. 2010, 42, 1345–1354. [Google Scholar] [CrossRef]
- Durham, C.; Eales, J. Demand Elasticities for Fresh Fruit at the Retail Level. In Proceedings of the Presented at the American Agricultural Economics Association Annual Meeting, Long Beach, CA, USA, 23–26 July 2006. [Google Scholar]
- Savazzini, F.; Ricci, G.; Tartarini, S. Apple Allergens Genomics and Biotechnology: Unravelling the Determinants of Apple Allergenicity; Applied Plant Genomics and Biotechnology; Poltronieri, P., Hong, Y., Eds.; Woodhead Publishing: Sawston, Cambridge, UK, 2015; pp. 35–54. [Google Scholar]

Publisher’s Note: MDPI stays neutral with regard to jurisdictional claims in published maps and institutional affiliations. |
© 2020 by the authors. Licensee MDPI, Basel, Switzerland. This article is an open access article distributed under the terms and conditions of the Creative Commons Attribution (CC BY) license (http://creativecommons.org/licenses/by/4.0/).