Article

The Effect of Environment and Nutrients on Hydroponic Lettuce Yield, Quality, and Phytonutrients

by
William L. Sublett
1,
T. Casey Barickman
1,* and
Carl E. Sams
2
1
North Mississippi Research and Extension Center, Department of Plant and Soil Sciences, Mississippi State University, Verona, MS 38879, USA
2
Department of Plant Sciences, The University of Tennessee, Knoxville, TN 37996, USA
*
Author to whom correspondence should be addressed.
Horticulturae 2018, 4(4), 48; https://doi.org/10.3390/horticulturae4040048
Submission received: 3 October 2018 / Revised: 12 November 2018 / Accepted: 20 November 2018 / Published: 28 November 2018
(This article belongs to the Special Issue Abiotic Stress Effects on Performance of Horticultural Crops)

Abstract

:
A study was conducted with green and red-leaf lettuce cultivars grown in a deep-water culture production system. Plants were seeded in rockwool and germinated under greenhouse conditions at 25/20 °C (day/night) for 21 days before transplanting. The experimental design was a randomized complete block with a 2 × 3 factorial arrangement of cultivar and nutrient treatments that consisted of six replications. Treatments consisted of two lettuce genotypes, (1) green (Winter Density) and (2) red (Rhazes), and three nutrient treatments containing electroconductivity (EC) levels of (1) 1.0; (2) 2.0; and (3) 4.0 mS·cm−1. After 50 days, plants were harvested, processed, and analyzed to determine marketable yield, biomass, plant height, stem diameter, phenolics, and elemental nutrient concentrations. An interaction between growing season and lettuce cultivar was the predominant factor influencing yield, biomass, and quality. Nutrient solution EC treatment significantly affected biomass and water content. EC treatments significantly impacted concentrations of 3-O-glucoside and uptake of phosphorous, potassium, iron, boron, zinc, and molybdenum. Effects of growing season and cultivar on leafy lettuce yield and quality were more pronounced than the effect of nutrient solution EC treatment. Thus, greenhouse production of green and red-leaf lettuce cultivars in the south-eastern United States should be conducted in the spring and fall growing seasons with elevated nutrient solution EC of ≈4.0 mS·cm−1 to maximize yield and quality.

1. Introduction

In the United States, lettuce is a valuable vegetable crop and a staple food in the diet. Lettuce contributes a notable amount of polyphenolic compounds, vitamins A, C, and E, calcium, and iron [1]. Due to its raw consumption in relatively large quantities, it provides an important source of dietary antioxidants and possesses high radical scavenging activity, which is often credited with aiding in the prevention of many chronic illnesses such as cancer and cardiovascular disease [2,3]. Lettuce is a cool-season vegetable, which thrives in temperatures ranging from 7 to 24 °C. In the southern United States, field production typically occurs in the fall and winter months, allowing growers to take advantage of shorter days and cooler temperatures. However, the increasing consumer demand for high quality, locally sourced produce and off-season availability has fueled the expansion of greenhouse production over the past decade [4]. Due to the increased ability to precisely control the greenhouse environment and maintain year-round production, lettuce yield and quality is greater, compared to open field production per unit of space [5]. The high cost of greenhouse production leaves little room for error and must be offset by high gross returns.
Southern United States greenhouse growers have production advantages during the cool seasons, such as milder temperature, greater light intensity, and reduced energy costs. Lettuce production during late spring and summer often negatively affects yield and quality and threatens economic returns [6]. In the south-east United States, adverse temperatures and long days largely limit warm season production of lettuce. Consistent exposure to these supra-optimal conditions decreases lettuce quality. For example, lettuce subjected to 13 h of daylight and temperatures above 24 °C resulted in premature inflorescence initiation, otherwise known as bolting [7]. Crisphead lettuce subjected to heat stress for a 3 or 5 day period, two weeks after heading resulted in 46% of mature lettuce heads with rib discoloration [8]. Additionally, genotype determines the susceptibility of lettuce to tipburn, but the incidence is heavily influenced by environment. An analysis of 125 harvests of butterhead lettuce over a 3-year period found that high light intensity, fresh head mass, and elevated temperature were the predominant variables positively correlated with tipburn incidence [9].
In closed greenhouse hydroponic cultivation systems, fertilizers are dissolved in water, and the total amount of solutes in the solution are referred to as the electrical conductivity (EC). Numerous studies have examined the effect of differing EC levels on lettuce production. Previous research has indicated that increasing EC levels resulted in a reduction of lettuce yield and leaf nitrate in a floating system but increased total phenolic compounds and antioxidant activity [10]. Additionally, Scuderi et al. [11] found that increasing solution EC decreased lettuce yield and resulted in reduced leaf nitrate content. Conversely, three lettuce varieties subjected to increasing EC treatments also resulted in reduced total yield but showed no significant effect on leaf nitrate content. Moreover, increasing EC levels resulted in notable increases in leaf phosphorous (P), zinc (Zn), manganese (Mn), and iron (Fe) concentrations in greenhouse lettuce [12]. While lettuce is considered mildly sensitive to high EC levels, research indicates that moderate EC is associated with the biosynthesis of secondary metabolites, such as phenolic compounds [13]. Furthermore, red-leafed lettuce varieties are characterized by higher phenolic content than green-leafed varieties. Kim et al. [14] reported that phenolic content and antioxidants increased in romaine lettuce produced with long-term irrigation and relatively low EC concentration. However, green and red-leafed baby lettuce grown with increasing EC levels contained greater amounts of flavonoids, phenolic acids, and carotenoids in both varieties [15].
Information is lacking and inconclusive regarding the effects of environmental stress on greenhouse lettuce by altering the EC of the plant nutrient solution. However, Fallovo et al. [16] investigated the effect of macro and micronutrient proportions on lettuce yield and quality of ‘Green Salad Bowl’ during spring and summer production seasons. The results indicated that marketable yield, leaf area index, and shoot biomass were unaffected by the nutrient solution, and growing season played the most determinant role in plant yield and quality. A high amount of calcium (Ca) did result in increased quality parameters, such as chlorophyll, glucose, fructose, and leaf Ca concentrations. Moreover, green oakleaf lettuce produced during winter and summer seasons and grown in increasing EC concentrations reached maturity more quickly during summer, and yield was unaffected regardless of nutrient solution concentration [16]. More information is needed to determine the relationship between nutrient solution EC concentrations and growing season on lettuce yield and nutritional quality. Therefore, the purpose of this study was to determine the effect of increased nutrient solution EC and growing season on lettuce plant height and stem diameter, biomass accumulation, mineral nutrient uptake, yield, and polyphenolic content of green and red-leafed lettuce cultivars.

2. Materials and Methods

2.1. Plant Culture and Harvest

Three separate studies were conducted in the spring, summer, and fall of 2016 and 2017 to examine the effects of season and nutrient solution concentrations on green and red leaf lettuce growth, minerals nutrients, and secondary metabolites. Seeds of green-leaf, ‘Winter Density’ lettuce, and red-leaf, ‘Rhazes’ lettuce, (Johnny’s Selected Seed, Waterville, ME, USA) were sown into rockwool (3.81 cm × 3.81 cm; Hummert Int., Earth City, MO, USA) and germinated in greenhouse conditions (Verona, MS, USA; 34° N, 89° W) at 25/20 °C (day/night). The natural photoperiod and light intensity were not enhanced with any supplemental lighting. Daily light intensity readings of photosynthetic active radiation (PAR) were taken using the WatchDog 1000 Series plant growth micro station (Spectrum Technologies, Aurora, IL, USA), while temperature and relative humidity were monitored with a WatchDog A-Series data logger (Spectrum Technologies, Aurora, IL, USA). After 21 days (third leaf stage), three plantlets from each cultivar were transferred into a closed hydroponic system composed of 36, 11-L Rubbermaid© Roughneck plastic storage containers (Rubbermaid, Atlanta, GA, USA). Each tub was filled with 10-L of nutrient solution using a modified Hoagland formulation [17]. Elemental concentrations of modified half-strength nutrient solution consisted of (mg·L−1): N (105), P (91.5), K (117.3), Ca (80.2), Mg (24.6), S (32.0), Fe (1.0), B (0.25), Mo (0.005), Cu (0.01), Mn (0.25), and Zn (0.025). The experimental design was a randomized complete block in a 2 × 3 factorial arrangement of cultivar and EC treatments that consisted of six replications, with individual tubs representing an experimental unit. Treatments consisted of two lettuce genotypes, (1) green (Winter Density) and (2) red (Rhazes), and three nutrient treatments containing EC levels of (1) 1.0 mS·cm−1; (2) 2.0 mS·cm−1; and (3) 4.0 mS·cm−1. Electroconductivity readings were measured weekly with a portable pH/Conductivity meter (Accumet© AP85; Fisher Scientific, Hampton, NH, USA), and growth solutions were changed every two weeks. Water was added to the containers to maintain a 10 L level of nutrient solution to keep up with the transpiration losses by the lettuce plants. After 50 days, lettuce plants were harvested by replication and treatment. Plants were separated into roots and shoots, and the fresh weights and stem diameter were recorded. A 20–30 g subsample of leaf tissue from three lettuce plants per treatment was retained to be freeze-dried (Labconco Corp., Kansas City, MO, USA). The subsamples were taken from the first fully expanded leaf of the lettuce plants. Freeze dried leaf tissue was then ground by mortar and pedestal, placed in an ultra-low freezer (−80 °C) until further analyzed for nutritional quality. The remaining plant material and roots were dried in a forced-air oven at 80 °C then weighed again to determine plant biomass production. All subsamples for chemical analysis were taken from each cultivar and treatment (n = 3) from each of the six replications.

2.2. Flavonoid Analysis

Flavonoid analysis was conducted according to Neugart et al. [18] and modified for the analysis of lettuce by Becker et al. [19]. Freeze-dried lettuce leaf samples were ground using a mortar and pestle for homogenous sub-samples. A 0.04 g sub-sample was extracted in a 2 mL microcentrifuge tube by adding 1.0 mL of extraction solvent (60:37:3) consisting of methanol, de-ionized water, and formic acid. The samples were then vortexed for 1 min and centrifuged at 12,000 rpm for 15 min. After centrifugation, the samples were filtered through a 0.45 µm polytetrafluoroethylene (PTFE) syringe filter and collected in a 2-mL high-performance liquid chromatography (HPLC) vial for analysis. Separation parameters and flavonoid quantification were carried out with authentic standards using an Agilent 1260 series HPLC with a multiple wavelength detector (Agilent Technologies, Willington, DE, USA). Chromatographic separations were achieved using a 150 × 4.6 mm i.d., 2.6 µm analytical scale Kinetex F5 reverse-phase column (Phenomenex, Torrance, CA, USA), which allows for effective separation of chemically similar flavonoid compounds. The column was equipped with a Kinetex F5 12.5 × 4.6 mm i.d. guard cartridge and holder (Phenomenex), and it was maintained at 30 °C using a thermostat column compartment. All separations were achieved using mobile gradient phase of reverse osmosis (RO) water adjusted to pH 2.5 with trifluoroacetic acid and acetonitrile. Anthocyanin analysis was similar to the flavonoid determination procedure with slight modifications. Briefly, 0.04 g of red lettuce sub-samples were extracted in a 2 mL microcentrifuge tube by adding 1.0 mL of extraction solvent (50:40:10) consisting of water, methanol, and acetic acid. The samples were then vortexed for 1 min and centrifuged at 12,000 rpm for 15 min. After centrifugation, the samples were filtered through a 0.45 µm PTFE syringe filter and collected in a 2 mL HPLC vial for analysis.

2.3. Mineral Composition

Nutrient analysis was conducted according to Barickman et al. [20] with slight modifications. Briefly, a 0.5 g subsample of dried leaf tissue was combined with 10-mL of 70% HNO3, was digested in a microwave digestion unit (Model: Ethos, Milestone Inc., Shelton, CT, USA). Leaves were collected and dried for 48 h in a forced air oven (model large; Fisher Scientific, Atlanta, GA, USA) at 65 °C. Dried samples were ground to homogeneity using liquid nitrogen, and a 0.5 g sub-sample was weighed for analysis. Nutrient analysis was conducted using an inductively coupled plasma mass spectrometer (ICP-MS; Agilent Technologies, Inc., Wilmington, DE, USA). The ICP-MS system was equipped with an octopole collision/reaction cell, Agilent 7500 ICP-MS ChemStation software, a Micromist nebulizer, a water-cooled quartz spray chamber, and a CETAC (ASX-510, CETAC Inc., Omaha, NE, USA) auto-sampler. The instrument was optimized daily in terms of sensitivity (lithium: Li, yttrium: Y, thallium: Tl), level of oxide, and doubly charged ion using a tuning solution containing 10 µg∙L−1 of Li, Y, Tl, cerium (Ce), and cobalt (Co) in a 2% HNO3/0.5% HCl (v/v) matrix. Tissue nutrient concentrations are expressed on a dry weight (DW) basis.

2.4. Statistical Analysis

Data were subjected to the GLIMMIXED procedure and mean separation using Tukey’s Honest Significant Difference test (P ≤ 0.05) with SAS statistical software (Version 9.4; SAS Institute, Cary, NC, USA).

3. Results

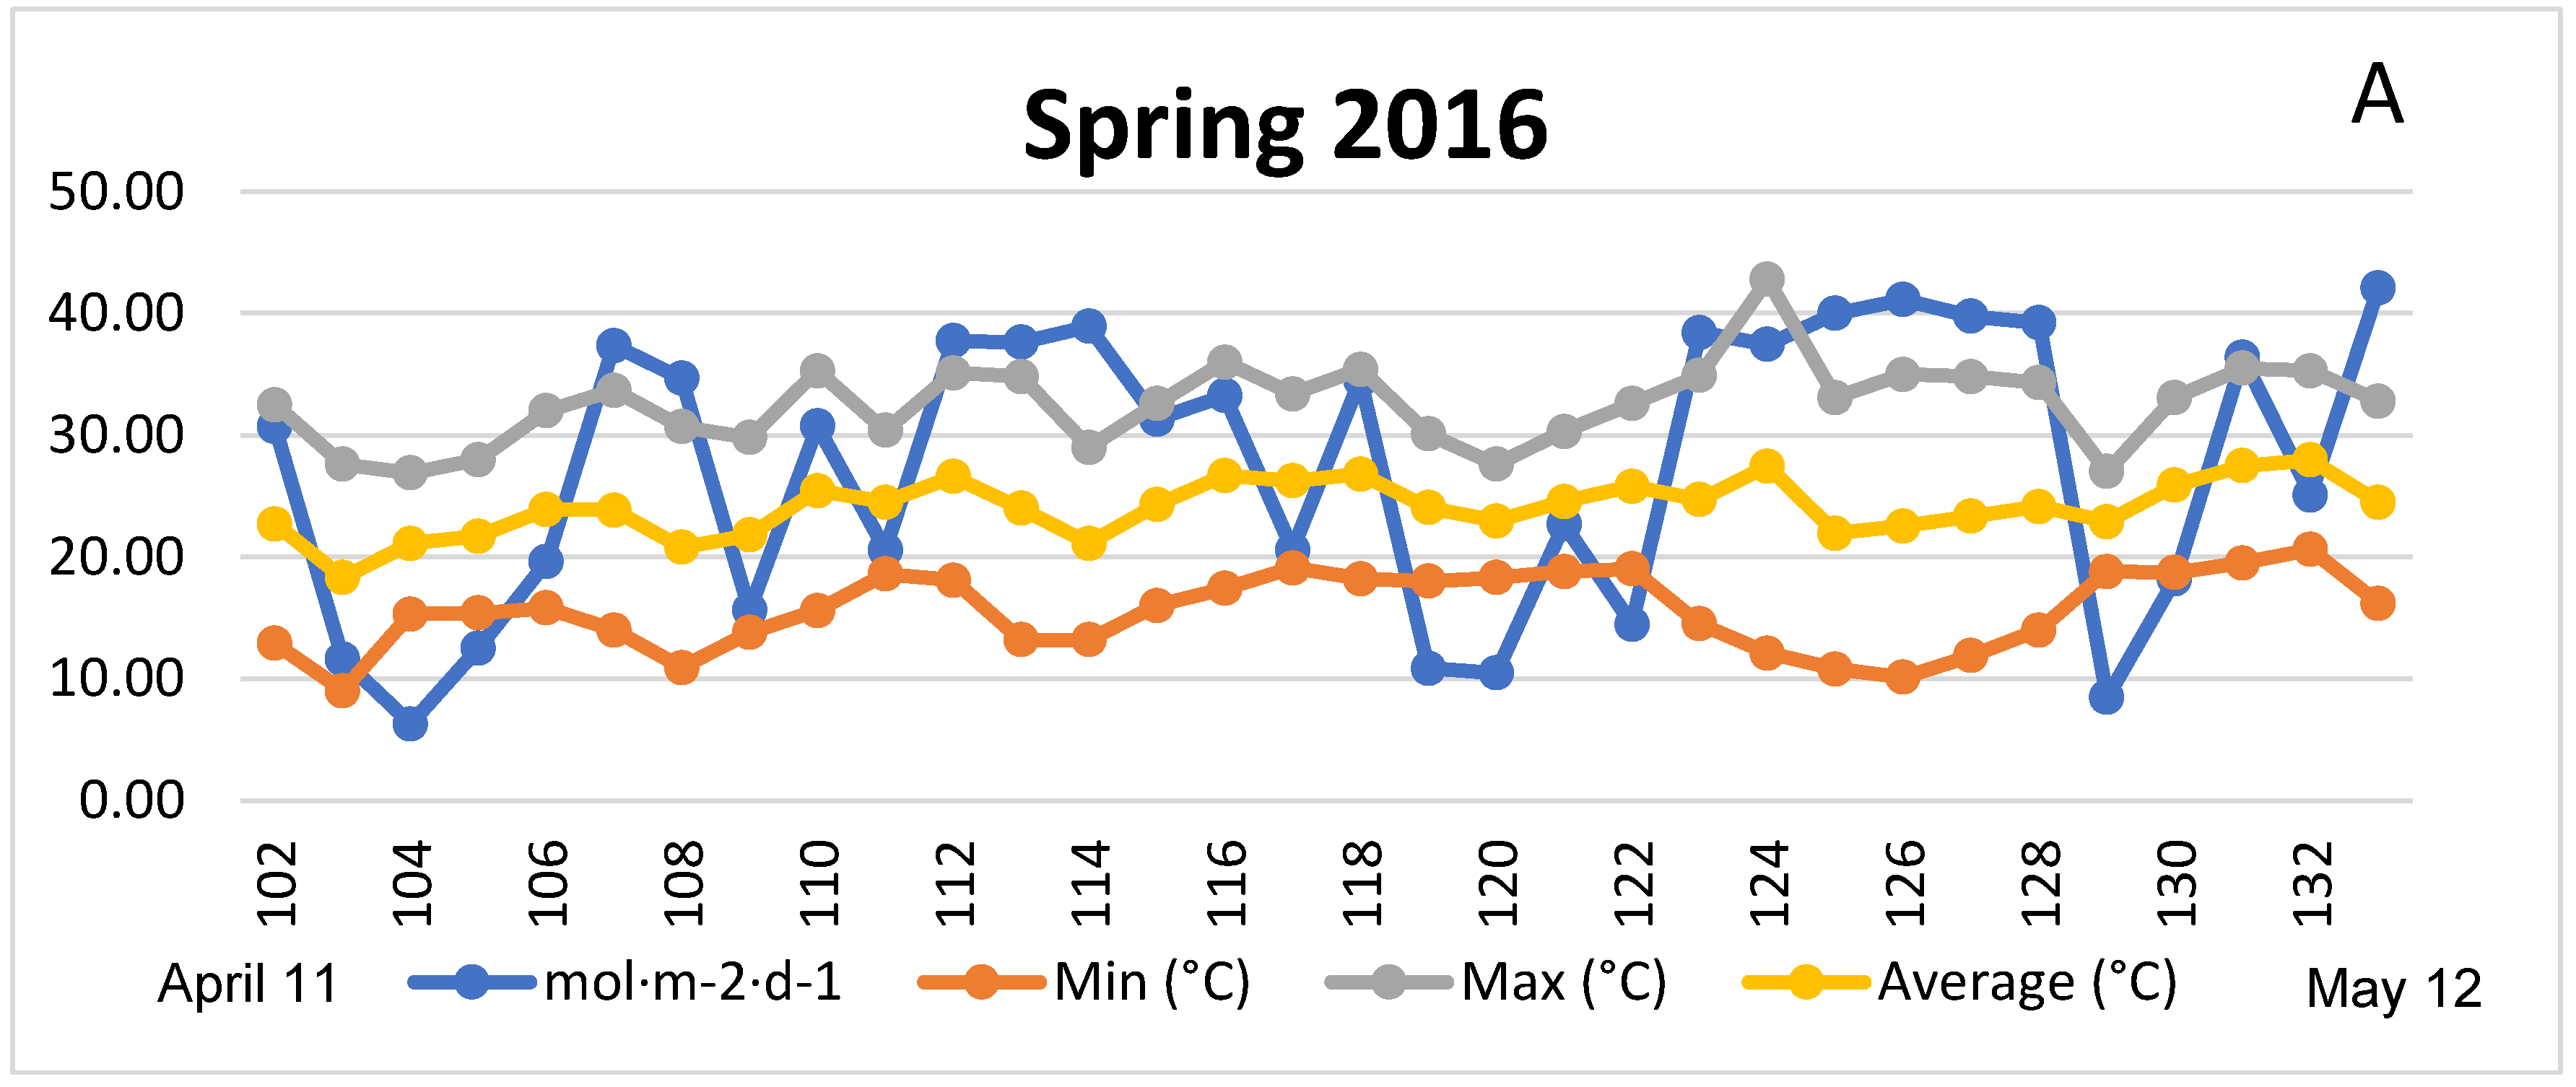
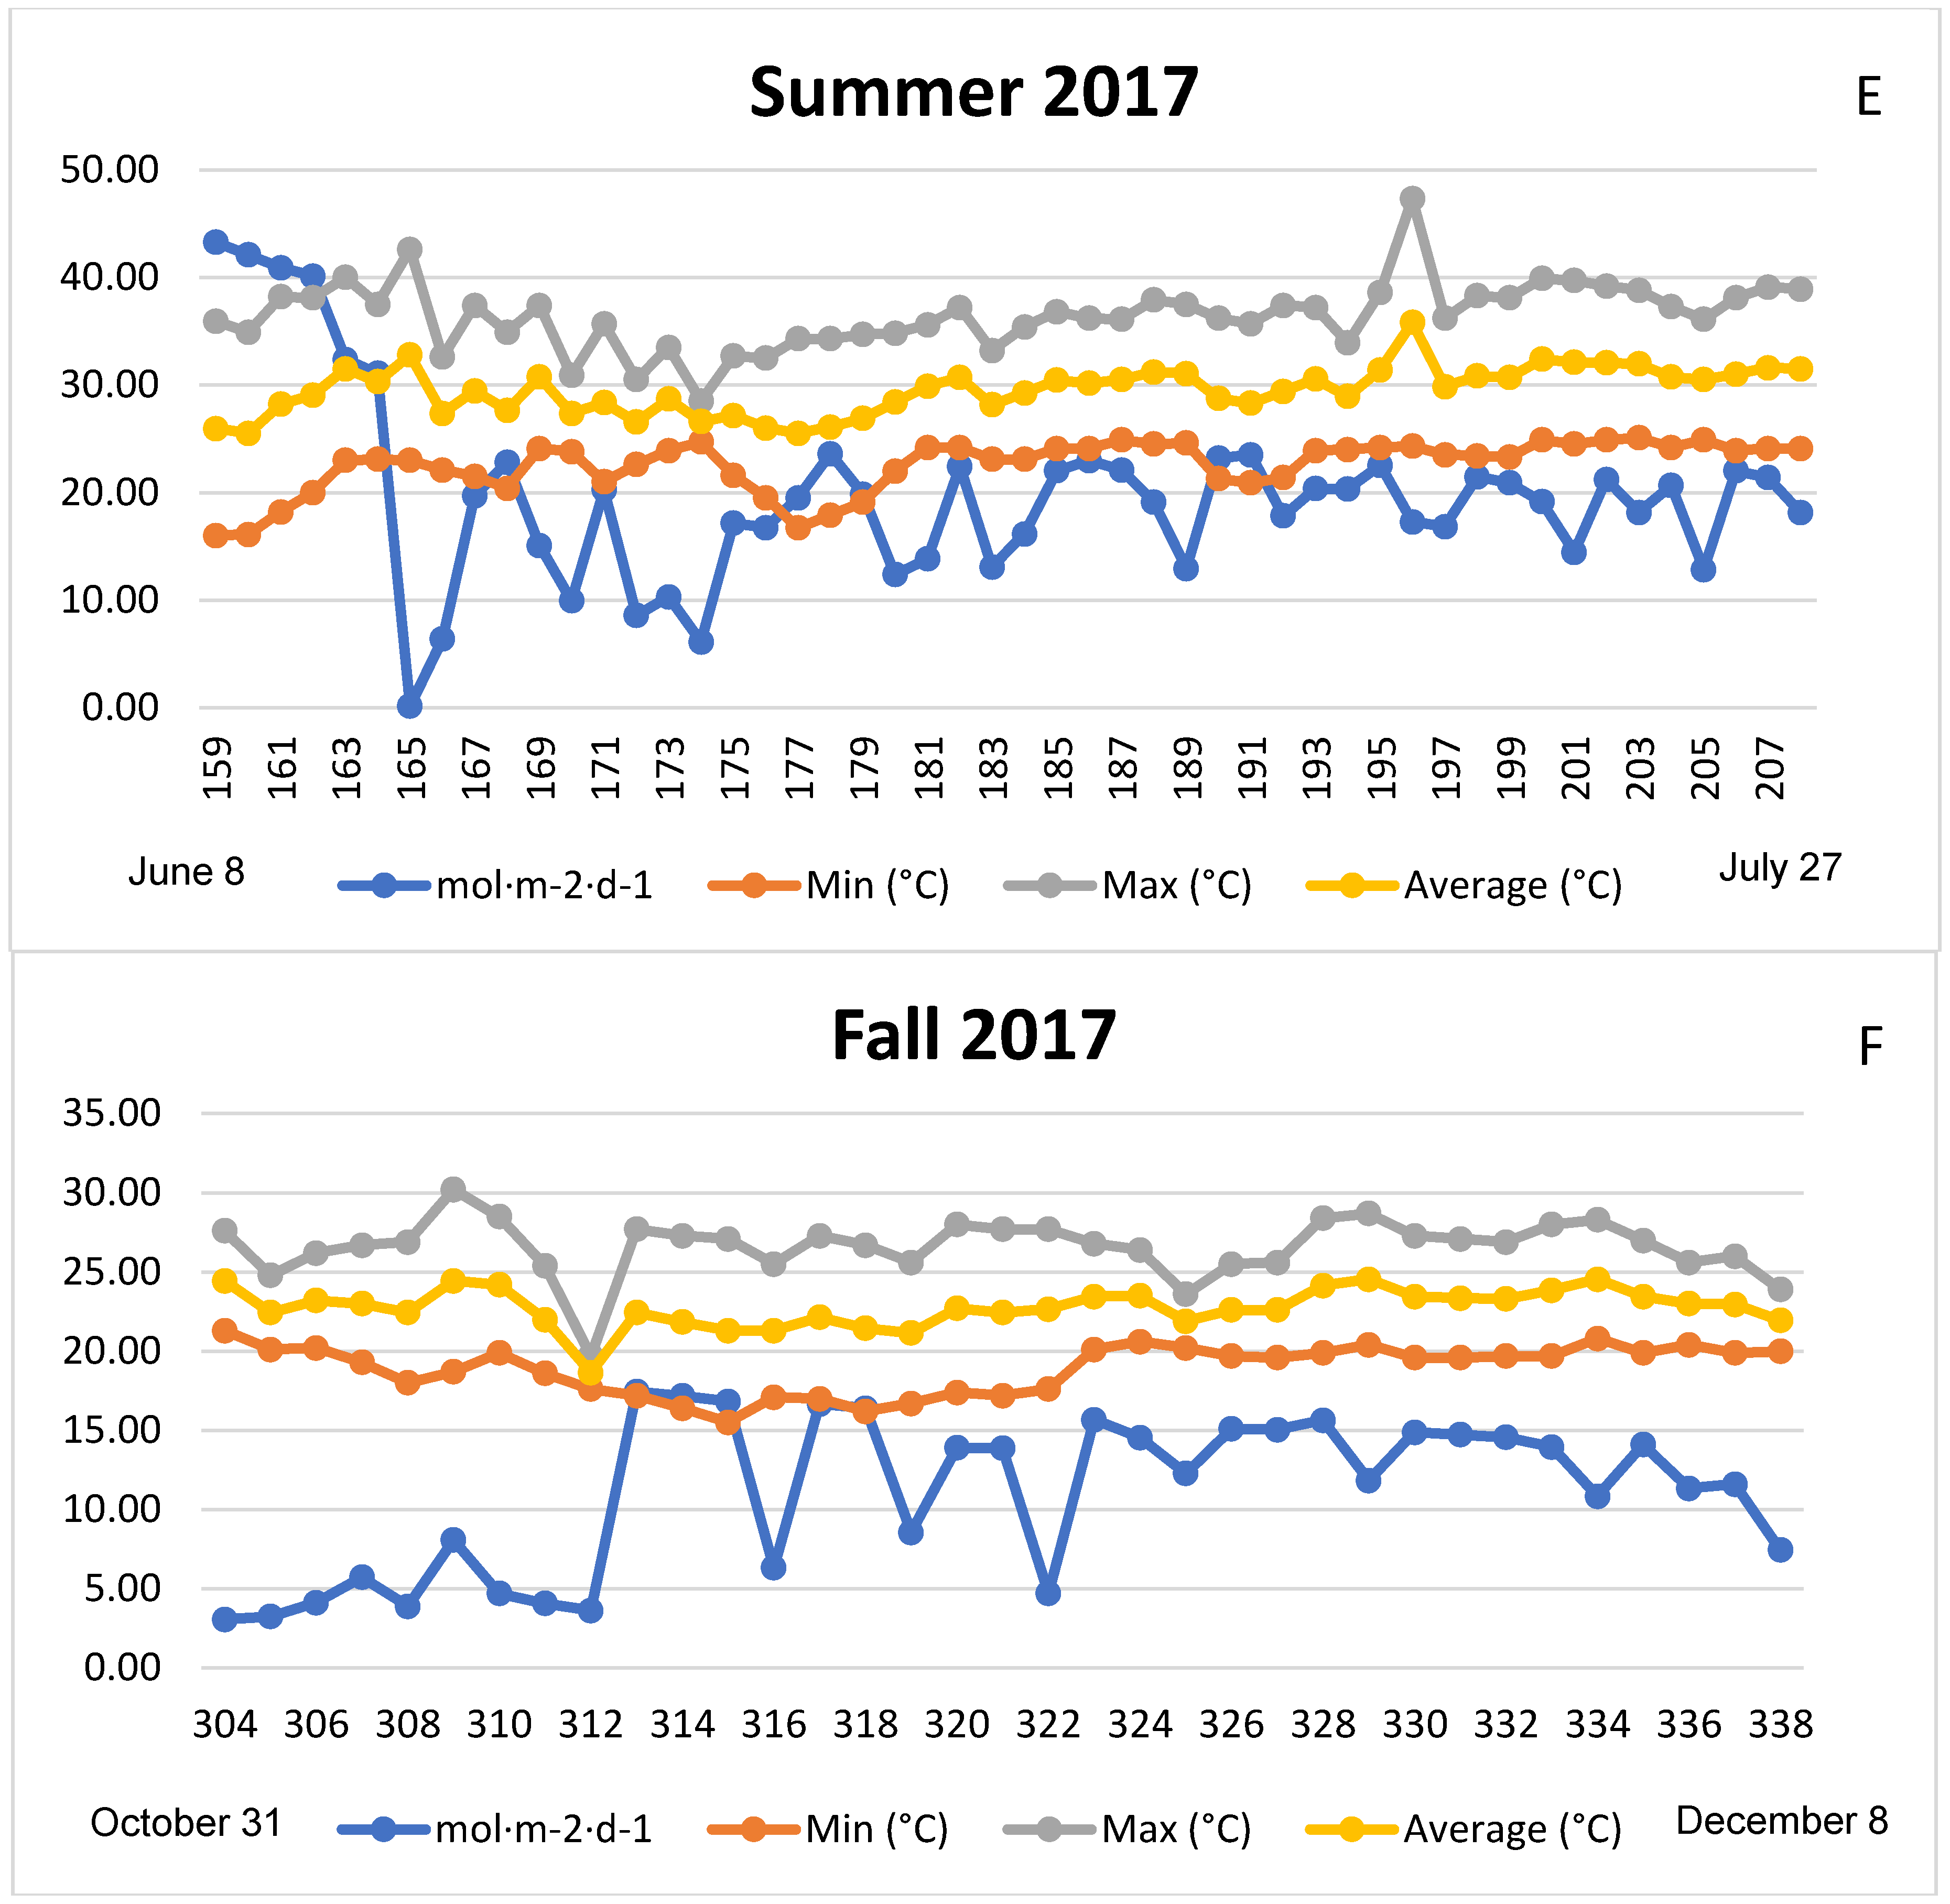
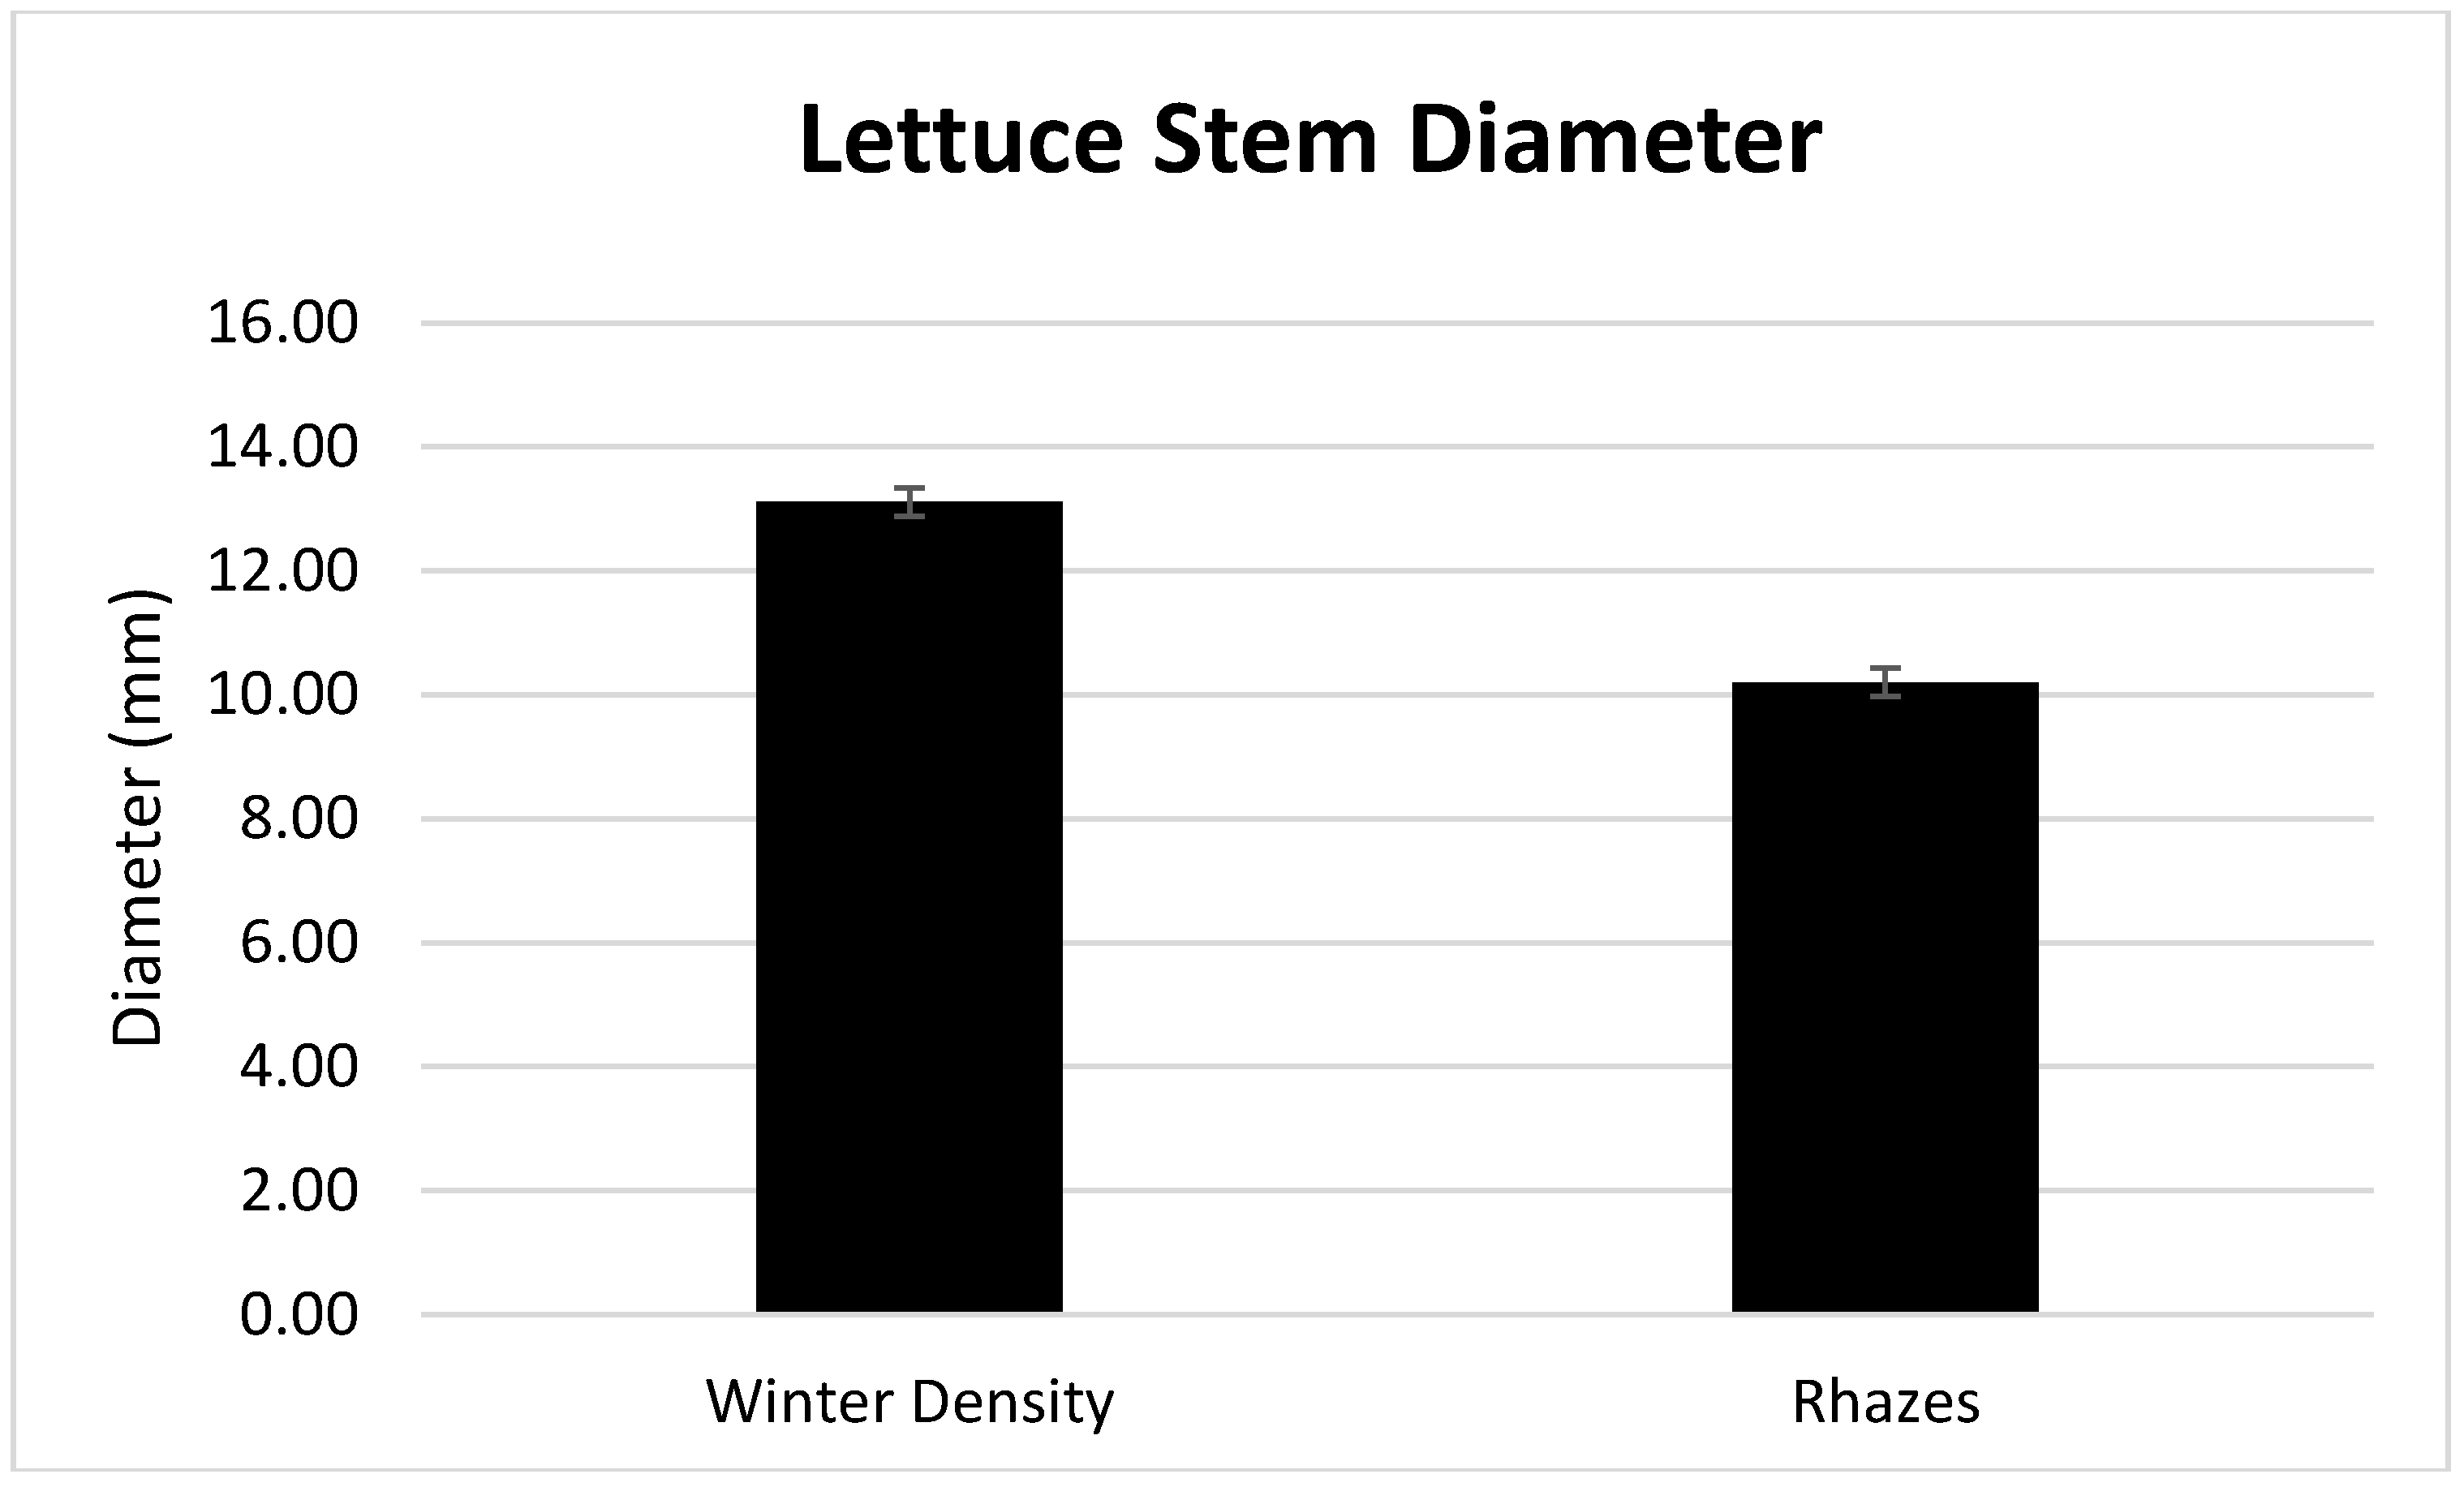
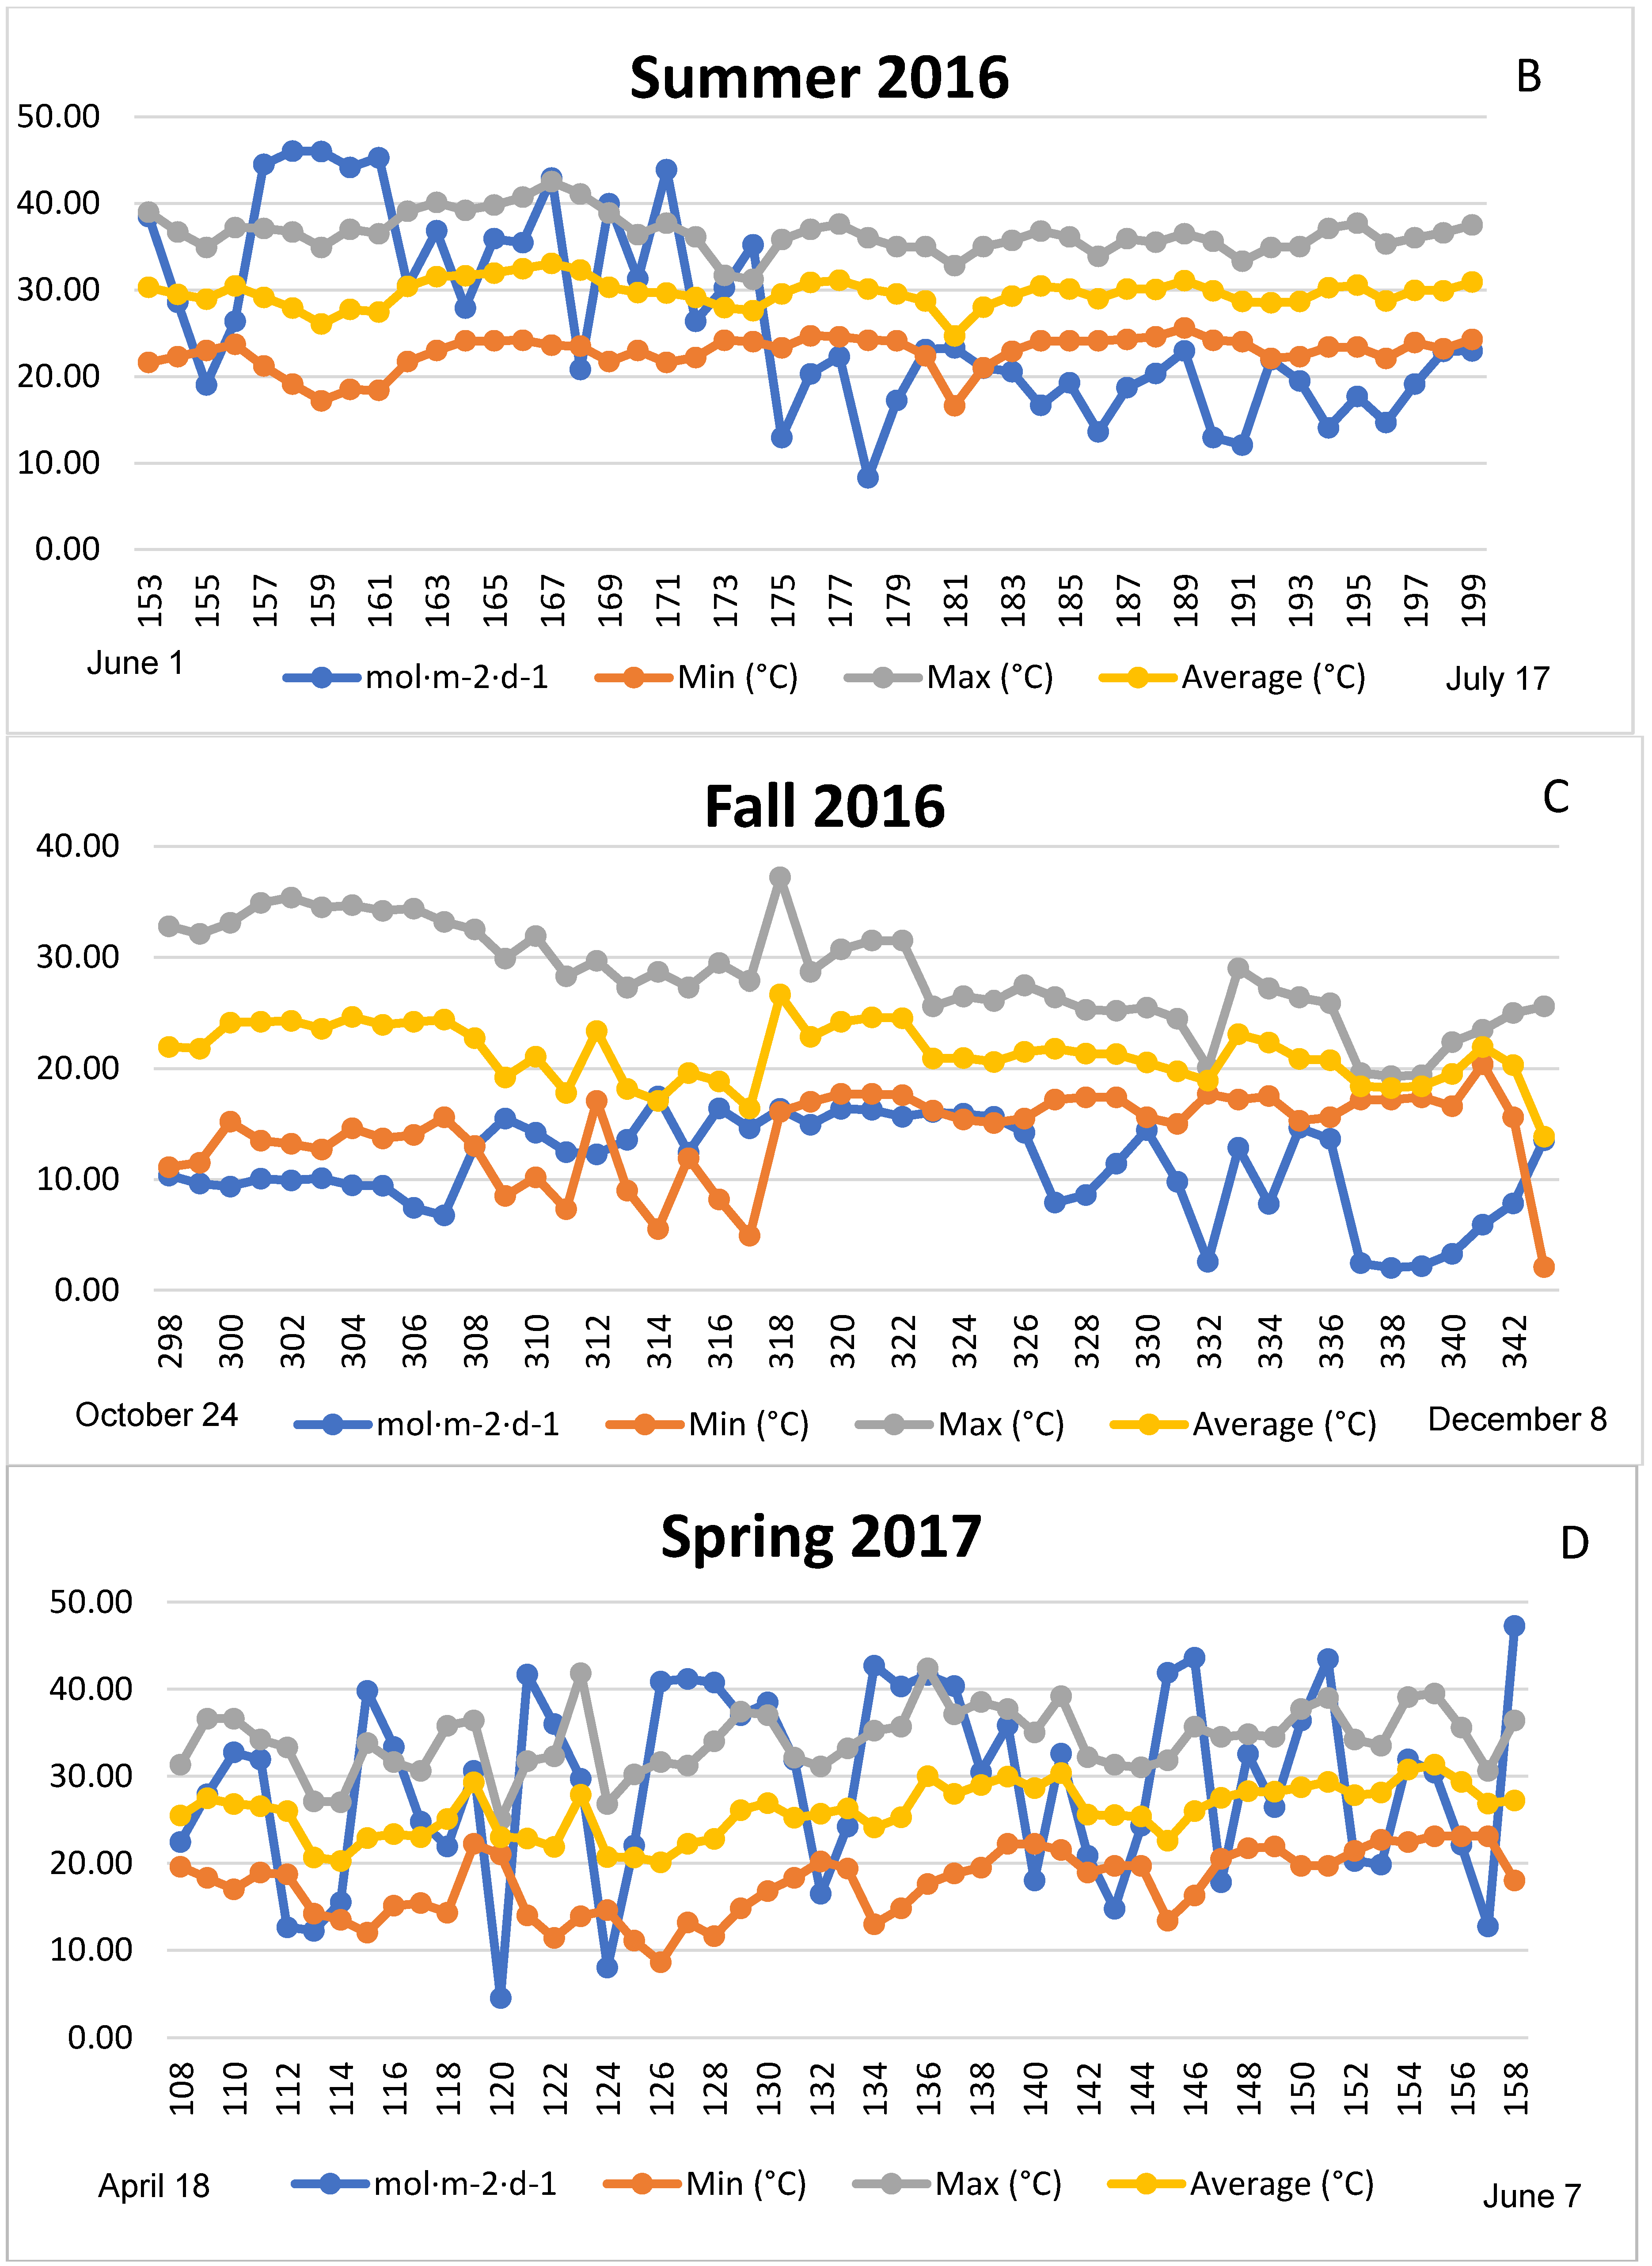
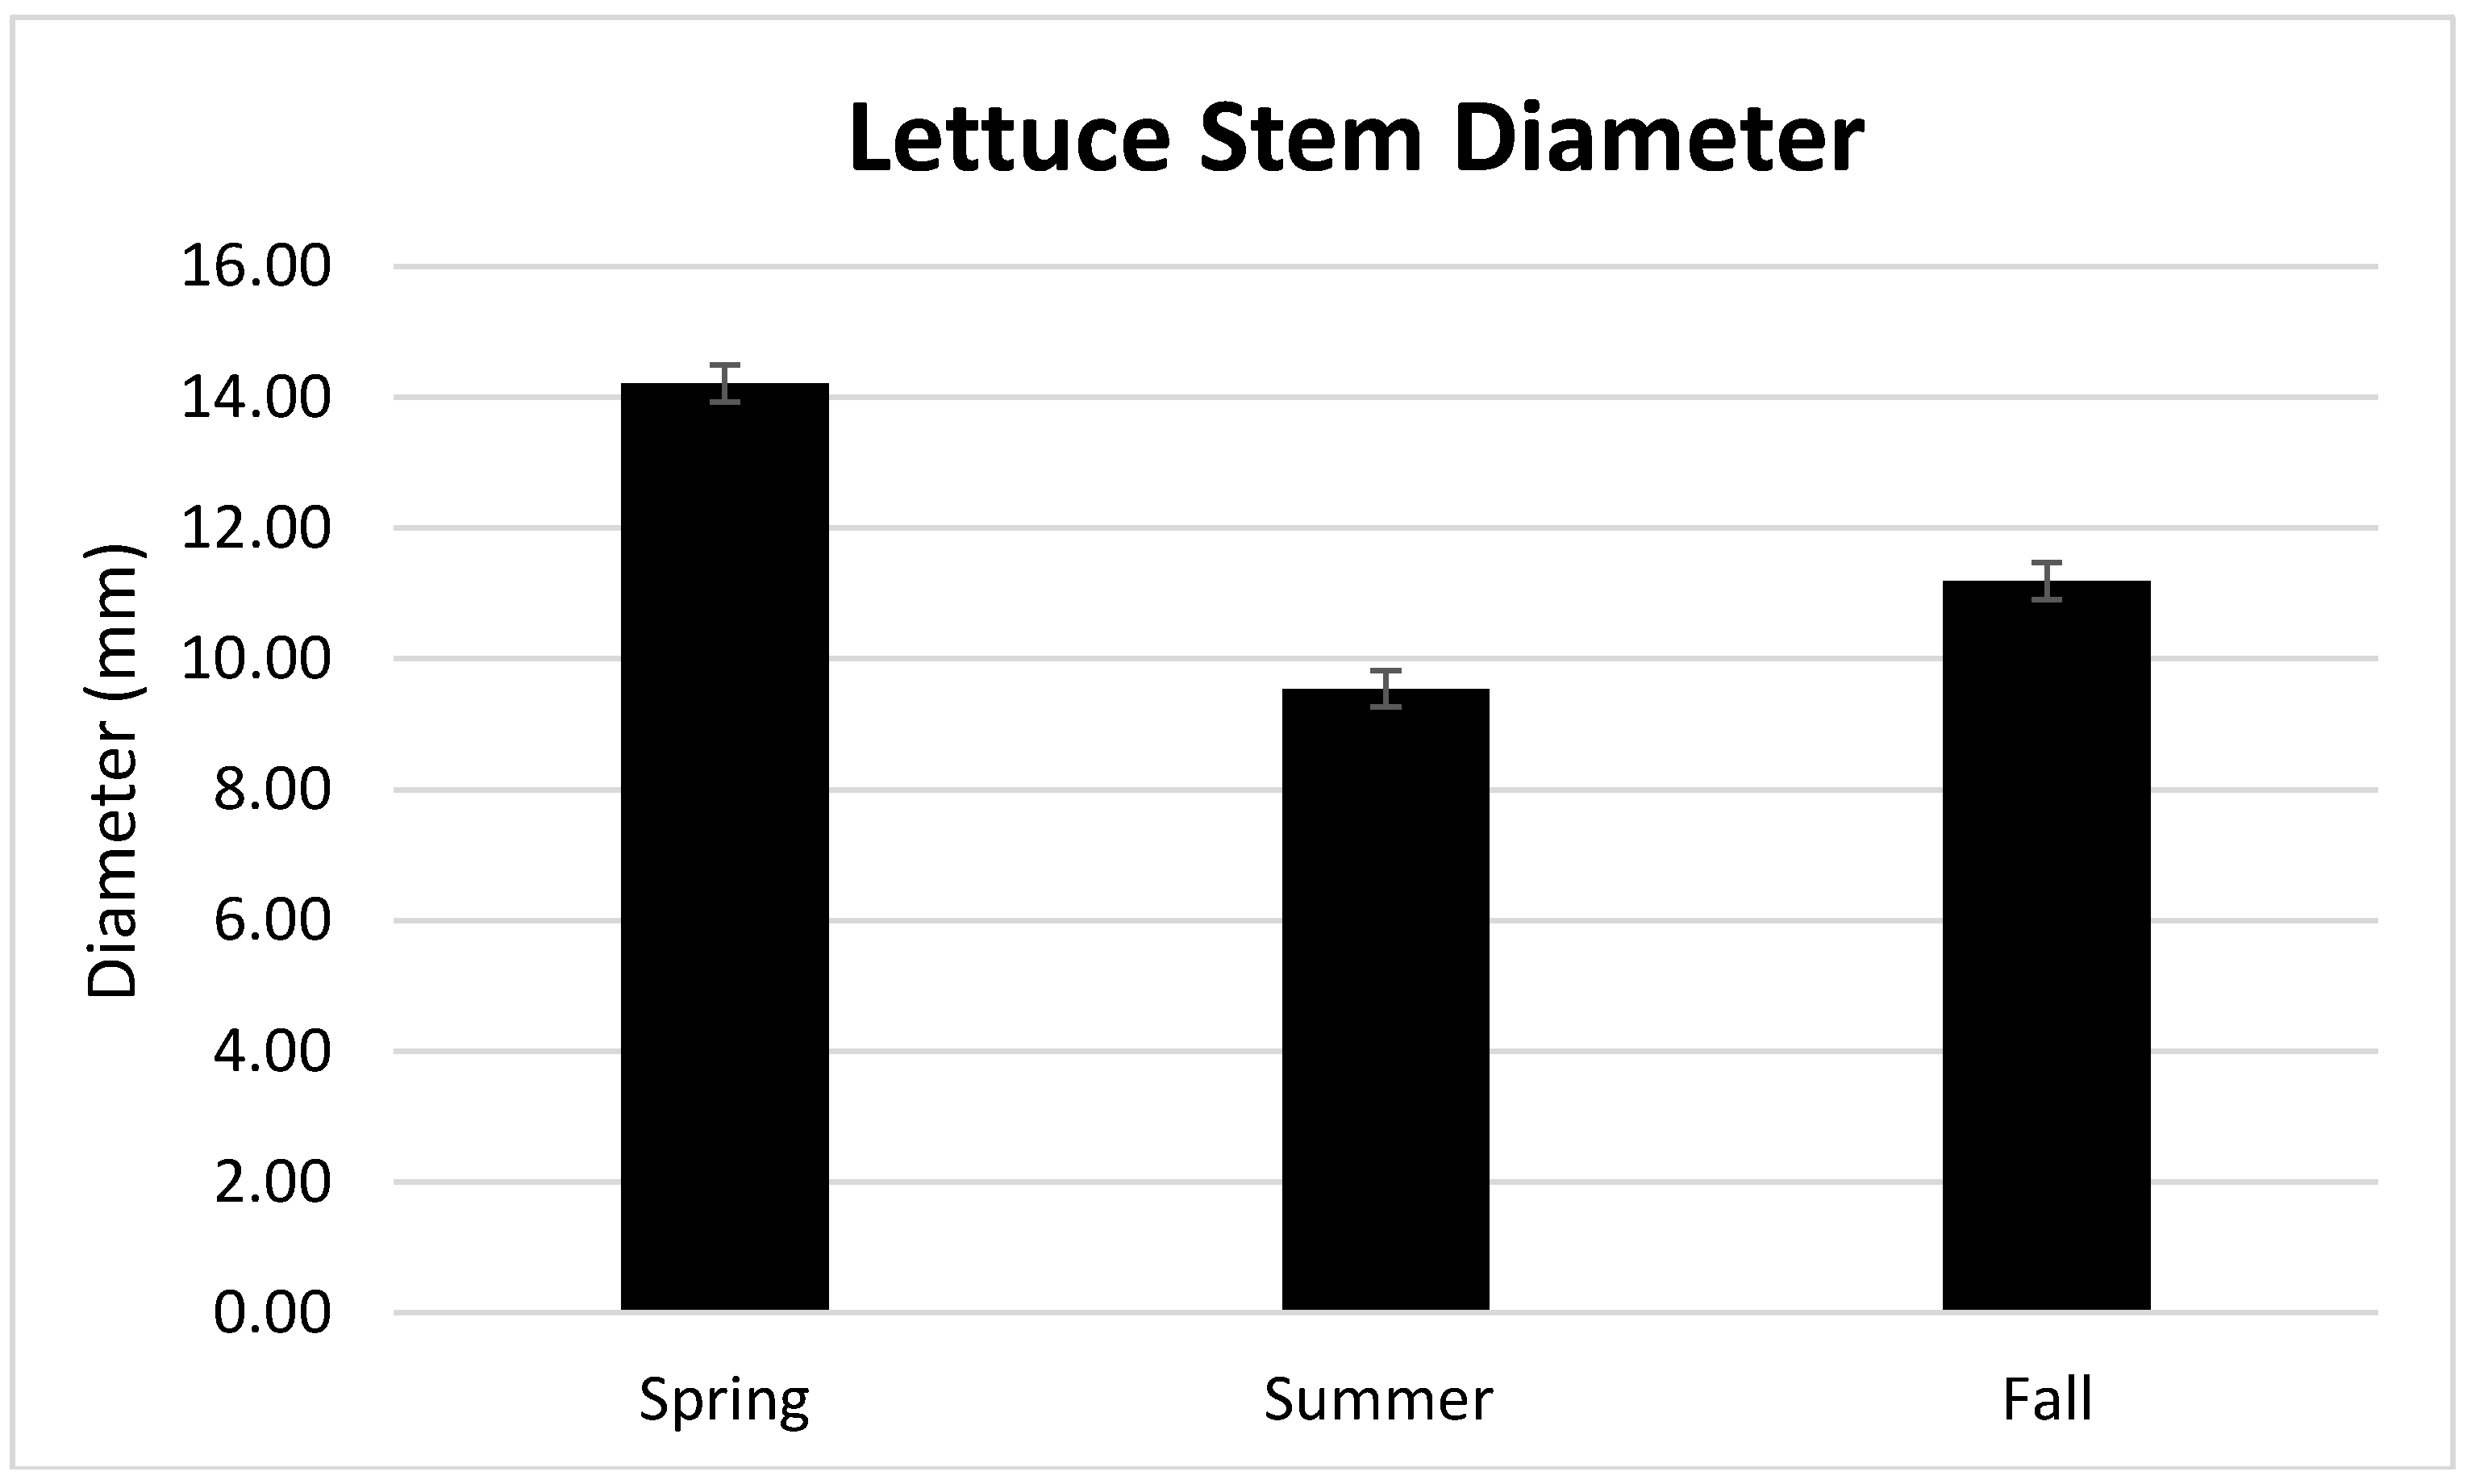
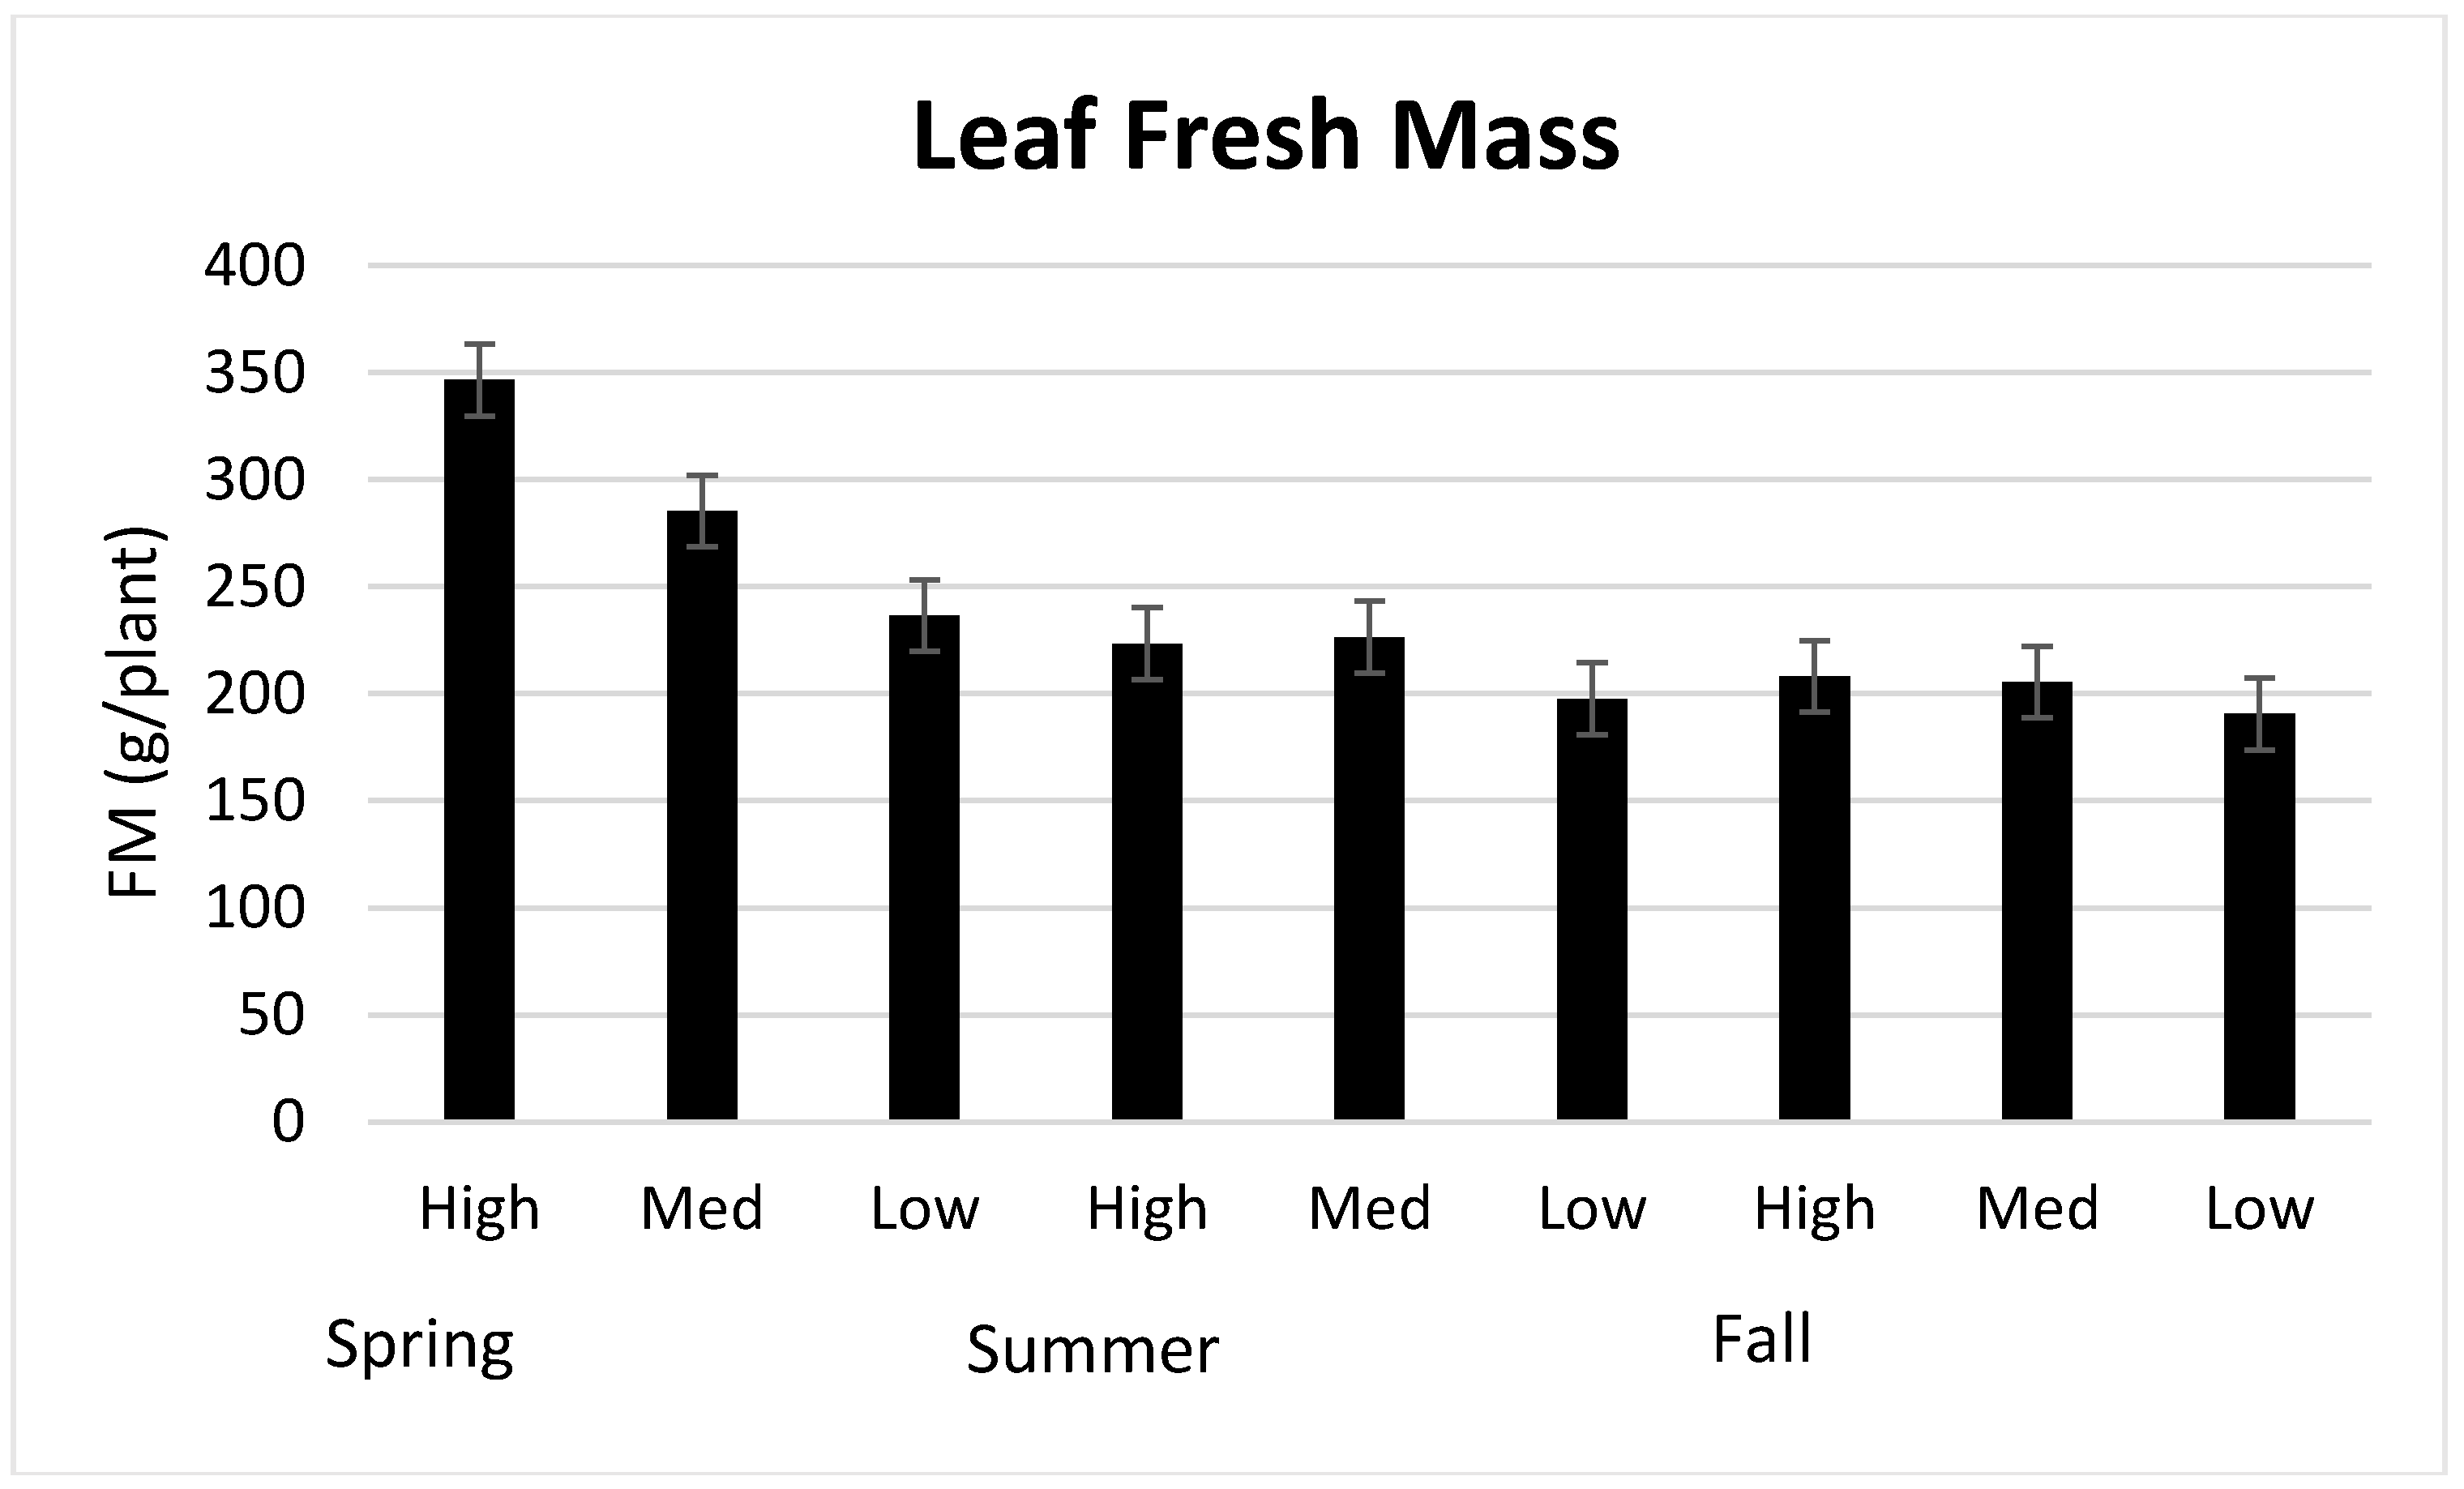
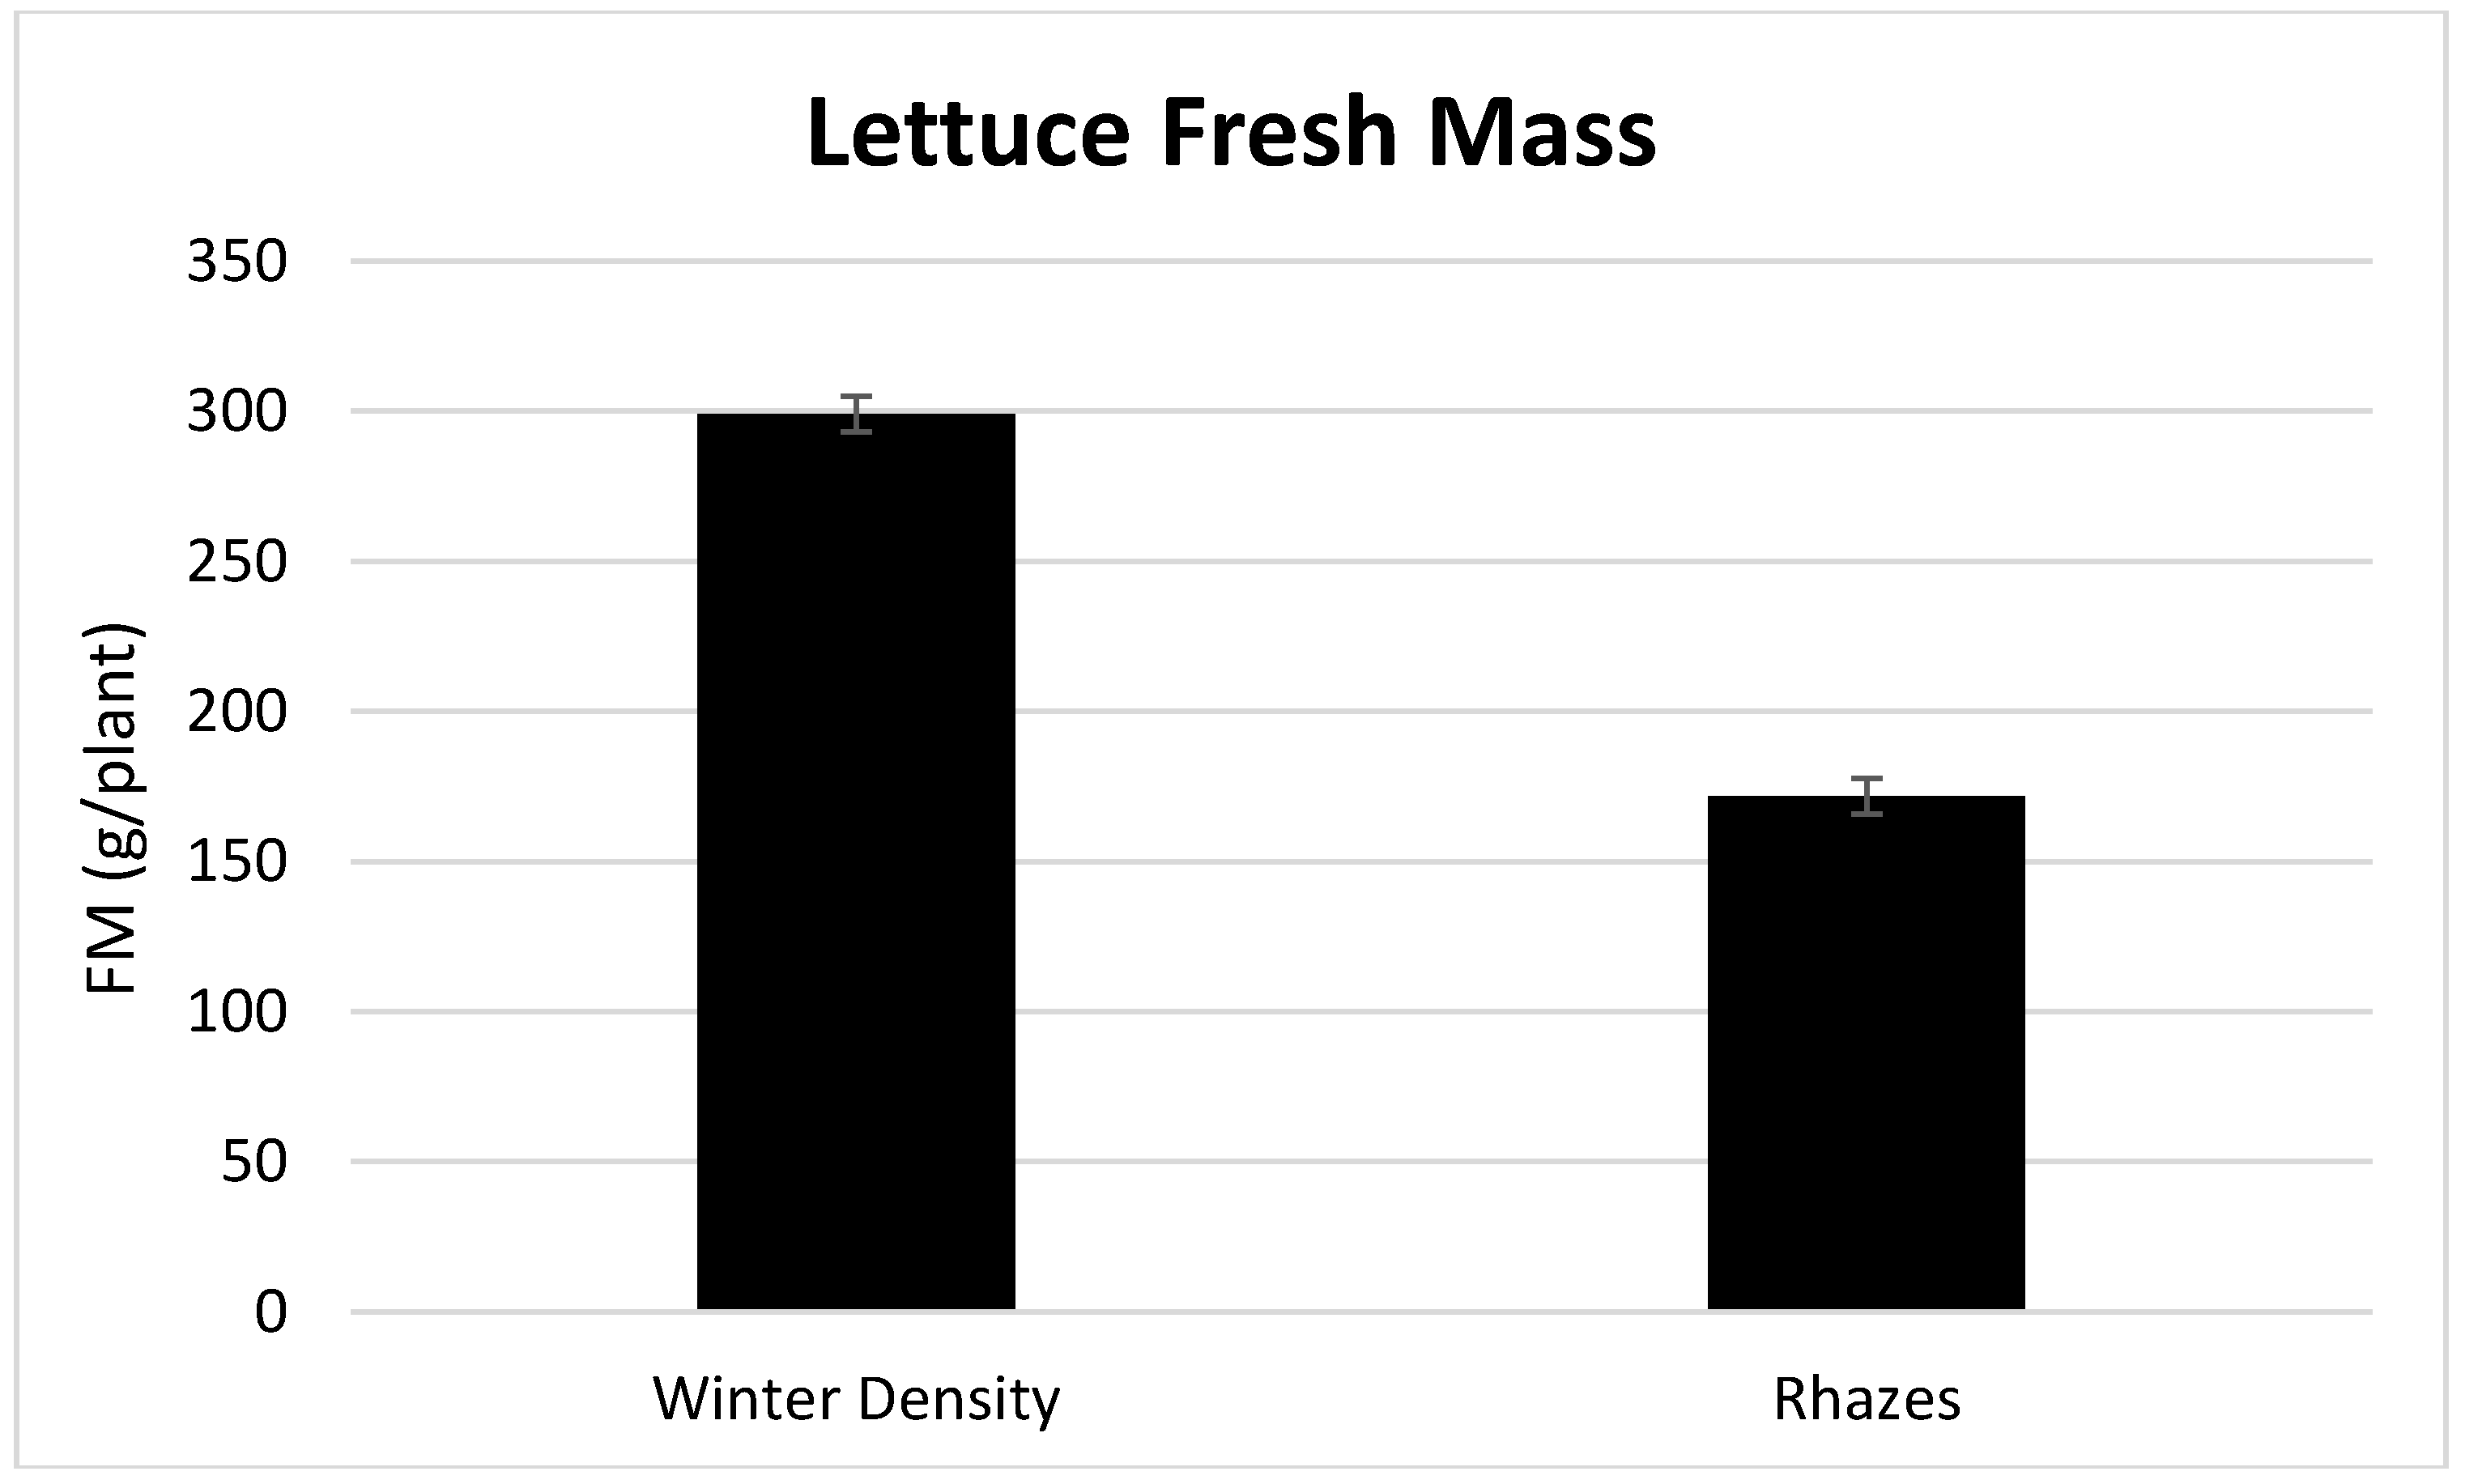
3.1. Season, Cultivar, and Treatment Effects on Plant Growth and Biomass Production

Cumulative light energy levels (Figure 1A–F) registered the highest average levels in the spring and summer in both project years. Additionally, the summer growing season produced the greatest day and nighttime average temperatures in 2016 (Figure 1A–C) and 2017 (Figure 1D–F).
Statistical analysis of the results indicated that there were no effects of year (2016 and 2017). Thus, data from 2016 and 2017 were pooled and analyzed together for each lettuce plant parameter. The growing season produced a significant effect on stem diameter (Figure 2), and the lettuce cultivar impacted stem diameter (Figure 3).
The spring season produced plants with the greatest stem diameter and was statistically different than lettuce plants produced in the summer and fall season. The stem diameters of lettuce produced in the summer and fall were 32.9% and 21.3% smaller, respectively, when compared with lettuce plants produced in the spring season. Green-leaf ‘Winter Density’ produced plants that averaged 13.11 mm and averaged 28.5% larger stem diameter compared to red-leaf ‘Rhazes’ lettuce.
There were significant interactions between growing seasons and EC treatments for lettuce leaf fresh mass (FM; Figure 4). The spring season produced the greatest leaf fresh mass and was significantly more lettuce FM was produced with high and medium (4.0 and 2.0 mS·cm−1) EC treatments. There was a 17.7% increase in leaf FM when comparing the spring season, high and medium EC treatments. Conversely, there was a significant difference between spring high EC treatment leaf FM compared to the summer and fall high EC treatments. Additionally, the summer and fall high EC treatment lettuce leaf FM decreased 35.4% and 40.0%, respectively. Overall, there were significant decreases in lettuce leaf FM as the seasons progressed and EC treatments were reduced. Also, there was a significant difference between lettuce cultivars for leaf fresh mass. The green cultivar ‘Winter Density’ produced more fresh mass compared to the red cultivar ‘Rhazes’ (Figure 5). When comparing the two lettuce cultivars, there was a 42.6% decrease in lettuce fresh mass between ‘Winter Density’ and ‘Rhazes’.
There were no interactions between growing season, lettuce cultivar, and EC treatment for leaf dry mass (DM), DM:fresh mass (FM) ratio, and leaf water content (Table 1). Lettuce plants that were produced in the spring had significantly more leaf DM when compared to summer and fall lettuce plants. For example, there was a decrease in leaf DM by 19.4% and 33.2% when comparing the spring plants to summer and fall plants, respectively. The green-leafed lettuce cultivar ‘Winter Density’ produced 47.3% more leaf DM when compared to the red-leafed lettuce cultivar ‘Rhazes’. Additionally, the high EC treatment produced the greatest leaf DM when compared to the medium and low EC treatments by 14.6% and 18.0%, respectively. The ratio of DM:FM was also significantly different for growing season, lettuce cultivar, and EC treatments. The summer growing season produced the greatest difference between DM:FM with a 10.2% and 10.8% increase compared to the spring and fall season, respectively. There were differences in cultivar and EC treatment DM:FM ratio. The leaf water content also saw similar trends as leaf DM in response to cultivar and EC treatment differences.
Lettuce root FM and DM peaked during spring production and was significantly reduced during the summer and fall concerning each cultivar (Table 2). Notably, spring green-leaf lettuce roots averaged 60.08 g FM, which was 93% greater than the root FM of red-leaf lettuce. Root biomass and water content were comparable between both cultivars produced in the fall season as well as between green-leaf lettuce grown in the summer and red-leaf lettuce grown in the spring (Table 2). Plant height (data not shown) and stem diameter were impacted and resulted in green and red-leaf summer lettuce achieving the greatest height, but smallest stem diameter, compared to their spring and summer counterparts. Rhazes lettuce growth in the fall was minimally impacted by season and cultivar and was 66% shorter compared to the Winter Density lettuce.
There were no interactions for EC treatments. Thus, EC treatments are presented as main effects. Low and high EC treatments resulted in comparable amounts of leaf DM. Conversely, lettuce leaf water content increased slightly by 0.7% when subjected to medium EC treatments. Additionally, season and treatment interactions significantly affected root biomass, water content, and stem diameter. Root biomass and water content had an inverse relationship when grown in different seasons and nutrient solution treatments. Root biomass in the spring and fall season increased by 25% and 20%, respectively, when the concentrations of the nutrient solution increased from low to high strength (data not shown). Conversely, root water content decreased 1% in the spring and fall and increased by 1% in summer with increasing nutrient solution strength. Lettuce stem diameter increased by 19% with respect to the spring season and increasing nutrient strength but decreased by 4% during the summer. Fall production resulted in an increase of 1% from low to medium solution strength and decreased by 6% from medium to high strength.

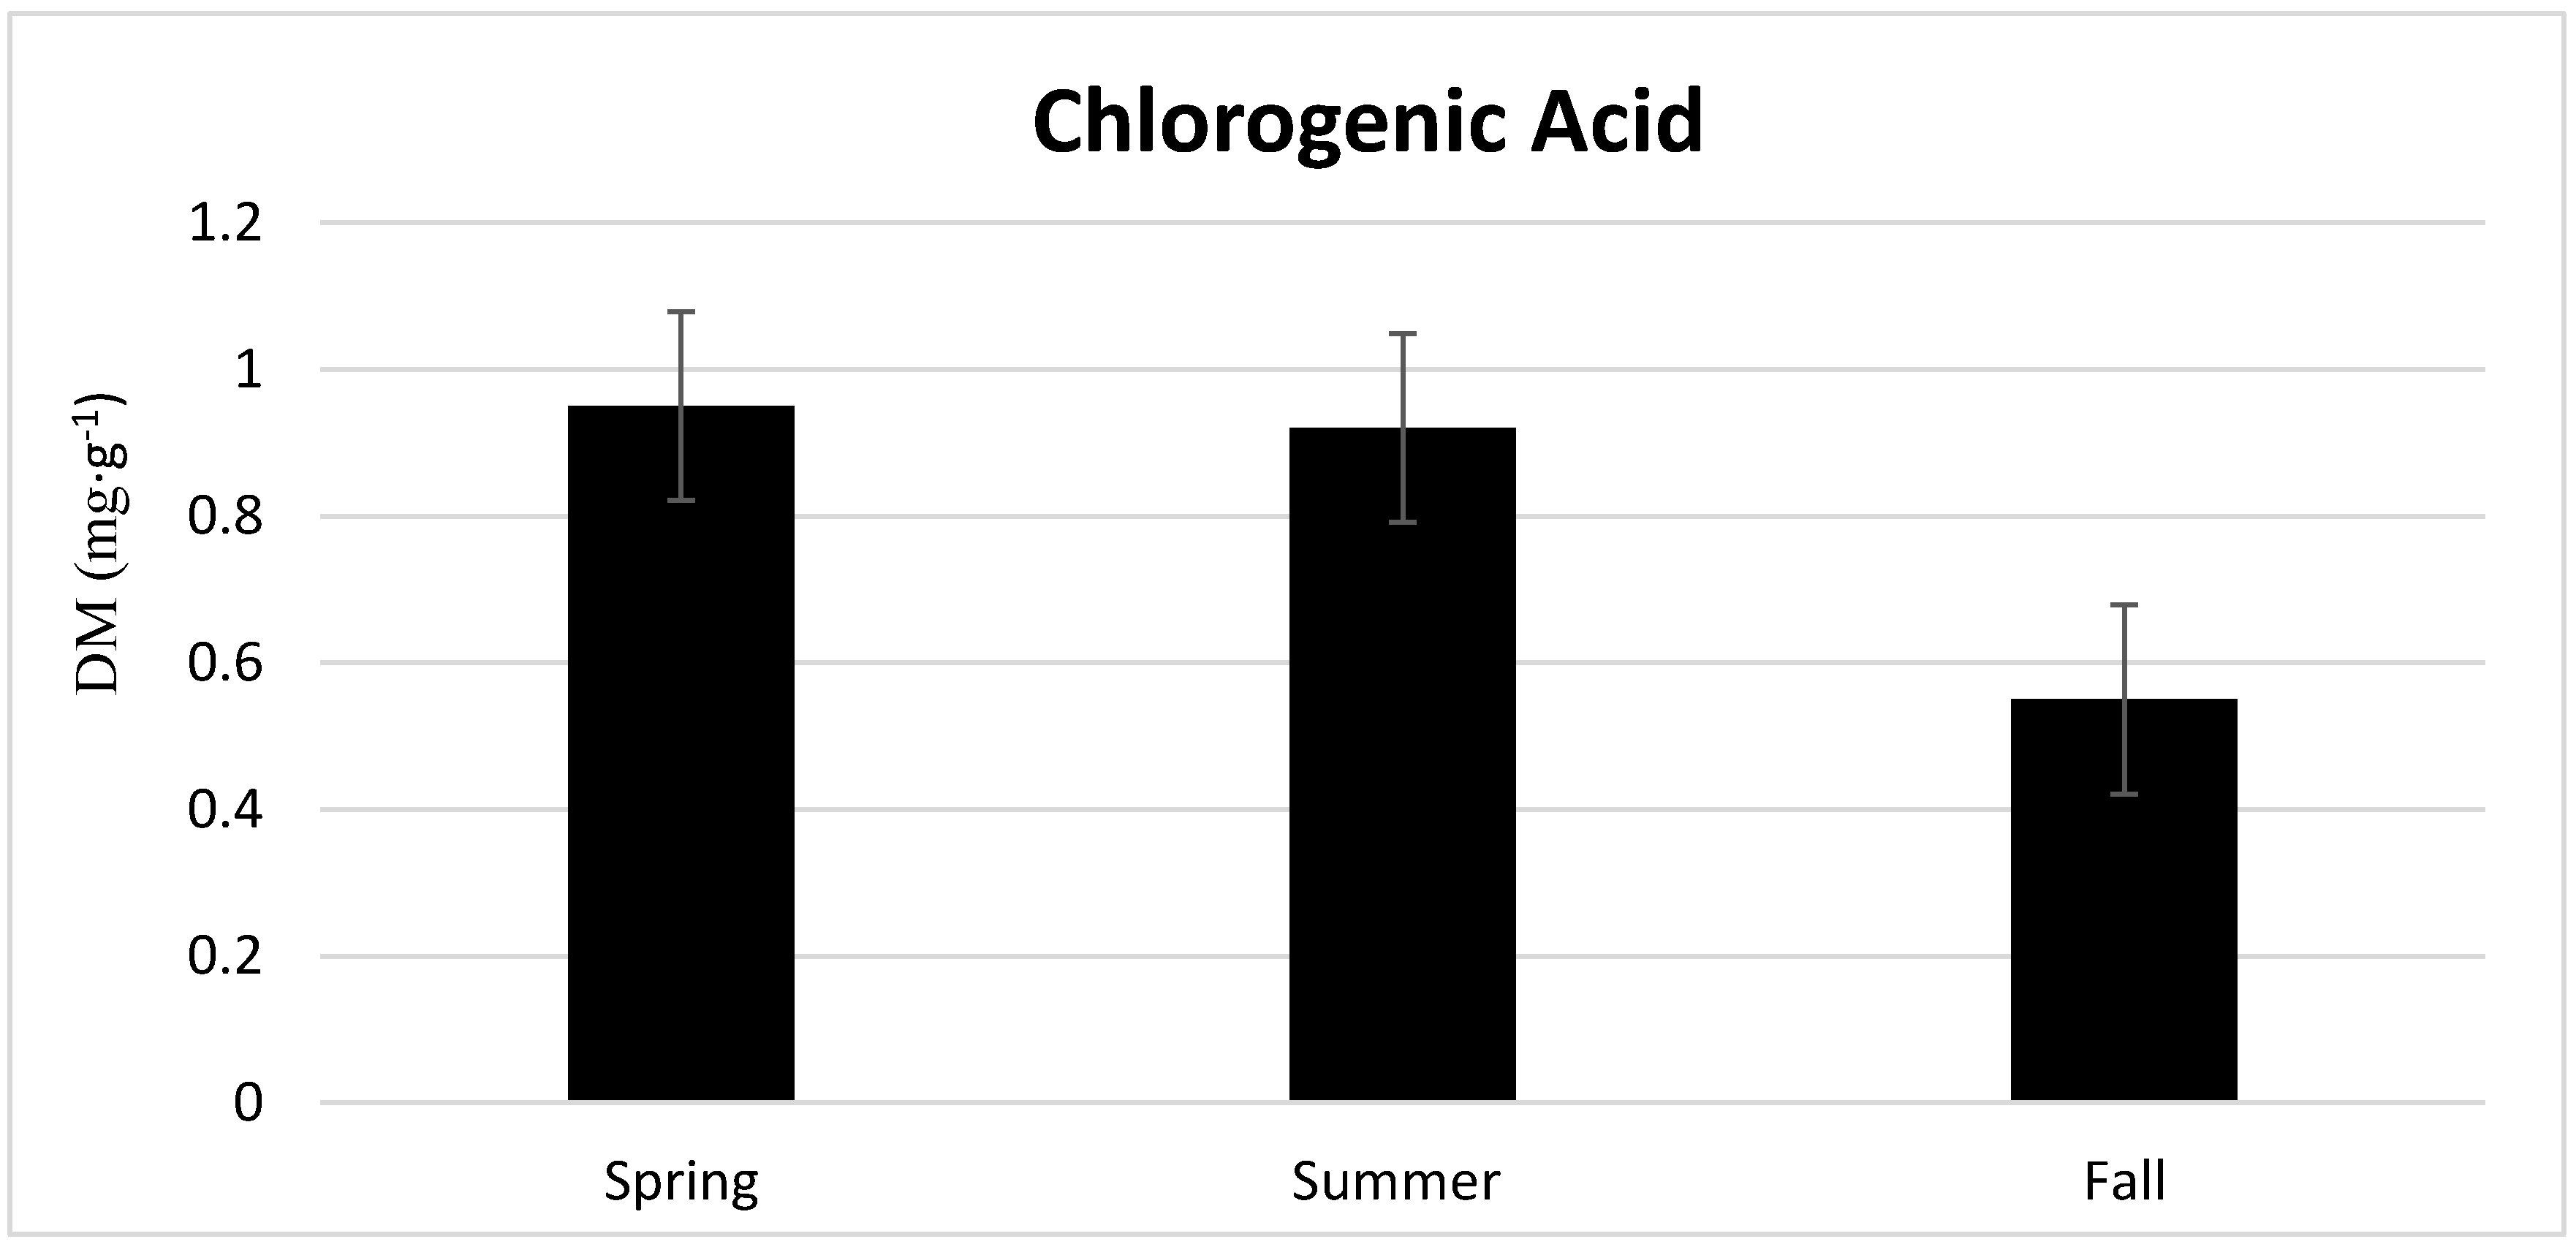
3.2. Season, Cultivar, and Treatment Effect on Lettuce Quality

Growing season alone demonstrated a significant effect on chlorogenic acid content of greenhouse lettuce cultivars (Figure 6). Concentrations of chlorogenic acid were statistically comparable in the spring and summer seasons but significantly different from the fall. Chlorogenic acid levels were greatest in the spring, which was 73% higher compared to the fall.
Interactions between growing season and lettuce cultivars significantly affected chicoric acid and lettuce flavonoids (Table 3). Levels of chicoric acid increased from spring to summer to fall in both lettuce cultivars. The maximum concentration of chicoric acid, produced by red-leaf lettuce in the fall, was 131% greater compared to summer red-leaf lettuce and 175% greater than spring red-leaf lettuce.
Moreover, fall red-leaf lettuce contained 94% greater levels of chicoric acid compared to fall green-leaf lettuce. Concerning lettuce flavonoids, quercetin glucoside and quercetin glucuronide had an inverse relationship. Levels of quercetin glucoside increased from spring to summer but decreased from summer to fall in both cultivars. However, levels of quercetin glucuronide decreased from spring to summer before increasing in the fall. Spring red-leaf lettuce produced the highest concentration of luteolin (9.86 mg·g−1), although maximal concentrations in green-leaf lettuce (1.56 mg·g−1) were achieved in the fall. Interactions between season and cultivar resulted in increasing levels of quercetin malonyl from spring through the fall, and the greatest accumulation was present in substantially higher concentrations among red-leaf lettuce compared to green-leaf. The impact of nutrient solution treatment on lettuce phenolics was insignificant for all compounds except for quercetin glucoside, which at low-solution treatments were 69% greater than medium-solution treatments and 62% greater than high solution treatments (data not shown).

3.3. Season, Cultivar, and Treatment Effects on Leaf Mineral Content

Growing season exhibited an effect on leaf sulfur, copper, and zinc concentrations. While the largest amount of sulfur (S) was achieved in the summer, spring growing season resulted in comparable concentrations (data not shown). Spring and fall growing seasons resulted in similar concentrations of copper (Cu), which were, respectively, 68% and 37% larger compared to the summer. Fall production resulted in the highest concentrations of zinc (Zn), followed by summer, with the lowest concentrations in the spring. Zn levels in the fall growing season were 27% greater compared to the spring. Additionally, cultivar produced a significant effect on Cu and Zn micronutrients. Both nutrients were found in the highest concentrations in the red-leaf lettuce cultivar. Cu was 33% more concentrated in red-leaf lettuce, and Zn levels were 18% larger. The interaction between season and cultivar significantly impacted the macronutrients magnesium (Mg), phosphorous (P), potassium (K), and calcium (Ca) (Table 4). Concerning green-leaf lettuce, spring production resulted in the most accumulation of Mg and Ca, which declined by 16% and 17% in the summer and an additional 7% and 12% in the fall, respectively. P and K did not display any significant changes in relation to season. Concerning red-leaf lettuce, Mg and Ca concentrations increased from spring to summer by 12% and 2%, respectively, then declined in the fall by 3% for each cultivar. P and K had the lowest accumulation in the spring (5.66/48.13 mg·g−1) and steadily increased during the summer by 18% and 11% and fall season by 31% and 8%, respectively. The interaction between season and cultivar significantly impacted the micronutrients boron (B), manganese (Mn), and molybdenum (Mo) (Table 4).
Concerning green-leaf lettuce, B and Mn concentrations were greatest in the spring; whereas, summer and fall concentrations did not significantly differ. Mo concentrations were greatest in the spring (0.97 µg·g−1) and decreased during the summer by 20% and an additional 35% in the fall. Concerning red-leaf lettuce, B and Mn concentrations were greatest in the fall. However, B concentration decreased 13% from spring to summer, while Mn increased 37% from spring to summer. Molybdenum concentrations decreased 16% from spring to summer and an additional 6% from summer to fall. Increasing solution EC impacted leaf concentrations of P, K, Fe, B, Zn, and Mo. Each nutrient increased from treatment 1 to treatment three except for K, which reached a saturation point at treatment 2 and declined with the elevated EC of treatment 3. Additionally, this general trend was observed concerning the other mineral nutrients that were considered not statistically significant.

4. Discussion

4.1. Season, Cultivar, and Treatment Effect on Plant Growth and Biomass Production

The current study examines how the seasonal environment and increasing nutrient solution EC affect lettuce root and shoot mass, plant height and stem diameter, mineral nutrient content, and concentrations of selected phenolic compounds in green and red-leaf romaine cultivars. While season, cultivar, and EC treatments created significant differences in leaf fresh mass and stem diameter, it was the interaction between growing season and lettuce cultivar that demonstrated the most significant effect on root and shoot biomass. Spring growing season and highest EC treatment resulted in the greatest production of leaf and root FM in both cultivars. Greenhouse environmental data measured during 2016 and 2017 show that the spring growing seasons registered the highest levels of cumulative light energy. Light is known as a primary regulatory factor in plant growth and development, and previous research has indicated that daily light intensity significantly affects the production of shoot biomass. For example, Fu et al. [21] examined the effect of increasing light intensity (60, 140, and 220 µmols·m−2·s−1) and nitrogen concentrations (7, 15, and 23 mmols·L−1) on the growth and quality of hydroponic leaf lettuce. The results revealed that plants subjected to 220 µmols·m−2·s−1 light intensity and 7 mmols·L−1 of N produced the greatest amount of dry biomass. Similarly, lettuce plants grown during fall and spring seasons with 50 or 100 µmols·m−2·s−1 of supplemental white light produced more than 270% greater biomass production compared to control treatments [22].
The current study’s results suggest that lettuce cultivar had the greatest influence on the production of leaf FM content in green and red-leafed cultivars. Lettuce leaf DM, DM:FM ratio, and leaf water content were influenced the most by growing season, lettuce cultivar, and EC treatments. There was an interaction between the growing season and lettuce cultivars that created the most consistent favorable conditions for the production of root biomass, root DM:FM ratio, and root water content. These results are mixed with other studies that demonstrate lettuce sensitivity to increasing EC concentrations [12]. In the spring, EC treatments were significantly greater compared to the summer and fall growing seasons. Consequently, the summer and fall growing season correspond to other studies. For example, Scuderi et al. [11] reported that increasing solution EC decreased yield and leaf nitrate content in lettuce planted at high densities in a deep-water culture production system. Furthermore, previous research demonstrated that increasing salinity treatments in three lettuce cultivars also resulted in reduced total yield [12]. Temperature is known to heavily influence the partitioning of photoassimilates in plants, and studies of lettuce [16,23], tomato [4], and zucchini [24] have indicated differences in plant biomass due to light and temperature interactions. Under suboptimal conditions, lettuce’s resilience to common physiologically induced disorders such as tipburn [9,23,25], rib-discoloration [26], bolting [7], and the increase of bitterness compounds [27] is highly correlated to lettuce genotype.

4.2. Season, Cultivar, and Treatment Effect on Lettuce Quality

Previous research has demonstrated that despite the influence on lettuce yield, increasing EC levels caused greater production of flavonoid and phenolic compounds [14,15]. The results of the current study were inconsistent with these findings. Nutrient solution EC did not significantly affect flavonoid and phenolic concentration of any compounds except for quercetin glucoside, which was the highest flavonoid concentration in the leaf tissue and grown under the lowest EC treatment. However, season and the interaction between season and lettuce cultivar showed a significant impact on phenolic production. Chlorogenic acid is well studied in plants and acts as an antioxidant as well as protecting against ultra-violet radiation [28]. This corresponds with the results of the current study, indicating the greatest concentrations of chlorogenic acid in the spring and summer when greenhouse light intensity was at its peak. Furthermore, red-leaf lettuce cultivars contain higher concentrations of phenolic compounds than their green-leaf counterparts, and previous studies have shown great variability in the production of these compounds with respect to cultivar and growth environment. For example, Oh et al. [29] reported that exposing five-week-old lettuce plants to mild environmental stresses resulted in a two to three-fold increase in phenolic compounds in the leaf tissue. Specifically, the study found that decreasing temperature elevated concentrations of quercetin and luteolin glycosides. Moreover, increasing photosynthetic photon flux density (PPFD) from 43 to 410 µmols·m−2·s−1 also increased concentrations of quercetin, luteolin, and cyanidin glycosides [19], and increasing ultraviolet (UV) radiation in field grown lettuce resulted in a dose-dependent response of quercetin and luteolin glycosides and total phenolic acid concentrations [28]. These findings are consistent with the results of the current study, which demonstrated significant increases in flavonoids and phenolic content among red and green-leaf cultivars during spring and fall growing seasons where PPFD levels were higher and average daily temperatures were cooler, respectively, compared to summer.

4.3. Season, Cultivar, and Treatment Effects on Leaf Mineral Content

While climatic factors predominantly influenced the content of lettuce flavonoid and phenolic compounds, all production variables in the current study affected the uptake and concentration of leaf mineral nutrients. In field production, the uptake of mineral nutrients occurs when nutrients become available, which is dependent on soil pH, buffering capacity, and moisture [30]. It is generally accepted that increasing the nutrient supply when nutrients are already present in sufficient amounts will not improve plant growth, especially under extreme adverse environmental conditions [31]. However, in hydroponic production systems, plant roots are provided with a constant supply of purified water with a low buffering capacity. The pH of this water can be adjusted and held at the preferred range of 5.5 to 6.0, which allows maximum availability of nutrients to plant roots. Previous research indicated that even slight increases of pH to levels of 7.0 could significantly reduce lettuce FM and DM [32]. Several studies have examined the effect of increased nutrient solution EC on plant mineral nutrient content. Fallovo et al. [16] investigated the effect of growing season and increasing nutrient solution EC on yield and quality of hydroponic lettuce. The results of this study demonstrated that leaf mineral content of macroelements P, K, and Mg increased with increasing solution EC. Additionally, altering macro-anion and macro-cation nutrient solution proportions in spring and summer growing seasons significantly affected leaf concentrations of N, K, Mg, and Ca [16]. Furthermore, Barickman et al. [30] found that elevating K for greenhouse lettuce production resulted in higher concentrations of K in lettuce leaf tissue. However, a saturation point was reached before negative effects developed at higher levels of K fertilization. The results of these experiments are consistent with the findings of the current study where season, cultivar, and the interactions between the two demonstrated the most significant effect on leaf mineral nutrient content. Additionally, mineral nutrient concentrations increased with increasing solution EC except for K, which reached a saturation point and decreased in plants exposed to the highest solution concentration.
To develop a thorough understanding of the genotypical mechanisms and external contributing factors that produce variable results with respect to lettuce growth and development, secondary compound production, and sequestration of mineral nutrients, more information is required. While it is generally true that exposing lettuce to mild abiotic stresses, specifically elevated light irradiance and temperature, the effects of increasing growth solution EC are inconsistent concerning yield and quality. While the results of this study agree with previous work that suggested yield and quality are predominantly affected by growing season as opposed to increasing EC, all the tested leaf elemental nutrient concentrations increased as nutrient solution EC increased with statistical significance. Thus, the results of this study suggest that fall and spring production of greenhouse green and red-leaf cultivars with elevated EC solution of ≈4.0 mS·cm−1 should be used to maximize lettuce yield and nutritional quality.

Author Contributions

For this research article, T.C.B. conceived and designed the experiments; W.L.S. performed the experiments; T.C.B. and W.L.S. analyzed the data; T.C.B., W.L.S., and C.E.S. contributed sample analysis; W.L.S. wrote the manuscript; T.C.B. and C.E.S. edited the manuscript.

Funding

This research received no external funding.

Acknowledgments

This publication is a contribution of the Mississippi Agriculture and Forestry Experiment Station and supported by the USDA NIFA Hatch S-294 Project MIS 146030. This research received no external funding.

Conflicts of Interest

The authors declare no conflict of interest.

References

  1. Romani, A.; Pinelli, P.; Galardi, C.; Sani, G.; Cimato, A.; Heimler, D. Polyphenols in Greenhouse and Open-Air-Grown Lettuce. Food Chem. 2002, 79, 337–342. [Google Scholar] [CrossRef]
  2. Husain, S.R.; Cilurd, J.; Cillard, P. Hydroxyl radical scavenging activity of Flavonoids. Phytochemistry 1987, 26, 2489–2491. [Google Scholar] [CrossRef]
  3. Cartea, M.E.; Francisco, M.; Soengas, P.; Velasco, P. Phenolic Compounds in Brassica Vegetables. Molecules 2011, 16, 251–280. [Google Scholar] [CrossRef] [PubMed] [Green Version]
  4. Gruda, N. Impact of environmental factors on product quality of greenhouse vegetables for fresh consumption. Crit. Rev. Plant Sci. 2005, 24, 227–247. [Google Scholar] [CrossRef]
  5. Jensen, M. Hydroponics Worldwide. Acta Hortic. 1999, 481, 719–729. [Google Scholar] [CrossRef]
  6. Zbeetnoff, C. The North American Greenhouse Vegetable Industry. Farm Credit Canada and AgriSuccess; Agro-Environmental Consulting: White Rock, BC, Canada, 2006. [Google Scholar]
  7. Rappaport, L.; Wittwer, S.H. Night temperature and photoperiod effects on flowering of leaf lettuce. Proc. Am. Soc. Hortic. Sci. 1956, 68, 279–282. [Google Scholar]
  8. Jenni, S. Rib Discoloration: A Physiological Disorder Induced by Heat Stress in Crisphead Lettuce. HortScience 2005, 40, 2031–2035. [Google Scholar]
  9. Wissemeier, A.H.; Zühlke, G. Relation between climatic variables, growth and the incidence of tipburn in field-grown lettuce as evaluated by simple, partial and multiple regression analysis. Sci. Hortic. 2002, 93, 193–204. [Google Scholar] [CrossRef]
  10. Zanin, G.; Ponchia, G.; Sambo, P. Yield and quality of vegetables grown in a floating system for readyto-eat produce. Acta Hortic. 2009, 807, 433–438. [Google Scholar] [CrossRef]
  11. Scuderi, D.; Restuccia, C.; Chisari, M.; Barbagallo, R.N.; Caggia, C.; Giuffrida, F. Salinity of nutrient solution influences the shelf-life of fresh-cut lettuce grown in floating system. Postharvest Biol. Technol. 2011, 59, 132–137. [Google Scholar] [CrossRef]
  12. Abou-Hadid, A.F.; Abd-Elmoniem, E.M.; El-Shinawy, M.Z.; Abou-Elsoud, M. Electrical conductivity effect on growth and mineral composition of lettuce plants in hydroponic system. Acta Hortic. 1996, 434, 59–66. [Google Scholar] [CrossRef]
  13. Sgherri, C.; Perez-Lopez, U.; Micaelli, F.; Miranda-Apodaca, J.; Mena-Petite, A.; Munoz-Rueda, A.; Quartacci, M.F. Elevated CO2 and salinity are responsible for phenolics-enrichment in two differently pigmented lettuces. Plant Physiol. Biochem. 2017, 115, 269–278. [Google Scholar] [CrossRef] [PubMed]
  14. Kim, H.J.; Fonseca, J.M.; Choi, J.H.; Kubota, C.; Dae, Y.K. Salt in irrigation water affects the nutritional and visual properties of romaine lettuce (Lactuca sativa L.). J. Agric. Food Chem. 2008, 56, 3772–3776. [Google Scholar] [CrossRef] [PubMed]
  15. Neocleous, D.; Koukounaras, A.; Siomos, A.S.; Vasilakakis, M. Assessing the salinity effects on mineral composition and nutritional quality of green and red ‘baby’ lettuce. J. Food Qual. 2014, 37, 1–8. [Google Scholar] [CrossRef]
  16. Fallovo, C.; Rouphael, Y.; Cardarelli, M.; Rea, E.; Battistelli, A.; Colla, G. Yield and quality of leafy lettuce in response to nutrient solution composition and growing season. J. Food Agric. Environ. 2009, 7, 456–462. [Google Scholar]
  17. Hoagland, D.R.; Arnon, D.I. The water-culture method for growing plants without soil. Calif. Agric. Exp. Stn. Circ. 1950, 347, 1–32. [Google Scholar]
  18. Neugart, S.; Zietz, M.; Schreiner, M.; Rohn, S.; Kroh, L.W.; Krumbein, A. Structurally different flavonol glycosides and hydroxycinnamic acid derivatives respond differently to moderate UV-B radiation exposure. Physiol. Plant. 2012, 145, 582–593. [Google Scholar] [CrossRef] [PubMed]
  19. Becker, C.; Kläring, H.P.; Kroh, L.W.; Krumbein, A. Temporary reduction of radiation does not permanently reduce flavonoid glycosides and phenolic acids in red lettuce. Plant Physiol. Biochem. 2013, 72, 154–160. [Google Scholar] [CrossRef] [PubMed]
  20. Barickman, T.C.; Kopsell, D.A.; Sams, C.E. Selenium influences glucosinolate and isothiocyanates and increases sulfur uptake in Arabidopsis thaliana and rapid-cycling Brassica oleracea. J. Agric. Food. Chem. 2013, 61, 202–209. [Google Scholar] [CrossRef] [PubMed]
  21. Fu, Y.; Li, H.; Yu, J.; Liu, H.; Cao, Z.; Manukovsky, N.S.; Liu, H. Interaction effects of light intensity and nitrogen concentration on growth, photosynthetic characteristics and quality of lettuce (Lactuca sativa L. Var. youmaicai). Sci. Hortic. 2017, 214, 51–57. [Google Scholar] [CrossRef]
  22. Gaudreau, L.; Charbonneau, J.; Canda, A.; Gv, Q. Photoperiod and Photosynthetic Photon Flux Influence Growth and Quality of Greenhouse-grown Lettuce. HortScience 1994, 29, 1285–1289. [Google Scholar]
  23. Glenn, E.P. Seasonal effects of radiation and temperature on growth of greenhouse lettuce in a high insolation desert environment. Sci. Hortic. 1984, 22, 9–21. [Google Scholar] [CrossRef]
  24. Rouphael, Y.; Colla, G. Growth, yield, fruit quality and nutrient uptake of hydroponically cultivated zucchini squash as affected by irrigation systems and growing seasons. Sci. Hortic. 2005, 105, 177–195. [Google Scholar] [CrossRef]
  25. Bres, W.; Weston, L. A Nutrient Accumulation and Tipburn in NFT-grown Lettuce at Several Potassium and pH Levels. HortScience 1992, 27, 790–792. [Google Scholar]
  26. Jenni, S.; Truco, M.J.; Michelmore, R.W. Quantitative trait loci associated with tipburn, heat stress-induced physiological disorders, and maturity traits in crisphead lettuce. Theor. Appl. Genet. 2013, 126, 3065–3079. [Google Scholar] [CrossRef] [PubMed]
  27. Bunning, M.L.; Kendall, P.A.; Stone, M.B.; Stonaker, F.H.; Stushnoff, C. Effects of Seasonal Variation on Sensory Properties and Total Phenolic Content of 5 Lettuce Cultivars. J. Food Sci. 2010, 75, 156–161. [Google Scholar] [CrossRef] [PubMed]
  28. García-Macías, P.; Ordidge, M.; Vysini, E.; Waroonphan, S.; Battery, N.H.; Gordon, M.H.; Hadley, P.; John, P.; Lovegrove, J.A.; Wagstaffe, A. Changes in the flavonoid and phenolic acid contents and antioxidant activity of red leaf lettuce (Lollo Rosso) due to cultivation under plastic films varying in ultraviolet transparency. J. Agric. Food Chem. 2007, 55, 10168–10172. [Google Scholar] [CrossRef] [PubMed]
  29. Oh, M.; Carey, E.E.; Rajashekar, C.B. Plant Physiology and Biochemistry Environmental stresses induce health-promoting phytochemicals in lettuce. Plant Physiol. Biochem. 2009, 47, 578–583. [Google Scholar] [CrossRef] [PubMed]
  30. Barickman, T.C.; Horgan, T.E.; Wheeler, J.R.; Sams, C.E. Elevated Levels of Potassium in Greenhouse-grown Red Romaine Lettuce Impacts Mineral Nutrient and Soluble Sugar Concentrations. HortScience 2016, 51, 504–509. [Google Scholar]
  31. Hu, Y.; Schmidhalter, U. Drought and salinity: A comparison of their effects on mineral nutrition of plants. J. Plant Nutr. Soil Sci. 2005, 168, 541–549. [Google Scholar] [CrossRef]
  32. Anderson, T.S.; Martini, M.R.; de Villiers, D.; Timmons, M.B. Growth and Tissue Elemental Composition Response of Butterhead Lettuce (Lactuca sativa, cv. Flandria) to Hydroponic Conditions at Different pH and Alkalinity. Horticulturae 2017, 3, 41. [Google Scholar] [CrossRef]
Figure 1. 2016 spring cumulative daily light energy (based on a 12 h d), and maximum, minimum, and average daily temperature (A); summer cumulative daily light energy, and maximum, minimum, and average daily temperature (B); fall cumulative daily light energy, and maximum, minimum, and average daily temperature (C); 2017 spring cumulative daily light energy, and maximum, minimum, and average daily temperature (D); summer cumulative daily light energy, and maximum, minimum, and average daily temperature (E); and fall cumulative daily light energy, and maximum, minimum, and average daily temperature (F).
Horticulturae 04 00048 g001aHorticulturae 04 00048 g001bHorticulturae 04 00048 g001c
Figure 2. The effect of growing season on lettuce stem diameter. The standard error of the mean was: stem diameter ± 0.28.
Horticulturae 04 00048 g002
Figure 3. The effect of cultivar on greenhouse lettuce stem diameter. The standard error of the mean was: Stem diameter ± 0.23.
Horticulturae 04 00048 g003
Figure 4. The interaction of growing season and electrical conductivity (EC) treatment on lettuce leaf fresh mass. The standard error of the mean: 12.65. The EC treatment: high = 4.0 mS·cm−1, medium = 2.0 mS·cm−1, and low = 1.0 mS·cm−1.
Horticulturae 04 00048 g004
Figure 5. The effect of cultivar on greenhouse lettuce fresh mass. The standard error of the mean was: lettuce fresh mass ± 5.96.
Horticulturae 04 00048 g005
Figure 6. The effect of growing season on greenhouse lettuce chlorogenic acid content. The standard error of the mean was: Leaf DM ± 0.05. Different letters are significantly different at P ≤ 0.05 according to Tukey’s honest significant difference test.
Horticulturae 04 00048 g006
Table 1. The effect of growing season, lettuce cultivar, and EC treatment on leaf dry mass (DM) (g/plant), DM:fresh mass (FM) ratio, and lettuce leaf water content.
TreatmentsLeaf DM (g)DM:FM (g) aLeaf Water %
Spring12.37 a0.0413 b95.86 a
Summer9.97 b0.0460 a95.41 b
Fall8.26 c0.0410 b95.92 a
Winter Density13.36 a0.0444 a95.56 b
Rhazes7.04 b0.0410 b95.90 a
High b11.44 a0.0433 ab95.61 b
Med9.77 b0.0408 b95.93 a
Low9.38 b0.0440 a95.64 b
P-Value c,d
Season********
Cultivar*******
Electro-Conductivity**ns*
a Lettuce DM:FM is reported in grams of dry mass to grams of fresh mass; b The EC treatment: high = 4.0 mS·cm−1, medium = 2.0 mS·cm−1, and low = 1.0 mS·cm−1. c The standard error of the mean was for growing season leaf DM ± 0.48; leaf DM:FM ± 0.0012; leaf water ± 0.13, cultivar standard error for leaf DM ± 0.40; leaf DM:FM ± 0.0011; leaf water ± 0.12, and EC treatment standard error for leaf DM ± 0.48; leaf DM:FM ± 0.0016; leaf water ± 0.13, d ns, *, **, *** indicate non-significant or significant at P ≤ 0.05, 0.01, 0.001, respectively.
Table 2. The effect of the interaction of season and greenhouse lettuce cultivars on root fresh mass, dry mass, dry mass to fresh mass ratio, and water content.
SeasonCultivarRoot FM (g)Root DM (g)Root DM:FM (g) aRoot Water %
SpringWinter Density60.08 a2.42 a0.04 c0.96 a
SummerWinter Density30.00 b1.47 b0.05 b0.95 b
FallWinter Density23.73 c1.22 c0.05 b0.95 b
SpringRhazes31.11 b1.32 bc0.05 b0.95 b
SummerRhazes12.28 d0.79 d0.06 a0.94 c
FallRhazes13.88 d0.68 d0.05 b0.95 b
P-Value b,c*********
a Lettuce DM:FM is reported in grams of dry mass to grams of fresh mass. b The standard error of the mean was Root FM ± 2.14; Root DM ± 0.09; Root DM:FM ± 0.002; Root Water ± 0.002; c ns, **, *** indicate non-significant or significant at P ≤ 0.01, 0.001, respectively.
Table 3. The effect of seasons and cultivars on concentrations of greenhouse lettuce phenolics and flavonoids.
SeasonCultivarConcentrations of Phenolics and Flavonoids (mg·g−1 DM) a,b
chlochicqglucqglucorluteolinqmal
SpringWinter Density0.83 b11.34 d0.87 b1.01 c1.15 d3.56 d
SummerWinter Density0.95 ab15.26 d1.51 b0.55 c0.91 d4.63 d
FallWinter Density0.52 c33.85 b1.05 b1.20 c1.56 d5.93 cd
SpringRhazes1.08 a23.79 c3.85 a9.25 a9.86 a15.33 bc
SummerRhazes0.90 ab28.31 bc3.98 a5.19 b5.40 c18.93 b
FallRhazes0.58 c65.52 a1.34 b6.50 b7.73 b46.90 a
P-Value cns********
a Abbreviations: chlo—chlorogenic acid; chic—chicoric acid; qgluc—quercetin glucoside; qglucor—quercetin glucuronide; qmal—quercetin malonyl; b The standard error of the mean was chlo ± 0.07; chic ± 3.06; qgluc ± 0.53; qglucor ± 0.64; lutein ± 0.67; qmal ± 3.57; c ns, *, **, *** indicate non-significant or significant at P ≤ 0.05, 0.01, 0.001, respectively.
Table 4. The effect of season and cultivar on the concentrations of elemental nutrients in freeze-dried greenhouse lettuce leaf tissue.
Elemental Nutrient Concentrations a
SeasonCultivar(mg·g−1) (µg·g−1)
MgPSKCaFeBMnCuZnMo
SpringWinter Density5.30 a6.22 bc5.22 a48.73 c18.02 a120.53 abc37.16 a58.31 ab4.56 a22.39 b0.97 a
SummerWinter Density4.44 b6.46 b5.83 a46.26 c14.89 b138.57 a28.77 b40.59 b2.85 b23.58 b0.78 b
FallWinter Density4.11 bc6.49 b1.36 b48.87 c13.08 c108.08 bc30.50 b47.20 b2.83 b24.81 b0.51 c
SpringRhazes3.34 e5.66 c4.39 a48.13 c13.83 bc98.68 c34.43 a40.55 b5.37 a22.90 b0.64 bc
SummerRhazes3.73 cd6.68 b5.86 a53.56 b14.12 bc128.74 ab30.02 b55.39 ab3.04 b28.36 ab0.54 c
FallRhazes3.62 de8.73 a1.32 b57.60 a13.73 bc127.34 ab37.22 a74.98 a5.25 a32.53 a0.51 c
P-Value b,c******ns*****ns***nsns*
a Abbreviations: Mg—Magnesium; P—Phosphorous; S—Sulfur; K—Potassium; Ca—Calcium; Fe—Iron; B—Boron; Mn—Manganese; Cu—Copper; Zn—Zinc; Mo—Molybdenum; b The standard error of the mean was Mg ± 0.15; P ± 0.27; S ± 0.70; K ± 1.63; Ca ± 0.55; Fe ± 14.53; B ± 1.43; Mn ± 9.35; Cu ± 0.66; Zn ± 2.64; Mo ± 0.68; c ns,*, **, *** indicate non-significant or significant at P < 0.05, 0.01, 0.001, respectively.

