Article

Developmental Variation in Fruit Polyphenol Content and Related Gene Expression of a Red-Fruited versus a White-Fruited Fragaria vesca Genotype

Department of Horticulture, University of Kentucky, Lexington, KY 40546, USA
*
Author to whom correspondence should be addressed.
Horticulturae 2018, 4(4), 30; https://doi.org/10.3390/horticulturae4040030
Submission received: 31 July 2018 / Revised: 7 September 2018 / Accepted: 25 September 2018 / Published: 1 October 2018
(This article belongs to the Special Issue Molecular, Genetic and Physiological Control of Fruit Quality)

Abstract

:
Two cultivars of F. vesca, red-fruited Baron Solemacher (BS) and white-fruited Pineapple Crush (PC), were studied to compare and contrast the quantitative accumulation of major polyphenols and related biosynthetic pathway gene expression patterns during fruit development and ripening. Developing PC fruit showed higher levels of hydroxycinnamic acids in green stages and a greater accumulation of ellagitannins in ripe fruit in comparison to BS. In addition to anthocyanin, red BS fruit had greater levels of flavan-3-ols when ripe than PC. Expression patterns of key structural genes and transcription factors of the phenylpropanoid/flavonoid biosynthetic pathway, an abscisic acid (ABA) biosynthetic gene, and a putative ABA receptor gene that may regulate the pathway, were also analyzed during fruit development and ripening to determine which genes exhibited differences in expression and when such differences were first evident. Expression of all pathway genes differed between the red BS and white PC at one or more times during development, most notably at ripening when phenylalanine ammonia lyase 1 (PAL1), chalcone synthase (CHS), flavanone-3′-hydroxylase (F3′H), dihydroflavonol 4-reductase (DFR), anthocyanidin synthase (ANS), and UDP:flavonoid-O-glucosyltransferase 1 (UFGT1) were significantly upregulated in the red BS fruit. The transcription factors MYB1 and MYB10 did not differ substantially between red and white fruit except at ripening, when both the putative repressor MYB1 and promoter MYB10 were upregulated in red BS but not white PC fruit. The expression of ABA-related gene 9-cis-epoxycarotenoid dioxygenase 1 (NCED1) was higher in red BS fruit but only in the early green stages of development. Thus, a multigenic effect at several points in the phenylpropanoid/flavonoid biosynthetic pathway due to lack of MYB10 upregulation may have resulted in white PC fruit.

1. Introduction

The accumulation of diverse polyphenols during strawberry (Fragaria spp.) fruit ripening, including flavonols, proanthocyanidins, and especially anthocyanins, is responsible for enhancing fruit nutritional value and providing some level of defense against insects and pathogens [1]. Anthocyanins are also key to creating the bright red color of the ripe fruit. The types and levels of these secondary metabolites vary among commercial strawberry cultivars (F. x ananassa Duch.) [2,3], as well as in the wild species F. chiloensis [4,5], F. pentaphylla [6] and F. vesca [7,8] The variation among cultivars is due to genotype, cultural practices, the production environment, and their interaction [9,10].
In recent years, the diploid woodland strawberry, Fragaria vesca (2n = 2x = 14), has become a popular research tool because it has a small genome (240 Mb) [11] a short generation time, and an available full genome sequence [12,13]. Besides the commonly found red-fruited genotypes of F. vesca, there are some white-fruited cultivars, some of which have been characterized as yellow, all lacking visible red color when ripe [8,14,15].
Polyphenolic compounds in Fragaria spp. originate from the phenylpropanoid/flavonoid biosynthetic pathway [4,7,14,16,17]. Although most of the basic biosynthetic steps leading to phenylpropanoid/flavonoid biosynthesis in F. x ananassa are known [4,16], the regulation of these steps is not yet clearly established but are key to understanding metabolite flux and accumulation patterns. In F. chiloensis, a comparison of a red- versus white-fruited genotype indicated that the absence of anthocyanins in the white mutant was correlated with low expression of several flavonoid biosynthetic genes [17]. Several transcription factors (TFs) controlling the expression of the known phenylpropanoid/flavonoid biosynthetic genes have been identified in apple (Malus x domestica Borkh.) [18,19,20,21], grape (Vitis spp.) [22,23], peach and nectarine (Prunus persica) [24,25], and strawberry [15,26,27]. The TFs MdMYB1 and MdMYBA regulated anthocyanin accumulation in the apple fruit skin [18,19,20,21]. Two MYB-genes, VvMYBA1 and VvMYBA2, were not functional in white grape berries [28] (i.e., lacking anthocyanin), and a mutation in the promoter region of VvMYBA2 resulted in loss of anthocyanin biosynthesis in the skin and white berries [22,23]. The phytohormone abscisic acid (ABA) may also play a regulatory role in fruit ripening and anthocyanin biosynthesis of strawberry [29,30]. Anthocyanin production was inhibited with RNAi-mediated silencing of a key ABA biosynthetic gene, 9-cis-epoxycarotenoid dioxygenase (FaNCED1), and a putative ABA receptor gene, magnesium chelatase H subunit (FaABAR/CHLH), in strawberry [30]. In addition, higher expression of most anthocyanin-related genes in ABA-treated F. x ananassa berries was observed.
The diploid Fragaria vesca genome is simpler than that of the octoploid F. x ananassa and F. chiloensis and provides a more easily-defined model system with which to understand the molecular basis of the white fruit mutation. The hypothesis for this study was that different metabolite profiles and transcriptional levels of one or more phenylpropanoid/flavonoid biosynthetic and regulatory genes would occur in white PC when compared with the red BS during fruit development and ripening. Thus, analyses of the expression patterns of key structural genes of the phenylpropanoid/flavonoid biosynthetic pathway have been combined with high-performance liquid chromatography‒mass spectrometry (HPLC-MS)-based analyses of polyphenol profiles of a red and a white cultivar of F. vesca during fruit development and ripening to determine the basis of their color difference. For the polyphenol analyses at different stages of fruit development, a number of compounds were targeted to use as indicators of trends within specific groups of polyphenols. To explore whether transcription factors and ABA were also involved in anthocyanin synthesis, the expression patterns of MYB TFs, ABA biosynthetic genes, and a putative ABA receptor gene throughout the fruit development were also studied. In addition, only the white-fruited F. vesca cultivar Yellow Wonder has been similarly characterized to date, but no others. We reported that PC differed from Yellow Wonder in flavonoid content when ripe [8], implying some differences in related gene expression patterns between them, so PC was chosen for this study.

2. Materials and Methods
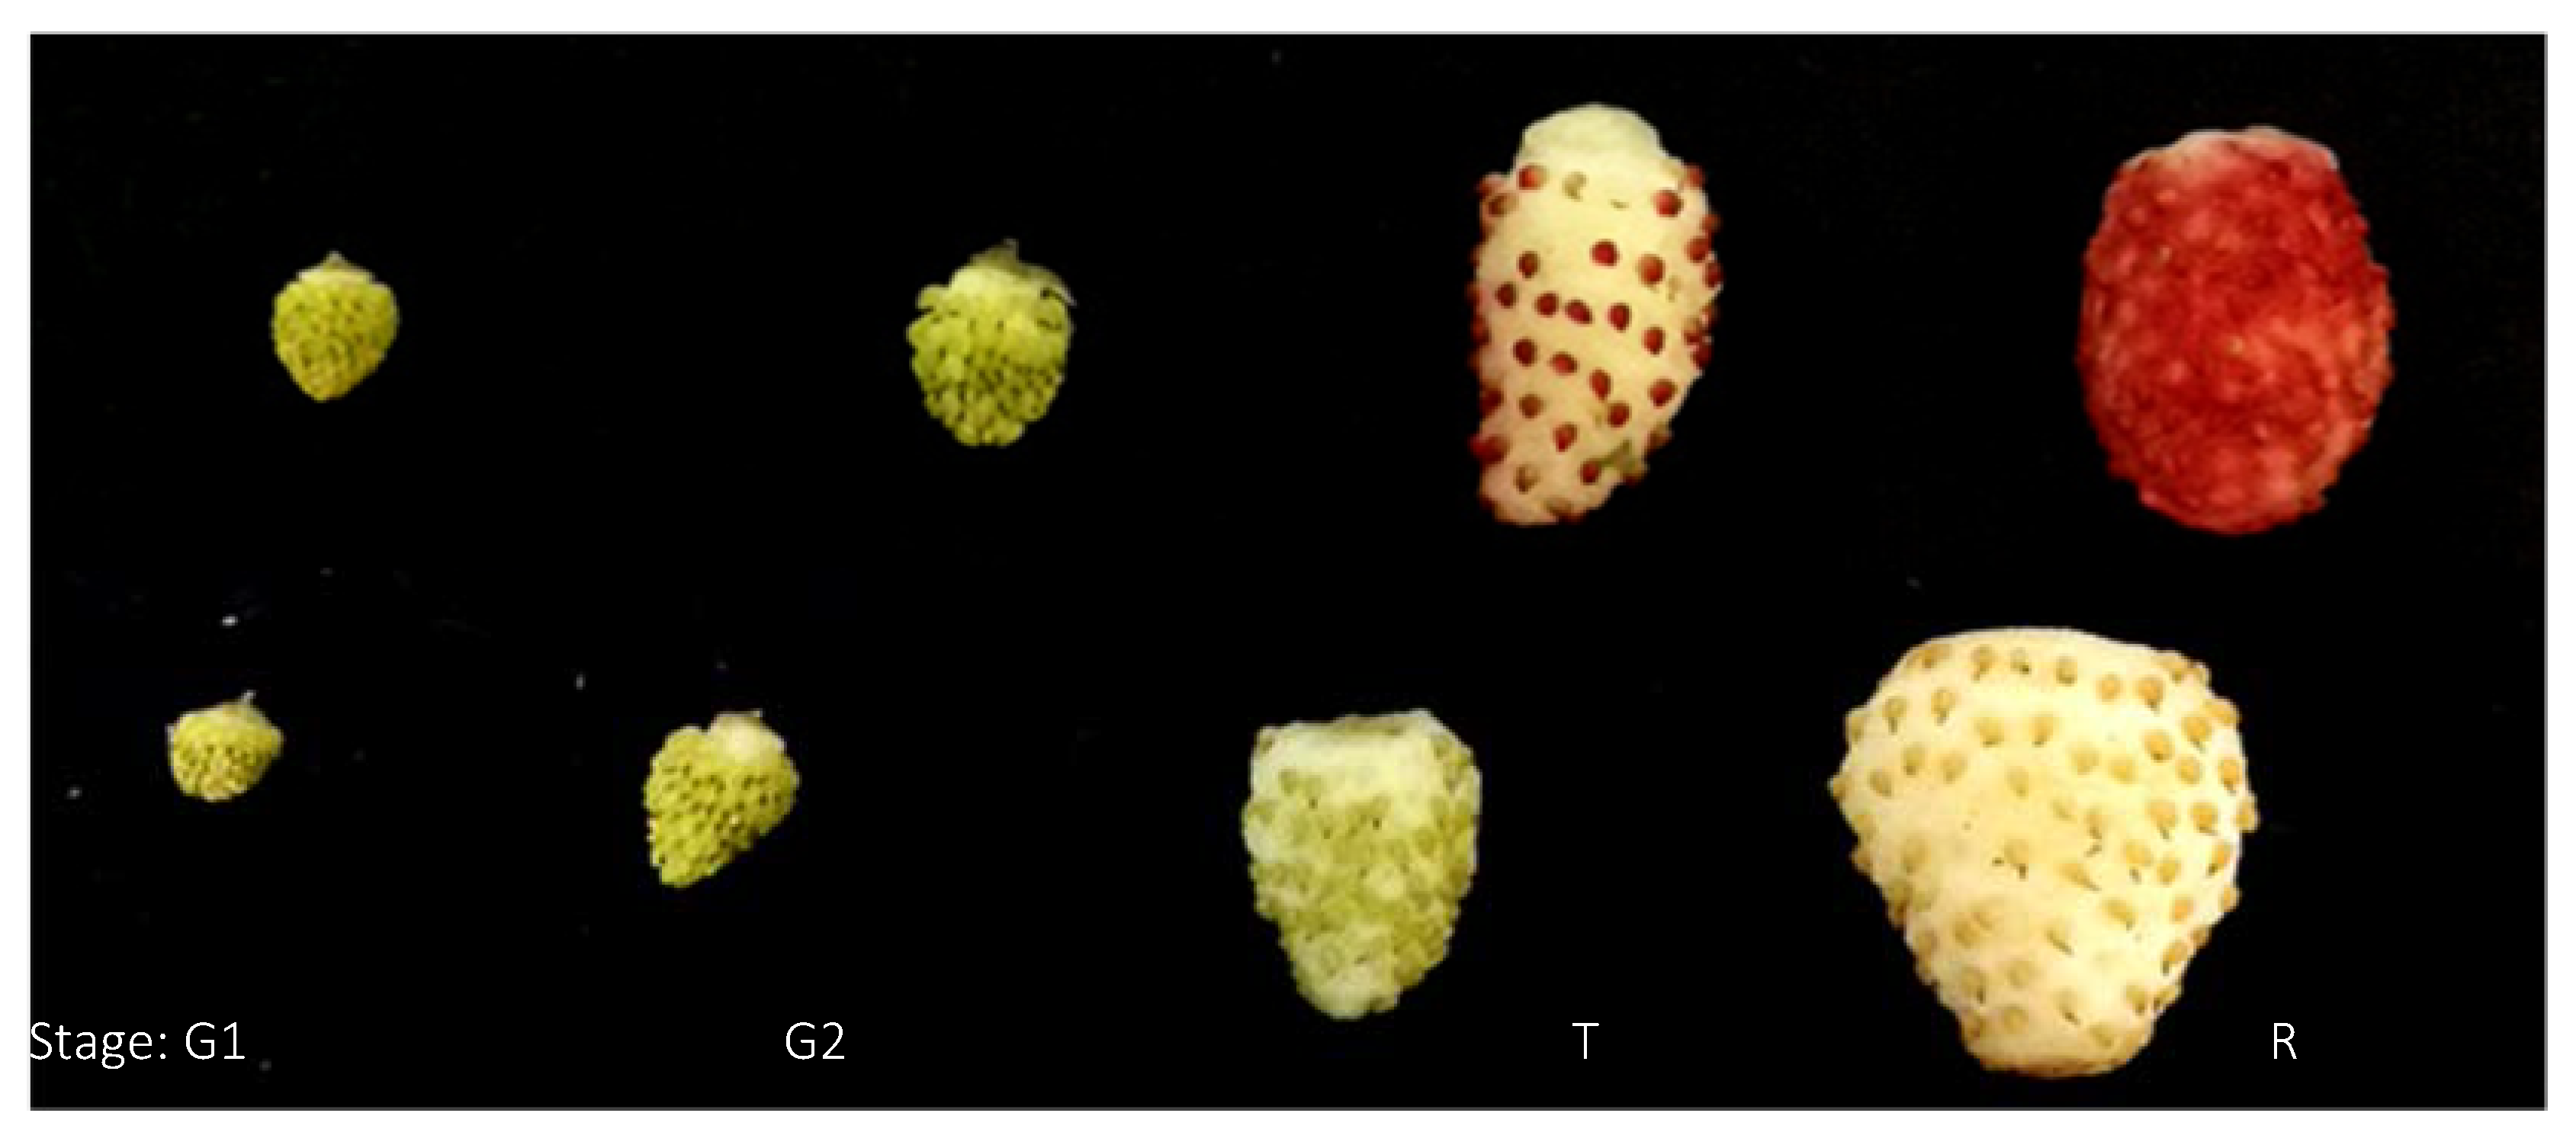
2.1. Plant Material

Two cultivars of F. vesca were used in the study; red-fruited Baron Solemacher (BS) and white-fruited Pineapple Crush (PC) were chosen because they were consistent and abundant fruit producers. Eight or more plants of each cultivar were grown in 1.5-L containers in MetroMix 360 (Scotts, Marysville, OH, USA), and were watered and fertilized as needed. The plants were grown outdoors from March to November in Lexington, KY. Fruit were harvested at four consecutive developmental stages: early green with no spacing between achenes (G1), intermediate green with spacing between achenes and a green receptacle exposed (G2), turning with the receptacle becoming pinkish-white for BS and white for PC (T), and ripe with a soft red receptacle for BS and soft white receptacle for PC (R) (Figure 1). Due to limited plant number and low fruit number per plant at any one time, berries were harvested as they were available and were combined within harvest intervals of variable length and across plants within a genotype until sufficient biomass had been collected. Upon harvest, fruit were immediately frozen in liquid N2 and stored at −80 °C until further use.

2.2. Fruit Extraction and Quantification of Target Phenolic Compounds by HPLC/MS

Using BS and PC berries from each development stage as an extraction (or biological) replicate, fruit were extracted using an acetone/water/acetic acid solution (70:29.5:0.5, v/v/v) and quantification of target phenolic compounds was carried out by high-performance liquid chromatography-mass spectrometry using external standards as described in Roy et al. [8]. Three extraction replicates were analyzed per genotype by developmental stage. If authentic standard was not available for a compound, a closely-related one was used and is indicated in the respective table. The mean values of each target compound must be considered as relative values as some were quantified using a different standard compound, and the values were not adjusted for possible matrix effects. The target compounds were classified into six groups: anthocyanins, flavonols, hydroxycinnamic acids, flavan-3-ols, and ellagitannins and ellagic acid derivatives, and a sum of the target compounds for each group was derived for each extraction replicate.

2.3. RNA Purification, cDNA Synthesis, and Cloning of Partial Sequence of Candidate Genes

Total RNA was isolated from each biological replicate according to the procedure of Reid et al. [31] using a CTAB spermidine extraction buffer. One μg of RNase-free DNase I treated total RNAs was reverse-transcribed using the Superscript III Reverse Transcriptase (Invitrogen, Carlsbad, CA, USA), following the manufacturer’s instructions. qRT-PCR was performed as described by Pattanaik et al. [32]. All PCR reactions were performed in triplicate and repeated two times. The comparative cycle threshold (Ct) method (Bulletin No. 2; Applied Biosystems, http://www.appliedbiosystems.com) was used to measure transcript levels. In addition, actin gene with constant expression levels through all fruit developmental stages was used to normalize raw data and to calculate relative expression levels.
Target genes were identified in the F. vesca genome by a Blast search using the known F. x ananassa and F. chiloensis genes: phenylalanine ammonia lyase 1 (PAL1), cinnamic acid 4-hydroxylase (C4H), hydroxycinnamate CoA ligase (4CL), chalcone synthase (CHS), chalcone isomerase (CHI), flavanone-3′-hydroxylase (F3′H), dihydroflavonol 4-reductase (DFR), leucoanthocyanidin reductase (LAR), anthocyanidin synthase (ANS), and UDP:flavonoid-O-glucosyltransferase 1 (UFGT1). In addition, the transcription factors MYB1 and MYB10 and the key ABA biosynthesis gene NCED1 and ABA receptor gene CHLH. The target F. vesca genes with the highest identity to those from the other species were selected for analyses of expression. The primers used for each target gene in the qRT-PCR analyses are listed in Table 1. Hartl et al. [14] identified a second isoform of some of the early pathway genes that we have characterized, but in all cases we studied one of the isoforms that they studied.

2.4. Statistical Analyses

Polyphenol content was statistically analyzed for the main effects of genotype, stage of development, and their interaction by two-way ANOVA (SigmaPlot 12.0, Systat Software, San Jose, CA, USA).

3. Results

3.1. Polyphenol Content—Development Stages

The polyphenolic compound levels measured at four consecutive developmental stages, G1, G2, T, and R, of red BS and white PC showed significant effects of genotype, stage of development, and their interaction on nearly all phenolic group sums (Table 2). Total hydroxycinnamic acid content increased from G1 to G2, declined from G2 to T, but increased by R in both red and white genotypes. Hartl et al. [15] reported similar increases of hydroxycinnamic esters in red F. vesca fruit, but not in white fruit. In contrast to our genotype comparison [8], there was little caffeic acid (data not shown) but a high quantity of ferulic acid, which is methylated caffeic acid, so ferulic acid was considered in the total rather than caffeic acid (Table 3). Total flavonol content (Table 2), mostly quercetin-3-glucoside (Table 3), was greater at G1 and declined by stage T in BS, but it was constant from G1 to T before declining at R in PC. The flavan-3-ol content was comprised mostly of proanthocyanidin at ripening (Table 3), and increased from G1 to G2 in both BS and PC, then declined by R. The most notable differences, of 2-fold or more, were a higher flavan-3-ol content in BS than PC at R, and much higher levels of the hydroxycinnamic acids at G1 and G2 in PC than BS. Red and white F. vesca, and red-fruited F. x ananassa have shown a generally decreasing level throughout fruit development [16,33]. Anthocyanin derivatives were by far the primary flavonoids to show the most contrasting results between a red and five white F. vesca [8], with virtually none in the white genotype.
Total ellagic acid derivative content was highest at the earliest stages of development of both genotypes (Table 2), with ellagic acid deoxyhexoside the most abundant at ripening (Table 3). Total ellagitannins declined from stage G1 to R, but PC had more total ellagitannin at R. Fait et al. [34] also reported a higher content of ellagitannins in achenes and receptacle of F. x ananassa fruit in the earlier stages of development. Gasperotti et al. [35] identified 26 ellagic acid derivatives and ellagitannins and observed that red F. vesca had a greater content than white F. vesca when ripe. Hartl et al. [15] noted more free ellagic acid in G1 than R fruit of one red and one white F. vesca, but the opposite in another white genotype.
The polyphenol composition of these two genotypes when fully ripe differed from their values in our genotype comparison [8]. Polyphenol composition has been shown to depend on factors such as genotype, maturity stage, and production site and environment [9,10,16,36,37,38,39]. The differing results may be due to one or more of these factors, but the most likely cause was production environment as the genotype comparison was performed with fruit from greenhouse-grown plants during the winter and this developmental study was from the same set of plants but grown outdoors under natural light and ambient conditions in summer.
The accumulation pattern of total polyphenols reflects two different directions of carbon flow, non-anthocyanin flavonoids versus the ellagic acid derivatives/ellagitannins, in red- and white-fruited F. vesca genotypes. The content of total hydroxycinnamic acids was greater in earlier stages of development in the white PC than the red BS. There was a significant reduction in total flavan-3-ols in white PC versus red BS at R, as was also found in four other white-fruited F. vesca genotypes in our previous study [8].
A higher content of EA derivatives and ellagitannins (Table 2) in white PC at the T and R stages suggested that the lower flux of metabolites into the phenylpropanoid/flavonoid pathways may have resulted in an increased metabolite flux into the shikimate pathway, increasing total ellagic/ellagitannin content. Five white F. vesca genotypes also had higher EA derivative content than a red genotype when ripe but did not differ or were lower in ellagitannin content [8].

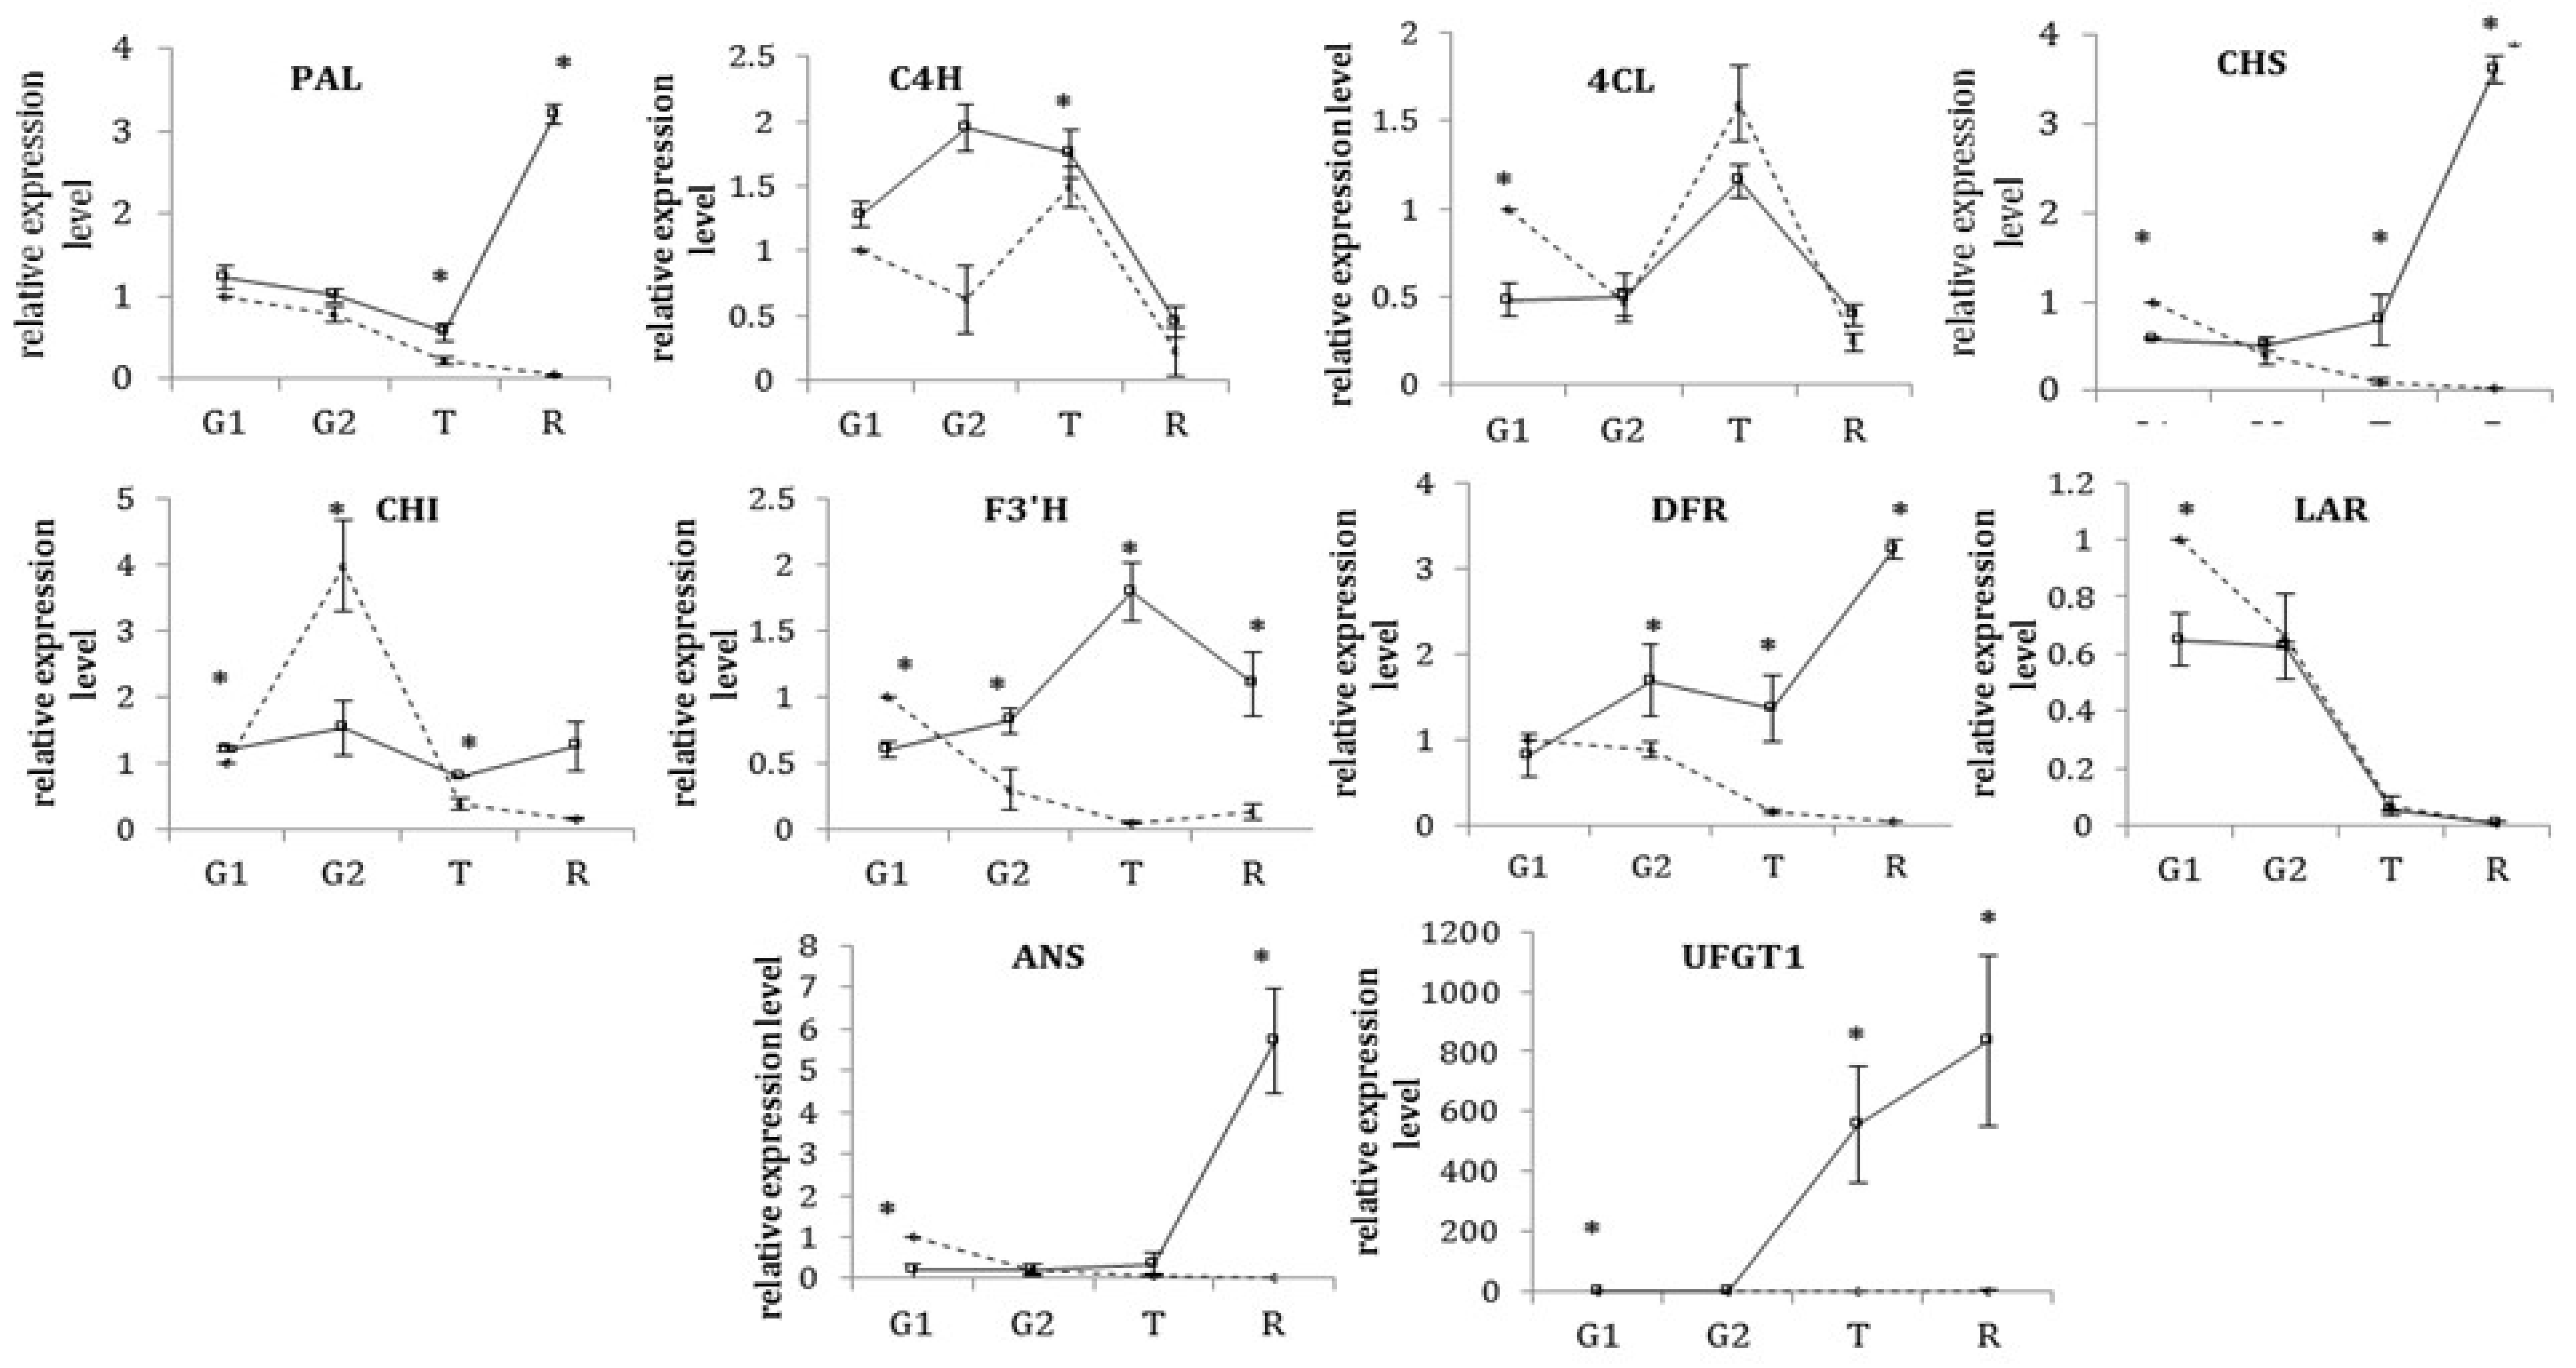
3.2. Transcriptional Profiles of the Structural Genes of the Phenylpropanoid/Flavonoid Biosynthetic Pathway during Development

Transcriptional profiles of the structural genes of the phenylpropanoid/flavonoid biosynthetic pathway at the four developmental stages, G1, G2, T, and R (Figure 1) of BS and PC were compared. The early biosynthetic pathway consists of three enzymes, phenylalanine ammonia lyase (PAL), cinnamic acid 4-hydroxylase (C4H) and 4-coumarate: CoA ligase (4CL). At the G1 and G2 stages, the first phenylpropanoid pathway gene PAL, the enzyme responsible for catalyzing the trans-elimination of ammonia from phenylalanine and producing trans-cinnamic acid [17], showed similar expression in the red and white genotypes, but at the T stage PAL was higher in BS than PC, though transcript abundance had declined in both (Figure 2). PAL was significantly upregulated in red BS at the final R stage, but there was no change in white PC. Although a significant reduction in PAL expression as found in PC could greatly reduce the major products in the phenylpropanoids/flavonoid biosynthetic pathway, Hartl et al. [15] found a higher expression of PAL in green fruit of red and white F. vesca, but little to no expression later in development.
Few differences between genotypes were observed in the expression patterns of C4H and 4CL. C4H was greater in BS at T only, and 4CL was greater in PC at G1 only. The next enzyme in the pathway, CHS, was greater at G1 in PC, did not differ between genotypes at G2, but was greater in BS at T and R. Similar patterns were observed during fruit development of red and white F. vesca fruit [15,40,41], red and white forms of F. chiloensis [17], and in several red F. x ananassa genotypes [16,33].
Transcript abundance of both PAL and CHS were significantly lower in white PC than red BS fruit at stages T and R (Figure 2) as anthocyanin production was increasing in the latter genotype (Table 1 and Table 2). Although C4H and 4CL, the two enzymes in the biosynthetic pathway between PAL and CHS, did not show clear differences between the red and white forms, greater levels of hydroxycinnamic acids in PC than BS (Table 1) at G1 and G2 may indicate a redirection to that pool due to reduced expression of CHS. In white-fruited F. chiloensis, lack of C4H expression was accompanied by increased hydroxycinnamic compound content [42,43].
The transcript abundance of CHI was significantly higher in the G2 stage of PC, but less than BS at stages T and R. The abundance of F3′H transcript was significantly different in all stages of fruit development, with PC greater than BS at stage G1, but less at all subsequent stages. The expression profile of DFR in red F. vesca was greater than of the white form from G2 to R stages, with an increase from T to R in the red and a decline in the white. These differing patterns for transcript abundance of CHI, F3′H and DFR were also reported for red and white F. vesca [15,40,41,44]. After DFR, transcript abundance for LAR, the biosynthetic gene specific for proanthocyanidin production, decreased from G1 to R for both red and white genotypes. Interestingly, in the initial green stage G1, the expression level was significantly higher in white PC than in red BS, as reported by Xu et al. [40] suggesting most proanthocyanidins were produced in early development. Proanthocyanidin accumulation also takes place rapidly in the early stages of fruit development in F. x ananassa [16,36], with higher transcript abundance of LAR prior to ripening in F. x ananassa [16,35] and in red and white forms of F. chiloensis [17], and F. vesca [40].
In contrast to LAR transcript abundance, the anthocyanin-related genes ANS and UFGT1 were significantly upregulated late in fruit development in red BS only, at R for ANS and at T and R for UFGT1, patterns reported by others [15,40,41]. UFGTs catalyze transfer of glucose from UDP-activated sugar donor molecules to flavonols and anthocyanidins, and act more as a modifying enzyme for anthocyanins [19] and are considered one of the key enzymes determining the accumulation of anthocyanin glycosides and the hue of fully ripe fruit. Silencing of FaGT1 in F. x ananassa showed reduced levels of pelargonidin 3-glucoside malonate and pelargonidin 3-glucoside [45]. In the present study, there were very low but detectable levels of UFGT transcript throughout fruit development in white PC.
The low levels of flavan-3-ols in immature fruit and at R of white PC may have resulted from low expression of F3′H and DFR. In red F. x ananassa [15,44] and F. vesca (Table 2) [44], an increase of transcript abundance of the anthocyanin-related genes ANS and UFGT accounted for the accumulation of anthocyanins. The low transcript level of ANS and UFGT at R in white F. vesca likely led to the near absence of anthocyanin accumulation. White F. chiloensis fruit also showed down-regulation of the anthocyanin-related genes ANS and UFGT during ripening in comparison to a red form [17].
Some expression studies of octoploid strawberry (F. x ananassa) have shown biphasic upregulation patterns for CHS, CHI, LAR and ANS during fruit development [18,37,46] with high expression at the early stages of development followed by a subsequent decrease, and upregulation again at the T stage. In the present study, this pattern was not observed. Rather, the present results generally agree with those for red- and white-fruited F. vesca reported by Xu et al. [40] that red F. vesca expression patterns were variable among key genes but no dominant or biphasic pattern was evident.

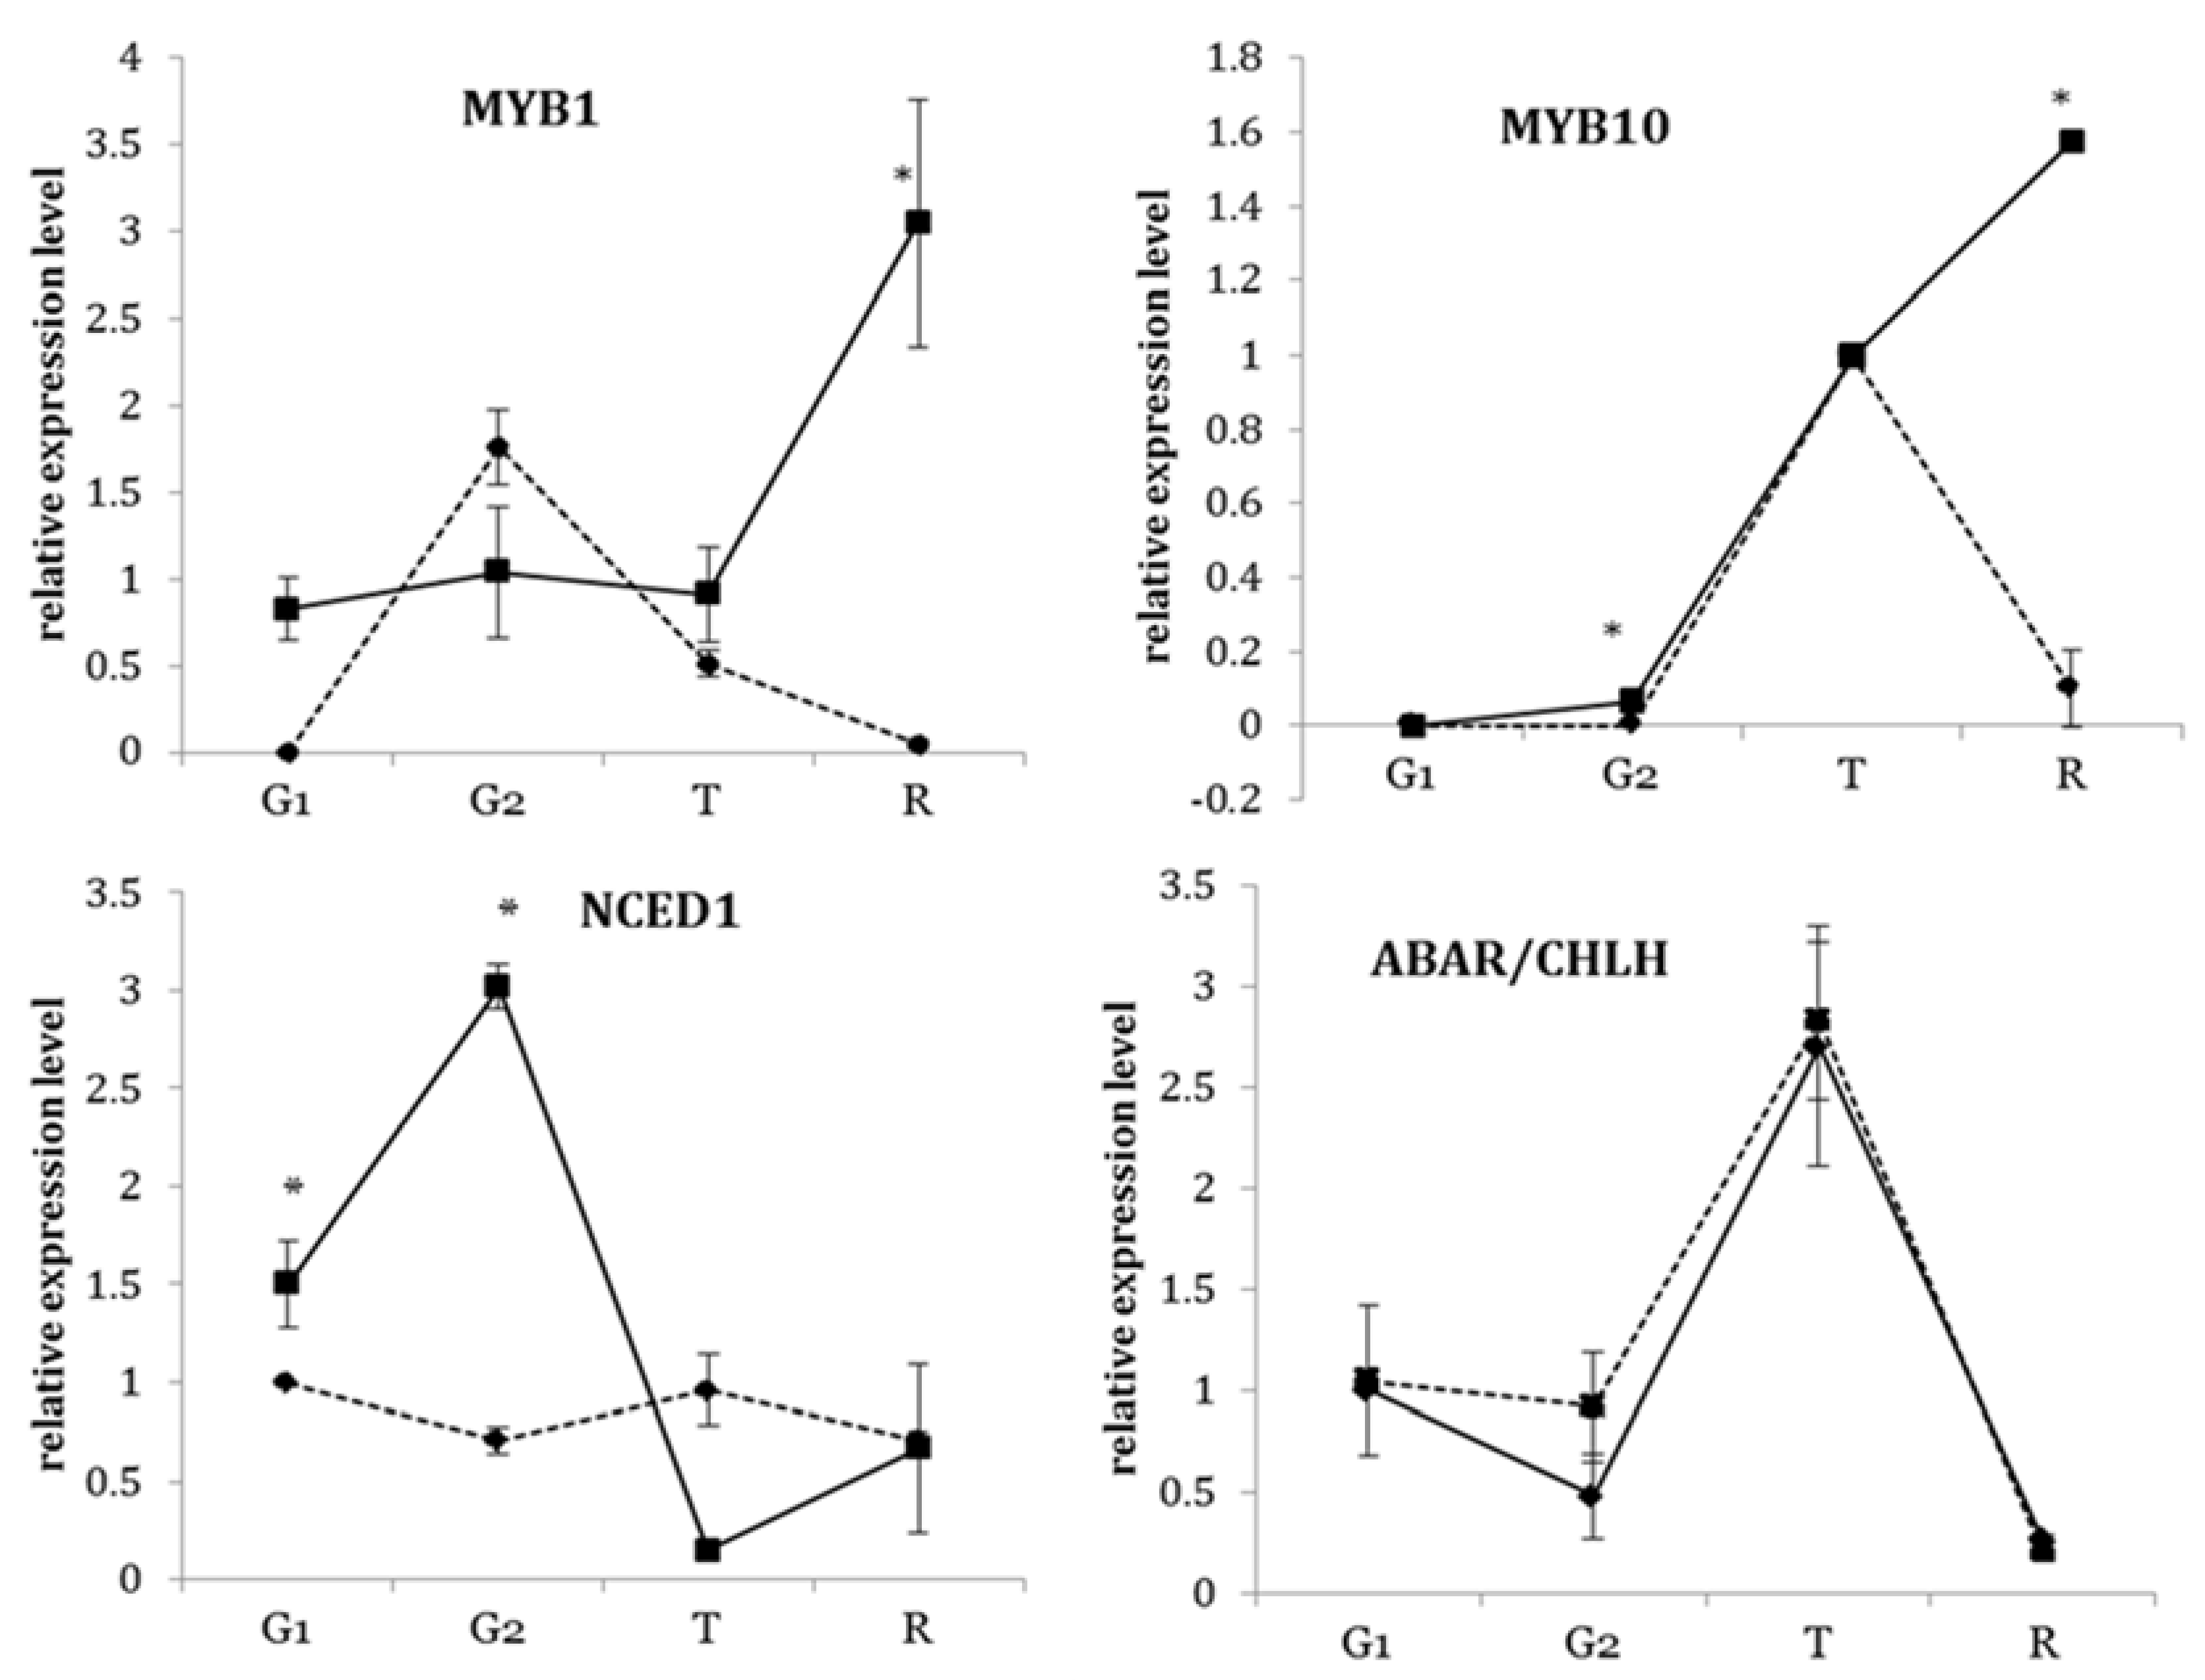
3.3. Transcriptional Profiles of Key Transcription Factors of the Flavonoid Biosynthetic Pathway during Development

The expression profiles of the transcription factors (TFs) revealed that the anthocyanin production promoter MYB10 and repressor MYB1 were both significantly lower at the R stage in white PC than in red BS (Figure 3).
The transcript levels of the anthocyanin production repressor MYB1 in this study differ from those for FaMYB1 in red F. x ananassa [47], and in red F. vesca [28], seeming to increase at R rather than declining, indicating that it was not functioning as a repressor. In a white F. chiloensis, FcMYB1 was also high at T and R, suppressing anthocyanin accumulation [19]. However, Zhang et al. [41] also found that MYB1 expression was much lower in a white than a red-fruited F. vesca, so the role of MYB1 differs in F. vesca from its role in F. x ananassa and F. chiloensis. Medina-Puche et al. [29] suggested that MYB10 may regulate most or all of the flavonoid pathway genes in the early and late stages of fruit development in F. x ananassa. There was no apparent expression of MYB10 at G1 and more expression in red than white at G2 in our study, as with FaMYB10 in F. x ananassa [29,47], but MYB10 was lower in white PC at stage R in comparison to BS. Overexpression of FvMYB10 in F. vesca greatly increased anthocyanin concentration [26], but other flavonoid levels were not affected except for p-coumaroyl glucose, suggesting MYB10 may only act on the final anthocyanin-related branch. However, FaMYB10 and FvMYB10 may have different roles in regulating ANS as FaMYB10-silenced lines had unchanged ANS levels, which indicated that regulation of ANS was not dependent on FaMYB10 [27]. In contrast, only heavily FvMYB10-silenced lines exhibited downregulation of ANS gene expression along with lower expression of CHS, F3′H, DFR and UFGT [26,27]. Low MYB1 and MYB10 expression at stage R in PC in our study was coincident with downregulation of the anthocyanin biosynthesis genes ANS and UFGT1 as well as PAL, CHS, F3′H, and DFR suggesting that either or both may regulate these anthocyanin-related genes in F. vesca. Low MYB10 expression in our study, a possible proximal cause of lack of anthocyanin accumulation in PC, stands in contrast to other studies; a lack of differential expression in MYB10 between red and white genotypes [43], and higher MYB10 expression in a white than a red genotype [16]. Both studies used different red genotypes and white Yellow Wonder. In the former study [43], it was observed that expression level may not be important but a rather missense mutation resulting in a dysfunctional MYB10 that leads to the loss of anthocyanin was identified. These contrasting results among studies reinforce the need to study each unique genotype for the basis of its lack of anthocyanin accumulation and not make assumptions from individual studies.
Perhaps other TFs, MYB10 or MYB1 isoforms, or co-factors exist that need to be identified for a full understanding of regulation of flavonoid biosynthesis in F. vesca. Starkevič et al. [48] reported that the homologs PaMYB10.1 and PaMYB10.2 were isolated in sweet cherry (Prunus avium), and subvariant gene PaMYB10.1-1 of variant PaMYB10.1 showed higher expression in fruit with higher anthocyanin content and was highly correlated with the expression of PaUFGT, whereas subvariant PaMYB10.1-3 showed low levels of expression in fruit. Another expression analysis of four candidate MYB transcription factors, homologous to those in P. avium L., MYB10, MYB11, MYB111 of apple (Malus x domestica) and a putative MYB transcription factor of Rosa rugose, showed a higher transcript accumulation in red sweet cherry in comparison to the yellow fruit in the later fruit development stages [49]. In F. x ananassa, two regulatory genes, FaMYB9 and FaMYB11, interacted with FaTTG1 to regulate proanthocyanidin accumulation during early stages of fruit development [50]. The expression of FaANS was influenced by FaMYB5 but not by FaMYB10, although this needs further confirmation. These observations suggest complex roles of MYBs in the regulation of anthocyanin and other flavonoid biosynthesis. Further work is required to determine if any other homologs of MYB10 may play a direct regulatory role in anthocyanin production in F. vesca.

3.4. Transcriptional Profiles of ABA-Related Genes in Strawberry Fruit at Different Developmental Stages

A significantly higher transcript abundance of the key ABA biosynthetic gene NCED1 was observed in BS at stages G1 and G2, though it declined by T and R and was similar to PC (Figure 3), suggesting a decline in the biosynthesis of ABA when fruit were starting to ripen. In contrast, the transcript levels of the ABA biosynthetic gene NCED1 varied little during fruit development in PC, suggesting ABA biosynthesis was occurring. In F. x ananassa, FaNCED1 generally increased during development [29] correlated with an increase in fruit ABA content. There were no differences in the expression patterns for the ABA receptor gene ABAR/CHLH between the red and white genotypes, although the transcript abundance in both was upregulated at T near the time the ripening process commenced. In contrast, transcript levels of FaABAR/CHLH were higher in green fruit than in turning and red fruit in F. x ananassa [30]. F. x ananassa fruit agroinfiltrated with FaNCED1-RNAi constructs or treated with the ABA inhibitor nordihydroguaiaretic acid (NDGA) showed lack of red color development and a decrease in FaMYB10 transcript levels [29]. Expression of FaMYB10 was correlated with the presence of ABA in the fruit. Also, treatment of F. x ananassa fruit with ABA increased FaMYB10 transcript levels [51]. Thus, ABA may act by increasing FaMYB10 and consequently multiple genes related to anthocyanin production, but expression patterns of NCED and ABA/CHLR were not correlated to the decline in MYB10 expression in white PC fruit, so ABA biosynthesis and perception were not altered in the fruit.

4. Conclusions

The accumulation and distribution of polyphenols are governed by a metabolic network that is strongly connected to and co-regulated with the expression of structural and regulatory genes of the phenylpropanoid/flavonoid biosynthetic pathway [18,37,47,50,52]. Transcriptional studies of the key genes of the multiple-routed pathway with a diversity of end products were performed to provide insight into the patterns of metabolite flux during fruit development in red- versus white-fruited F. vesca. Expression of all pathway genes differed between the red BS and white PC at one or more times during development. Differences in expression of multiple genes suggest that a TF such as MYB10 was responsible. MYB10 was significantly lower in white PC than red BS during the ripening period only, when anthocyanin accumulated in BS. At earlier sampling times, they did not significantly differ. Thus, lack of MYB10 expression that then lowered the expression of several genes may be a more likely cause of loss of anthocyanin accumulation in PC than loss of expression of a single structural gene, though it may not be the cause of the differences early in development. This is also a different situation than the cause of the lack of anthocyanin in the white F. vesca Yellow Wonder as noted above [16,43], supporting our hypothesis that not all white F. vesca genotypes share the same mutation(s) [8]. Our data also showed that it is unlikely that ABA was involved as the expression of the key ABA biosynthesis and receptor genes did not differ between genotypes, at least during the ripening period. The possibility that other known, or as yet undiscovered, TFs or isoforms may play essential roles in pathway regulation in F. vesca, as has recently been described for F. x ananassa [47,50,51], needs to be addressed. The present study provides a basis for exploring these possibilities.

Author Contributions

S.R. and D.D.A. conceived and designed the experiments. S.R. performed the experiments. S.S. designed and supervised the protocol for the gene expression analyses. All authors wrote and edited the final version.

Funding

This research received no external funding.

Acknowledgments

The information reported in this paper (No. 18-11-087) is part of a project of the Kentucky Agricultural Experiment Station and is published with the approval of the Director. The authors would like to thank John May, Research Facility Manager, Environmental Research Training Laboratories, University of Kentucky, for his technical advice and expertise in the LC-MS analyses.

Conflicts of Interest

The authors declare no conflict of interest.

References

  1. Lattanzio, V.M.T.; Cardinali, A. Role of phenolics in the resistance mechanisms of plants against fungal pathogens and insects. Phytochem. Adv. Res. 2006, 661, 23–67. [Google Scholar]
  2. Buendía, B.; Gil, M.I.; Tudela, J.A.; Gady, A.; Medina, J.J.; Soria, C.; López, J.M.; Tomás-Barberán, F. HPLC-MS analysis of proanthocyanidin oligomers and other phenolics in 15 strawberry cultivars. J. Agric. Food Chem. 2010, 58, 3916–3926. [Google Scholar] [CrossRef] [PubMed]
  3. Aaby, K.; Mazur, S.; Nes, A.; Skrede, G. Phenolic compounds in strawberry (Fragaria x ananassa Duch.) fruits: Composition in 27 cultivars and changes during ripening. Food Chem. 2012, 132, 86–97. [Google Scholar] [CrossRef] [PubMed]
  4. Muňoz, C.; Sanchez-Sevilla, J.; Botella, M.A.; Hoffmann, T.; Schwab, W.; Valpuesta, V. Polyphenol composition in the ripe fruits of Fragaria species and transcriptional analyses of key genes in the pathway. J. Agric. Food Chem. 2011, 59, 12598–12604. [Google Scholar] [CrossRef] [PubMed]
  5. Simirgiotis, M.J.; Schmeda-Hirschmann, G. Determination of phenolic composition and antioxidant activity in fruits, rhizomes and leaves of the white strawberry (Fragaria chiloensis spp. chiloensis form chiloensis) using HPLC-DAD-ESI-MS and free radical quenching techniques. J. Food Comp. Anal. 2010, 23, 545–553. [Google Scholar] [CrossRef]
  6. Duan, W.; Sun, P.; Li, J. Expression of genes involved in the anthocyanin biosynthesis pathway in white and red fruits of Fragaria pentaphylla and genetic variation in the dihydroflavonol-4-reductase gene. Biochem. Syst. Ecol. 2017, 72, 40–46. [Google Scholar] [CrossRef]
  7. Del Bubba, M.; Checchini, L.; Chiuminatto, U.; Doumett, S.; Fibbi, D.; Giordani, E. Liquid chromatographic/electrospray ionization tandem mass spectrometric study of polyphenolic composition of four cultivars of Fragaria vesca L. berries and their comparative evaluation. J. Mass Spectrom. 2012, 47, 1207–1220. [Google Scholar] [CrossRef] [PubMed]
  8. Roy, S.; Wu, B.; Liu, W.; Archbold, D. Comparative analyses of polyphenolic composition of Fragaria spp. color mutants. Plant Physiol. Biochem. 2018, 125, 255–261. [Google Scholar] [CrossRef] [PubMed]
  9. Josuttis, M.; Verrall, S.; Stewart, D.; Krüger, E.; McDougall, G.J. Genetic and environmental effects on tannin composition in strawberry (Fragaria × ananassa) cultivars grown in different European locations. J. Agric. Food Chem. 2013, 61, 790–800. [Google Scholar] [CrossRef] [PubMed]
  10. Palmieri, L.; Masuero, D.; Martinatti, P.; Baratto, G.; Martens, S.; Vrhovsek, U. Genotype-by-environment effect on bioactive compounds in strawberry (Fragaria x ananassa Duch.). J. Sci. Food Agric. 2017, 97, 4180–4189. [Google Scholar] [CrossRef] [PubMed]
  11. Folta, K.M.; Davis, T.M. Strawberry Genes and Genomics. Crit. Rev. Plant Sci. 2006, 25, 399–415. [Google Scholar] [CrossRef]
  12. Slovin, J.P.; Schmitt, K.; Folta, K.M. An inbred line of the diploid strawberry Fragaria vesca f. semperflorens for genomic and molecular genetic studies in the Rosaceae. Plant Methods 2009, 5, 15. [Google Scholar] [CrossRef] [PubMed]
  13. Shulaev, V.; Sargent, D.J.; Crowhurst, R.N.; Mockler, T.C.; Folkerts, O.; Delcher, A.L.; Jaiswal, P.; Mockaitis, K.; Liston, A.; Mane, S.P.; et al. The genome of woodland strawberry (Fragaria vesca). Nat. Genet. 2011, 43, 109–116. [Google Scholar]
  14. Sun, J.; Liu, X.; Yang, T.; Slovin, J.; Chen, P. Profiling polyphenols of two diploid strawberry (Fragaria vesca) inbred lines using UHPLC-HRMSn. Food Chem. 2014, 146, 289–298. [Google Scholar] [CrossRef] [PubMed]
  15. Hartl, K.; Denton, A.; Franz-Oberdorf, K.; Hoffmann, T.; Spornraft, M.; Usadel, B.; Schwab, W. Early metabolic and transcriptional variations in fruit of natural white-fruited Fragaria vesca genotypes. Sci. Rep. 2017, 7, 1–16. [Google Scholar] [CrossRef] [PubMed]
  16. Carbone, F.; Preuss, A.; De Vos, R.C.H.; D’Amico, E.; Perrotta, G.; Bovy, A. Developmental, genetic and environmental factors affect the expression of flavonoid genes, enzymes and metabolites in strawberry fruits. Plant Cell Environ. 2009, 32, 1117–1131. [Google Scholar] [CrossRef] [PubMed]
  17. Salvatierra, A.; Pimentel, P.; Moya-Leon, M.A.; Caligari, P.D.S.; Herrera, R. Comparison of transcriptional profiles of flavonoid genes and anthocyanin contents during fruit development of two botanical forms of Fragaria chiloensis ssp. chiloensis. Phytochemistry 2010, 71, 1839–1847. [Google Scholar] [CrossRef] [PubMed]
  18. Takos, A.M.; Jaffe, F.W.; Jacob, S.R.; Bogs, J.; Robinson, S.; Walker, A. Light–induced expression of a MYB gene regulates anthocyanin biosynthesis in red apples. Plant Physiol. 2006, 142, 1216–1232. [Google Scholar] [CrossRef] [PubMed]
  19. Ban, Y.; Honda, C.; Hatsuyama, Y.; Igarashi, M.; Bessho, H.; Moriguchi, T. Isolation and functional analysis of a MYB transcription factor gene that is a key regulator for the development of red coloration in apple skin. Plant Cell Physiol. 2007, 48, 958–970. [Google Scholar] [CrossRef] [PubMed]
  20. Changne, D.; Carlisle, C.M.; Blond, C.; Volz, R.K.; Whitworth, C.J.; Oraguzie, N.C.; Crowhurst, R.N.; Allan, A.C.; Espley, R.V.; Hellens, R.P.; et al. Mapping a candidate gene (MdMYB10) for red flesh and foliage colour in apple. BMC Genom. 2007, 8, 212. [Google Scholar] [CrossRef] [PubMed] [Green Version]
  21. Lin-Wang, K.; Bolitho, K.; Grafton, K.; Kortstee, A.; Karunairetnam, S.; McGhie, T.K.; Espley, R.V.; Hellens, R.P.; Allan, A.C. An R2R3 MYB transcription factor associated with regulation of the anthocyanin biosynthetic pathway in Rosaceae. BMC Plant Biol. 2010, 10, 549–553. [Google Scholar] [CrossRef] [PubMed] [Green Version]
  22. Kobayashi, S.; Goto-Yamamoto, N.; Hirochika, H. Retrotransposon induced mutations in grape skin color. Science 2004, 304, 982. [Google Scholar] [CrossRef] [PubMed]
  23. Walker, A.R.; Lee, E.; Bogs, J.; McDavid, D.A.J.; Thomas, M.R.; Robinson, S.P. White grapes arose through the mutation of two similar and adjacent regulatory genes. Plant J. 2007, 49, 772–785. [Google Scholar] [CrossRef] [PubMed] [Green Version]
  24. Rahim, M.A.; Busatto, N.; Trainotti, L. Regulation of anthocyanin biosynthesis in peach fruits. Planta 2014, 240, 913–929. [Google Scholar] [CrossRef] [PubMed]
  25. Ravaglia, D.; Espley, R.V.; Henry-Kirk, R.A.; Andreotti, C.; Ziosi, V.; Hellens, R.P.; Costa, G.; Allan, A.C. Transcriptional regulation of flavonoid biosynthesis in nectarine (Prunus persica) by a set of R2R3 MYB transcription factors. BMC Plant Biol. 2013, 13, 68. [Google Scholar] [CrossRef] [PubMed] [Green Version]
  26. Lin-Wang, K.; McGhie, T.K.; Wang, M.; Liu, Y.; Warren, B.; Storey, R.; Espley, R.V.; Allan, A.C. Engineering the anthocyanin regulatory complex of strawberry (Fragaria vesca). Front. Plant Sci. 2014, 5, 651. [Google Scholar] [CrossRef] [PubMed]
  27. Medina-Puche, L.; Cumplido-Laso, G.; Amil-Ruiz, F.; Hoffmann, T.; Ring, L.; Rodríguez-Franco, A.; Luis Caballero, J.; Schwab, W.; Muñoz-Blanco, J.; Blanco-Portales, R. MYB10 plays a major role in the regulation of flavonoid/phenylpropanoid metabolism during ripening of Fragaria x ananassa fruits. J. Exp. Bot. 2014, 65, 401–417. [Google Scholar] [CrossRef] [PubMed]
  28. Boss, P.K.; Davis, C.; Robinson, S.P. Analysis of the expression of anthocyanin pathway genes in developing Vitis vinifera. Plant Physiol. 1996, 111, 1059–1066. [Google Scholar] [CrossRef] [PubMed]
  29. Jia, H.F.; Chai, Y.M.; Li, C.L.; Lu, D.; Luo, J.J.; Qin, L.; Shen, Y.Y. Abscisic acid plays an important role in the regulation of strawberry fruit ripening. Plant Physiol. 2011, 157, 188–199. [Google Scholar] [CrossRef] [PubMed]
  30. Li, D.; Li, L.; Luo, Z.; Mou, W.; Mao, L.; Ying, T. Comparative transcriptome analysis reveals the influence of absicisic acid on the metabolism of pigments, ascorbic acid and folic acid during strawberry fruit ripening. PLoS ONE 2015, 10, e0130037. [Google Scholar] [CrossRef]
  31. Reid, K.; Olsson, N.; Schlosser, J.; Peng, F.; Lund, S. An optimized grapevine RNA isolation procedure and statistical determination of reference genes for real-time RT-PCR during berry development. BMC Plant Biol. 2006, 6, 27. [Google Scholar] [CrossRef] [PubMed]
  32. Pattanaik, S.; Kong, Q.; Zaitlin, D.; Werkman, J.R.; Xie, C.H.; Patr, B.; Yuan, L. Isolation and functional characterization of a floral tissue-specific R2R3 MYB regulator from tobacco. Planta 2010, 231, 1061–1076. [Google Scholar] [CrossRef] [PubMed]
  33. Almeida, J.R.M.; D’Amico, E.; Preuss, A.; Carbone, F.; de Vos, C.H.R.; Deiml, B.; Mourgues, F.; Perrotta, G.; Fischer, T.C.; Bovy, A.G.; et al. Characterization of major enzymes and genes involved in flavonoid and proanthocyanidin biosynthesis during fruit development in strawberry (Fragaria x ananassa). Arch. Biochem. Biophys. 2007, 465, 61–71. [Google Scholar] [CrossRef] [PubMed]
  34. Fait, A.; Hanhineva, K.; Beleggia, R.; Dai, N.; Rogachev, I.; Nikiforova, V.J.; Fernie, A.R.; Aharoni, A. Reconfiguration of the achene and receptacle metabolic networks during strawberry fruit development. Plant Physiol. 2008, 148, 730–750. [Google Scholar] [CrossRef] [PubMed]
  35. Gasperotti, M.; Masuero, D.; Guella, G.; Palmieri, L.; Martinatti, P.; Pojer, E.; Mattivi, F.; Vrhovsek, U. Evolution of ellagitannin content and profile during fruit ripening in Fragaria spp. J. Agric. Food Chem. 2013, 61, 8597–8607. [Google Scholar] [CrossRef] [PubMed]
  36. Kosar, M.; Kafkas, E.; Paydas, S.; Baser, K.H.C. Phenolic composition of strawberry genotypes at different maturation stages. J. Agric. Food Chem. 2004, 52, 1586–1589. [Google Scholar] [CrossRef] [PubMed]
  37. Bacchella, R.; Testoni, A.; ScalzoI, R. Influence of genetic and environmental factors on chemical profile and antioxidant potential of commercial strawberry (Fragaria × anannasa Duchesne). Electron. J. Environ. Agric. Food Chem. 2009, 8, 230–242. [Google Scholar]
  38. Doumett, S.; Fibbi, D.; Cincinelli, A.; Giordani, E.; Nin, S.; Del Bubba, M. Comparison of nutritional and nutraceutical properties in cultivated fruits of Fragaria vesca L. produced in Italy. Food Res. Int. 2011, 44, 1209–1216. [Google Scholar] [CrossRef]
  39. Urrutia, M.; Schwab, W.; Hoffmann, T.; Monfort, A. Genetic dissection of the (poly) phenol profile of diploid strawberry (Fragaria vesca) fruits using a NIL collection. Plant Sci. 2016, 242, 151–168. [Google Scholar] [CrossRef] [PubMed]
  40. Xu, W.; Peng, H.; Yang, T.; Whitaker, B.; Huang, L.; Sun, J.; Chen, P. Effect of calcium on strawberry fruit flavonoid pathway gene expression and anthocyanin accumulation. Plant Physiol. Biochem. 2014, 82, 289–298. [Google Scholar] [CrossRef] [PubMed]
  41. Zhang, Y.; Li, W.; Dou, Y.; Zhang, J.; Jiang, G.; Miao, L.; Han, G.; Liu, Y.; Li, H.; Zhang, Z. Transcript quantification by RNA-Seq reveals differentially expressed genes in the red and yellow fruits of Fragaria vesca. PLoS ONE 2015, 10, e0144356. [Google Scholar] [CrossRef] [PubMed]
  42. Saud, G.; Carbone, F.; Perrotta, G.; Figueroa, C.R.; Moya, M.; Herrera, R.; Retamales, J.B.; Carrasco, B.; Cheel, J.; Schmeda-Hirschmann, G.; et al. Transcript profiling suggests transcriptional repression of the flavonoid pathway in the white-fruited Chilean strawberry, Fragaria chiloensis (L.) Mill. Genet. Resour. Crop Evol. 2009, 56, 895–903. [Google Scholar] [CrossRef]
  43. Cheel, J.; Theoduloz, C.; Rodrıguez, J.A.; Caligari, P.D.S.; Schmeda-Hirschmann, G. Free radical scavenging activity and phenolic content in achenes and thalamu from Fragaria chiloensis ssp. chiloensis, F. vesca and F. x ananassa cv. Chandler. Food Chem. 2017, 102, 36–44. [Google Scholar] [CrossRef]
  44. Thill, J.; Silvija, M.; Gotame, T.P.; Mikulic-Petkovsek, M.; Gosch, C.; Verbric, R.; Preuss, A.; Schwab, W.; Stamper, F.; Stich, K.; et al. Differential expression of flavonoid 3’-hydroxylase during fruit development establishes the different B-ring hydroxylation patterns of flavonoids in Fragaria x ananassa and Fragaria vesca. Plant Physiol. Biochem. 2013, 72, 72–78. [Google Scholar] [CrossRef] [PubMed]
  45. Griesser, M.; Hoffmann, T.; Bellido, M.L.; Rosati, C.; Fink, B.; Kurtzer, R.; Aharoni, A.; Munoz-Blanco, J.; Schwab, W. Redirection of flavonoid biosynthesis through the down-regulation of an anthocyanidin glucosyltransferase in ripening strawberry fruit. Plant Physiol. 2008, 146, 1528–1539. [Google Scholar] [CrossRef] [PubMed]
  46. Halbwirth, H.; Puhl, I.; Haas, U.; Jezik, K.; Treutter, D.; Stich, K. Two-phase flavonoid formation in developing strawberry (Fragaria x ananassa) fruit. J. Agric. Food Chem. 2006, 541, 479–1485. [Google Scholar] [CrossRef] [PubMed]
  47. Hu, P.; Li, G.; Zhao, X.; Zhao, F.; Li, L.; Zhou, H. Transcriptome profiling by RNA-Seq reveals differentially expressed genes related to fruit development and ripening characteristics in strawberries (Fragaria x ananassa). Peer J. 2018, 6, e4976. [Google Scholar] [CrossRef] [PubMed]
  48. Starkevič, P.; Paukštytė, J.; Kazanavičiūtė, V.; Denkovskienė, E.; Stanys, V.; Bendokas, V. Expression and anthocyanin biosynthesis modulating potential of sweet cherry (Prunus avium L.) MYB10 and bHLH genes. PLoS ONE 2015, 10, e0126991. [Google Scholar] [CrossRef] [PubMed]
  49. Wei, H.; Chen, X.; Zong, X.; Shu, H.; Gao, D.; Liu, Q. Comparative transcriptome analysis of genes involved in anthocyanin biosynthesis in the red and yellow fruits of sweet cherry (Prunus avium L.). PLoS ONE 2015, 10, e0121164. [Google Scholar] [CrossRef] [PubMed]
  50. Schaart, J.G.; Dubos, C.; De La Fuente, I.R.; van Houwelingen, A.M.; de Vos, R.C.; Jonker, H.H.; Xu, W.; Routaboul, J.M.; Lepiniec, L.; Bovy, A.G. Identification and characterization of MYB-bHLH-WD40 regulatory complexes controlling proanthocyanidin biosynthesis in strawberry (Fragaria x ananassa) fruits. New Phytol. 2013, 197, 454–467. [Google Scholar] [CrossRef] [PubMed]
  51. Kadomura-Ishikawa, Y.; Miyawaki, K.; Takahashi, A.; Masuda, T.; Noji, S. Light and abscisic acid independently regulated FaMYB10 in Fragaria x ananassa fruit. Planta 2015, 241, 953–965. [Google Scholar] [CrossRef] [PubMed]
  52. Pillet, J.; Yu, H.W.; Chambers, A.H.; Vance, M.; Whitaker, M.; Folta, K.M. Identification of candidate flavonoid pathway genes using transcriptome correlation network analysis in ripe strawberry (Fragaria x ananassa) fruits. J. Exp. Bot. 2015, 66, 4455–4467. [Google Scholar] [CrossRef] [PubMed]
Figure 1. Four developmental stages of Baron Solemacher (top row) and Pineapple Crush (bottom row). From left to right: early green (G1) with no spacing between achenes, intermediate green (G2) with spacing between achenes and green receptacle exposed, turning (T) with the receptacle becoming pinkish-white and achenes becoming red for BS and the receptacle becoming white for PC, and ripe (R) with a soft red receptacle for BS and soft white receptacle for PC.
Horticulturae 04 00030 g001
Figure 2. Transcript levels of structural genes involved in the phenylpropanoid/flavonoid biosynthetic pathway during development and ripening of the Fragaria vesca cultivars, Baron Solemacher (solid line) and Pineapple Crush (dashed line) with red and white fruit, respectively. Developmental stages are: G1 = early green with no spacing between achenes, G2 = intermediate green with spacing between achenes and green receptacle exposed, T = turning with the receptacle becoming pinkish-white for BS and white for PC, and R = ripe with a soft red receptacle for BS and soft white receptacle for PC. Data represented are the mean of three individual experiments with error bars indicating ±SD. Asterisks indicate a significant difference as determined by Student’s t-test (p < 0.05).
Horticulturae 04 00030 g002
Figure 3. Transcript abundance of the key transcription factors, MYB1 and MYB10, and of the abscisic acid biosynthesis and receptor genes, NCED1 and ABAR/CHLH, respectively, during development and ripening of the Fragaria vesca cultivars, Baron Solemacher (solid line) and Pineapple Crush (dashed line) with red and white fruit, respectively, by qRT-PCR. Developmental stages are: G1 = early green with no spacing between achenes, G2 = intermediate green with spacing between achenes and green receptacle showing, T = turning with the receptacle becoming pinkish-white for BS and white for PC, and R = ripe with a soft red receptacle for BS and soft white receptacle for PC. Data represented are the mean of three individual experiments with error bars indicating ±SD. Asterisks indicate a significant difference as determined by Student’s t-test (p < 0.05).
Horticulturae 04 00030 g003
Table 1. Primer sequences of the phenylpropanoid and flavonoid genes and the housekeeping gene (actin) used for qRT-PCR. The primers were designed based on the gene transcripts with Gene IDs from a public database.
Target GenesPrimers (F/R)Amplicon Size (bp)Accession No./Gene ID z
PAL1F5′-CACAACATTACTCCCTGCTTGC-3′
R5′-CCTTTTGGTCCAACCGACTTAG-3′
125XM_004304392.2/27263
C4HF5′-GACGGTTCCTTTCTTCACCAAC-3′
R5′-AAGTTTCACGAACAGAGGGTCC-3′
220DQ898278.1/28093
4CLF5′-AGAGCTCAAAGTCATCGAACCC-3′
R 5′-GAGCTCCTTAACCCTGTCAACG-3′
217AF239685.1/15877
CHSF5′-TGTGTGAGTACATGGCACCTTC-3′
R5′-CCCATTCCTTAATGGCCTTG-3′
105AY017477.1/26826
CHIF5′-ACAATGATACTACCGCTGACGG-3′
R5′-CAATGGCTTTCGCTTCTGC-3′
112AB201755.1/23367
F3′HF5′-GAAGGACCTTTCGTGGTGAATC-3′
R5′-TGAGTTCTACATCCACGCACCT-3′
247AY017479.1/14611
DFRF-5′-CGGAGGGTGGTGTTTACATCTT-3′
R-5′-CCAGTCATCTTTACTTTCCGGC-3′
122AM691790.1/15174, 15176
ANSF5′-GCCTCAAACACCTTCCGACTAT-3′
R5′-TAACCCCCTCAGTTCCTTAGCA-3′
176AY017481.1/32347
LARF5′-TTGAGAAGAGTGGGGTCCCTTA-3′
R5′-GATCTGGAACTGATCCAACGGT-3′
116DQ087253.1/03877
UFGT1F5′-CTGCTTATCGTGGCTTGACA-3′
R5′-CCCGAAGTGACCACAAGAAT-3′
146AY695816.1/12591
MYB1F5′-TTGCGTCGTTGTGGTAAGAG-3′
R5′-TCTGTCCTTCCAGGCAGTCT-3′
167AF401220.1
MYB10 R2R3F5′-TTGCAGGCTTAAACAGATGC-3′
F5′-CGCATGCTTTACCTGAGAGA-3′
207EU155163.1
NCED1F5′-CTACTTCAACGGCAGGCTTCTT-3′
R5′-GTCGTATCTCCCTTCGGTTTTG-3′
100HQ290318.1
CHLH/ABARF5′-GCGATCACAGTGTTCAGTTTCC-3′
R5′-CAAAGCGTCTGAAGTCTCTGGA-3′
168GQ201451.1
ActinF5′-ACGAGCTGTTTTCCCTAGCA-3′
R5′-CTCTTTTGGATTGAGCCTCG-3′
107AB116565.1
z Gene id matching gene from Hartl et al. [15]. If gene id is not listed, it was not reported in that study.
Table 2. Individual polyphenol content of the Fragaria vesca genotypes red-fruited Baron Solemacher and white-fruited Pineapple Crush.
Compound yBaron SolemacherPineapple Crush
Developmental Stage z
G1G2TRG1G2TR
Hydroxycinnamic acid content (mg/100 g fresh weight)
FA3.9 ± 0.2 f x14 ± 0.8 c4.9 ± 0.1 ef10.9 ± 0.04 d26.1 ± 0.3 b38.7 ± 1.8 a7.3 ± 0.3 e14.7 ± 0.9 c
ChA0.3 ± 0 e0.7 ± 0 a0.6 ± 0 b0.09 ± 0 g0.4 ± 0 d0.2 ± 0 f0.5 ± 0 c0.4 ± 0 d
p-Cou-hexose w0.4 ± 0 a0.2 ± 0 c0.2± 0 bc0.3 ± 0 b0.2 ± 0 c0.2 ± 0 c0.2 ± 0 c0.3 ± 0 b
Flavonol content (mg/100 g fresh weight)
K-3-gluc5.5 ± 0.1 b y4.2 ± 0 c1.8 ± 0 e1.1 ± 0 f3.8 ± 0 cd4.6± 0 b6.2 ± 0 a1.6 ± 0 ef
K-3-act-glu1.4 ± 0 de1.4 ± 0 de1.2 ± 0 e1.9 ± 0 bc1.4 ± 0 de2.2 ± 0 b1.5 ± 0 cd2.8 ± 0 a
K-cou-hex v3.1 ± 0 ab3.3 ± 0 a1.8 ± 0 d1.1 ± 0 e2.4 ± 0 c3 ± 0 b2.4 ± 0 c1.1 ± 0 e
Quercetinnd u0.3 ± 0 abnd0.2 ± 0 b0.3 ± 0ab0.7 ± 0 and0.2 ± 0 a
Q-3-glu12.1 ± 0.2 a8.5 ± 0.2 b4.1 ± 0 e4.4 ± 0 e6.1 ± 0 d3.4 ± 0 f3.6 ± 0 f4.3± 0 e
Flavan-3-ol content (mg/100 g fresh weight)
Catechin50 ± 1 e y115 ± 1 a93 ± 2 b86 ± 6 c61 ± 1 d114 ± 1 a96 ± 0 b40 ± 0 f
Epicatechin1.6 ± 0 f 4.6 ± 0 b3.6 ± 0 d4 ± 0 c2.5 ± 0 e5.8 ± 0 a3.6 ± 0 d2.6± 0 e
PCD t210 ± 1 f484 ± 8 c460 ± 8 d326± 1 e213 ± 4 f545 ± 5 a505 ± 6 b167 ± 1 g
Ellagic acid (EA) and ellagitannin content (mg/100 g fresh weight)
EA86 ± 1 b y104 ± 2 a30 ± 2 f33 ± 1 f108 ± 1 a56 ± 2 c37 ± 0 e44 ± 1 d
EADH s581 ± 4 a575 ± 3a245 ± 5 e254 ± 5 e571 ± 5 a424 ± 2 b359 ± 4 c308 ± 5 d
MEAP44 ± 1b33 ± 0 cd35 ± 0 c46 ± 0b25 ± 1 e29 ± 0 de44 ± 4 b53 ± 1 a
EAP107 ± 0 b117 ± 3 a53 ± 3 g77 ± 1 e110 ± 2 b67 ± 1 f87 ± 10 d93 ± 1 c
GHH217 ± 3 a151 ± 5 d83 ± 3 g43 ± 1 h161 ± 4 c178 ± 4 b125 ± 3 e114 ± 2 f
HGH536 ± 5 a y531 ± 8 a123 ± 1 e92 ± 1 f477 ± 3 b371 ± 5 c214 ± 2 d216 ± 4 d
z Developmental stages are: G1 = early green with no spacing between achenes, G2 = intermediate green with spacing between achenes and green receptacle exposed, T = turning with the receptacle becoming pinkish-white for BS and white for PC, and R = ripe with a soft red receptacle for BS and soft white receptacle for PC. y Compound abbreviations: Pg = pelargonidin; Cy = cyanidin; glu = glucoside; mal = malonyl; K = kaempferol; Q = quercetin; glr = glucoronide; act = acetyl; hex = hexoside; Cou = coumaric acid; PCD = proanthocyanidin dimer; EA = ellagic acid; EAP = EA pentoside; MEAP = methyl EA pentoside; EADH = EA deoxyhexoside; GHH= galloyl bis HHDP hexose; HGH = HHDP galloyl hexose. x Means (n = 3) ± SD in the same row followed by different letters are significantly different by Fisher’s LSD at p < 0.05. SD = 0 if SD ≤ 0.05 mg/100 g fresh weight. w Quantified as mg of p-coumaric acid/100 g FW. v Quantified as mg of kaempferol-3-glucoside/100 g FW. u nd indicates it was not detected. t Quantified as mg of catechin/100 g FW. s Quantified as mg of ellagic acid/100 g FW.
Table 3. Total content (mg/100 g fruit fresh weight) of major classes of phenylpropanoids/flavonoids based on a subset of target compounds from each class from the Fragaria vesca red-fruited cultivar ‘Baron Solemacher versus the white-fruited cultivar Pineapple Crush at four stages of fruit development.
GenotypeStage zHydroxycinnamic AcidsFlavonolsFlavan-3-olsEllagic AcidsEllagitannins
Baron SolemacherG14.6 ± 0.2 f y22.1 ± 0.2 a260 ± 1 f816 ± 5 a757 ± 7a
G214.9 ± 0.8 c17.7 ± 0.2 b604 ± 8 b831 ± 8 a686 ± 8 b
T5.7 ± 0 ef8.9 ± 0 e558 ± 9 c364 ± 8 f212 ± 3 f
R11.2 ± 0 d8.7 ± 0.1 e417± 5 d409 ± 4 e140 ± 1 g
Pineapple CrushG126.7 ± 0.3 b14.0 ± 0.2 c277 ± 3 e814 ± 4 a643 ± 2 c
G239.1 ± 1.8 a13.9 ± 0.2 c665 ± 9a576 ± 2 b554 ± 8 d
T8 ± 0.2 e13.7 ± 0.2 c605 ± 6 b529 ± 3 c344 ± 4 e
R15.4 ± 0.9 c10 ± 0.2 d210 ± 1 g499 ± 4 d336 ± 6 e
ANOVA (p)
Genotype <0.001<0.001<0.001NS<0.001
Stage <0.001<0.001<0.001<0.001<0.001
Genotype X Stage <0.001<0.001<0.001<0.001<0.001
z Developmental stages are: G1 = early green with no spacing between achenes, G2 = intermediate green with spacing between achenes and green receptacle exposed, T = turning with the receptacle becoming pinkish-white for BS and white for PC, and R = ripe with a soft red receptacle for BS and soft white receptacle for PC. y Means (n = 3) ± SD in the same column followed by different letters are significantly different by Fisher’s LSD at p < 0.05. SD = 0 if SD ≤ 0.05 mg/100 g fresh weight. NS = not significant.

