Abstract
The objective of this study was to evaluate growth and physiological responses of ‘Cherokee’ and ‘Waldmann’s Green’ lettuce (Lactuca sativa) exposed to small changes in light quality and intensity within a 24-h period. Three pre-dawn (PD; 0600 to 0700) and three end-of-day (EOD; 2100 to 2200) treatments were evaluated in the study, each providing 50 ± 2 µmol·m−2·s−1 of either blue, red, or broadband white light from light-emitting diodes (LEDs). To account for the main daily light integral (DLI), broadband white LEDs provided 210 ± 2 µmol·m−2·s−1 from 0700 to 2200 or from 0600 to 2100 for the PD or EOD treatments, respectively. A control treatment was included which provided 200 ± 2 µmol·m−2·s−1 of white light from 0600 to 2200. All treatments provided a DLI of 11.5 mol·m−2·day−1 over a 16-h photoperiod. Regardless of cultivar, no treatment difference was measured for hypocotyl length or leaf number. However, plants grown under EOD-blue or PD-white had up to 26% larger leaves than those grown under PD-red and 20% larger leaves than control. In addition, plants grown under EOD-blue produced up to 18% more shoot fresh mass compared to those grown under control, EOD-red, or PD-red. Contrasts for gas-exchange data collected during the main photoperiod showed that light quality was not significant within PD or EOD for any of the parameters evaluated. However, regardless of light quality, stomatal conductance (gs) and transpiration (E) were up to 34% and 42% higher, respectively, for EOD-grown plants compared to control. Our results suggest that 1 h of low intensity EOD-blue light has the potential to promote lettuce growth by increasing leaf area and shoot fresh mass when the main DLI from sole-source lighting is provided by broadband white LEDs.
1. Introduction
Traditional horticultural lamps (e.g., high-pressure sodium, cool-white fluorescent, metal halide) are useful at providing adequate daily light integral (DLI) indoors. However, light-emitting diodes (LEDs) offer unique opportunities for exploring light-quality effects on plant growth, development, and metabolism. A useful feature of LEDs is their inherent capability to provide accurate spectral control in growing environments by producing narrow-spectrum light. This allows plant photoreceptors to perceive light cues that can control morphology and improve product quality. Numerous plant species have been evaluated under LED lighting with favorable results in production and flowering control []. However, to date, most sole-source light-quality research focused on plant growth-responses to LEDs have used a constant spectral environment throughout the day, and typically, during an entire crop cycle.
On a clear-sky day, early morning tends to be rich in blue light (400 to 500 nm), whereas the low sun angle from late afternoon will result in a low red (600 to 700 nm) to far-red (FR; 700 to 800 nm) spectrum []. However, regardless of season and cloud cover, midday sunlight has similar distributions of broadband blue, green (500 to 600 nm), and red light []. It is likely that cues received from the changing spectral distribution of sunlight have contributed to evolutionary responses of plants in the natural environment. Therefore, constant spectral environments within a 24-h period might not maximize the full potential of plant growth and development under sole-source lighting.
Most studies evaluating changes in light-quality within a 24 h-period have focused on the phytochrome (phy)-mediated responses to red and FR light. Kasperbauer [] reported that a brief (5-min), low-intensity (17 µmol·m−2·s−1) treatment of end-of-day (EOD; at the end of the main photoperiod) FR light increased internode length of tobacco (Nicotiana tabacum) seedlings compared to untreated controls. Several follow-up studies have demonstrated that EOD-FR can be used as an effective non-chemical means to control plant morphology in a number of crops [,,,,,,]. Moreover, Zahedi and Sarikhani [] showed that flower induction of strawberry (Fragaria × ananassa) can be accelerated in 12-week-old plants treated with EOD-FR light.
An alternative evaluation to changes in spectral distribution over time has focused on the pre-dawn (PD; before the start of the main photoperiod) or EOD effects of light within the photosynthetically active radiation (PAR) range, namely blue and red light. Sung and Takano [] reported that shoot fresh mass, leaf area, and stem diameter of cucumber (Cucumis sativus) seedlings grown under electric lamps (unknown type) were significantly higher when plants were PD-irradiated with blue fluorescent lamps compared to those treated with PD-red light from fluorescent lamps or untreated controls. In addition, the authors reported that when seedlings were exposed to PD-blue light, transpiration (E), photosynthetic rate (A), abaxial stomatal density, and stomatal opening of leaves increased compared to untreated controls []. Similarly, Hanyu and Shoji [] reported a 20% increase in total dry mass of spinach (Spinacia oleracea) grown under white fluorescent lamps with a 30-min treatment of PD-blue compared to that of plants irradiated with PD-red or untreated controls. The same study also reported that the total dry mass of spinach treated with 30-min EOD-red light was higher compared to that of plants treated with EOD-blue light []. Using LEDs, Jishi et al. [] reported higher growth (leaf area expansion and shoot fresh and dry mass) of lettuce treated with PD-blue compared to plants grown under a constant 14-h photoperiod of 50% blue + 50% red light. Recent work by Kuno et al. [] also showed that PD-blue alone or in combination with EOD-red light can increase biomass production of lettuce compared to a constant spectrum throughout the day. It has been proposed that the growth increase in response to PD-blue is related to a rapid induction of stomatal opening caused by the high sensitivity of stomata to blue light [,]. Accordingly, others have suggested that inducing an early stomatal aperture might allow plants to reach their maximum stomatal aperture faster during the photoperiod and thus, may increase carbon fixation by reducing diffusional limitation to CO2 uptake early in the day [,,,].
Although some of these studies suggest that potential production advantages can be achieved by manipulating PD or EOD-light in controlled environments, most of the significant findings are based on treatment comparisons with different photoperiods or DLIs, which may have introduced confounding effects in the results. In order to understand the physiological factors that drive plant responses to spectral changes over time, the objective of this study was to evaluate growth and gas-exchange responses of lettuce to changes in blue, red, or white light within a 24-h period, maintaining photoperiod and DLI constant. We hypothesized that PD-blue light would increase growth and physiological activity compared to other PD or EOD treatments due to an increase in photosynthetic activity during the light period induced by early stomatal aperture.
2. Materials and Methods
2.1. Plant Material and Growing Conditions
Seeds of ‘Cherokee’ and ‘Waldmann’s Green’ lettuce (Johnny’s Selected Seeds, Winslow, ME, USA) were germinated on moist filter paper inside a Petri dish placed under ambient laboratory conditions for 48 h. Seedlings were subsequently transplanted into 48-cell plug trays (100 mL individual cell volume) filled with horticultural grade substrate composed (by volume) of 60% peat and 40% perlite (Sunshine Mix #4, Sun Gro Horticulture, Agawam, MA, USA). Each tray was cut into six sub-sections of four cells, each with one plant, which were randomly placed under one of seven light-quality treatments. Throughout the experiment, plants were sub-irrigated as necessary with tap water supplemented with a water-soluble fertilizer (Jack’s Professional® General Purpose, 20N-4.4P-16.6K; J.R. Peters Inc., Allentown, PA, USA) to provide the following (in mg·L−1): 15 N-NO3, 7.5 P, 15 K, 0.11 Mg, and micronutrients.
2.2. Lighting Treatments
All treatments provided a DLI of 11.5 mol·m−2·day−1 over a 16-h photoperiod, measured with a spectroradiometer (SS-110; Apogee Instruments Inc., Logan, UT, USA) at mid-canopy height. Three PD (0600 to 0700) and three EOD (2100 to 2200) light-quality treatments were evaluated in the study, each providing 50 ± 2 µmol·m−2·s−1 of either blue, red, or broadband white light from LEDs (RAY66; Fluence Bioengineering, Austin, TX, USA). The main DLI was provided by white LEDs emitting 210 ± 2 µmol·m−2·s−1 from 0700 to 2200 or from 0600 to 2100 for the PD or EOD treatments, respectively. A control treatment was included which provided 200 ± 2 µmol·m−2·s−1 of white light from 0600 to 2200. An illustration of the treatments is shown in Figure 1. The blue and red LEDs had peak wavelengths of 446 or 664 nm, respectively; the broadband white LEDs had three main peaks: blue (446 nm), orange (599 nm) and red (664 nm).
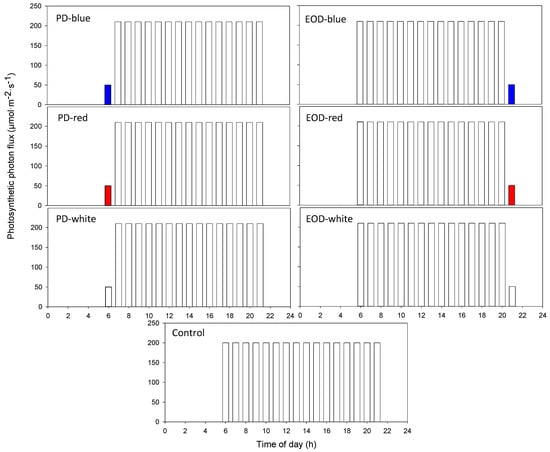
Figure 1.
Illustration of the light quality, intensity, and photoperiod used throughout the study. PD = pre-dawn; EOD = end-of-day.
Plants were grown on 41 × 61 × 183 cm compartments within multilayer shelves placed inside a walk-in growth chamber (C6 Control System with ECoSys Software; EGC, Chagrin Falls, OH, USA); each compartment was a replicate of a treatment. Before starting the experiment, a light map was generated to determine the maximum photosynthetic photon flux density (PPFD) for each treatment (no plants present) using a spectroradiometer. Light output to achieve our target PPFD was controlled with a dimmer (Solunar; Fluence Bioengineering) connected to a backup battery (BE425M-LM; APC, West Kingston, RI, USA). Light pollution (≤5 µmol·m−2·s−1) within treatments was minimized by covering the sides and back of the shelves with a double layer of 0.3-mm-thick black and white polyethylene film (white side facing the plants). A 215 × 200 cm black and white polyethylene film curtain was used to prevent light pollution between the two opposite shelves (black side facing the plants). Within each treatment, sub-trays were randomly rotated daily to minimize location effects within the experimental area.
The average ambient day (from 0600 to 2200) and night (from 2200 to 0600) air temperature of the chamber was set at 20 and 21 °C, respectively. However, radiation from the lamps raised ambient temperature during the photoperiod, which was uniformly maintained at ~22 °C by installing cooling fans (AC Infinity AXIAL 1238; City of Industry, CA, USA) as needed. The set points for ambient CO2 and relative humidity (RH) were 405 ppm and 60 to 80%, respectively. Near-canopy air temperature was monitored using fine-wire thermocouples [Type K, 5SC Series, 0.25 mm diameter; OMEGA Engineering Inc., Norwalk, CT, USA] placed directly under a leaf from a plant located at the center of each treatment and interfaced to a data logger (CR1000; Campbell Scientific, Logan, UT, USA) (Figure 2). To avoid partial shading of the plants, the thermocouples were not shielded. An additional shielded temperature and RH sensor (RC-4HA/C; Elitech, Milpitas, CA, USA) was placed at the center of each treatment compartment to provide real-time data monitoring and to ensure that ambient temperature differences among treatments were ≤1 °C.
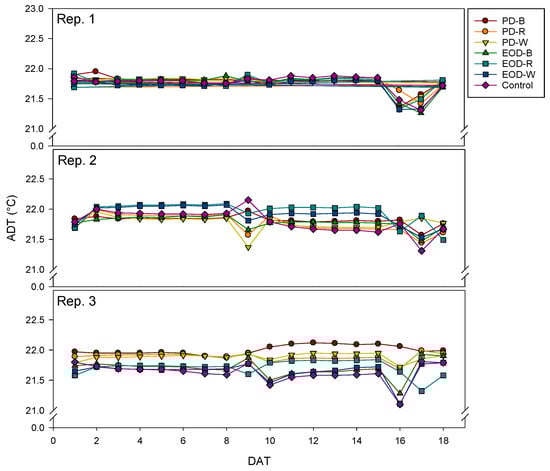
Figure 2.
Average daily near-canopy air temperature (ADT) measured during each experimental replication. PD = pre-dawn; B = blue; R = red; W = white; EOD = end-of-day; DAT = day after transplanting.
2.3. Data Collection and Plant Measurements
From four days to one day prior to harvest, a portable gas-exchange system (LI-6400XT; LI-COR, Lincoln, NE, USA) was used to measure survey A, stomatal conductance (gs), and E on six randomly selected plants per cultivar per treatment. Data were collected at three different times of measurement (ToM): PD (0600 to 0700), EOD (2100 to 2200), and during the main photoperiod (0900 to 1500). The reference CO2 concentration, leaf temperature, RH, and flow rate inside the chamber were 405 μmol·mol−1, 22 °C, approx. 60%, and 500 mL·min−1, respectively. Measurements were conducted under ambient PPFD (without the use of an external light source), ensuring leaf exposure to the target intensity from each treatment. Additionally, prior to harvest, SPAD index was measured with a chlorophyll meter (SPAD-502; Konica Minolta Sensing Inc., Osaka, Japan) on three different points on a leaf. Gas-exchange data and average SPAD index were collected for the youngest fully expanded leaf of each plant.
Six plants per treatment were destructively harvested. Immediately following harvest, hypocotyl length was measured with a ruler. The number of leaves (>1 cm) per plant was counted and total leaf area was measured using a leaf area meter (LI-3000A; LI-COR). Shoot fresh mass was measured using an electronic balance. Subsequently, shoots were oven-dried to a constant mass at 70 °C for dry mass determination. Specific leaf area (SLA) was calculated by dividing leaf area by shoot dry mass.
Three replications were conducted over time following the same procedures as previously described. Each experimental replication was terminated 18 d after treatment initiation. All treatments were re-randomized within the chamber before the start of each replication.
2.4. Data Analysis
Response data were analyzed using generalized linear mixed model procedures as implemented in SAS PROC GLIMMIX (SAS/STAT 14.2; SAS Institute, Cary, NC, USA) using a normal distribution function for all response variables, except leaf number, which was modeled on the Poisson scale. Experimental repeat and its interaction with treatment × cultivar were considered to be random effects. For plant growth responses, there was no interaction between cultivar and treatment, except for shoot fresh mass (Table 1). Therefore, data are presented as main effects. Similarly, for physiological measurements the cultivar × treatment interaction was not significant (P > 0.15), and hence treatments were compared at the main effect level using linear contrasts. Because gas-exchange data collected during the PD and EOD ToM include ToM as a confounding effect, all treatment contrasts were made for data collected during the photoperiod ToM.

Table 1.
Hypocotyl length (HL), leaf area (LA), specific leaf area (SLA), leaf number, shoot fresh mass (FM), and shoot dry mass (DM) of lettuce plants grown in a controlled environment under one of seven light treatments z.
3. Results
3.1. Growth Responses
No treatment difference was measured for hypocotyl length or leaf number (Table 1). Plants grown under EOD-blue or PD-white had ~25% larger leaves than those grown under PD-red. However, based on SLA, plants grown under PD-white produced thinner leaves compared to those grown under PD-red (434 vs. 349 m2leaf per gleaf dry mass, respectively). In addition, plants grown under EOD-blue produced up to 18% more shoot fresh mass compared to those grown under control, EOD-red, or PD-red. Similarly, although not significant, shoot dry mass of plants grown under EOD-blue was 14% higher than that of plants grown under control, EOD-red, or EOD-white, and 10% higher compared to that of plants grown under PD-blue, PD-red, or PD-white.
Regardless of treatment, hypocotyls were 0.6 cm longer and shoot dry mass was 0.1 g higher for ‘Waldmann’s Green’ compared to ‘Cherokee’ (data not shown). In contrast, based on SLA, ‘Cherokee’ produced significantly thinner leaves than ‘Waldmann’s Green’ (435 vs. 344 m2leaf per gleaf dry mass, respectively), but ‘Waldmann’s Green’ produced ~2 fewer leaves per plant. Although the number of leaves per plant was significantly higher for ‘Cherokee’, the significant difference in leaf thickness, as indicated by SLA, is most likely responsible for the cultivar differences in shoot dry mass.
3.2. Physiological Responses
No treatment difference was measured for SPAD index (data not shown). Means for survey A, gs, and E at different ToM are presented in Table 2. Initial contrasts showed that A and gs measured in plants grown under control were unaffected by ToM. However, E was 22% higher when control-grown plants were measured in the PD relative to the EOD ToM. Initial contrasts also indicated that for all treatments except control, A, gs, and E were significantly higher when data were collected during the main photoperiod ToM compared to the PD or EOD ToMs, which is most likely attributed to the differences in PPFD at the different ToMs (210 µmol·m−2·s−1 for the main photoperiod vs. 50 µmol·m−2·s−1 for the PD or EOD).
Table 2.
Survey photosynthesis (A), stomatal conductance (gs), and transpiration (E) measured for lettuce plants grown in a controlled environment under one of seven light treatments z.
Contrasts for data collected within the main photoperiod ToM showed that light quality did not affect any of the gas-exchange parameters evaluated within PD or EOD (Table 2). In addition, A and gs of plants grown under PD were not different than control; however, E was 38% lower in control plants relative to those grown under PD-red. Similarly, there were no differences for A between EOD and control plants measured during the main photoperiod ToM; however, regardless of light quality, gs and E were up to 34% and 42% higher, respectively, for EOD-grown plants compared to control.
4. Discussion
Our results suggest that 1 h of low intensity EOD-blue light has the potential to promote lettuce growth by increasing leaf area and shoot fresh mass when the main DLI from sole-source lighting is provided by broadband white LEDs (Table 1). Although significant effects in plant growth and morphology from short-term exposures to PD or EOD light-quality treatments have been reported, our findings do not correspond with those of others who indicate that PD-blue or EOD-red light can increase biomass production of plants [,,,,]. As shown by others, leaf stomatal features are greatly affected by blue light [,]. Accordingly, Goto [] suggested that a possible explanation for the reported increases in plant growth under PD-blue relate to the significant effect that blue light has on leaf stomatal development and aperture. Similarly, Jishi et al. [] proposed that the increase in plant growth with low-intensity PD-blue light is caused by changes in stomatal aperture at the end of the dark period (i.e., PD), which might induce a premature “awakening” of the photosynthetic apparatus that could increase the overall photosynthetic activity of plants by minimizing limitations to CO2 diffusion early in the day. Although it is likely that blue light is perceived as a cue for plants to recognize the onset of the light period, our results do not show higher physiological activity under PD-blue compared to other treatments (Table 2). Similar to our findings, Auchincloss et al. [] concluded that changes in PD-stomatal opening and conductance do not increase daytime A of sunflower (Helianthus annuus). Interestingly, our results do indicate that, regardless of light-quality, short-term exposure to EOD-light stimulates daytime gs and E, which may have increased the photosynthetic efficiency of plants during the light period by promoting the absorption of water and ions from roots, or by stimulating efficient water, ion, and hormone transport through plants.
Only one of the three experiments reported by Jishi et al. [] accounted for photoperiod and DLI when comparing PD or EOD blue and red light; their results showed a higher leaf area in lettuce produced under a 14-h photoperiod of 7-h PD-blue + 7-h EOD-red compared to other treatments that combined blue and red light during the main photoperiod. To our knowledge, all other studies reporting higher growth under PD-blue or EOD-red have photoperiod or DLI as a confounding effect. Therefore, no direct comparison can be made with our findings, as light-quality responses to spectral changes over time cannot be distinguished with day length responses in those studies. However, as shown by others, plant responses to light-quality are not only species, but sometimes cultivar-specific, and may depend on the background environment and on the plant developmental stage []. Therefore, the results from those studies might also reflect specific environmental conditions and plant-specific responses to light-quality.
The significant increase in leaf area and shoot fresh mass with EOD-blue compared to control might be related to the relative absorption of blue light by the active [far-red-absorbing (Pfr)] and inactive [red-absorbing (Pr)] forms of phy, which are known to regulate the perception of day length in plants and can affect leaf area expansion (Table 1). Although blue radiation is best absorbed by cryptochrome (cry) and phototropin (phot) photoreceptors, it is also weakly absorbed by phy []. Meng and Runkle [] reported that phy-mediated responses can be controlled with moderate-intensity (~30 µmol·m−2·s−1) blue light due to the secondary absorption peak of phy in the blue region of the spectrum. Furthermore, Liu et al. (2012) showed that phy B controls the expression of both ERECTA and EXPANSIN family genes, which regulate cell expansion in leaves. Others have shown that blue radiation can be perceived as a long-day photoperiodic response in plants [,], and increases in leaf area expansion under long photoperiods have been reported in many plant species []. Therefore, if phy-regulated photoperiodic stimuli from EOD-blue extends into the dark period, plants may perceive EOD-blue as day length extension, possibly stimulating leaf area expansion. Larger leaves from EOD-blue most likely increased the radiation capture of plants and may have directly affected the increase in shoot fresh mass measured in our study
Similar to our findings, Hanyu and Shoji [] reported a negative growth response to PD-red (Table 1). The mechanisms that affect plant growth in response to PD-red are not well understood but could be associated with changes in the relative proportion of Pfr to the total amount of phy (i.e., phy photoequilibrium) at the end of the dark period. During the day, Pfr suppresses genes involved in elongation and growth; however, at night, Pfr slowly converts into the inactive Pr, which increases the expression of genes involved in elongation and growth [,]. Red light applied at the end of the dark period might interrupt the conversion of Pfr to Pr, leading to a reduction in cell elongation.
In conclusion, PD blue light was not effective at promoting growth or physiological activity of lettuce plants. However, short-term EOD light can be useful to modify physiological and morphological plant responses that may ultimately lead to higher yields without increasing DLI. In the wake of indoor farming technologies, implementing solutions that can increase production efficiency without negatively affecting plant growth is a major advantage. Controlling light-quality with LEDs is a readily available tool to increase production efficiency indoors and can contribute to the establishment of better production practices for indoor farming.
Author Contributions
S.C. and C.G. conceived and designed the experiments; S.C. performed the experiments; E.v.S. analyzed the data; S.C., C.G. and L.G.I. wrote the paper. All authors edited the final version.
Acknowledgments
We thank Rebecca Darnell for her scientific input and Fluence Bioengineering for their kind donation of LED equipment.
Conflicts of Interest
The authors declare no conflict of interest.
References
- Mitchell, C.A.; Dzakovich, M.P.; Gómez, C.; Lopez, R.G.; Burr, J.F.; Hernández, R.; Kubota, C.; Currey, C.J.; Meng, Q.; Runkle, E.S.; et al. Light-Emitting Diodes in Horticulture. In Horticultural Reviews; John Wiley and Sons, Inc.: Hoboken, NJ, USA, 2015; pp. 1–88. [Google Scholar]
- Hogewoning, S.W.; Trouwborst, G.; Maljaars, H.; Poorter, H.; van Ieperen, W.; Harbinson, J. Blue light dose-responses of leaf photosynthesis, morphology, and chemical composition of Cucumis sativus grown under different combinations of red and blue light. J. Exp. Bot. 2010, 61, 3107–3117. [Google Scholar] [CrossRef] [PubMed]
- Gómez, C.; Mitchell, C.A. Growth responses of tomato seedlings to different spectra of supplemental lighting. HortScience 2015, 50, 112–118. [Google Scholar]
- Kasperbauer, M.J. Spectral distribution of light in a tobacco canopy and effects of end-of-day light quality on growth and development. Plant Physiol. 1971, 47, 775–778. [Google Scholar] [CrossRef] [PubMed]
- Blom, T.J.; Tsujita, M.J.; Roberts, G.L. Far-red at end of day and reduced irradiance affect plant height of easter and asiatic hybrid lilies. HortScience 1995, 30, 1009–1012. [Google Scholar]
- Chia, P.L.; Kubota, C. End-of-day far-red light quality and dose requirements for tomato rootstock hypocotyl elongation. HortScience 2010, 45, 1501–1506. [Google Scholar]
- Decoteau, D.R.; Friend, H.H. Growth and subsequent yield of tomatoes following end-of-day light treatment of transplants. HortScience 1991, 26, 1528–1530. [Google Scholar]
- Decoteau, D.R.; Kasperbauer, M.J.; Daniels, D.D.; Hunt, P.G. Plastic mulch color effects on reflected light and tomato plant-growth. Sci. Hortic. 1988, 34, 169–175. [Google Scholar] [CrossRef]
- Ilias, I.F.; Rajapakse, N. The effects of end-of-the-day red and far-red light on growth and flowering of Petunia × hybrida ‘Countdown burgundy’ grown under photoselective films. HortScience 2005, 40, 131–133. [Google Scholar]
- Kasperbauer, M.J.; Peaslee, D.E. Morphology and photosynthetic efficiency of tobacco leaves that received end-of-day red and far red light during development. Plant Physiol. 1973, 52, 440–442. [Google Scholar] [CrossRef] [PubMed]
- Yang, Z.-C.; Kubota, C.; Chia, P.-L.; Kacira, M. Effect of end-of-day far-red light from a movable LED fixture on squash rootstock hypocotyl elongation. Sci. Hortic. 2012, 136, 81–86. [Google Scholar] [CrossRef]
- Zahedi, S.M.; Sarikhani, H. Effect of far-red light, temperature, and plant age on morphological changes and induction of flowering of a ‘June-bearing’ strawberry. Hortic. Environ. Biotechnol. 2016, 57, 340–347. [Google Scholar] [CrossRef]
- Sung, I.K.; Takano, T. Effects of supplemental blue- and red-lights in the morning twilight on the growth and physiological responses of cucumber seedlings. Environ. Control Biol. 1997, 35, 261–265. [Google Scholar] [CrossRef]
- Hanyu, H.; Shoji, K. Acceleration of growth in spinach by short-term exposure to red and blue light at the beginning and at the end of the daily dark period. In Proceedings of the Fourth International Ishs Symposium on Artificial Lighting; Dorais, M., Gosselin, A., Eds.; International Society Horticultural Science: Leuven, Belgium, 2002; pp. 145–150. ISBN 90-6605-955-9. [Google Scholar]
- Jishi, T.; Kimura, K.; Matsuda, R.; Fujiwara, K. Effects of temporally shifted irradiation of blue and red LED light on cos lettuce growth and morphology. Sci. Hortic. 2016, 198, 227–232. [Google Scholar] [CrossRef]
- Kuno, Y.; Shimizu, H.; Nakashima, H.; Miyasaka, J.; Ohdoi, K. Effects of irradiation patterns and light quality of red and blue light-emitting diodes on growth of leaf lettuce (Lactuca sativa L. “Greenwave”). Environ. Control Biol. 2017, 55, 129–135. [Google Scholar] [CrossRef]
- Goto, E. Effects of light quality on growth of crop plants under artificial lighting. Environ. Control Biol. 2003, 41, 121–132. [Google Scholar] [CrossRef]
- Barbeta, A.; Ogaya, R.; Penuelas, J. Comparative study of diurnal and nocturnal sap flow of Quercus ilex and Phillyrea latifolia in a Mediterranean holm oak forest in Prades (Catalonia, NE Spain). Trees Struct. Funct. 2012, 26, 1651–1659. [Google Scholar] [CrossRef]
- Daley, M.J.; Phillips, N.G. Interspecific variation in nighttime transpiration and stomatal conductance in a mixed New England deciduous forest. Tree Physiol. 2006, 26, 411–419. [Google Scholar] [CrossRef] [PubMed]
- Dawson, T.E.; Burgess, S.S.O.; Tu, K.P.; Oliveira, R.S.; Santiago, L.S.; Fisher, J.B.; Simonin, K.A.; Ambrose, A.R. Nighttime transpiration in woody plants from contrasting ecosystems. Tree Physiol. 2007, 27, 561–575. [Google Scholar] [CrossRef] [PubMed]
- Oren, R.; Ellsworth, D.S.; Johnsen, K.H.; Phillips, N.; Ewers, B.E.; Maier, C.; Schafer, K.V.; McCarthy, H.; Hendrey, G.; McNulty, S.G.; et al. Soil fertility limits carbon sequestration by forest ecosystems in a CO2-enriched atmosphere. Nature 2001, 411, 469–472. [Google Scholar] [CrossRef] [PubMed]
- Fraszczak, B. Effect of short-term exposure to red and blue light on dill plants growth. HortScience 2013, 40, 177–185. [Google Scholar] [CrossRef]
- Tallman, G.; Zeiger, E. Light quality and osmoregulation in vicia guard cells: Evidence for involvement of three metabolic pathways. Plant Physiol. 1988, 88, 887–895. [Google Scholar] [CrossRef] [PubMed]
- Auchincloss, L.; Easlon, H.M.; Levine, D.; Donovan, L.; Richards, J.H. Pre-dawn stomatal opening does not substantially enhance early-morning photosynthesis in Helianthus annuus. Plant Cell Environ. 2014, 37, 1364–1370. [Google Scholar] [CrossRef] [PubMed]
- Bugbee, B. Toward an optimal spectral quality for plant growth and development: The importance of radiation capture. Acta Hortic. 2016, 1134, 1–12. [Google Scholar] [CrossRef]
- Butler, W.L.; Lane, H.C. Dark Transformations of phytochrome in vivo. II. Plant Physiol. 1965, 40, 13–17. [Google Scholar] [CrossRef] [PubMed]
- Meng, Q.; Runkle, E.S. Moderate-intensity blue radiation can regulate flowering, but not extension growth, of several photoperiodic ornamental crops. Environ. Exp. Bot. 2017, 134, 12–20. [Google Scholar] [CrossRef]
- Hamamoto, H.; Shimaji, H.; Higashide, T. Budding and bolting responses of horticultural plants to night-break treatments with LEDs of various colors. J. Agric. Meteorol. 2003, 59, 103–110. [Google Scholar] [CrossRef]
- Shin, J.H.; Jung, H.H.; Kim, K.S. Night interruption using light emitting diodes (LEDs) promotes flowering of Cyclamen persicum in winter cultivation. Hortic. Environ. Biotechnol. 2010, 51, 391–395. [Google Scholar]
- Thomas, B.; Vince-Prue, D. Photoperiodic Control of Development: Other Effects of Daylength. In Photoperiodism in Plants, 2nd ed.; Academic Press: San Diego, CA, USA, 1997; pp. 336–354. [Google Scholar]
- Nozue, K.; Covington, M.F.; Duek, P.D.; Lorrain, S.; Fankhauser, C.; Harmer, S.L.; Maloof, J.N. Rhythmic growth explained by coincidence between internal and external cues. Nature 2007, 448, 358–361. [Google Scholar] [CrossRef] [PubMed]
- Soy, J.; Leivar, P.; Gonzalez-Schain, N.; Sentandreu, M.; Prat, S.; Quail, P.H.; Monte, E. Phytochrome-imposed oscillations in PIF3 protein abundance regulate hypocotyl growth under diurnal light/dark conditions in Arabidopsis. Plant J. 2012, 71, 390–401. [Google Scholar] [CrossRef] [PubMed]
© 2018 by the authors. Licensee MDPI, Basel, Switzerland. This article is an open access article distributed under the terms and conditions of the Creative Commons Attribution (CC BY) license (http://creativecommons.org/licenses/by/4.0/).