Article

Impact of Low and Moderate Salinity Water on Plant Performance of Leafy Vegetables in a Recirculating NFT System

1
Department of Horticultural Sciences, Texas A&M AgriLife Research Center, Texas A&M University, 1380 A&M Circle, El Paso, TX 79927, USA
2
Department of Plants, Soils, and Climate, Utah State University, 4820 Old Main Hill, Logan, UT 84322, USA
3
Department of Horticultural Sciences, Texas A&M AgriLife Extension, Texas A&M University, 1710 FM 3053 N, Overton, TX 75684, USA
*
Author to whom correspondence should be addressed.
Horticulturae 2018, 4(1), 6; https://doi.org/10.3390/horticulturae4010006
Submission received: 10 January 2018 / Revised: 2 March 2018 / Accepted: 7 March 2018 / Published: 10 March 2018
(This article belongs to the Special Issue Plant Production in Controlled Environment)

Abstract

:
Two greenhouse experiments were conducted to examine the growth and mineral nutrition of four leafy vegetables in a nutrient film technique (NFT) system with water with low to moderate salinity. In Expt. 1, a nutrient solution was prepared using reverse osmosis (RO) water and treatments consisted of supplementing with RO water, tap water, or nutrient solution. In Expt. 2, nutrient solution was prepared using three different water sources (treatments), namely, RO water, tap water, or tap water, plus sodium chloride (NaCl), and supplementing solution was prepared using the same three water sources at one third strength. For both of the experiments, seeds of pac choi ‘Tokyo Bekana’, ‘Mei Qing Choi’, and ‘Rosie’ (Brassica rapa var. chinensis) and leaf lettuce ‘Tropicana’ (Lactuca sativa) were sown and were grown in a growth chamber. Two weeks after sowing, seedlings were transplanted to the NFT systems. Expt. 1 was conducted from 19 April to 19 May 2016 and Expt. 2 from 6 September to 12 October 2016. In Expt. 1, nitrate (NO3) and phosphorus (P) levels in the tanks decreased, and potassium (K+) levels reached almost zero at the end of the experiment when supplemented with RO or tap water. However, calcium (Ca2+), magnesium (Mg2+), and sulfate (SO42−) either did not decrease or increased over time. Supplementing water type did not affect the growth of leaf lettuce and ‘Mei Qing Choi’ pac choi; however, fresh weight of ‘Rosie’ pac choi and both fresh and dry weight of ‘Tokyo Bekana’ pac choi were reduced when supplemented with RO water. Leaf sap NO3 was reduced in ‘Tokyo Bekana’ pac choi, but not in other varieties, when supplemented with RO or tap water. Leaf sap K+ decreased in ‘Tokyo Bekana’, but not in other varieties. The supplementing water type did not impact leaf sap Ca2+, regardless of vegetable varieties. In Expt. 2, NO3 in all of the treatments, P in RO water, and K+ in RO or tap water decreased in the last week of the experiment. Other macronutrients did not change substantially over time. The addition of NaCl significantly reduced the growth of all the vegetables. ‘Tropicana’ leaf lettuce was the least tolerant to NaCl, followed by ‘Rosie’ pac choi. Water source did not affect leaf Ca2+, K+, P, SO42−, and Mg2+ except for ‘Tokyo Bekana’ where NaCl addition decreased Ca2+ and Mg2+. Our results indicated that the tested leafy vegetables differed in response to various types of water used as supplementing or as source water. N, P, and especially K, should be supplemented in the late stage of the experiment, while replacing the whole tank nutrient solution is only necessary when Na+ and/Cl build up to harmful levels.

1. Introduction

Growing food crops in a hydroponic system under a controlled environment has gained interest among growers and entrepreneurs in the United States (U.S.) and worldwide in recent years. For example, the U.S. green industry is shifting away from solely producing herbaceous ornamental crops and integrating or replacing these crops with vegetables and herbs [1]. The reason for this shift is partly due to urbanization and the trend of consumers’ awareness for locally grown fresh produce [2]. Hydroponic systems, such as nutrient film technique (NFT) and deep flow technique, are used in various types of controlled environment agriculture (CEA) systems, including greenhouses, growth chambers, high tunnels, indoor vertical farms (warehouse type), and modified shipping containers [3,4]. The number of farmers and entrepreneurs who are interested in and engaging in hydroponics is increasing, as evidenced by growing numbers of the training workshops provided by universities (University of Arizona, University of Florida) and industries (FarmTek).
A hydroponic system often recirculates nutrient solution, thus conserving water and fertilizer substantially and reducing environmental pollution when compared to non-circulating systems or field production [5,6,7]. For this reason, high quality water (defined as low salinity water) is often recommended, and nutrient solution is replaced periodically to avoid accumulation of sodium (Na+), chloride (Cl), sulfate (SO42), and others. However, the high-quality water supply is limited in many regions and may not be accessible to growers. Although ion composition in irrigation water varies largely with water source and treatment, Na+ and Cl are the most abundant ions; other ions with significant concentrations include magnesium (Mg2+), SO42–, and bicarbonate (HCO3) [6,8]. The quality of municipal tap water varies largely with source and treatment. In Texas, the electrical conductivity (EC) of tap water ranges from 0.5 to 1.8 dS∙m−1 in cities across the state. Water quality, specifically, EC levels and Na+ and Cl concentrations, of groundwater can also vary largely and may contain high salt levels, especially in arid and semi-arid regions. In west Texas, EC of groundwater is around 3.0 dS∙m−1. Even in water-abundant Ohio, groundwater EC can reach 1.6 dS∙m−1 with a Na+ concentration of 243 mg∙L−1 [9].
In a typical recirculating hydroponic system, nutrient solutions are dumped and refilled at weekly intervals, which is often unnecessary [10]. Some growers supplement their nutrient reservoir with full or partial strength of the same nutrient solution. In order to conserve water and reduce production cost, the frequency of completely replacing nutrient solution should be reduced. Water and nutrient use efficiency can be greatly improved if the interval of dumping and replacing the nutrient solution in the reservoir is extended from a week to two weeks or longer. Certainly, the replacement of reservoir solution can be less frequent if high quality water is used as compared to low quality water or brackish groundwater with high salinity. For example, water quality affected not only growth and accumulation of ions of lettuce plants, but also recirculation intervals of a nutrient solution [11,12].
There is a need to determine the impact of water quality on nutrient solution management and on plant growth and quality such as mineral nutrition in a nutrient recirculation system. The most abundant ions Na+ and Cl in brackish water are basically non-essential elements for plant growth. Carmassi et al. [13] developed a mathematical model based on ion balance to predict Na+ build-up and dynamic changes in EC in a recirculating nutrient solution culture of tomato (Lycopersicon esculentum). Massa et al. [14] used a composite model to simulate water use, EC, and Na+ and NO3 for a recirculating nutrient solution of tomato and used the simulated results to guide the timing of replacing nutrient solution of the reservoir. However, other macronutrients, such as K+ and Mg2+, were not included.
The objective of this study was to quantify the dynamic changes of ion concentrations of all the macronutrients in a recirculating system when marginal water (low salinity) and brackish water (moderate salinity) were used as water sources or as replenishment water. Another objective was to evaluate the impact of marginal water and brackish water on the growth and mineral nutrition of two leafy vegetable species: one leaf lettuce (Lactuca sativa) and one Asian leaf vegetable (three cultivars), pac choi (Brassica rapa var. chinensis). Many small commercial operation systems have a mixed species in one system, such as several kinds of leafy greens, and thus our experiments included two species in one NFT unit. We included three cultivars of pac choi, also known as pak choy or bok choy, because they have drawn ever-increasing attention due to a rapid increase in the Asian population, health consciousness, and the desire for exotic and diversified vegetables, making pac choi one of the most popular leafy Asian vegetable consumed in the U.S. [15,16].

2. Materials and Methods

2.1. Plant Materials and Propagation

Two different greenhouse experiments were conducted from 19 April to 19 May 2016 (30 days) and from 6 September to 12 October 2016 (36 days). Plant material was identical for both of the experiments and included three cultivars of pac choi ‘Mei Qing Choi’, ‘Rosie’, and ‘Tokyo Bekana’ (Brassica rapa var. chinensis), and one cultivar of leaf lettuce ‘Tropicana’ (Lactuca sativa) (Johnny’s Selected Seeds, Winslow, ME, USA). Seeds were sown on 19 April (Expt. 1) and 6 September (Expt. 2) in petri dishes with filter paper soaked with reverse osmosis (RO) water and placed in a growth chamber (25 °C and 50 µmol∙m−2∙s−1 photosynthetic photon flux (PPF)). After three days, germinated seedlings (with elongated radicle) were transferred to rockwool cubes (3.8-cm Plug 25 × 51 cm Sheet, 98 Cubes; Grodan, Roermond, The Netherlands) and were placed in the same growth chamber under a higher PPF of 250 µmol∙m−2∙s−1. The seedlings were sub-irrigated with nutrient solution (CNS17® Grow Formula 3-1-2, Botanicare, LLC, Chandler, AZ, USA) and diluted with RO water to a concentration of 150 mg∙L−1 N and an EC of 1.71 dS∙m−1 and pH of 6.13. The CNS17 Grow Formula, a highly concentrated hydroponics formula, contains 3.0% total nitrogen (N) with 0.14% ammoniacal N and 2.86% nitrate N; 1.0% available phosphate (P2O5), 2.0% soluble potassium (K2O), 3.6% calcium, 0.5% magnesium, 0.05% manganese, and 0.0005% molybdenum.

2.2. Hydroponic System and Greenhouse Climate

Two weeks after sowing, seedlings were transplanted to six NFT hydroponic units (GT50-612; FarmTek, Dyersville, IA, USA) in an enclosed glass greenhouse. Average day/night temperature, relative humidity, and daily light integral for Expt. 1 and 2 were 30.3/21.4 °C, 28.9%, and 14.2 mol∙m−2∙d−1, and 27.5/23.5 °C, 52.3%, and 8.6 mol∙m−2∙d−1, respectively. Each NFT unit consisted of four troughs that measured 200 × 10 × 5 cm with a 3% slope. Each trough had 12 slots for a total capacity of 48 plants per NFT unit. Twelve seedlings of each of the four cultivars were randomly transplanted per NFT unit. A reservoir tank (150 L capacity; Premium Reservoir, Botanicare, Chandler, AZ, USA) and pump were connected to each NFT unit and provided continuous recirculation of treatment solution to the troughs.

2.3. Treatments and Reservoir Tank Replenishment

For both of the experiments, three treatments were created and two NFT units were used per treatment for a total of 96 plants per treatment. In Expt. 1, all six NFT units were initially supplied with 100 L of nutrient solution (Table 1). The treatments consisted of subsequent replenishments of the initial nutrient solution with CNS17 nutrient solution (diluted with RO water), RO water, or tap water. The EC of the tap water was 0.88 dS∙m−1 and the mineral composition included NO3, K+, Na+, Ca2+, Mg2+, P, Cl, and SO42− at 17.7, 7.0, 99.7, 106.3, 11.7, 0.3, 128.7, and 350.0 mg∙L−1, respectively. The EC of the RO water was <10 µS∙cm−1. The quality of the tap water is representative of many marginal water sources, with relatively high Na+ and Cl concentrations. Treatments lasted from 2 May to 19 May, and the reservoir tanks were replenished approximately every four days with approximately 20 L of their respective treatment solution, the loss through evapotranspiration (replenished to the same tank level).
In Expt. 2, the three treatments started with initial solution, as shown in Table 1. The treatments in Expt. 2 represent brackish groundwater in many arid and semi-arid regions. The same nutrient solution used in Expt. 1 was prepared using RO, tap, or tap water plus NaCl, resulting in increasing levels of EC, 1.58, 2.35, or 3.20 dS∙m−1, respectively. Similar to Expt. 1, the reservoir tanks were replenished during the study at regular intervals to the initial tank level instead of completely emptying and refilling the tanks. The reservoir tanks were replenished according to their respective treatment solution, except that the nutrient solution was further diluted to 1/3 strength with EC values of 0.72, 1.62, and 2.40 dS∙m−1, respectively. Treatments lasted from 21 September to 12 October 2016.

2.4. Data Collection and Mineral Analysis

To examine the dynamic changes of macronutrients in the recirculating solution, daily samples were taken at 10:00 am for analysis of EC, pH, NO3, P, K+, Ca2+, SO42−, Mg2+, Na+, and Cl. The concentrations of NO3, K+, Ca2+, and Na+ were measured using a portable LAQUA Twin Nitrate, Potassium, Calcium, and Sodium meters (Horiba, Ltd., Kyoto, Japan), while concentrations of P, Mg2+, and SO42− were determined using the HI 83200 Multiparameter Photometer (HANNA Instruments, Woonsocket, RI, USA). The concentration of Cl was determined by M926 Chloride Analyzer (Cole Parmer Instrument Company, Vernon Hills, IL, USA). EC and pH were measured using the LAQUA Twin EC and pH meters (Horiba, Ltd., Kyoto, Japan).
For both of the experiments, plant height and fresh weight (FW) of shoots were recorded immediately after harvest and dry weight (DW) was determined after oven drying at 70 °C for four days. Relative chlorophyll content (Soil-Plant Analysis Development (SPAD) reading) was recorded using a handheld chlorophyll meter (measured as the optical density; Minolta Camera Co., Osaka, Japan) for all the plants. Leaf samples were collected and stored in a −80 °C freezer for later plant tissue analysis. The frozen tissue samples were thawed at room temperature and sap was extracted using a press. Mineral analysis of the sap was done using the same methods as described previously.
In Expt. 2, dry tissue samples were ground, and mineral analyses were conducted. For the determination of Cl, samples were extracted with 2% acetic acid (EM Science, Gibbstown, NJ, USA) according to the method described in [17] and concentration was determined by a M926 Chloride Analyzer. For other elements, the samples were submitted to the Soil, Water, and Forage Testing Laboratory at Texas A&M University (College Station, TX, USA). Samples were digested in nitric acid following the protocol described in [18] and Ca2+, K+, Na+, Mg2+, P, and S were analyzed by inductively coupled plasma-optical emission spectrometry (SPECTRO Analytical Instruments Inc., Mahwah, NJ, USA) and reported on a dry weight basis as described by Isaac and Johnson [19].

2.5. Statistical Analysis

We acknowledge that a true randomized or blocked design was not achieved in this study, but a pseudo-randomized, split-plot design was used. The treatments served as the whole-plot and the plant varieties served as the sub-plot. Randomization was not complete within each main plot due to the separation of the NFT units; therefore, only randomization within each unit was achieved. Nevertheless, randomized replication was present and a statistical analysis was possible, though we acknowledge the limitation of the conclusions reached. An analysis of variance (ANOVA) was conducted to test the effects of treatment, variety, and interaction of treatment and variety on all of the measured parameters. Mean separation among treatments was conducted using Tukey’s honest significant difference (HSD) multiple comparison. All of the statistical analyses were performed using JMP (Version 12, SAS Institute Inc., Cary, NC, USA).

3. Results

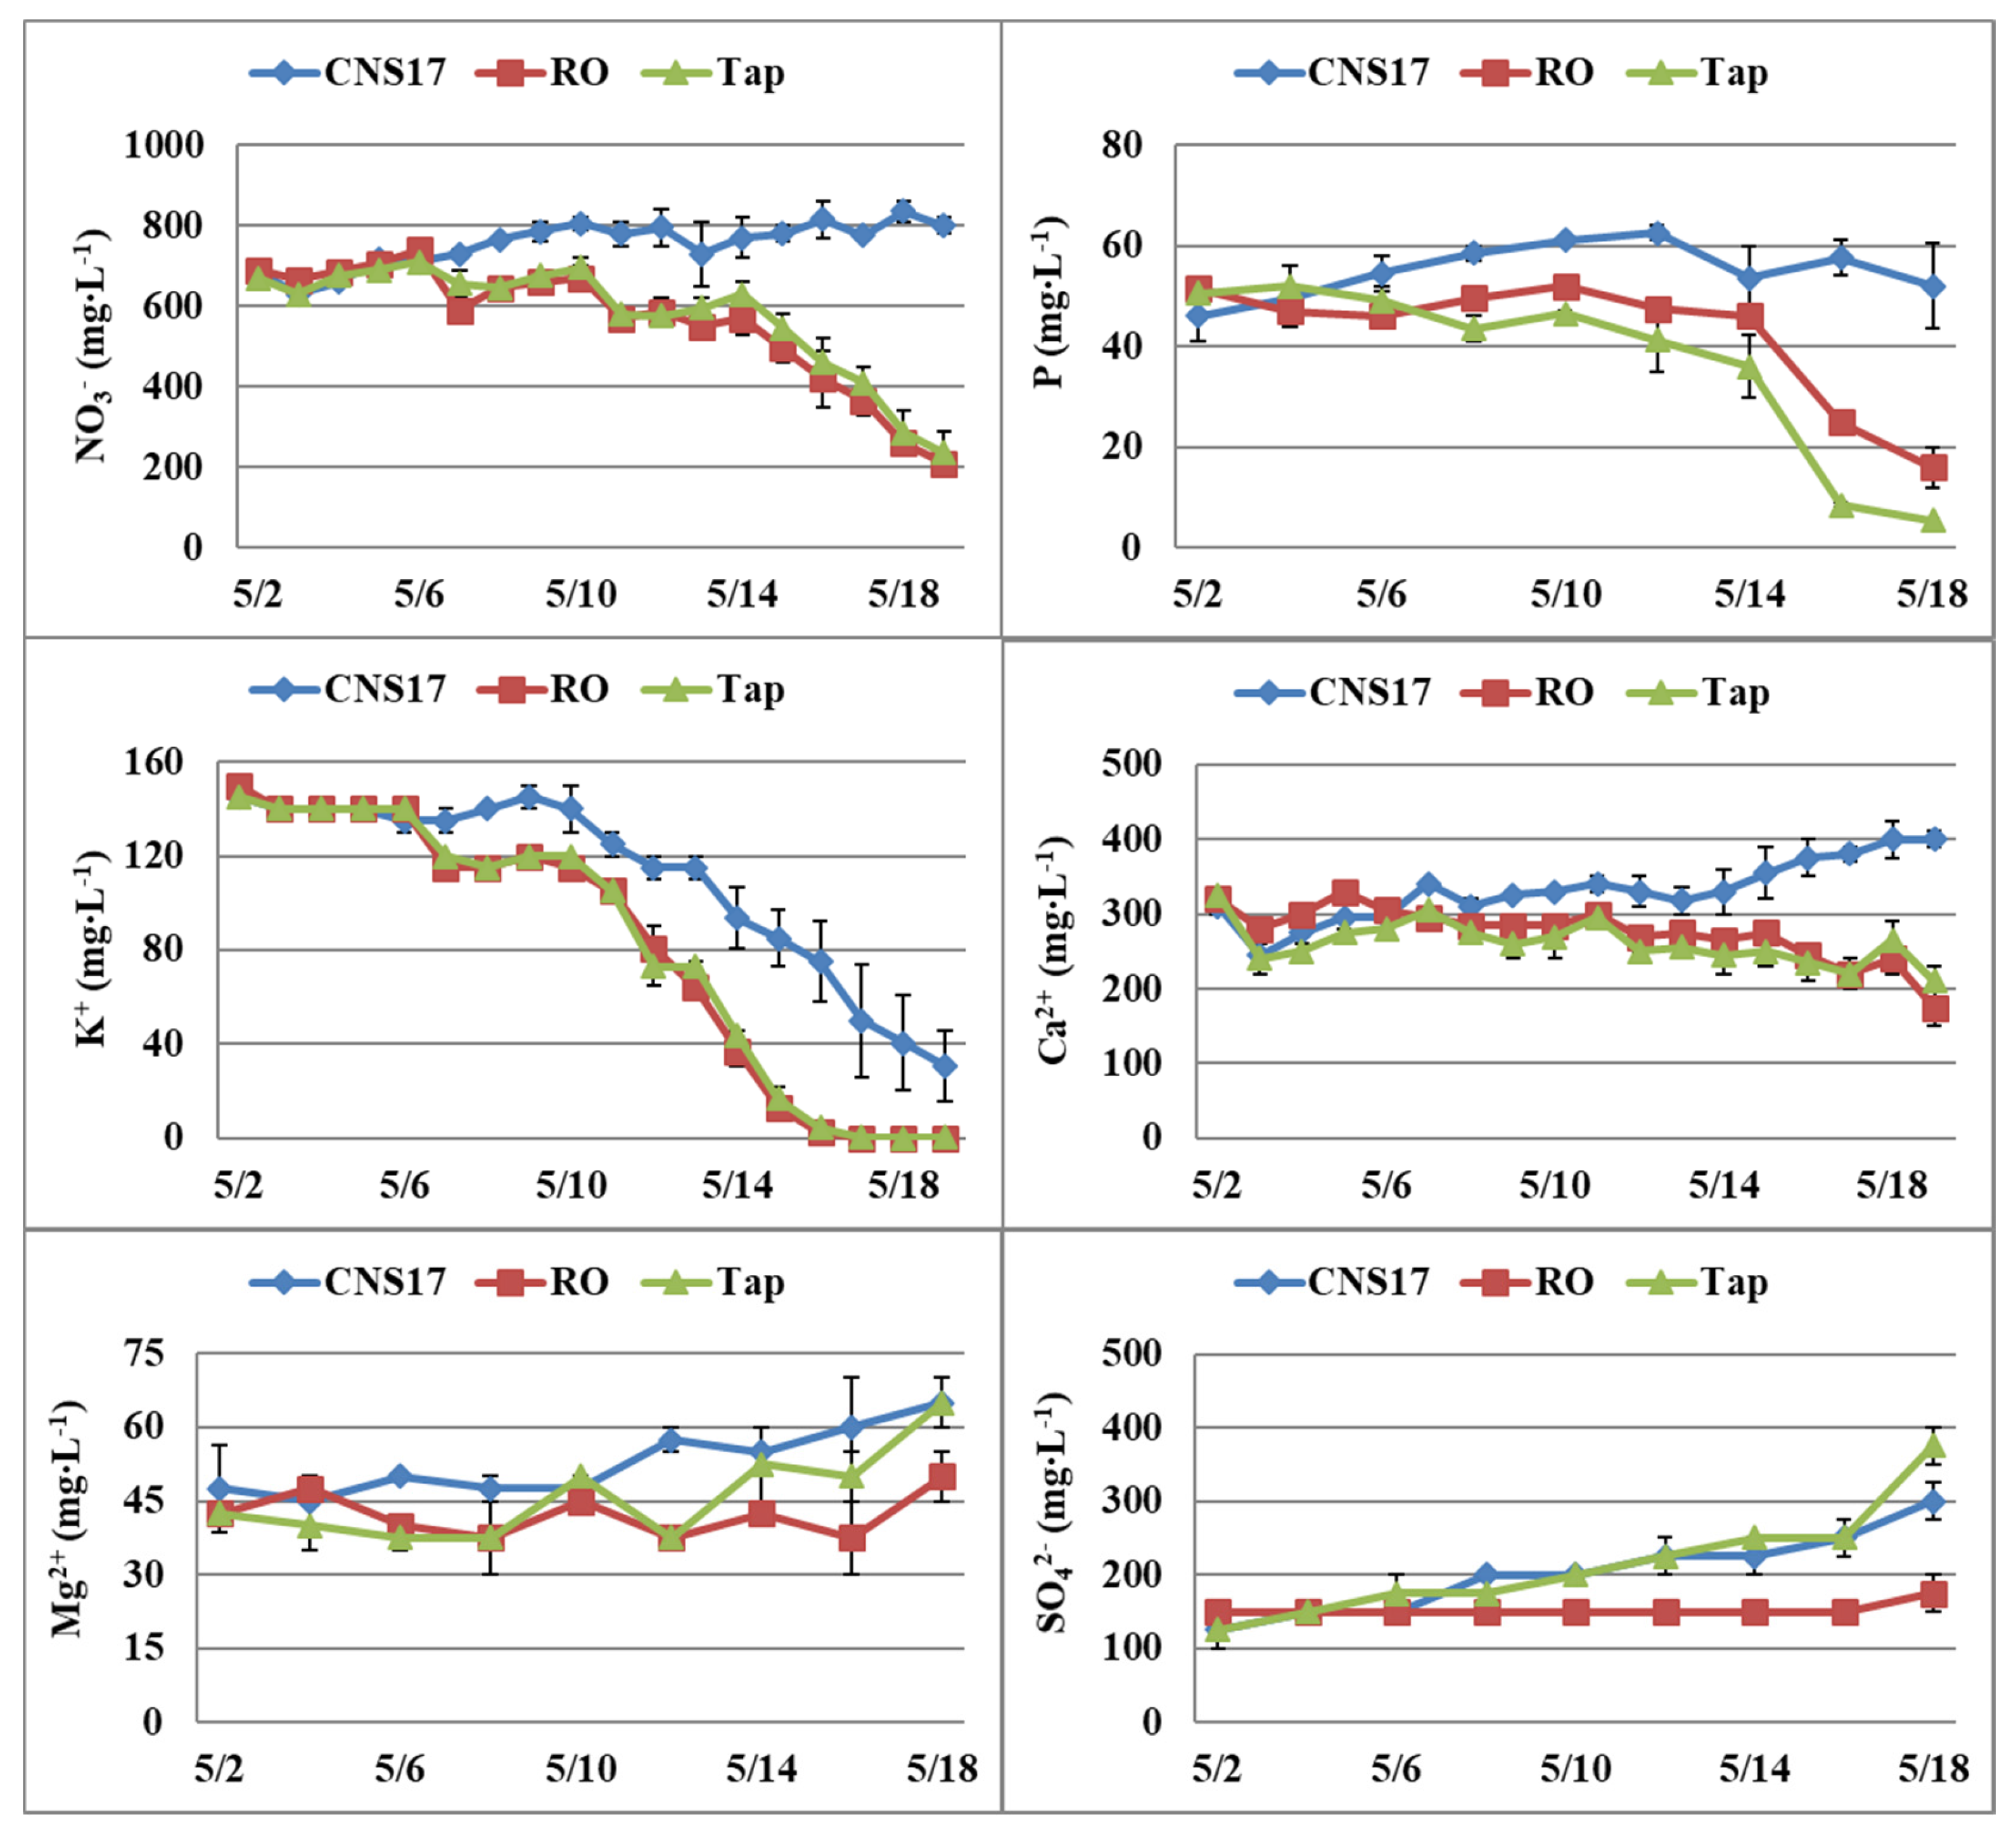
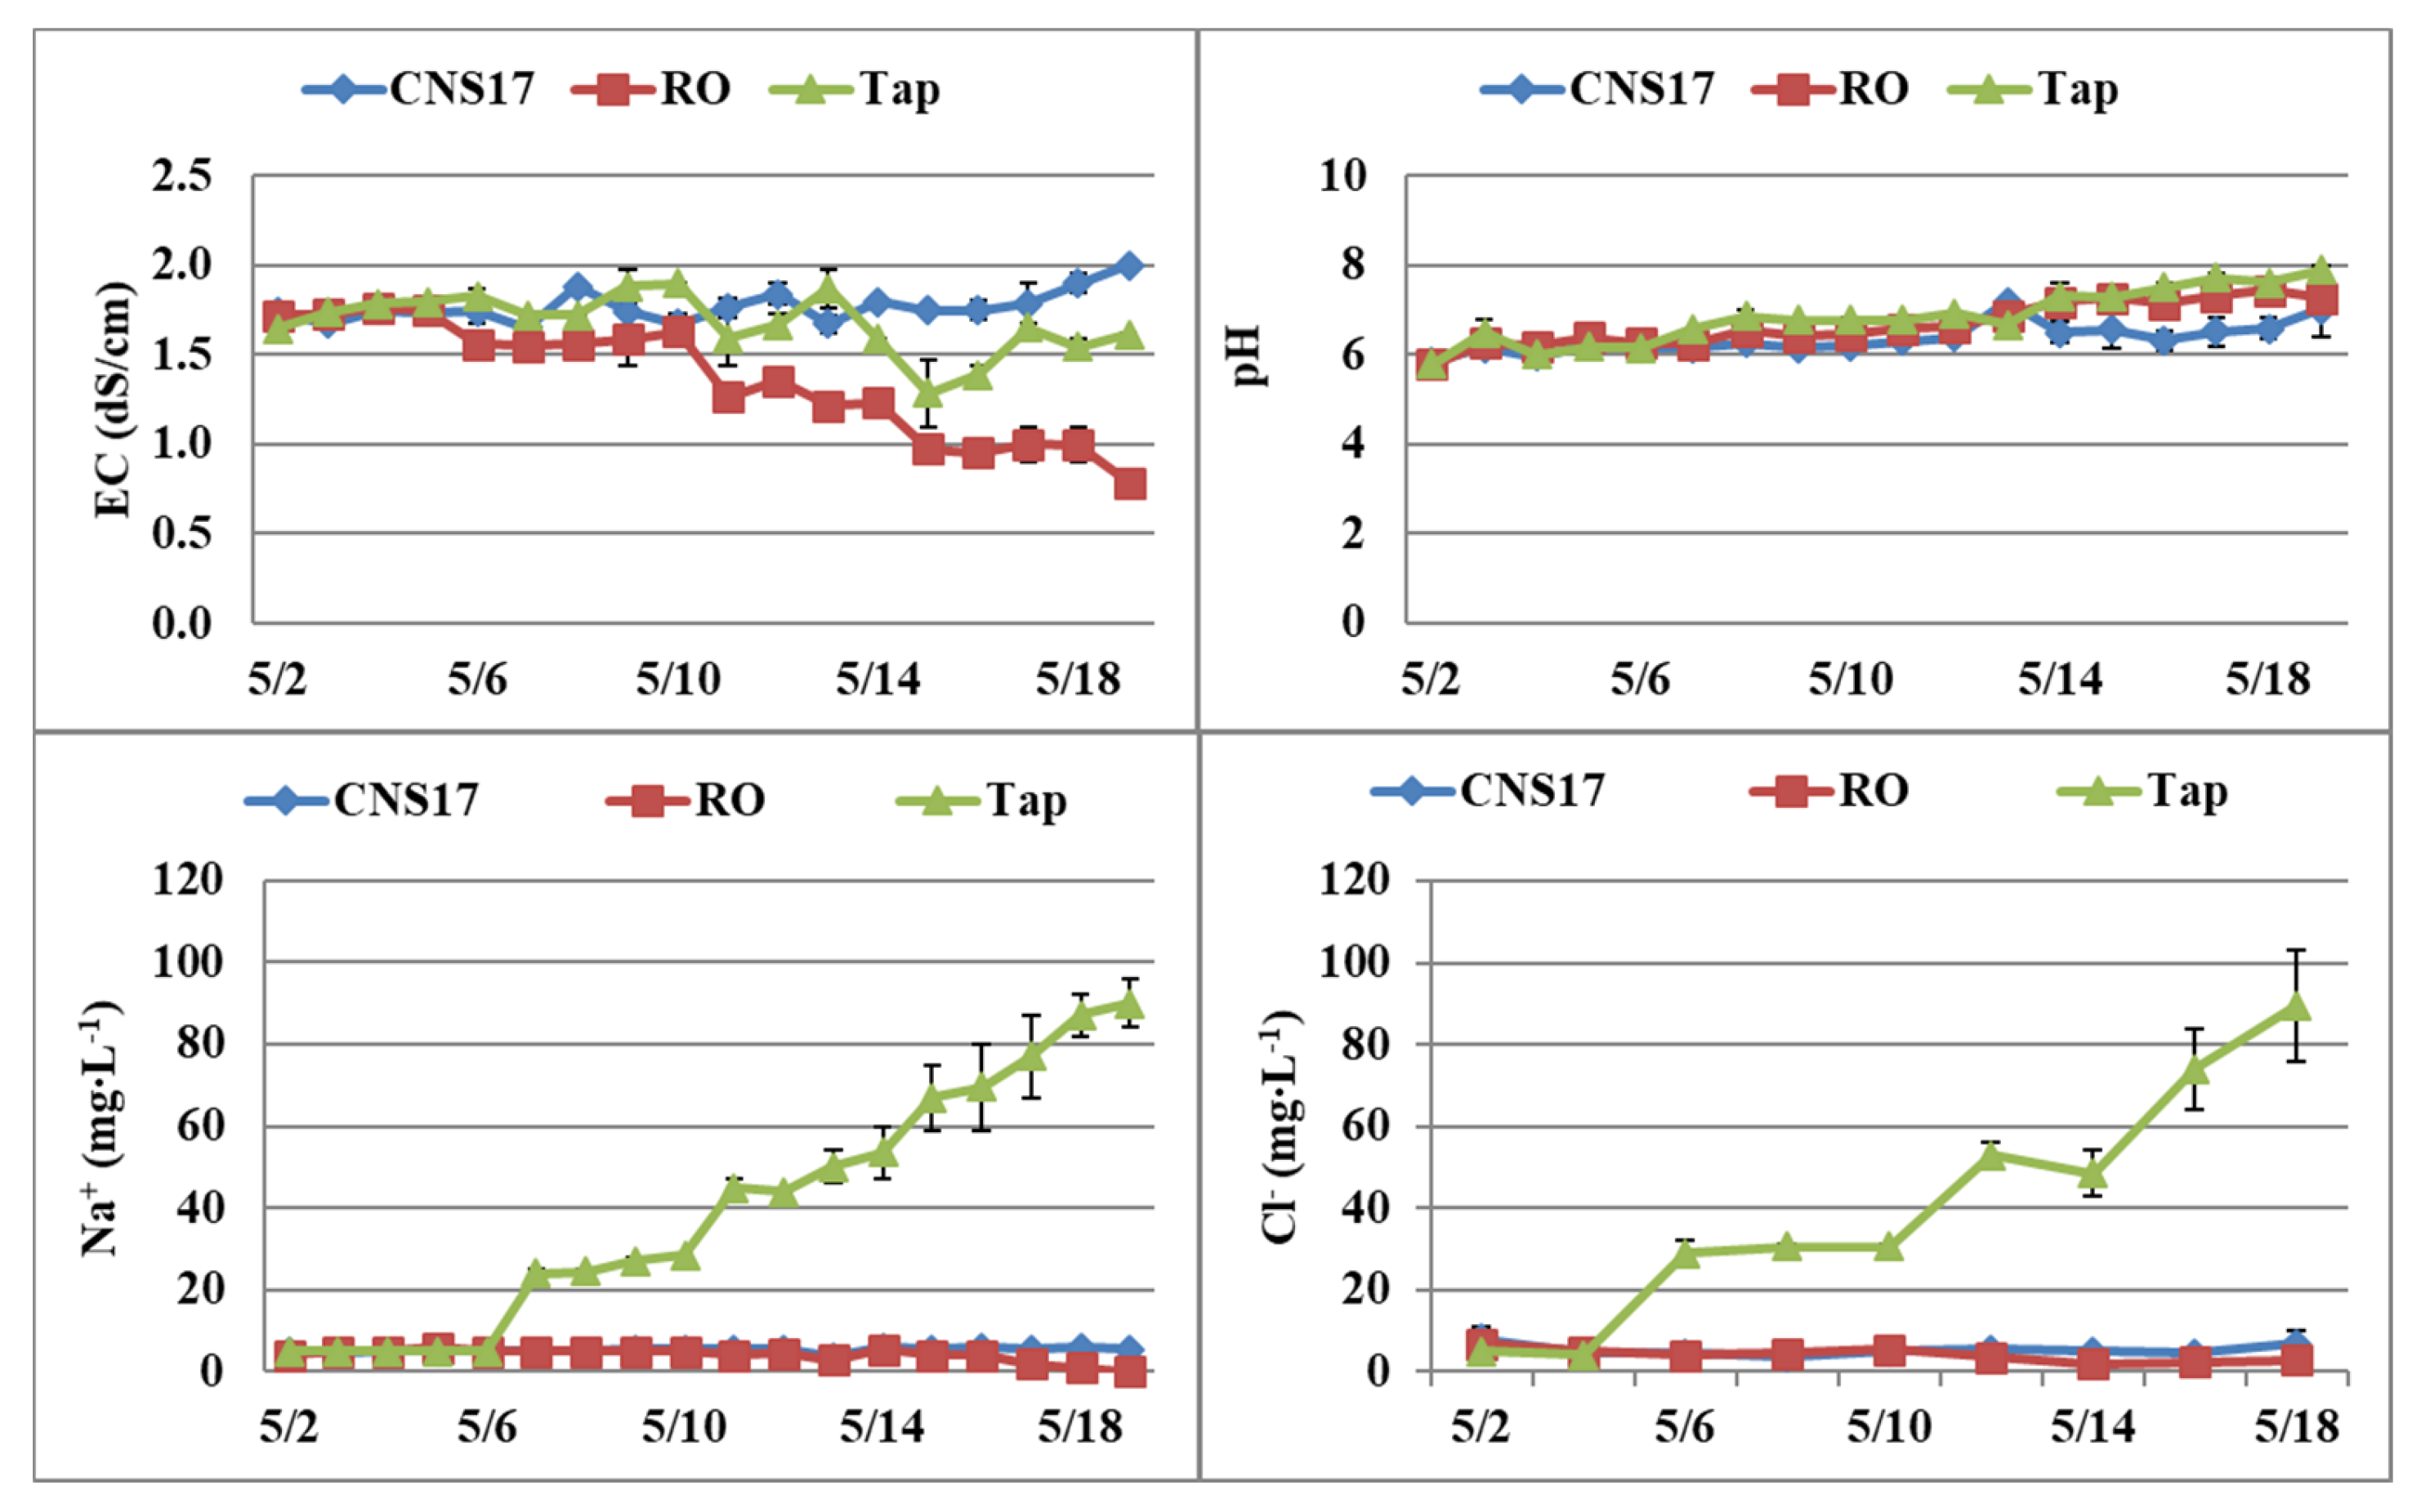
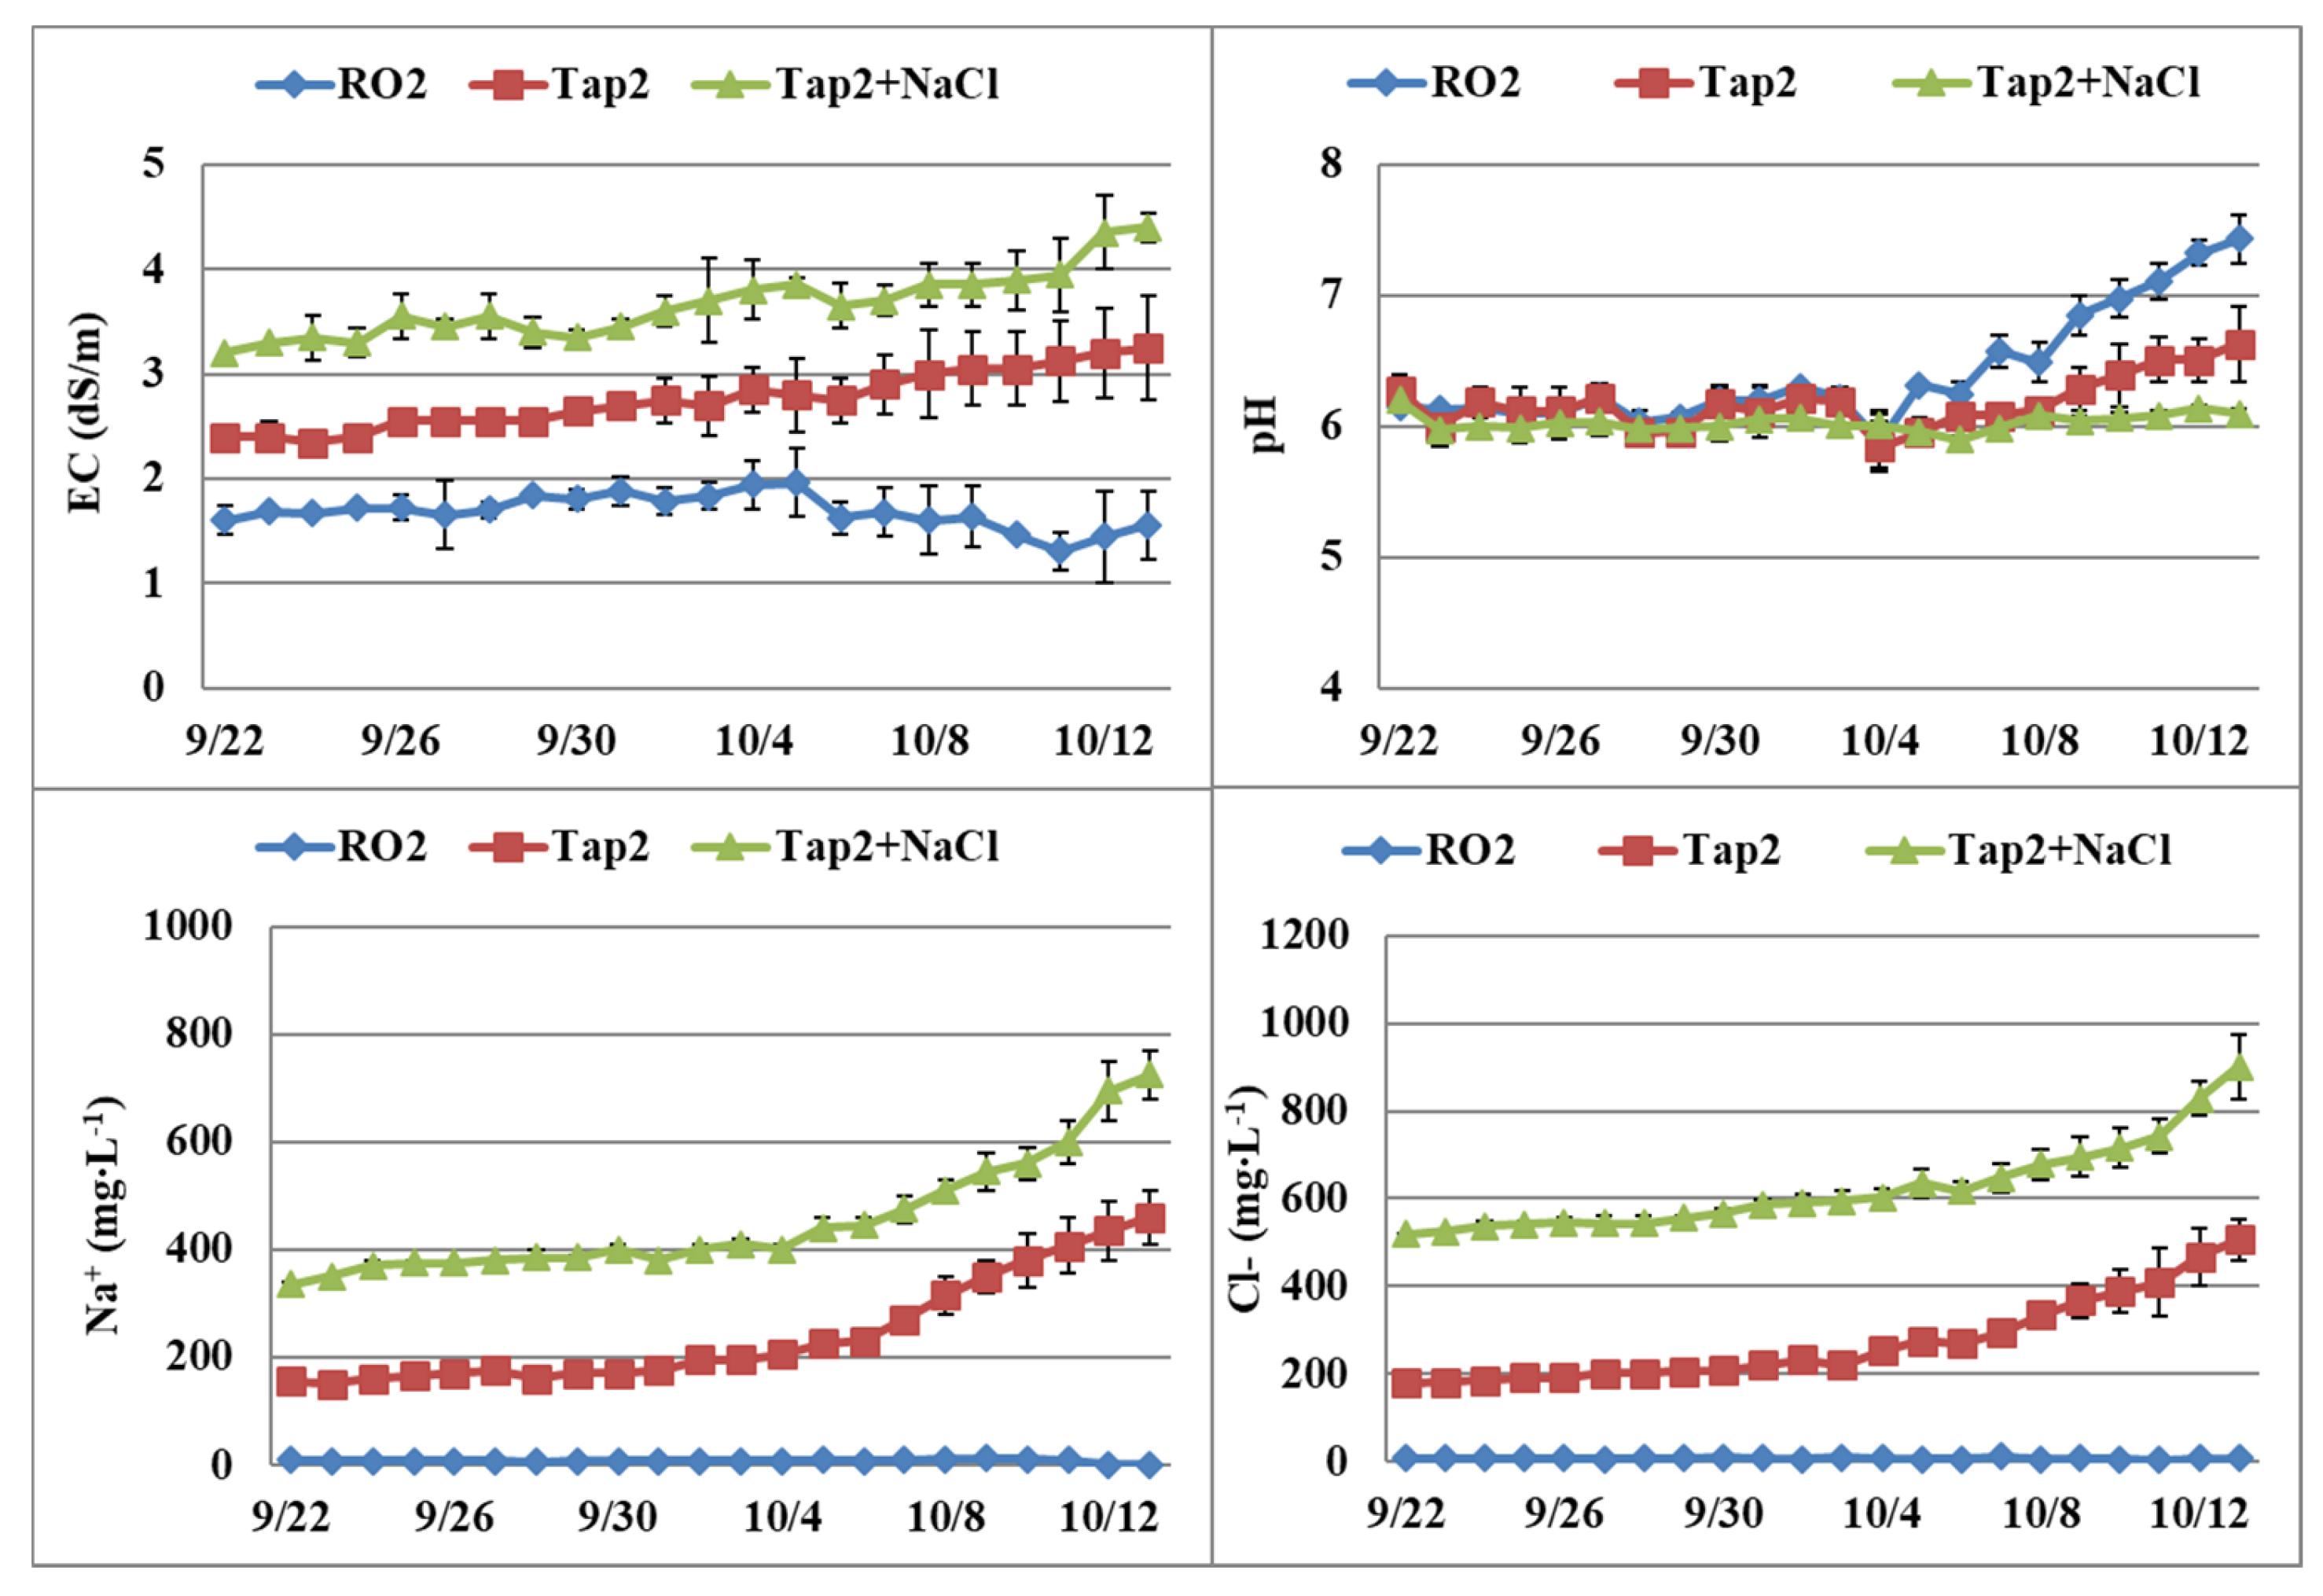
3.1. Dynamic Changes of Ion Concentrations in the Recirculating Solution

In Expt. 1, the NO3 and P in the tanks decreased when supplemented with RO or tap water, while those that were supplemented with nutrient solution remained at similar or levels higher than the initial concentrations (Figure 1). However, K+ decreased to zero at the end of the experiment, 19 days after transplanting, when supplemented with RO or tap water, while those that were supplemented with nutrient solution decreased from about 150 to 30 mg∙L−1. Ca2+ did not change substantially over time, Mg2+ increased when supplemented with nutrient solution, while SO42− increased when supplemented using nutrient solution or tap water.
In Expt. 2, NO3 decreased in the last week for all treatments (Figure 2). P was lower with RO water when compared to the other two water sources. K+ decreased to zero at the end of experiment when RO or tap water was used. K+ did not decrease as much as that in other treatments when NaCl was added to the solution because plant growth was significantly reduced, which reduced K+ absorption. Ca2+ increased over time in all of the treatments, and Mg2+ was slightly higher in tap water in comparison to the other two water sources. SO42− was the lowest in RO water as compared to the other two water sources and increased with time in all of the treatments.
In Expt. 1, EC of the nutrient tanks decreased the most when supplemented with RO water, and no substantial changes were observed when supplemented with the nutrient solution (Figure 3). The pH increased steadily, especially when supplemented with RO or tap water, and reached about 7.5 by the end of the 19-day experiment. Na+ and Cl in the recirculating solution increased steadily when supplemented with tap water.
In Expt. 2, EC of the recirculating solution increased over time when tap water and tap water plus NaCl were used, and pH values were higher at the end of the experiment when RO water was used. Na+ increased steadily in these two water source treatments, especially in the late part of the experiment (Figure 4). Cl concentrations exhibited similar trends among the treatments as those observed in Na+.

3.2. Plant Growth and Relative Chlorophyll Content (SPAD)

Plants responded differently to the solutions (treatments) that were used to replenish the nutrient tank (Table 2) in Expt. 1. No statistical differences were observed for all measured growth parameters among treatments of ‘Tropicana’ leaf lettuce. Similar results were observed for ‘Mei Qing Choi’ pac choi, except for height where plants were shorter when supplemented with RO water, when compared to tap water. For ‘Rosie’ pac choi, plants were shorter when supplemented with nutrient solution or RO water as compared to tap water, and shoot FW was the lowest when using RO water. ‘Tokyo Bekana’ pac choi plants were shorter when using nutrient solution or RO water when compared to tap water, and shoot FW was the lowest with RO water. Shoot DW was greater when supplemented with nutrient solution as compared to RO water, but no difference was observed between nutrient solution and tap water. Supplementing water source did not influence SPAD reading, regardless of vegetable varieties. However, there were significant differences in SPAD readings among varieties. ‘Mei Qing Choi’ and ‘Rosie’ pac choi had the highest SPAD readings (37 to 40), while ‘Tokyo Bekana’ pac choi had the lowest (20), and leaf lettuce had an average of 33.
In Expt. 2, plants responded different to the type of water used for making initial solution and for replenish the nutrient tank (Table 3). The addition of NaCl significantly reduced the growth of all the vegetables. ‘Tropicana’ leaf lettuce was the most sensitive with 41.7% mortality. ‘Rosie’ pac choi was the second least tolerant variety among the four. Based on reduction in plant height, FW, and DW, ‘Mei Qing Choi’ and ‘Tokyo Bekana’ pac choi were equally tolerant to NaCl. There were no differences in growth between RO and tap water for all of the varieties, except for the height and shoot FW for ‘Rosie’. SPAD was reduced by NaCl in ‘Tropicana’ leaf lettuce and ‘Rosie’ pac choi.

3.3. Mineral Nutrition

In Expt. 1, leaf sap NO3 and P concentrations were reduced in ‘Tropicana’ leaf lettuce, but not in the three pac choi cultivars, when supplemented with RO or tap water (Table 4). Leaf sap K+ was reduced in ‘Rosie’ pac choi, but not in the other varieties. The supplementing water source did not impact the leaf sap Ca2+, Mg2+, and SO42− concentration of any of the vegetables, with the exception of ‘Tropicana’ leaf lettuce that had reduced Ca2+ content. Leaf sap Na+ of all vegetables increased significantly when supplemented with tap water.
In Expt. 2, tap water or tap water plus NaCl significantly increased leaf Na+ and Cl concentrations (Table 5). Water source did not affect leaf Ca2+, K+, P, SO42−, and Mg2+, except for ‘Tokyo Bekana’ pac choi where NaCl addition decreased Ca2+ and Mg2+.

4. Discussion

It is obvious from our results that nutrient management, such as time and necessity of replacing the nutrient reservoir based on EC, could be risky when water with high salt levels is used in a nutrient recirculating system. Conventional EC-based nutrient management leads to luxury consumption of water and fertilizers and causes environment pollution [20]. On the other hand, programmed nutrient addition based on pre-established nutrient requirement is more effective and efficient, provided that the growing conditions and tolerance to salinity are similar [20]. The goal of nutrient management in a recirculation system is to minimize the discharge of water and nutrients, while maintaining comparable yield and quality. By feeding tomato plants with a nutrient solution based on “uptake concentration” and transpiration-biomass ratio, a targeted management approach with consideration of plant tissue concentration of N, P, K+, Ca2+, Mg2+, and Na+, use of brackish water was feasible without impacting yield and quality [21]. However, no such research has been performed with hydroponic lettuce crops.
Among the macronutrients, K+ was unquestionably the most rapidly absorbed element in the solution, especially when the plants were large. Bugbee [10] pointed out that N, P, K, and Mn are actively absorbed by roots and can be removed from the solution in a few hours. In both experiments, K+ in the solution decreased quickly, followed by N and P at the late stage. When additional NaCl was added to the solution in Expt. 2, which significantly reduced plant growth, K+ was more slowly absorbed when compared to the two treatments without NaCl addition. Other macronutrient elements such as Ca2+, Mg2+, and SO42− were still at sufficiently high levels or even higher at the end of the experiments than initial levels, due to the water source containing those elements. The leaf tissue mineral results (P, K+, Ca2+, Mg2+ in Table 5) were in the adequate to high range [22]. The leaf sap results (Table 3) were obtained by measuring the sap using a portable meter instead of digestion of dried ground tissue, thus comparison to the latter standard method is not appropriate.
The impact of nutrient solution and water source on plant growth and mineral nutrition varied with type of vegetables. For example, in Expt. 1, plant growth of ‘Tokyo Bekana’ was reduced when it was supplemented with RO water compared to tap water and nutrient solution. ‘Tokyo Bekana’ grew more quickly than the pac choi varieties and needed more nutrients to sustain its growth. Nevertheless, there were no statistical differences in Expt. 1 in the tissue mineral nutrition except for NO3, Ca2+, and P for leaf lettuce. Therefore, in order to prevent a decrease or deficiency of mineral nutrition, N, P, and especially K should be supplemented every two weeks or less when plants are larger in this system. However, N, P, and K should be kept at low concentrations, such as 0.1 mM or a few milligrams per liter, according to Bugbee [10], because high concentrations of these elements in solution can result in excessive uptake, leading to nutrient imbalance. It is worth pointing out that the frequency of changing solution also depends on reservoir volume and the biomass of plants, or the ratio of the volume of nutrient solution to biomass.
The threshold of EC, Na+, or Cl of the water source for a recirculating nutrient solution depends on species or variety and length of production period. In Expt. 2, the initial levels of Na+ in tap water and tap water plus NaCl treatments were relatively high (155 and 335 mg∙L−1) and continued increasing over time when supplemented with the same source of water. These values were much higher than the recommended “water quality” standard in The Netherlands [6]. In a non-recirculating soilless culture system, the salinity threshold of the water source could be higher than that for a recirculating system. However, a non-recirculating system would reduce water use efficiency. Hamdy et al. [23] showed a high potential of using saline water (4.0 dS∙m−1) for production of lettuce and endive crops with use of inert substrates in a non-recirculating system.
Tolerance to NaCl differed among the vegetable species and varieties. Both ‘Mei Qing Choi’ and ‘Tokyo Bekana’ pac choi had similar growth and mineral nutrition when RO water or tap water was used for making the solution or supplementing solution. The solution made from tap water had EC levels between 2.4 and 3.2 dS∙m−1 and Na+ between 155 to 460 mg∙L−1, indicating that these two varieties were relatively tolerant to salinity. ‘Tropicana’ leaf lettuce was the least tolerant among the four used in this study. Lettuce is generally considered to be salt sensitive. However, differences in salt tolerance does exist among genotypes. Xu and Mou [24] evaluated 178 cultivars and germplasm accessions of lettuce, and found that some lettuce varieties showed salt tolerance with less than 15% growth reduction when grown in a Hoagland nutrient solution with NaCl/CaCl2 = 30/15 (mM/ mM) (corresponding to an EC of 5.3 dS∙m−1).
A low to medium salinity of the nutrient solution can enhance produce quality. Kim et al. [25] reported that romaine lettuce that was irrigated with low salt concentration (5 mM NaCl, corresponding to EC at 0.5 dS∙m−1 without considering other nutrients) for 15 days increased carotenoid content without causing a decline in yield or visual quality. A study conducted by Sakamoto et al. [26] in a closed plant factory indicated that red leaf lettuce (cv. Mother-red) that was grown in a nutrient solution at high salinity by adding NaCl to EC of 12.6 dS∙m−1 contained higher amounts of sugar and anthocyanin, and lettuce grown in nutrient solution with addition of seawater at EC of 10 dS∙m−1 accumulated the highest levels of photosynthetic pigments, chlorophylls, and carotenoids. However, the fresh weight of lettuce was greatly reduced. They suggested that adding seawater (20%) to the solution is effective for producing lettuce with higher quality and nutritional value.
In summary, from the daily measurement of the concentrations of macronutrients in the recirculating NFT systems, K+ was the most rapidly absorbed element, followed by N and P, while other macronutrients remained at sufficiently high levels at the end of the experiments. Thus, N, P, and especially K, should be supplied at two-week intervals or less in the current NFT system, while the interval of replacing the nutrient tank should be based on the buildup of the concentration of harmful ions like Na+ and Cl. The exact time for supplementing N, P, and K depends on the volume of the reservoir, the amount of biomass in the system, and the tolerance of the crops to salinity. The impact of the water source on plant growth and mineral nutrition varied with species and variety of the vegetables. The results from this study indicated a potential use of marginal and possibly brackish water, of low to moderate salinity, in a recirculating hydroponic system, depending on salt tolerance of the crops.

Acknowledgments

This research is partially supported by National Institute of Food and Agriculture of Department of Agriculture Hatch project TEX090450 and Texas A&M AgriLife Research. The content is solely the responsibility of the authors and does not necessarily represent the official views of the funding agencies. Mention of a trademark, proprietary product, or vendor does not constitute a guarantee or warranty of the product by the authors or their respective institutions and does not imply their approval to the exclusion of other products or vendors that may also be suitable. The authors appreciate the assistance from visiting scholars Lifei Chen and Qiang Liu in carrying out the experiments. Thanks to Triston Hooks for improving the Materials and Methods section.

Author Contributions

Genhua Niu and Joseph G. Masabni conceived and designed the experiments; Youping Sun performed the experiments and data analysis; Genhua Niu drafted the manuscript with assistance from other authors. All authors contributed to improving and editing the final version.

Conflicts of Interest

The authors declare no conflict of interest. The funding sponsors had no role in the design of the study; in the collection, analyses, or interpretation of data; in the writing of the manuscript, and in the decision to publish the results.

References

  1. Craver, J.K.; Williams, K.A. Assessing student learning from an experiential module in a greenhouse management course using hydroponics and recirculating solution culture. HortTechnology 2014, 24, 610–617. [Google Scholar]
  2. Wortman, S.E. Crop physiological response to nutrient solution electrical conductivity and pH in an ebb-and-flow hydroponic system. Sci. Hort. 2015, 194, 34–42. [Google Scholar] [CrossRef]
  3. Kozai, T.; Niu, G.; Takagaki, M. Plant Factory: An Indoor Vertical Farming System for Efficient Quality Food Production; Academic Press: San Diego, CA, USA, 2015. [Google Scholar]
  4. Walter, K.J.; Currey, C.J. Hydroponic greenhouse basil production: Comparing systems and cultivars. HortTechnology 2015, 25, 645–650. [Google Scholar]
  5. Kumar, R.R.; Cho, J.Y. Reuse of hydroponic waste solution. Environ. Sci. Pollut. Res. 2014, 21, 9569–9577. [Google Scholar] [CrossRef] [PubMed]
  6. Neocleous, D.; Savvas, D. NaCl accumulation and macronutrient uptake by a melon crop in a closed hydroponic system in relation to water uptake. Agric. Water Manag. 2016, 165, 22–32. [Google Scholar] [CrossRef]
  7. Schwarz, D.; Franken, P.; Krumbein, A.; Klaring, H.P.; Bar-Yosef, B. Nutrient management in soilless culture in the conflict of plant, microorganism, consumer and environmental demand. Acta Horticult. 2009, 843, 27–34. [Google Scholar] [CrossRef]
  8. Grattan, S.R.; Grieve, C.M. Salinity–mineral nutrient relations in horticultural crops. Sci. Hort. 1999, 78, 127–157. [Google Scholar] [CrossRef]
  9. Fausey, B.; Bauerle, B.; Draper, C.; Hansen, R.; Keener, H.; Ling, P. Research and outreach efforts sustain Ohio hydroponic industry. Acta Horticult. 2009, 843, 389–392. [Google Scholar] [CrossRef]
  10. Bugbee, B. Nutrient management in recirculating hydroponic culture. Acta Horticult. 2004, 648, 99–112. [Google Scholar] [CrossRef]
  11. Soares, H.R.; Silva, E.F.d.F.e.; Silva, G.F.d.; Pedrosa, E.M.R. Lettuce growth and water consumption in NFT hydroponic system using brackish water. Revista Brasileira de Engenharia Agricola e Ambiental 2015, 19, 636–642. [Google Scholar] [CrossRef]
  12. Cova, A.M.W.; Freitas, F.T.O.; Soares, P.C. Content of inorganic solutes in lettuce grown with brackish water in different hydroponic systems. Revista Brasileira de Engenharia Agricola e Ambiental 2017, 21, 150–155. [Google Scholar] [CrossRef]
  13. Carmassi, G.; Incrocci, L.; Maggini, R.; Malorgio, F.; Tognoni, F.; Pardossi, A. Modeling salinity build-up in recirculating nutrient solution culture. J. Plant Nutr. 2005, 28, 431–445. [Google Scholar] [CrossRef]
  14. Massa, D.; Incrocci, L.; Maggini, R.; Bibbiani, C.; Carmassi, G.; Malorgio, F.; Pardossi, A. Simulation of crop water and mineral relatons in greenhouse soilless culture. Environ. Model. Softw. 2011, 26, 711–722. [Google Scholar] [CrossRef]
  15. Molinar, R. Indigenous Asian specialty vegetables in the central valley of California. HortScience 2012, 47, 835–838. [Google Scholar]
  16. Sciarappa, W.J.; Simon, J.; Govindasamy, R.; Kelly, K.; Mangan, F.; Zhang, S.; Arumugam, S.; Nitzsche, P.; Van Vranken, R.; Komar, S.; et al. Asian crops overview: Consumer preference and cultivar growth on the east coast of the United States. HortScience 2016, 51, 1344–1350. [Google Scholar] [CrossRef]
  17. Gavlak, R.G.; Horneck, D.A.; Miller, R.O. Plant, Soil, and Water Reference Methods for the Western Region; University of Alaska: Fairbanks, AK, USA, 1994. [Google Scholar]
  18. Havlin, J.L.; Soltanpour, P.N. A nitric acid and plant digest method for use with inductively coupled plasma spectrometry. Commun. Soil Sci. Plant Anal. 1989, 14, 969–980. [Google Scholar] [CrossRef]
  19. Isaac, R.A.; Johnson, W.C. Collaborative study of wet and dry ashing techniques for the elemental analysis of plant tissue by atomic absorption spectrophotometry. J. Assoc. Off. Anal. Chem. 1975, 58, 436–440. [Google Scholar]
  20. Pardossi, A.; Malorgio, F.; Incrocci, L.; Campiotti, C.A.; Tognoni, F. A comparison between two methods to control nutrient delivery to greenhouse melons grown in recirculating nutrient solution culture. Sci. Horticult. 2002, 92, 89–95. [Google Scholar] [CrossRef]
  21. Signore, A.; Serio, F.; Santamaria, P. A targeted management of the nutrient solution in a soilless tomato crop according to plant needs. Front. Plant Sci. 2016. [Google Scholar] [CrossRef] [PubMed]
  22. Hochmuth, G.; Maynard, D.; Vavrina, C.; Hanlon, E.; Simonne, E. Plant Tissue Analysis and Interpretation for Vegetable Crops in Florida; University of Florida IFAS Extension: Gainesville, FL, USA, 2015. [Google Scholar]
  23. Hamdy, A.; Alghazal, R.K.; Pacucci, G.; Troccoli, C. Green salad production in soilless culture under saline irrigation. Acta Horticult. 2009, 843, 103–110. [Google Scholar] [CrossRef]
  24. Xu, C.; Mou, B. Evaluation of lettuce genotypes for salinity tolerance. HortScience 2015, 50, 1441–1446. [Google Scholar]
  25. Kim, H.J.; Fonseca, J.M.; Choi, J.H.; Kubota, C.; Kwon, D.Y. Salt in irrigation water affects the nutritional and visual properties of romaine lettuce (Lactuca sativa L.). J. Agric. Food Chem. 2008, 56, 3772–3776. [Google Scholar] [CrossRef] [PubMed]
  26. Sakamoto, K.; Kogi, M.; Yanagisawa, T. Effects of salinity and nutrients in seawater on hydroponic culture of red leaf lettuce. Environ. Control Biol. 2014, 52, 189–195. [Google Scholar] [CrossRef]
Figure 1. Dynamic changes of nitrate (NO3), phosphorus (P), potassium (K+), calcium (Ca2+), magnesium (Mg2+), and sulfate (SO42−) in nutrient tanks of the nutrient film technique (NFT) system supplemented with nutrient solution (CNS17), reverse osmosis (RO) water, or tap water (Expt. 1). Vertical bars represent standard error (n = 2).
Horticulturae 04 00006 g001
Figure 2. Dynamic changes of nitrate (NO3), phosphorus (P), potassium (K+), calcium (Ca2+), magnesium (Mg2+), and sulfate (SO42−) in nutrient tanks of the nutrient film technique (NFT) system with start nutrient solutions (CNS17) prepared with reverse osmosis (RO2) water, tap water (Tap2), or tap water plus NaCl (Expt. 2). Vertical bars represent standard error (n = 2).
Horticulturae 04 00006 g002
Figure 3. Dynamic changes of electrical conductivity (EC), pH, and sodium (Na+) and chloride (Cl) contents in nutrient tanks of the nutrient film technique (NFT) system supplemented with nutrient solution (CNS17), reverse osmosis (RO) water, or tap water (Expt. 1). Vertical bars represent standard error (n = 2).
Horticulturae 04 00006 g003
Figure 4. Dynamic changes of electrical conductivity (EC), pH, and sodium (Na+) and chloride (Cl) contents in nutrient tanks of the nutrient film technique (NFT) system with start nutrient solutions (CNS17) prepared with reverse osmosis (RO2) water, tap water (Tap2), or tap water plus NaCl (Expt. 2). Vertical bars represent standard error (n = 2).
Horticulturae 04 00006 g004
Table 1. Description of treatments in both Experiments. CNS17, a highly concentrated hydroponics formula; NS, nutrient solution; EC, electrical conductivity; RO, reverse osmosis.
Expt. 1
Treatments
Initial SolutionEC (dS∙m−1)Replenishment SolutionEC (dS∙m−1)
CNS17CNS17 NS made with RO water1.58CNS17 NS made with RO water1.58
ROCNS17 NS made with RO water1.58RO water<0.01
TapCNS17 NS made with RO water1.58Tap water0.88
Expt. 2
Treatments
Initial SolutionEC (dS∙m−1)Replenishment SolutionEC (dS∙m−1)
RO2CNS17 NS made with RO water1.581/3 strength of CNS17 NS made with RO water0.72
Tap2CNS17 NS made with tap water2.351/3 strength of CNS17 NS made with tap water1.62
Tap2 + NaClCNS17 NS made with tap water + NaCl3.201/3 strength of CNS17 NS made with tap water + NaCl2.40
Table 2. Plant height, shoot fresh weight (FW), dry weight (DW), and SPAD of two vegetable species (leaf lettuce, Lactuca sativa ‘Tropicana’ and three cultivars of pac choi, Brassica rapa var. chinensis ‘Tokyo Bekana’, ‘Mei Qing Choi’, and ‘Rosie’) grown in a nutrient film technique (NFT) system supplemented with nutrient solution (CNS17), reverse osmosis (RO) water, or tap water (Tap) to replace nutrient solution consumption (Expt. 1).
VarietyTreatmentHeight (cm)Shoot FW (g)Shoot DW (g)SPAD
Leaf lettuce ‘Tropicana’CNS1720.5 a z87.8 a4.4 a32.0 a
RO20.7 a90.3 a4.3 a34.6 a
Tap20.4 a90.7 a4.0 a32.6 a
Pac choi ‘Mei Qing choi’CNS1723.9 ab100.5 a4.9 a39.8 a
RO22.9 b98.8 a5.1 a40.3 a
Tap25.2 a97.7 a4.2 a39.3 a
Pac choi ‘Rosie’CNS1727.1 b54.0 a3.3 a37.0 a
RO26.3 b45.9 b2.8 a39.1 a
Tap29.7 a56.9 a3.3 a38.3 a
Pac choi ‘Tokyo Bekna’CNS1729.4 b154.5 a8.1 a20.5 a
RO27.2 b110.2 b6.0 b18.7 a
Tap32.0 a167.7 a7.7 ab20.8 a
Variety<0.0001<0.0001<0.0001<0.0001
Treatment<0.0001<0.0001NSNS
Variety × Treatment0.0444<0.00010.0030.0154
z Means followed with different lowercase letters for each variety are significantly different among treatments by Tukey’s honest significant difference (HSD) multiple comparison at p < 0.05. NS, no significance.
Table 3. Plant height, shoot fresh weight (FW), dry weight (DW), and SPAD of two vegetable species (leaf lettuce, Lactuca sativa ‘Tropicana’ and three cultivars of pac choi, Brassica rapa var. chinensis ‘Tokyo Bekana’, ‘Mei Qing Choi’, and ‘Rosie’) grown in a nutrient film technique (NFT) system with start nutrient solutions (CNS17) prepared with reverse osmosis (RO2) water, tap water (Tap2), or tap water plus NaCl (Tap2 + NaCl) (Expt. 2).
VarietyTreatmentHeight (cm)Shoot FW (g)Shoot DW (g)SPAD
Leaf lettuce ‘Tropicana’RO2 25.1 a z81.0 a6.4 a31.8 a
Tap224.9 a75.2 a5.6 a31.4 a
Tap2 + NaCl12.7 b7.8 b0.1 b25.0 b
Pac Choi ‘Mei Qing Choi’RO224.6 a90.1 a6.6 a38.6 a
Tap226.5 a97.8 a6.7 a38.6 a
Tap2 + NaCl21.0 b57.6 b3.1 a36.8 a
Pac Choi ‘Rosie’RO229.0 b49.4 b3.1 a36.4 a
Tap231.5 a60.3 a3.4 a34.3 ab
Tap2 + NaCl23.0 c32.1 c1.2 b33.4 b
Pac Choi ‘Tokyo Bekana’RO233.1 a161.8 a10.4 a16.2 a
Tap236.1 a166.8 a12.2 a15.5 a
Tap2 + NaCl28.0 b76.8 b7.5 a17.5 a
Variety<0.0001<0.0001<0.0001<0.0001
Treatment<0.0001<0.0001<0.0001<0.0001
Variety × Treatment<0.0001<0.0001NS<0.0001
z Means followed with different lowercase letters for each variety are significantly different among treatments by Tukey’s honest significant difference (HSD) multiple comparison at p < 0.05. NS, no significance.
Table 4. Leaf sap mineral contents of two vegetable species (leaf lettuce, Lactuca sativa ‘Tropicana’ and three cultivars of pac choi, Brassica rapa var. chinensis ‘Tokyo Bekana’, ‘Mei Qing Choi’, and ‘Rosie’) grown in a nutrient film technique (NFT) system supplemented with nutrient solution (CNS17), reverse osmosis (RO) water or tap water (Tap) (Expt. 1).
VarietyTreatmentMineral Nutrition (mg per g of Sap) z
NO3PK+Ca2+Mg2+SO42−Na+
Leaf lettuce ‘Tropicana’CNS174050 a y544 a3550 a125 b155 a375 a42 b
RO2300 b399 b2075 a180 a225 a275 a86 b
Tap2525 b245 c2350 a158 ab163 a200 a325 a
Pac Choi ‘Mei Qing Choi’CNS175475 a289 a3175 a393 a250 a1250 a47 b
RO4750 a226 a2725 a548 a325 a1300 a102 b
Tap4625 a183 a2500 a483 a300 a1563 a540 a
Pac Choi ‘Rosie’CNS177025 a291 a3750 a410 a375 a1075 a58 b
RO5750 a245 a2850 ab578a450 a1150 a93 b
Tap5500 a223 a2600 b463 a463 a1250 a778 a
Pac Choi ‘Tokyo Bekana’CNS177500 a282 a3675 a510 a288 a800 a62 b
RO5300 a317 a2625 a638 a263 a625 a140 b
Tap6400 a220 a2850 a688 a263 a600 a793 a
Variety<0.0001<0.0001NS<0.00010.0172<0.00010.0004
Treatment0.00580.0001<0.00010.004NSNS<0.0001
Variety × TreatmentNS0.0152NSNSNSNS0.0005
z Sap samples from frozen leaf tissue were analyzed for NO3, K+, Ca2+, and Na+ using the LAQUA Twin meters and for P, Mg2+, and SO42− using the HI 83200 Multiparameter Photometer. y Means followed with different lowercase letters for each variety are significantly different among treatments by Tukey’s honest significant difference (HSD) multiple comparison at p < 0.05. NS, no significance.
Table 5. Leaf mineral contents of two vegetable species (leaf lettuce, Lactuca sativa ‘Tropicana’ and three types of pac choi, Brassica rapa var. chinensis ‘Tokyo Bekana’, ‘Mei Qing Choi’, and ‘Rosie’) grown in a nutrient film technique (NFT) system with start nutrient solutions (CNS17) prepared with reverse osmosis water (RO2), tap water (Tap2), or tap water plus NaCl (Tap2 + NaCl) (Expt. 2).
VarietyTreatmentMineral Nutrition (mg per g Dry Tissue) z
Na+ClPK+Ca2+Mg2+SO42−
Leaf lettuce ‘Tropicana’RO21.8 b y9.2 b11.0 a92.1 a14.7 a6.0 a3.2 a
Tap211.5 a27.8 a11.5 a120.4 a13.0 a4.8 a3.2 a
Tap2 + NaCl16.0 a-11.2 a70.6 a13.4 a4.3 a4.9 a
Pac Choi ‘Mei Qing Choi’RO21.2 b1.6 b8.3 a118.9 a40.9 a5.5 a12.6 a
Tap214.3 a11.5 a8.4 a109.2 a37.3 a4.7 a12.0 a
Tap2 + NaCl17.3 a15.1 a7.5 a113.0 a31.9 a3.9 a15.2 a
Pac Choi ‘Rosie’RO21.5 b1.2 b7.0 a90.2 a41.3 a6.5 a7.6 a
Tap215.0 a12.9 a6.4 a70.6a38.6 a5.6 a8.0 a
Tap2 + NaCl19.0 a16.4 a7.5 a72.7 a32.7 a4.6 a9.2 a
Pac Choi ‘Tokyo Bekana’RO21.6 c1.4 b8.3 a72.1 a49.4 a6.2 a7.0 a
Tap212.0 b9.1 a7.7 a65.3 a49.2 a5.8 a7.6 a
Tap2 + NaCl20.2 a13.0 a8.1 a84.9 a40.1 b4.5 b7.9 a
VarietyNSNS<0.00010.0011<0.0001NS<0.0001
Treatment<0.0001<0.0001NSNS0.00560.00070.0005
Variety × TreatmentNS0.0182NSNSNSNSNS
z Chloride (Cl) in extracted samples was determined by M926 Chloride Analyzer, whereas Na+, P, K+, Ca2+, Mg2+, and SO42− in digested samples were analyzed by inductively coupled plasma-optical emission spectrometry. y Means followed with different lowercase letters for each variety are significantly different among treatments by Tukey’s honest significant difference (HSD) multiple comparison at p < 0.05. NS, no significance.

