Article

Continuous Cropping Chinese Chive Alters Rhizosphere Metabolites and Microbial Communities

1
School of Enology and Horticulture, Ningxia University, Yinchuan 750021, China
2
School of Civil and Hydraulic Engineering, Ningxia University, Yinchuan 750021, China
3
Engineering Research Center of Water-Efficient Utilization in Modern Agriculture for Arid Regions, Ministry of Education, Yinchuan 750021, China
4
Jiangsu Academy of Agricultural Sciences, Nanjing 210000, China
5
Ningxia Jufengyuan Fruit and Vegetable Production and Marketing Cooperative, Guyuan 750202, China
6
Nongruixing Fruit and Vegetable Planting Professional Cooperative, Haojiaqiao Town, Yinchuan 751400, China
*
Author to whom correspondence should be addressed.
Horticulturae 2026, 12(9), 1070; https://doi.org/10.3390/horticulturae12091070
Submission received: 20 July 2026 / Revised: 16 August 2026 / Accepted: 25 August 2026 / Published: 27 August 2026
(This article belongs to the Section Vegetable Production Systems)

Abstract

Continuous cropping obstacles severely constrain Chinese chive (Allium tuberosum) production, yet the integrated mechanisms involving soil properties, microbial communities, and rhizosphere metabolites remain unclear. We hypothesized that long-term monoculture induces soil degradation and shifts rhizosphere microbiomes via accumulated putative allelochemicals, with a critical tipping point. Rhizosphere soils from 1-to-5-year continuous cropping fields were analyzed using high-throughput sequencing, non-targeted metabolomics, and physicochemical assays. Results showed significant salinization and nutrient depletion after three years, along with a slight decrease in soil pH. Enzyme activities (sucrase, urease, alkaline phosphatase, and catalase) first rose then fell. Bacterial richness declined sharply after four years, with beneficial genera (such as Devosia) decreasing and pathogenic genera (such as Thelonectria) enriched. Metabolomics identified 1175 metabolites, primarily enriched in linoleic acid and α-linolenic acid pathways. Oxidized fatty acids accumulated significantly and correlated positively with pathogen abundance and negatively with beneficial bacteria. We conclude that continuous chive cropping exceeding three years is associated with soil degradation via putative allelochemical accumulation and pathogen enrichment. We recommend crop rotation after three years, offering a theoretical basis for sustainable chive production.

1. Introduction

Chinese chive (Allium tuberosum Rottler ex Spreng.) is native to China and is widely cultivated globally due to its unique flavor and ease of growth [1,2]. Haojiaqiao Town in Lingwu City, Ningxia, serves as the largest production base for greenhouse Chinese chives in Western China. As of September 2024, the cultivation area has reached over 16,000 mu (approximately 1067 hectares), with an output value of 160 million RMB. However, highly intensive and long-term monoculture has led to a series of continuous cropping obstacles, including soil degradation, severe soil-borne diseases, and declining yields, severely hampering the future growth and sustainable production of Chinese chive.
Continuous cropping obstacles are defined as the progressive degradation of crop growth, productivity, and quality, which typically occurs when the same crop (or family) is repeatedly cultivated on identical land for extended periods, and is frequently associated with aggravated pathogen and pest pressure [3,4]. These obstacles result from the complex interactions among soil, plants, microbes, and the surrounding environment, with changes in rhizosphere microbial communities and rhizosphere metabolites being closely linked to this process [5,6]. Soil microorganisms regulate plant–soil interactions and participate in nutrient transformation and cycling, serving as key factors in maintaining soil ecosystem health [7]. Long-term monoculture disrupts the diversity and structural balance of soil microbial communities, thereby compromising soil health and crop growth. Studies on the continuous cropping of tobacco [8], melon [9], and soybean [10] have demonstrated that this practice reduces rhizosphere microbial diversity, increasing harmful pathogens while decreasing beneficial microbes. Previous analyses of Chinese chive cultivation found that continuous cropping increases Fusarium and reduces Pseudomonas [11]. Beyond direct microbial alterations, continuous cropping obstacles are closely associated with rhizosphere metabolites, which serve as energy sources for microbes and signaling molecules for selective recruitment or exclusion of specific taxa [12,13,14,15]. Depending on their chemical composition, rhizosphere metabolites can exert positive or negative effects on plant health. For instance, hesperetin in potato rhizosphere metabolites can recruit beneficial microbes to alleviate cropping obstacles [16], whereas saponins from Panax notoginseng promote pathogen proliferation [17]. More directly, accumulation of autotoxic rhizosphere metabolites is considered a critical chemical factor in continuous cropping obstacles. Phenolic acids and other autotoxins accumulate in sugar beet [18], green pepper [19], and alfalfa [20] and have been identified as key drivers of cropping obstacles in these crops.
Regarding the continuous cultivation of Chinese chive, existing studies have shown that the highest concentration of autotoxic substances is found in the roots and that continuous cropping reduces rhizosphere microbial diversity [11]. However, the specific chemical identity of these rhizosphere metabolites and their accumulation characteristics over time remain unclear. Furthermore, how soil microbial community shifts correlate with the buildup of Chinese chive rhizosphere metabolites remains largely unexplored.
In view of this, this study focused on the rhizosphere soil of greenhouse-grown Chinese chives in Ningxia across different cropping durations (1–5 years). We hypothesized that (1) prolonged continuous cropping progressively alters soil physicochemical properties and enzyme activities; (2) these changes drive a directional succession of rhizosphere microbial communities, depleting beneficial taxa while enriching pathogens; (3) accumulated rhizosphere metabolites may serve as key chemical drivers linking soil degradation to microbial shift, with a critical tipping point occurring around year 3–4. To test these hypotheses, we integrated high-throughput sequencing with non-targeted metabolomics to (1) characterize temporal variations in soil properties, enzyme activities, and rhizosphere metabolite composition across 1–5 years of continuous cropping; (2) profile changes in rhizosphere microbial community structure and diversity; (3) examine associations between key accumulated allelochemicals and microbial taxa to infer potential chemical drivers of community succession.

2. Materials and Methods

2.1. Experimental Site and Soil Sampling

The experimental site was located in Shangtan Village, Haojiaqiao Town, Lingwu City, Ningxia (37°94′ N, 106°35′ E). This region is characterized by a typical temperate continental climate, with an average annual precipitation of approximately 192 mm and a mean annual temperature of 8.8 °C. The predominant soil type is sandy soil. The experiment was conducted in protected cultivation plots (solar greenhouses) of Chinese chive with uniform soil type, consistent field management, and standardized fertilization practices. The five cropping duration treatments (CC1–CC5) represent five independent greenhouses. The following continuous cropping durations were compared: 1 year (CC1, control), 2 years (CC2), 3 years (CC3), 4 years (CC4), 5 years (CC5), with three plots per treatment serving as three replicates. For each cropping duration, the three replicate plots were established in three independent greenhouses rather than within a single field. Each plot measured approximately 70 m × 9.5 m (665 m2), and the three greenhouses for each duration were located at least 200 m apart.
In mid-June 2025, when the Chinese chives had reached 30 days of growth, entire plants were carefully uprooted from each plot, and rhizosphere soil was collected as described below. Sampling was performed according to the five-point S-shaped scheme. All soil samples were collected at a single time point. As Chinese chive is a perennial vegetable that is harvested multiple times per year, the results presented in this study represent a single phenological snapshot. Bulk soil (non-rhizosphere soil) was obtained by gently shaking the root system to remove large soil aggregates, while the soil tightly adhering to the root surface was collected as rhizosphere soil using a sterile brush. Samples from the same plot were thoroughly mixed. Bulk soil samples were transported to the laboratory under refrigeration, air-dried in a shaded area, and cleared of plant debris, stones, and other impurities. Each sample, weighing approximately 1 kg, was subjected to quartering, grinding, and 2 mm sieving. The resulting material served for the measurement of soil physicochemical properties and enzyme activities. Rhizosphere soil was immediately passed through a 2 mm sieve after removing stones and root fragments, then aliquoted into sterile centrifuge tubes and stored at −80 °C for the analysis of soil microorganisms and rhizosphere metabolites. The Chinese chive cultivar used was ‘Fumanduo 005’, developed by the Pingdingshan Institute of Horticultural Science, Henan Province. The annual fertilizer application rates were N 525 kg·hm−2, P 314 kg·hm−2, and K 336 kg·hm−2 (equivalent to P2O5 720 kg·hm−2 and K2O 405 kg·hm−2, respectively).

2.2. Soil Physicochemical Properties

Soil pH and electrical conductivity (EC) were measured using a PHS-3E pH meter (Leici Scientific Instruments, Shanghai, China) and a DDS-307A conductivity meter (Leici Scientific Instruments, Shanghai, China), respectively. Soil organic matter (SOM) was determined using the potassium dichromate-sulfuric acid external heating oxidation method. Total nitrogen (TN) was measured by the Kjeldahl method, and total phosphorus (TP) was determined via sulfuric acid-perchloric acid digestion. Alkaline nitrogen (AN) was assessed using the alkali-diffusion method. Available phosphorus (AP) was determined through sodium bicarbonate extraction followed by molybdenum-antimony colorimetry, and available potassium (AK) was measured using the ammonium acetate extraction-flame photometry method.

2.3. Soil Enzyme Activities

Soil urease activity was determined using the indophenol blue colorimetry method. Alkaline phosphatase activity was measured by the p-nitrophenyl phosphate method. Soil sucrase activity was analyzed via the 3,5-dinitrosalicylic acid colorimetric method, and catalase activity was determined using the potassium permanganate titration method.

2.4. Microbial Community Analysis by High-Throughput Sequencing

Genomic DNA was isolated from the rhizosphere soil of Chinese chive using the E.Z.N.A.® Soil DNA Kit (Omega Bio-tek, Norcross, GA, USA) according to the manufacturer’s recommendations. The purity and concentration of the obtained DNA were evaluated by 1.0% agarose gel electrophoresis and a NanoDrop 2000 spectrophotometer (Thermo Fisher Scientific, Waltham, MA, USA), and the DNA samples were stored at −80 °C until use. For bacterial community analysis, the V3–V4 hypervariable region of the 16S rRNA gene was amplified by PCR with the barcoded primer pair 338F (5′-ACTCCTACGGGAGGCAGCAG-3′) and 806R (5′-GGACTACHVGGGTWTCTAAT-3′), using the extracted DNA as the template. Likewise, the fungal internal transcribed spacer 1 (ITS1) region was amplified with the primers ITS1F (5′-CTTGGTCATTTAGAGGAAGTAA-3′) and ITS2 (5′-GCTGCGTTCTTCATCGATGC-3′). The PCR mixture, with a total volume of 20 μL, contained 4 μL of 5 × Fast Pfu buffer, 2 μL of dNTPs (2.5 mM each), 0.8 μL of each primer at 5 μM, 0.4 μL of Fast Pfu polymerase, 10 ng of template DNA, and ddH2O to bring the final volume. The thermal profile for amplification consisted of an initial denaturation at 95 °C for 3 min; followed by 27 cycles of denaturation at 95 °C for 30 s, annealing at 55 °C for 30 s, and extension at 72 °C for 45 s; with a final extension at 72 °C for 10 min and subsequent holding at 4 °C. We recovered the PCR amplicons from a 2% agarose gel, purified them using the PCR Clean-Up Kit (YuHua, Shanghai, China) as per the manufacturer’s instructions, and measured their concentrations with a Qubit 4.0 fluorometer (Thermo Fisher Scientific, Waltham, MA, USA).
After purification, the amplicons were combined at equal molar ratios and then subjected to paired-end sequencing on an Illumina NextSeq 2000 instrument (Illumina, San Diego, CA, USA). All procedures were performed according to the standard operating protocols provided by Majorbio Bio-Pharm Technology Co., Ltd. (Shanghai, China). The raw sequencing data were deposited into the NCBI Sequence Read Archive (SRA) database under the accession number SRP700138.

2.5. Non-Targeted Metabolomic Analysis

Untargeted metabolomics of rhizosphere metabolites was performed using a liquid chromatography-tandem mass spectrometry (LC-MS/MS) platform at Majorbio Bio-Pharm Technology Co., Ltd. (Shanghai, China). Briefly, 100 mg of solid sample was placed into a 2 mL centrifuge tube containing a grinding bead (6 mm diameter). Metabolite extraction was conducted using 800 μL of an extraction solution (methanol:water = 4:1, v/v) supplemented with internal standards (e.g., 0.02 mg/mL L-2-chlorophenylalanine). The samples were processed using a frozen tissue grinder (Wonbio-96c; Shanghai Wanbo Biotechnology Co., Ltd., Shanghai, China) at 50 Hz and −10 °C for 6 min, followed by low-temperature ultrasonic extraction at 40 kHz and 5 °C for 30 min. After incubation at −20 °C for 30 min, the mixtures were centrifuged at 13,000× g and 4 °C for 15 min. The resulting supernatant was transferred to an injection vial for LC-MS/MS analysis. To condition the system and monitor analytical performance, we prepared a QC pool by mixing equal volumes from each sample. This pooled sample was subjected to the same preparation and analytical workflow as the test samples. Throughout the run, QC samples were injected periodically (every 5–15 samples) to serve as representatives of the entire dataset, allowing continuous assessment of system stability and measurement reproducibility. Chromatographic separation was carried out on a Thermo UHPLC-Q Exactive system (Thermo Fisher Scientific, Waltham, MA, USA) fitted with an ACQUITY BEH C18 column (100 mm × 2.1 mm i.d., 1.7 μm; Waters, Milford, MA, USA). The mobile phases consisted of two components: solvent A (0.1% formic acid in water:acetonitrile at 2:98, v/v) and solvent B (0.1% formic acid in acetonitrile). The flow rate was maintained at 0.40 mL/min, the column temperature was set to 40 °C, and the injection volume was 5 μL. The mass spectrometer was equipped with an electrospray ionization (ESI) source operated in both positive and negative ion modes. The mass spectrometer was operated with the following optimal settings: source temperature, 400 °C; sheath gas flow rate, 40 arb (arbitrary units); auxiliary gas flow rate, 10 arb; and ion-spray voltage floating (ISVF), −2800 V in negative mode and 3500 V in positive mode. For MS/MS analysis, the normalized collision energy was programmed across a ramp of 20–40–60 V. Data were acquired in Data Dependent Acquisition (DDA) mode, with the mass range set from 70 to 1050 m/z.
All metabolites were putatively annotated at MSI Level 2 based on accurate mass and MS/MS spectral matching against the HMDB and KEGG databases; none were confirmed against authentic standards or absolutely quantified.

2.6. Data Processing and Statistical Analysis

Bioinformatic analysis of the soil microbiota was performed using the Majorbio Cloud platform (https://cloud.majorbio.com, accessed on 24 August 2026). Based on amplicon sequence variant (ASV) data, alpha diversity indices—including observed ASVs, the Chao1 richness estimator, the Shannon index, and Good coverage—were calculated using Mothur v1.30.1. Beta diversity was evaluated by principal coordinate analysis (PCoA) based on Bray–Curtis dissimilarity, which was implemented with the Vegan v2.5-3 package. Venn diagrams were constructed in R (version 3.3.1) to visualize shared and unique ASVs across different groups. Taxonomic summaries were generated using QIIME (version 2024), and the 10 most abundant phyla and genera were retained for subsequent analysis. Stacked bar plots representing the relative abundance of microbial communities were generated in R (version 3.3.1) to illustrate taxonomic composition across samples. To detect taxa that exhibited significant differences among multiple groups, we applied one-way analysis of variance (ANOVA) alongside the Kruskal–Wallis rank-sum tes. Co-occurrence networks between microorganisms and metabolites were constructed based on Spearman rank correlation coefficients (|r| > 0.6, p < 0.05 for bacteria; |r| > 0.4, p < 0.05 for fungi) using the scipy.stats module in Python (version 2.7.10) and visualized in Gephi (version 0.10.1).
We used the R package “ropls” (version 1.6.2) to perform principal component analysis (PCA) and orthogonal partial least squares discriminant analysis (OPLS-DA). Differential metabolites were identified based on variable importance in projection (VIP) >1.0 and p < 0.05, with false discovery rate (FDR) correction (Benjamini–Hochberg method) applied, and q < 0.05 as the final criterion for significance. These features were then mapped to biochemical pathways via the Kyoto Encyclopedia of Genes and Genomes (KEGG) database (http://www.genome.jp/kegg/, accessed on 24 August 2026). To detect treatment-related pathways with biological relevance, we carried out enrichment analysis using the scipy.stats module of Python (https://docs.scipy.org/doc/scipy/, accessed on 24 August 2026). The expression patterns of differential metabolites were further assessed by hierarchical clustering based on Euclidean distance, and the results were displayed as a heatmap. All data were organized in Microsoft Excel 2010, and statistical analyses were performed using SPSS version 20.0. For multiple comparisons, significant differences were determined using Duncan’s multiple range test, and the significance threshold was set at p < 0.05.

2.7. Use of AI-Assisted Technology

We confirm that no generative AI was used to generate scientific data, research concepts, or original conclusions in this work. However, after the initial complete draft was written by the human authors, we used DeepSeek solely for language polishing and grammatical refinement to improve readability. Specifically, the original draft, all figures, tables, data analysis, and logical framework were entirely produced by the authors. AI was only applied to adjust sentence structures and correct English expressions during the final revision stage. All AI-suggested changes were manually reviewed and verified by the authors to ensure accuracy and consistency. The authors assume full and final responsibility for all content presented in this manuscript.

3. Results

3.1. Soil Physicochemical Properties

As shown in Table 1, soil pH and the contents of soil organic matter (SOM), and AN decreased progressively from CC1 to CC5 as the continuous cropping duration increased. The soil pH, SOM, and AN levels in CC4 and CC5 were significantly lower than those in CC1. Compared with CC1, the soil pH in CC4 decreased by 0.11 units, while SOM and AN contents dropped by 17.93% and 44.67%, respectively. In CC5, the soil pH decreased by 0.15 units, with SOM and AN contents declining by 46.59% and 75.39%, respectively. Conversely, soil electrical conductivity (EC) increased progressively with cropping duration, reaching a maximum of 174.16 μs·cm−1 in CC5, which was significantly higher than that in CC1. The soil AP content decreased from CC1 to CC2, then increased to a peak of 35.14 mg·kg−1 at CC4. Soil AK content increased from CC1 to CC3, then decreased thereafter; specifically, the AK contents in CC2 and CC3 were significantly higher than those in CC1 by 59.40% and 70.98%, respectively.

3.2. Soil Enzyme Activities

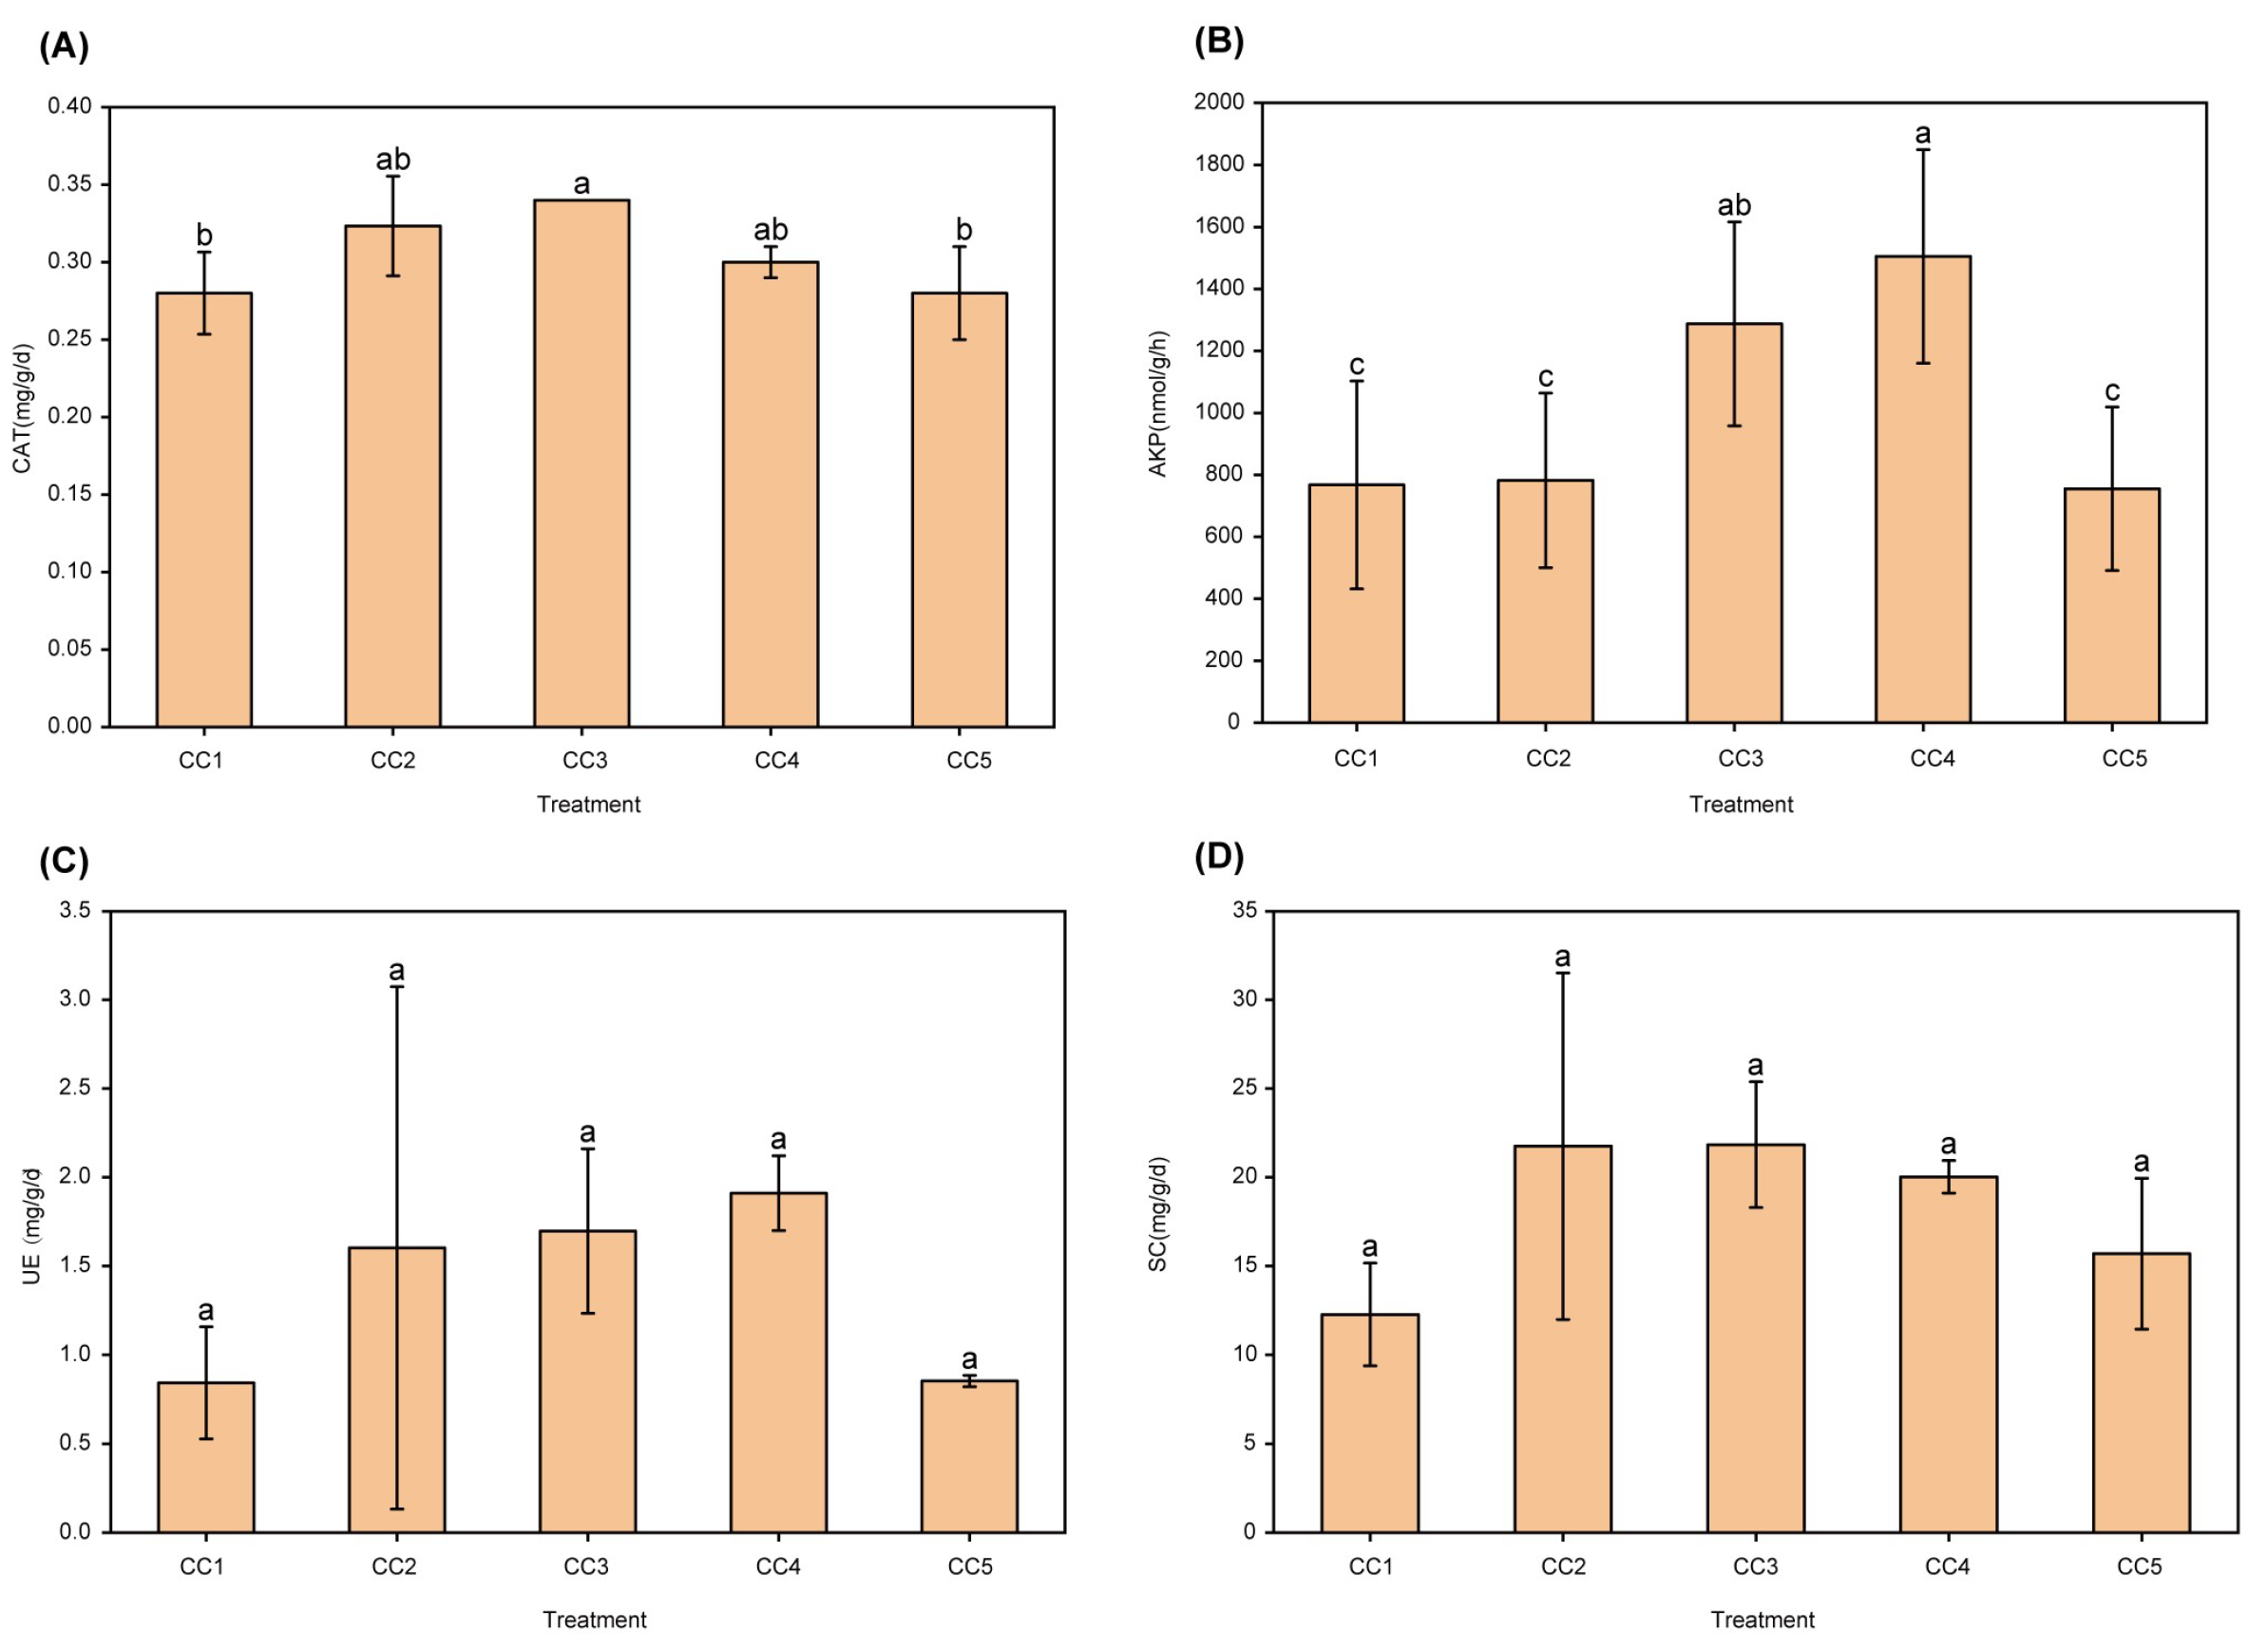
With the prolongation of continuous cropping, the activities of soil urease, sucrase, catalase, and alkaline phosphatase exhibited a distinct peak at different cropping durations before declining (Figure 1). Specifically, soil sucrase activity showed its highest numeric value in CC2 (a 70.39% increase over CC1), though the difference was not significant across treatment. Urease activity also peaked numerically in CC4 (a 56.02% increase over CC1), but this difference was not statistically significant. Compared with CC1, soil catalase activity was significantly higher by 17.65% in CC3, and alkaline phosphatase activity was significantly higher by 49% in CC4. By CC5, the activities of all four enzymes had returned to levels comparable to CC1.

3.3. Soil Microbial Communities

3.3.1. Soil Microbial Diversity

The alpha diversity of soil microbial communities under different continuous cropping years was evaluated using Sobs, ACE, Chao1, Shannon, and Simpson indices (Table 2). The Good’s coverage for both bacteria and fungi in all samples exceeded 99%, indicating that the sequencing depth was sufficient to reflect the actual composition of the microbial communities in the samples. For the bacterial community, the Sobs, ACE, Chao1, and Shannon indices showed a declining trend from CC1 to CC4 as the continuous cropping duration extended. Compared with CC1, the Sobs, ACE, and Chao1 indices of the bacterial community in the CC4 treatment group significantly decreased by 15.15%, 15.23%, and 15.32%. However, no significant differences were observed in the Shannon or Simpson indices among bacterial treatments. Regarding the fungal community, the richness indices (Sobs, ACE, and Chao1) followed a distribution pattern of CC3 > CC5 > CC1 > CC4 > CC2. Specifically, these indices in the CC4 treatment group were lower than those in the peak CC3 group by 24.72%, 24.73%, and 24.80%, respectively. No significant differences were observed in the Shannon and Simpson indices of fungi among the different treatments.
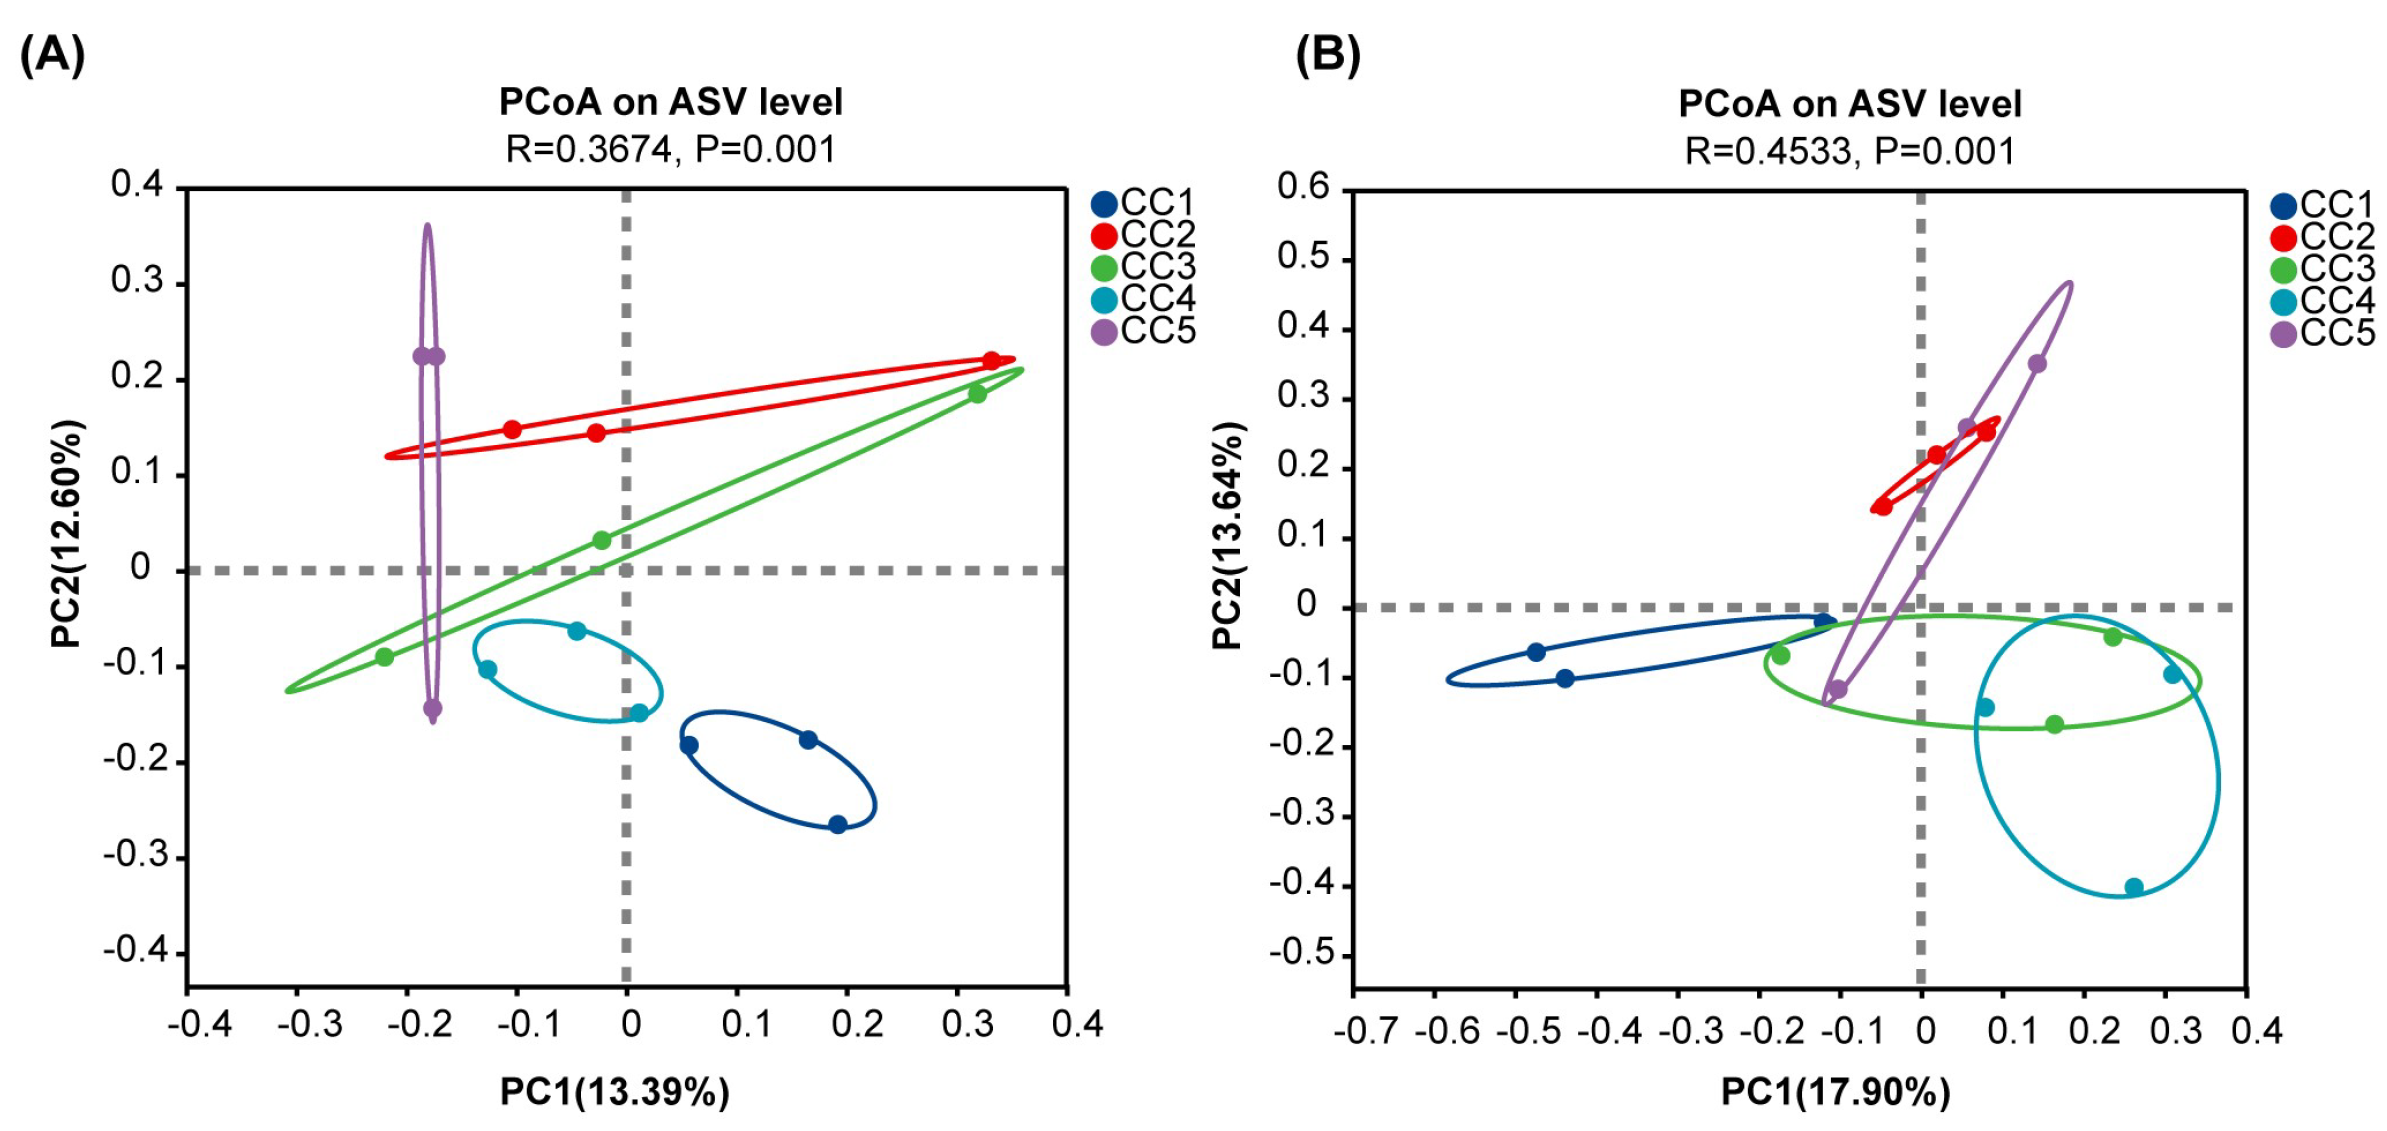
PCoA based on Bray–Curtis distance revealed a separation in the structure of bacterial and fungal communities across different continuous cropping years (Figure 2A,B). For the bacterial community, the PC1 and PC2 axes explained 13.39% and 12.60% of the total variation, respectively. The ANOSIM test confirmed that the bacterial community structure differed among the different year groups (R = 0.36741, p = 0.001). A similar trend was observed in the PCoA of the fungal community, where the explained variances for the PC1 and PC2 axes were 17.90% and 13.64%, respectively; ANOSIM results also indicated highly significant differences among the groups (R = 0.4533, p = 0.001).

3.3.2. Soil Microbial Composition and Structure

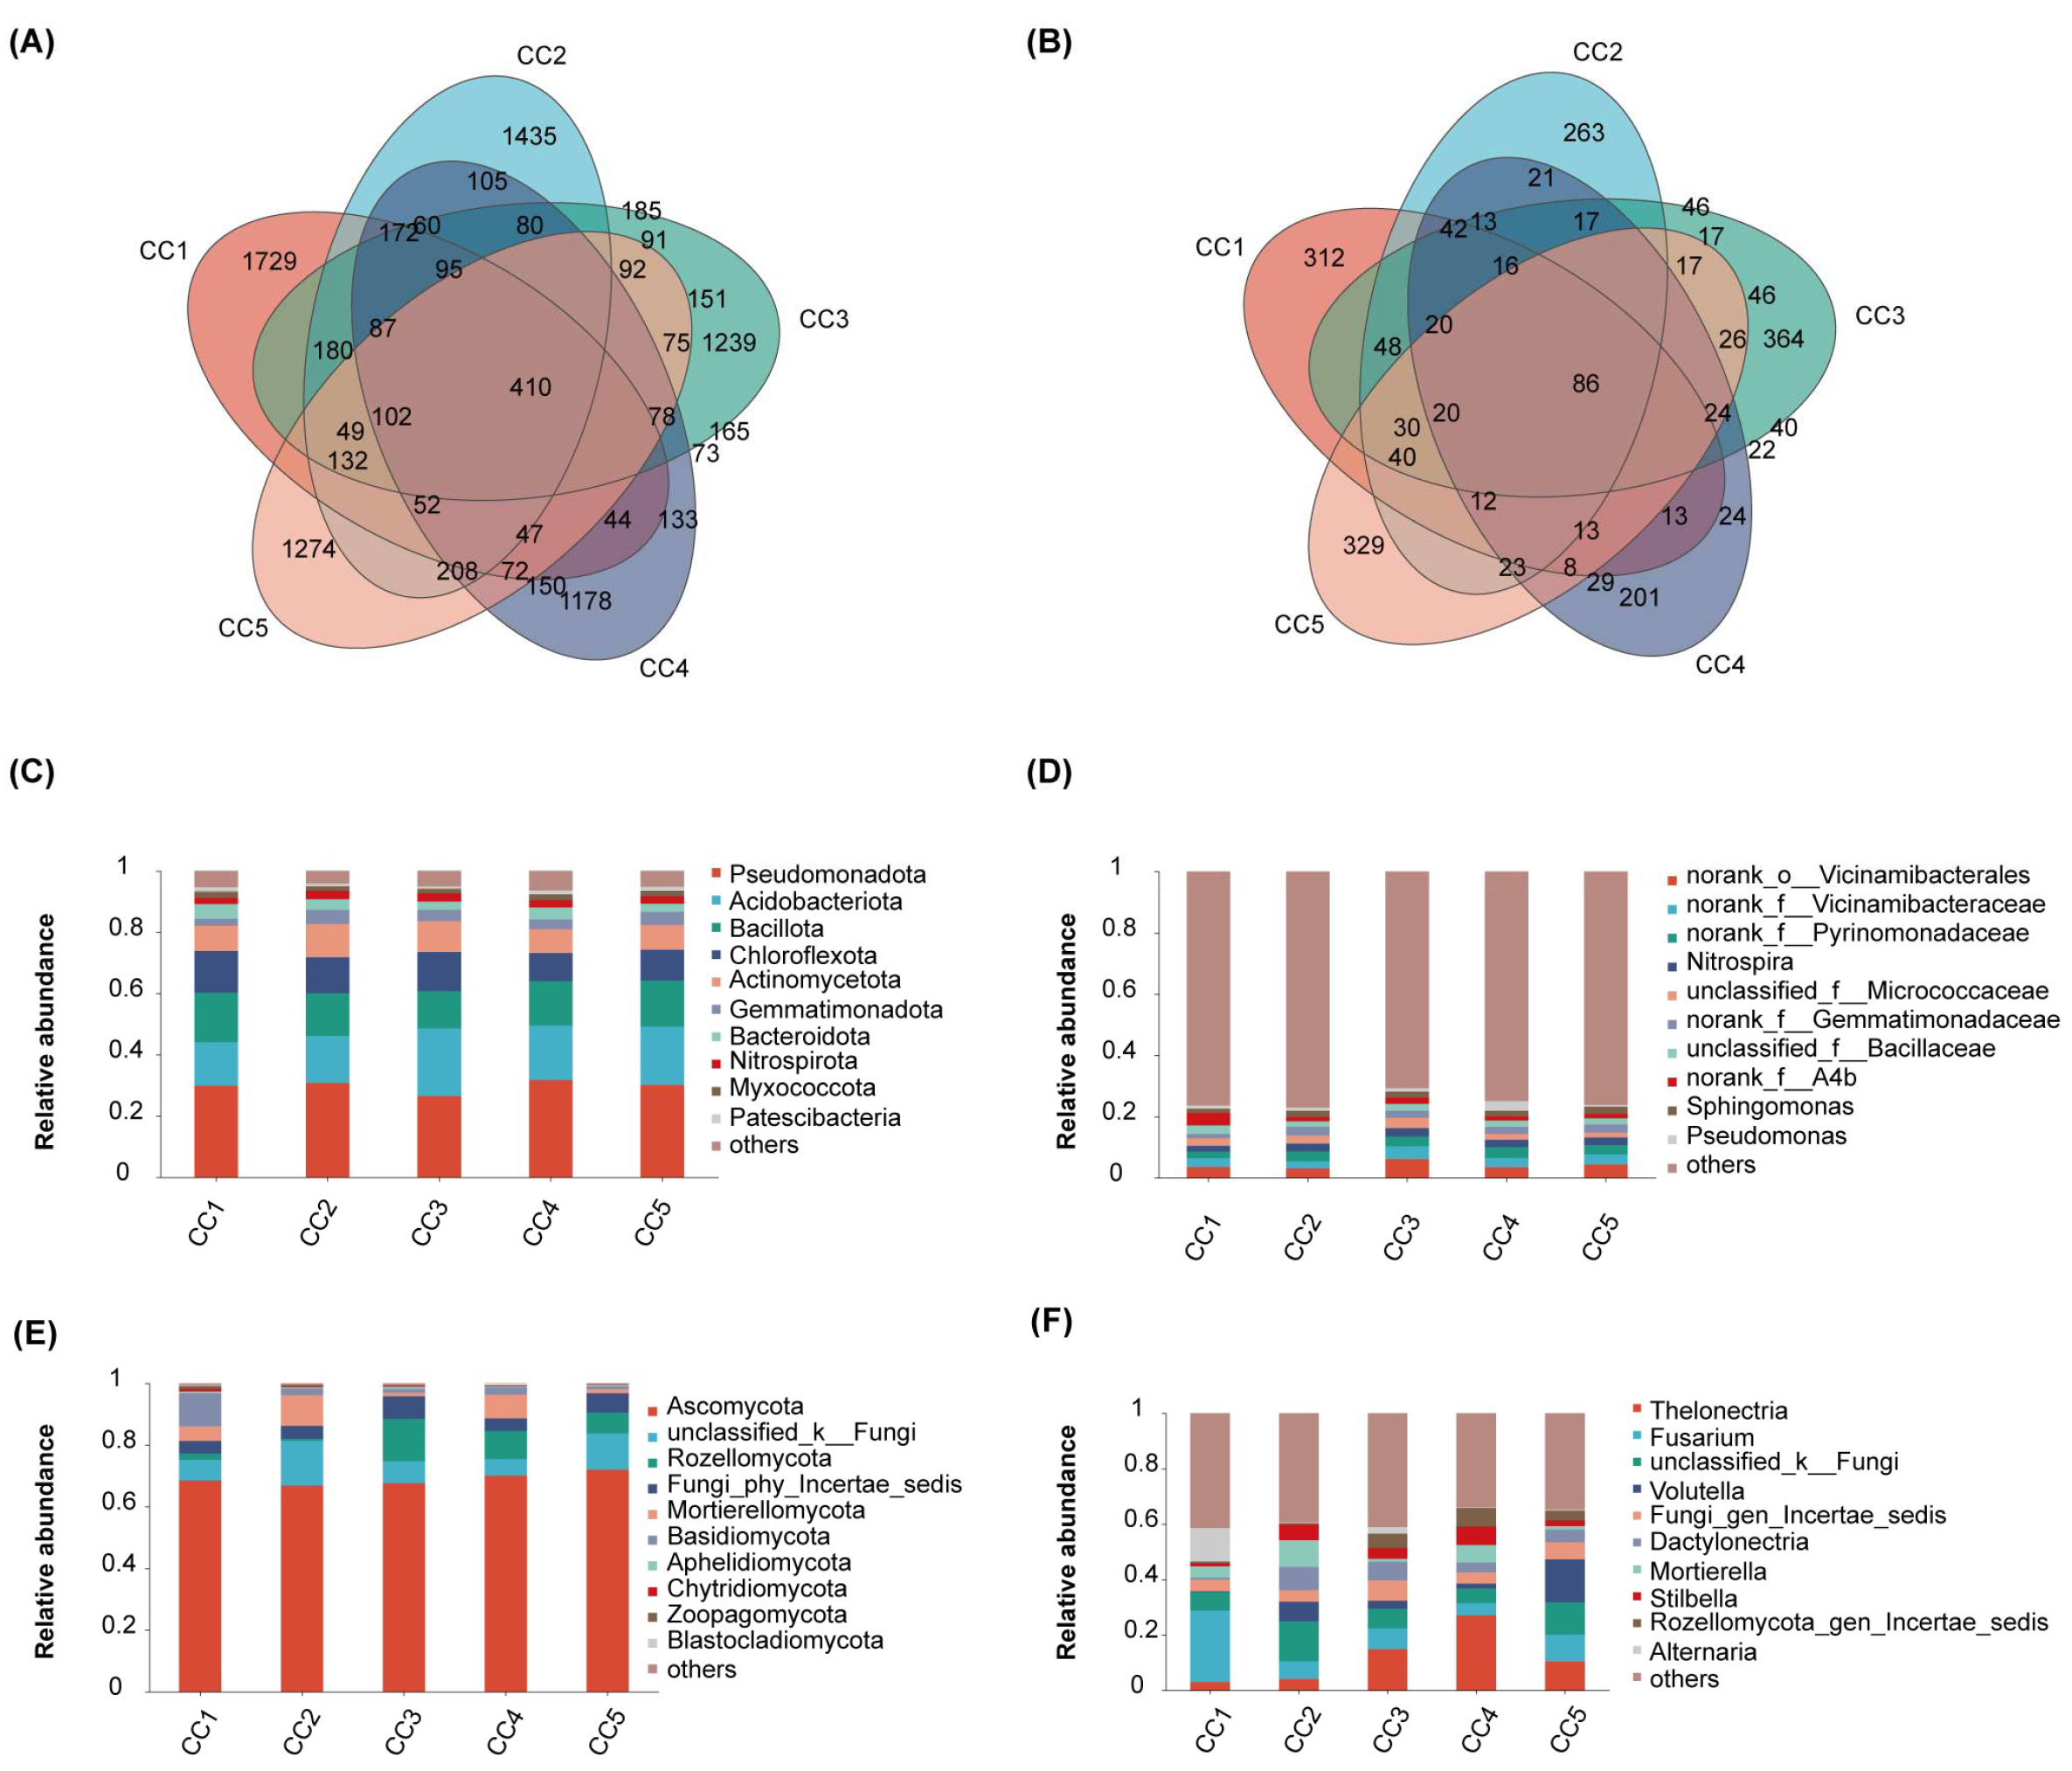
Venn diagram analysis at the ASV level (Figure 3A) revealed a total of 9932 bacterial ASVs across the five groups of soil samples. Among these, 410 ASVs (representing 4.12% of the total) were shared by all treatment groups. The number of unique bacterial ASVs followed the order CC1 (1729) > CC2 (1435) > CC5 (1274) > CC3 (1239) > CC4 (1178), accounting for 17.39%, 14.43%, 12.81%, 12.46%, and 11.85% of the total, respectively. For the fungal community (Figure 3B), a total of 2182 ASVs were identified, with 86 ASVs (3.94% of the total) shared across all groups. The unique fungal ASVs followed the sequence CC3 (364) > CC5 (329) > CC1 (312) > CC2 (263) > CC4 (201), representing 16.68%, 15.08%, 14.30%, 12.05%, and 9.21% of the total, respectively.
Following data normalization, the composition of the dominant bacterial and fungal communities was analyzed. As shown in Figure 3C, the dominant bacterial phyla primarily consisted of Pseudomonadota (26.51–31.81%), Acidobacteriota (14.25–22.09%), Bacillota (12.11–16.16%), and Chloroflexota (9.13–13.56%). With the extension of continuous cropping, the relative abundances of Pseudomonadota and Acidobacteriota showed an increasing trend in CC4 and CC5, while the abundances of Bacillota and Chloroflexota reached their lowest levels in CC4. As illustrated in Figure 3E, the fungal community was characterized by the absolute dominance of Ascomycota, with a relative abundance ranging from 66.88% to 72.05% and peaking in CC5. At the genus level, Nitrospira, Sphingomonas, and Pseudomonas were the dominant bacterial taxa, with varying relative abundances across different years (Figure 3D). In the fungal community (Figure 3F), Thelonectria (2.91–27.01%) and Fusarium (4.36–25.83%) were the most prevalent genera, followed by Volutella and Mortierella.
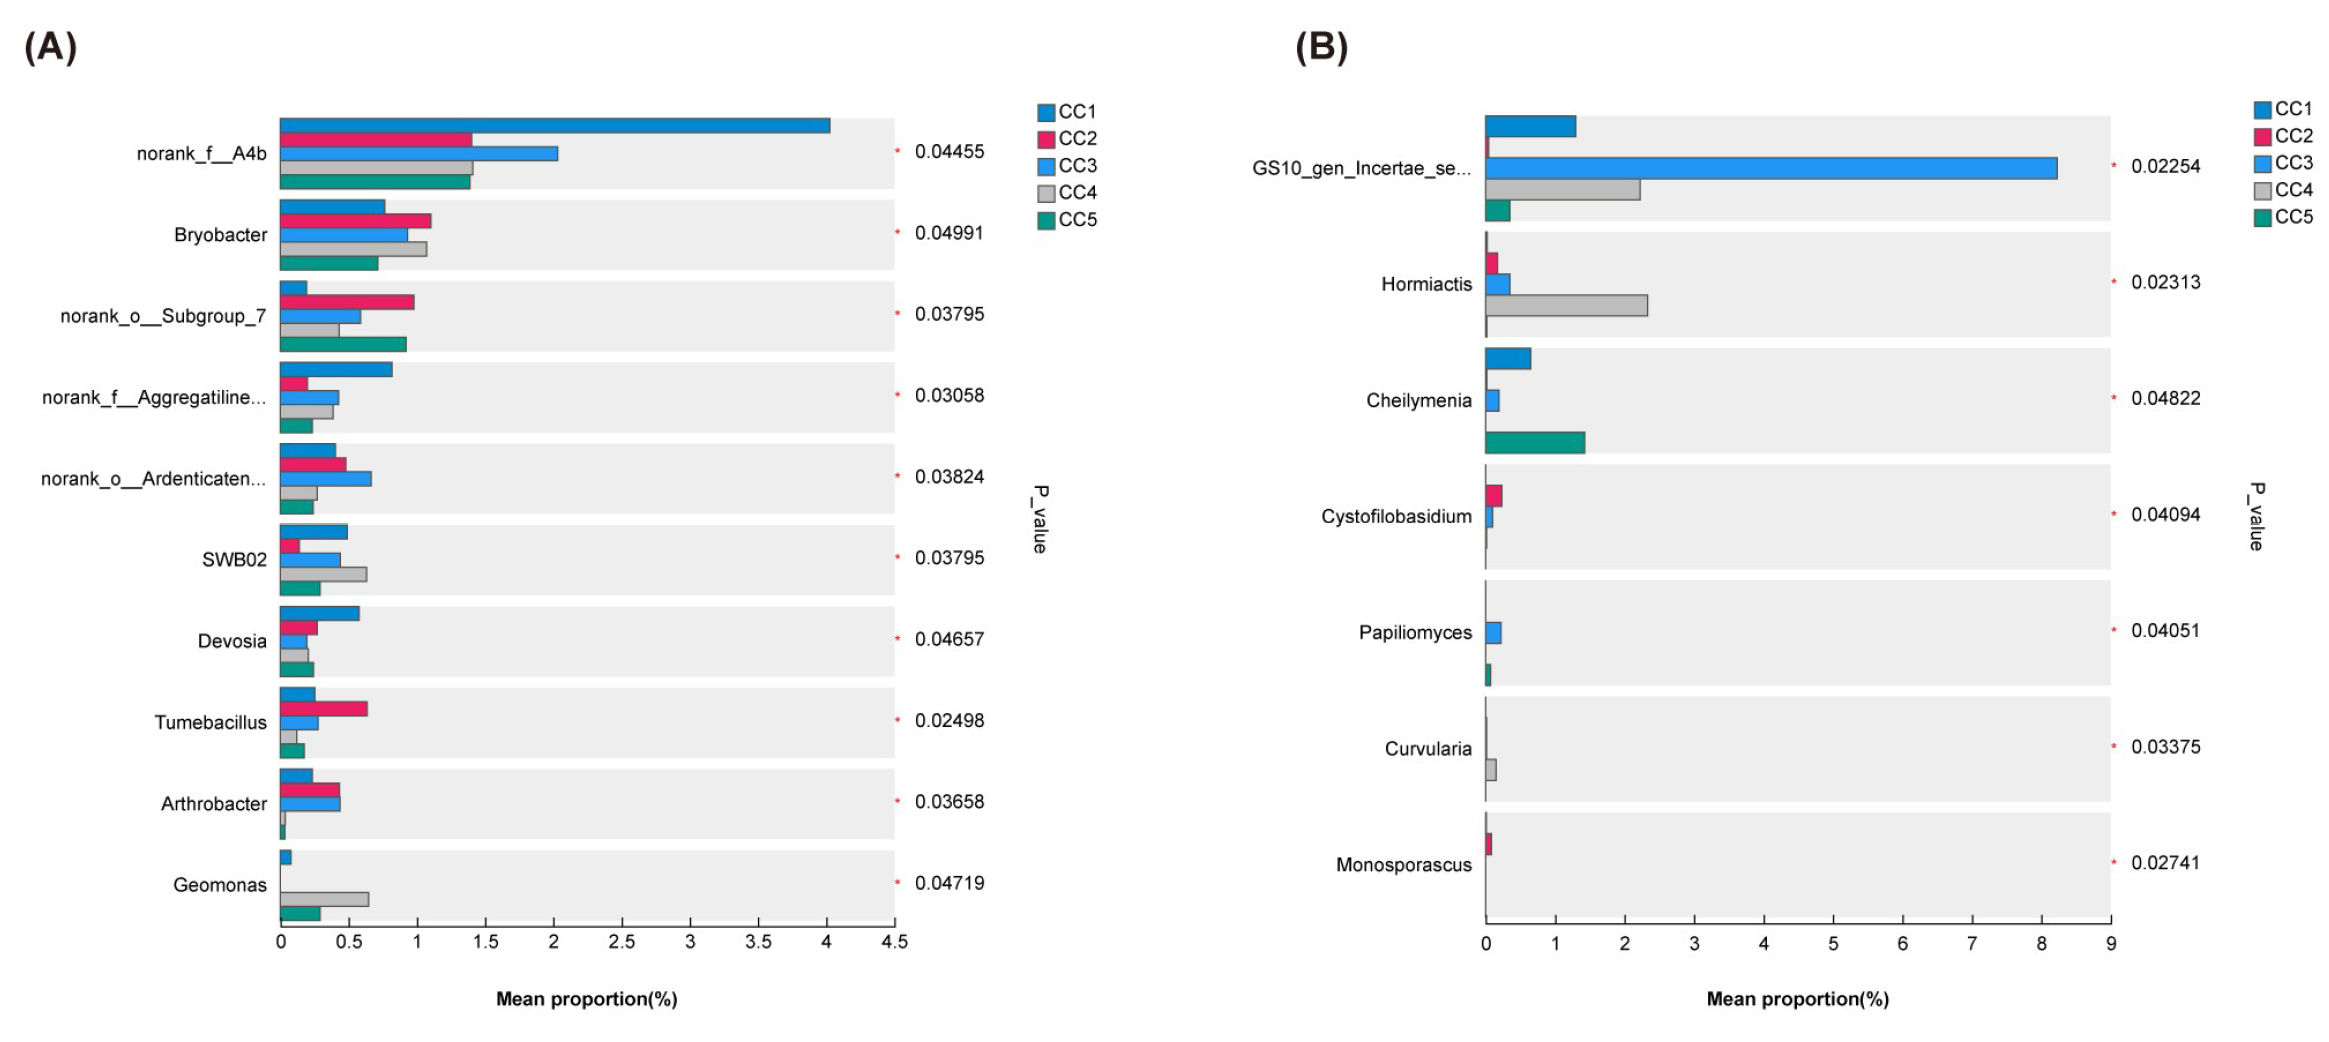
A multi-group comparison was conducted to pinpoint bacterial and fungal taxa that exhibited significant differences in relative abundance across the various cropping duration groups (Figure 4). Among the top 10 most abundant bacterial genera, Bryobacter was significantly enriched, whereas the abundance of the putatively beneficial genus Devosia significantly decreased. The abundances of Tumebacillus and Arthrobacter displayed a trend of an initial increase followed by a decrease. Within the fungal community, the genera Hormiactis and Curvularia exhibited significant and continuous accumulation, whereas the abundance of Cheilymenia decreased initially and then increased, while Cystofilobasidium displayed an upward trend at first, which was later reversed into a decline.

3.4. Metabolomic Analysis of Rhizosphere Metabolites

3.4.1. Effects of Continuous Cropping on the Rhizosphere Metabolites Composition

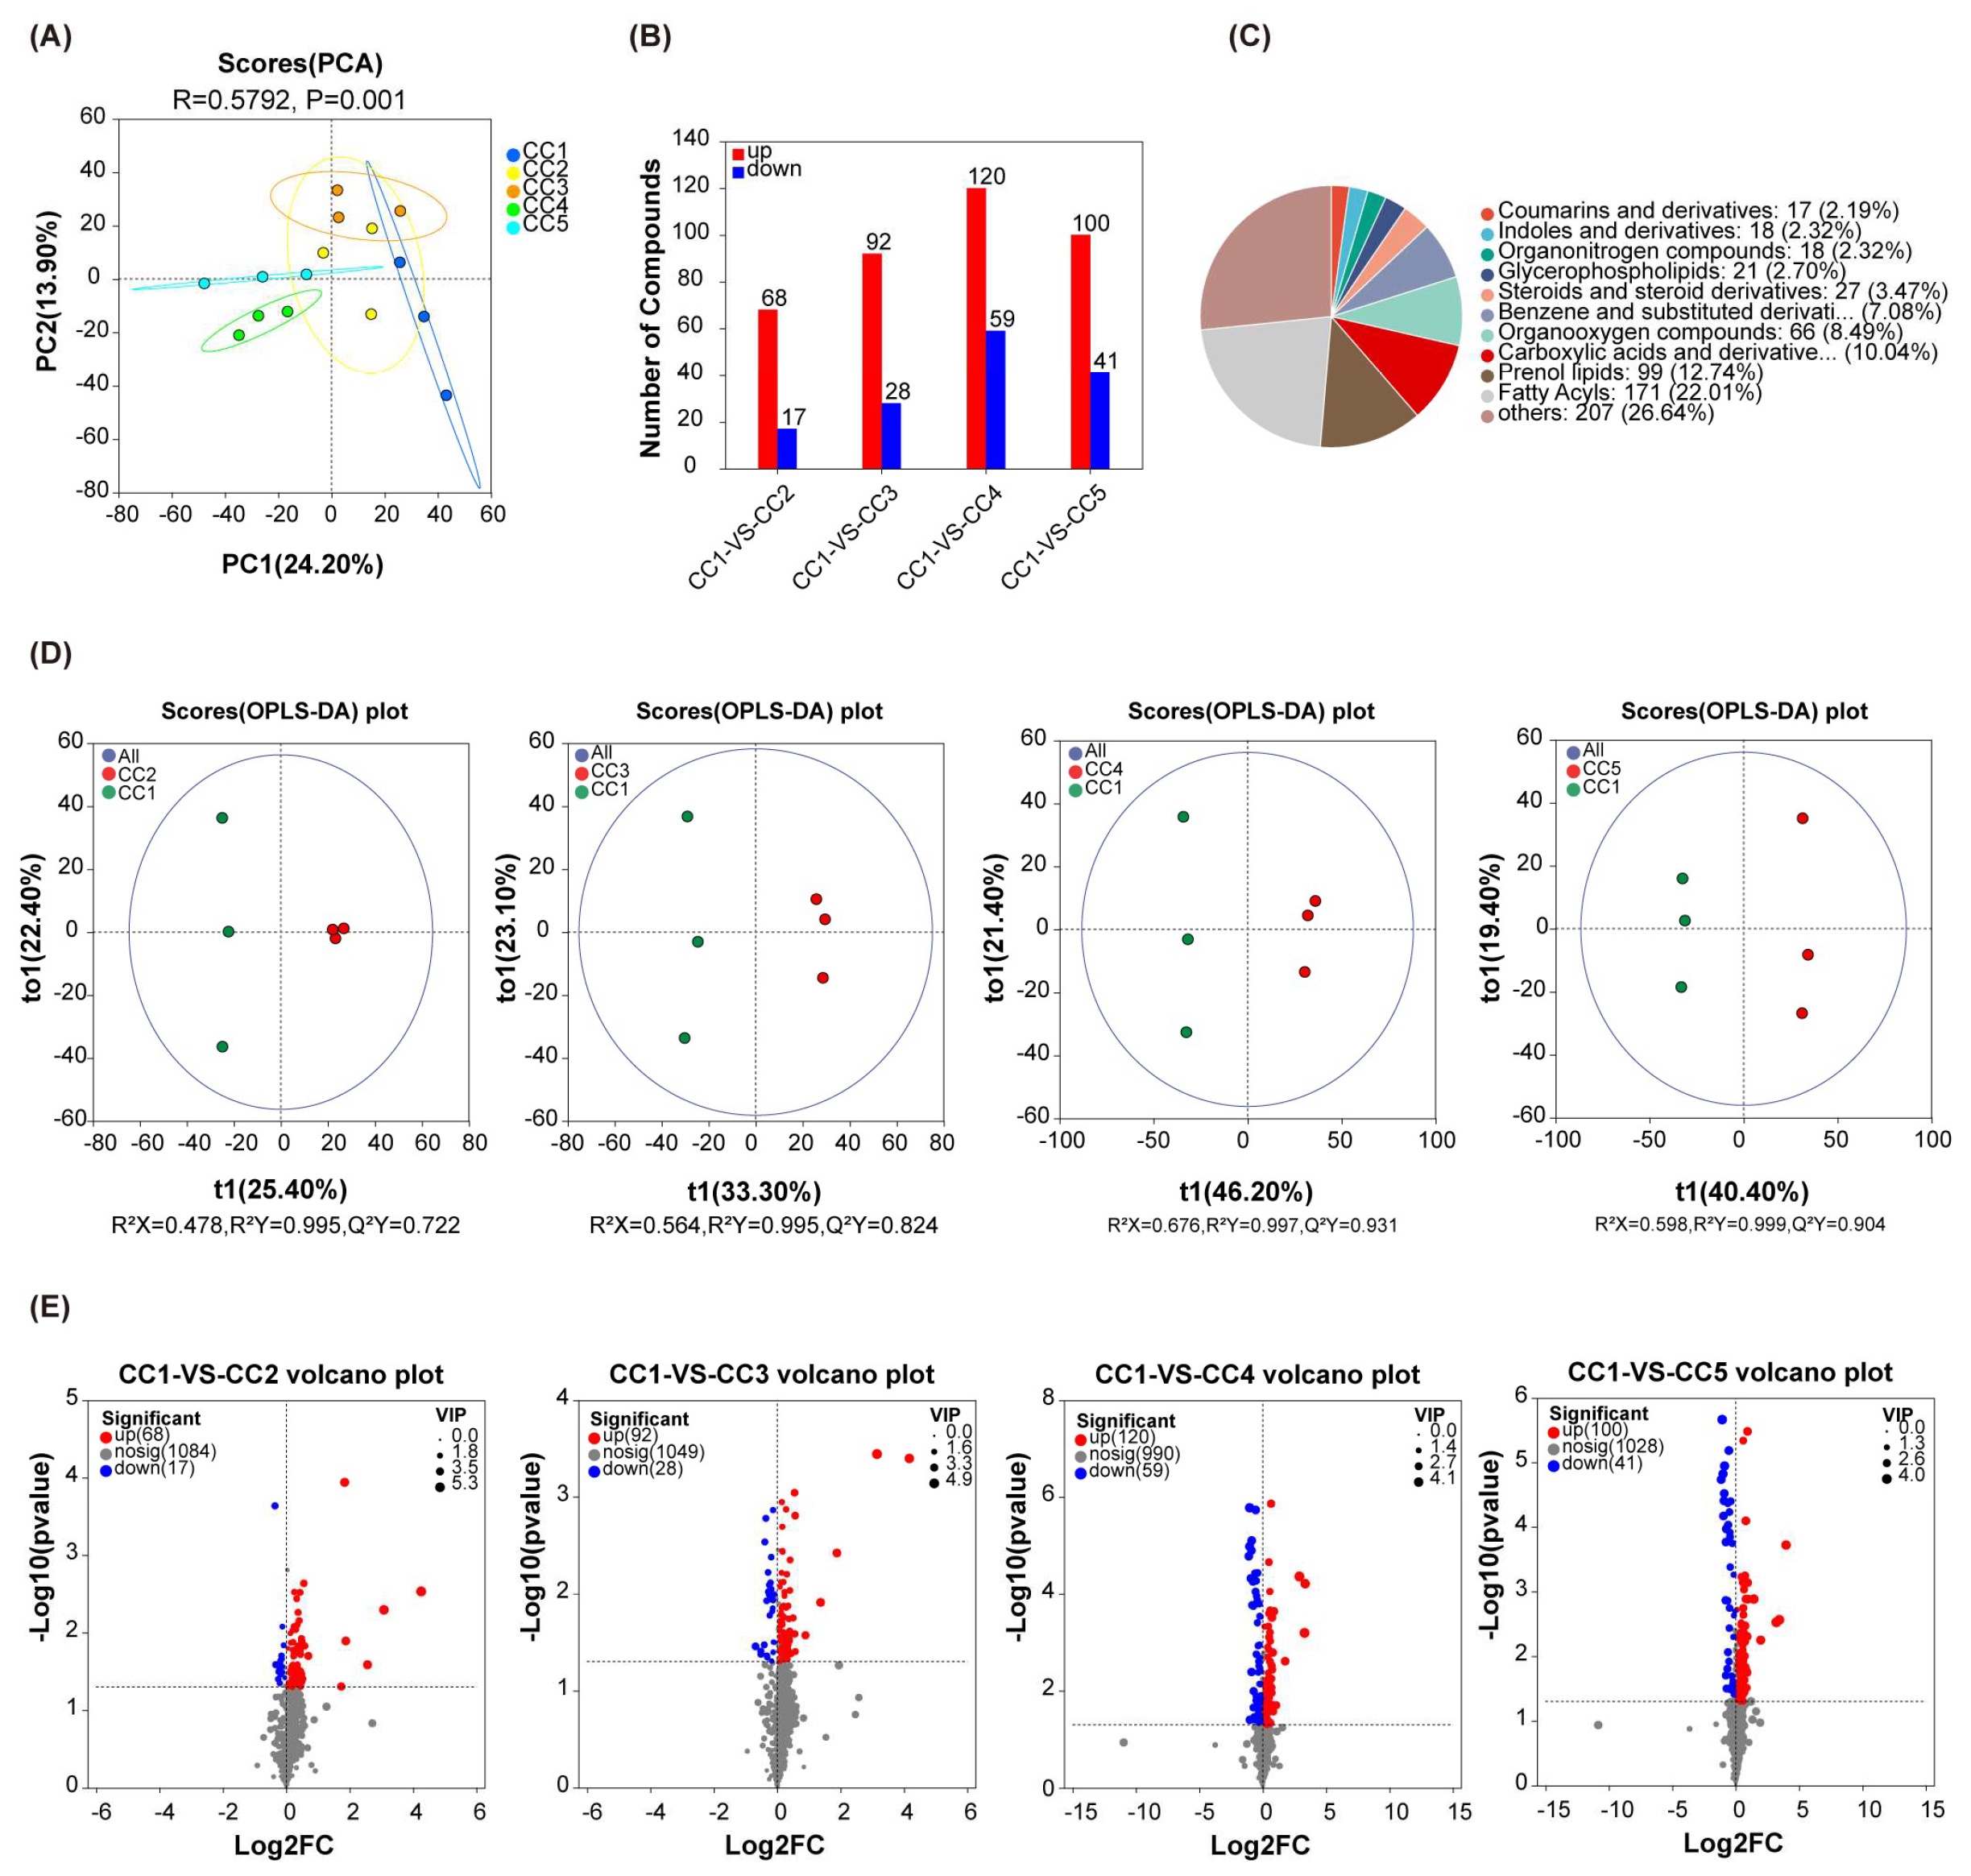
To further clarify the variation patterns of rhizosphere metabolites of Chinese chive across different planting durations, untargeted metabolomics analysis was performed on the samples using a UPLC-MS platform. A total of 9116 metabolic peaks were detected, and 1175 metabolites were identified (Table S1). According to the compound classification at the class level in the Human Metabolome Database (HMDB), these metabolites primarily belonged to the following categories: fatty acyls (22.01%), prenol lipids (12.74%), carboxylic acids and derivatives (10.04%), organooxygen compounds, benzene and substituted derivatives, steroids and steroid derivatives, glycerophospholipids, organonitrogen compounds, coumarins and derivatives, and indoles and derivatives (Figure 5C).
Principal component analysis (PCA) results showed that all soil samples were distributed within the 95% confidence interval. Samples from the same cropping year clustered together, differing markedly from those of other cropping durations (Figure 5A). OPLS-DA analysis was performed as an exploratory visualization and is presented in the Figure 5D.
The screening criteria for differential metabolites (DEMs) were set as follows: variable importance in projection (VIP) > 1.0, and p < 0.05, with the Benjamini–Hochberg FDR correction applied, and q < 0.05 as the final criterion for significance. The analysis of rhizosphere metabolites revealed that the extension of continuous cropping years was associated with changes in the abundance of metabolites. Using CC1 as the control, the DEMs identified in each comparison group were as follows:0 DEMs (85 based on raw p-values, with 68 upregulated and 17 downregulated) in the CC2 group; 0 DEMs (120 based on raw p-values, with 92 upregulated and 28 downregulated) in the CC3 group; 45 DEMs (179 based on raw p-values, with 120 upregulated and 59 downregulated) in the CC4 group; and 33 DEMs (141 based on raw p-values, with 100 upregulated and 41 downregulated) in the CC5 group (Figure 5B,E; Supplementary Table S2). Notably, after FDR correction, the total number of DEMs peaked in the CC4 group (45) and then slightly declined in the CC5 group (33).

3.4.2. KEGG Enrichment of Differential Metabolites Under Continuous Cropping

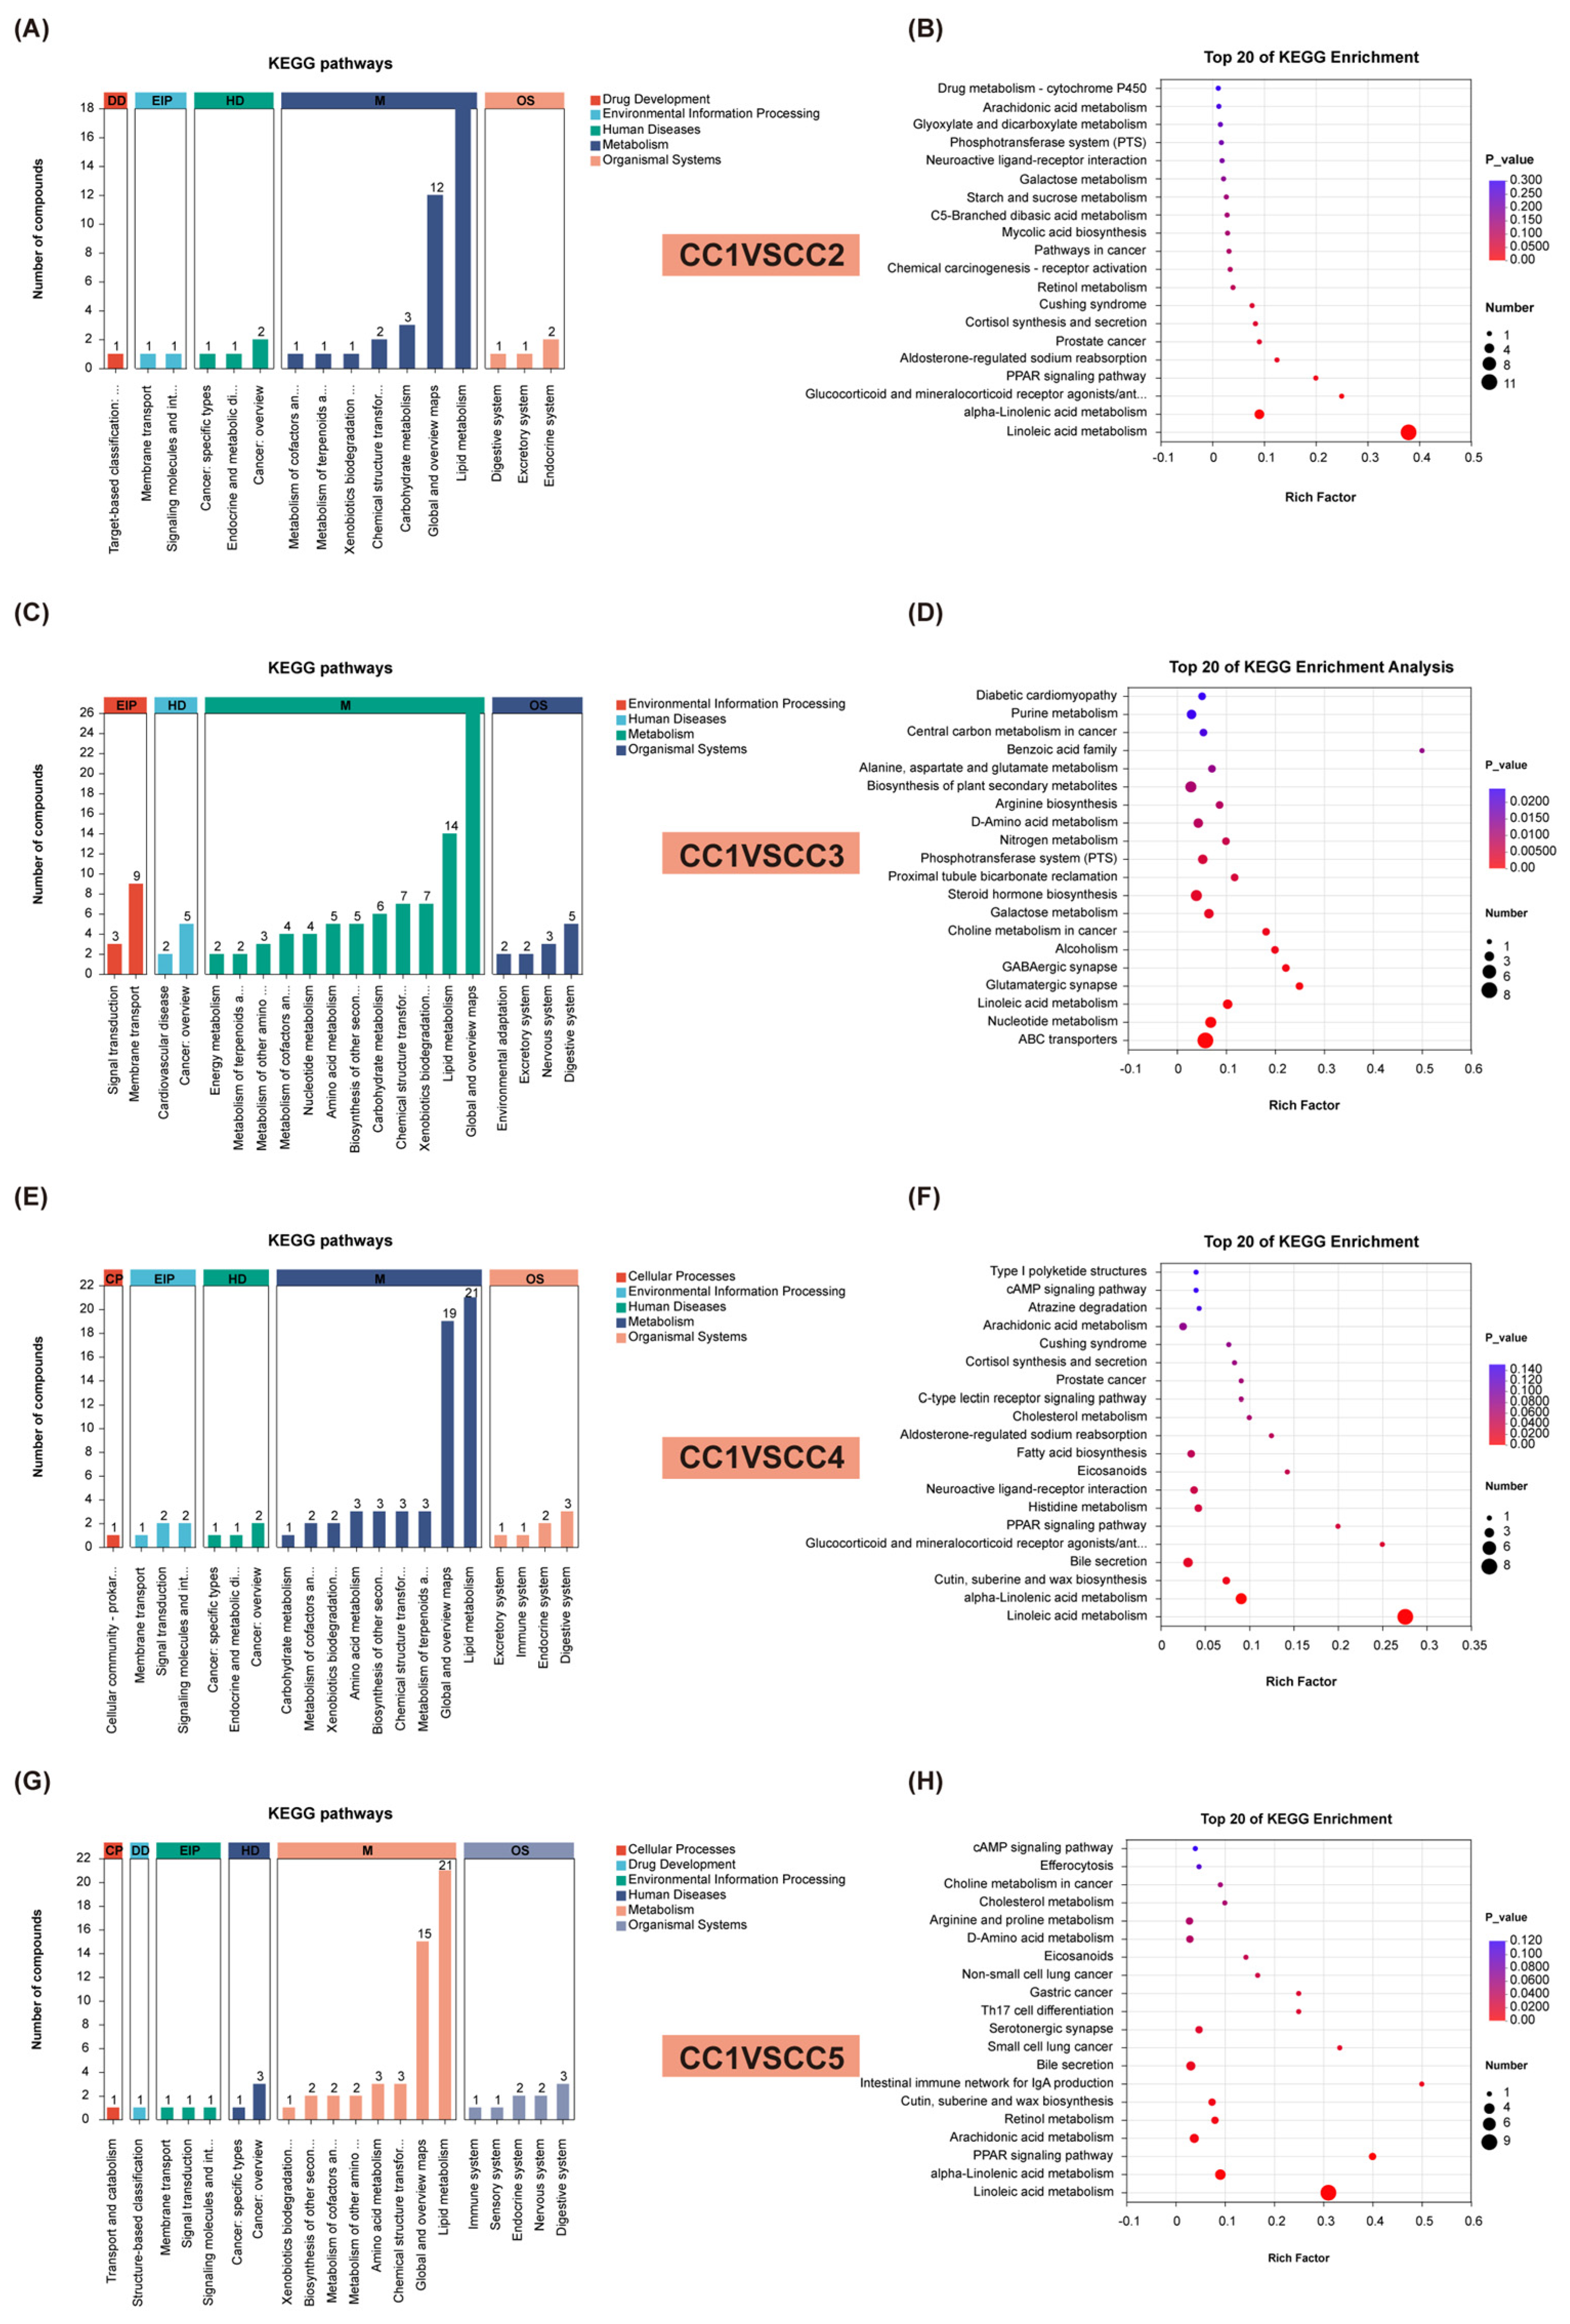
To further explore the biological functions of the differential metabolites (DEMs), we mapped the FDR-corrected DEMs to the Kyoto Encyclopedia of Genes and Genomes (KEGG) database for pathway enrichment analysis (Figure 6; Table S3). Specifically, in the CC1 vs. CC4 group, the PPAR signaling pathway and eicosanoid pathways were significantly enriched after FDR correction (P_adjust < 0.05); in the CC1 vs. CC5 group, linoleic acid metabolism, the cAMP signaling pathway, and the chemical carcinogenesis-receptor activation pathway were significantly enriched (P_adjust < 0.05).
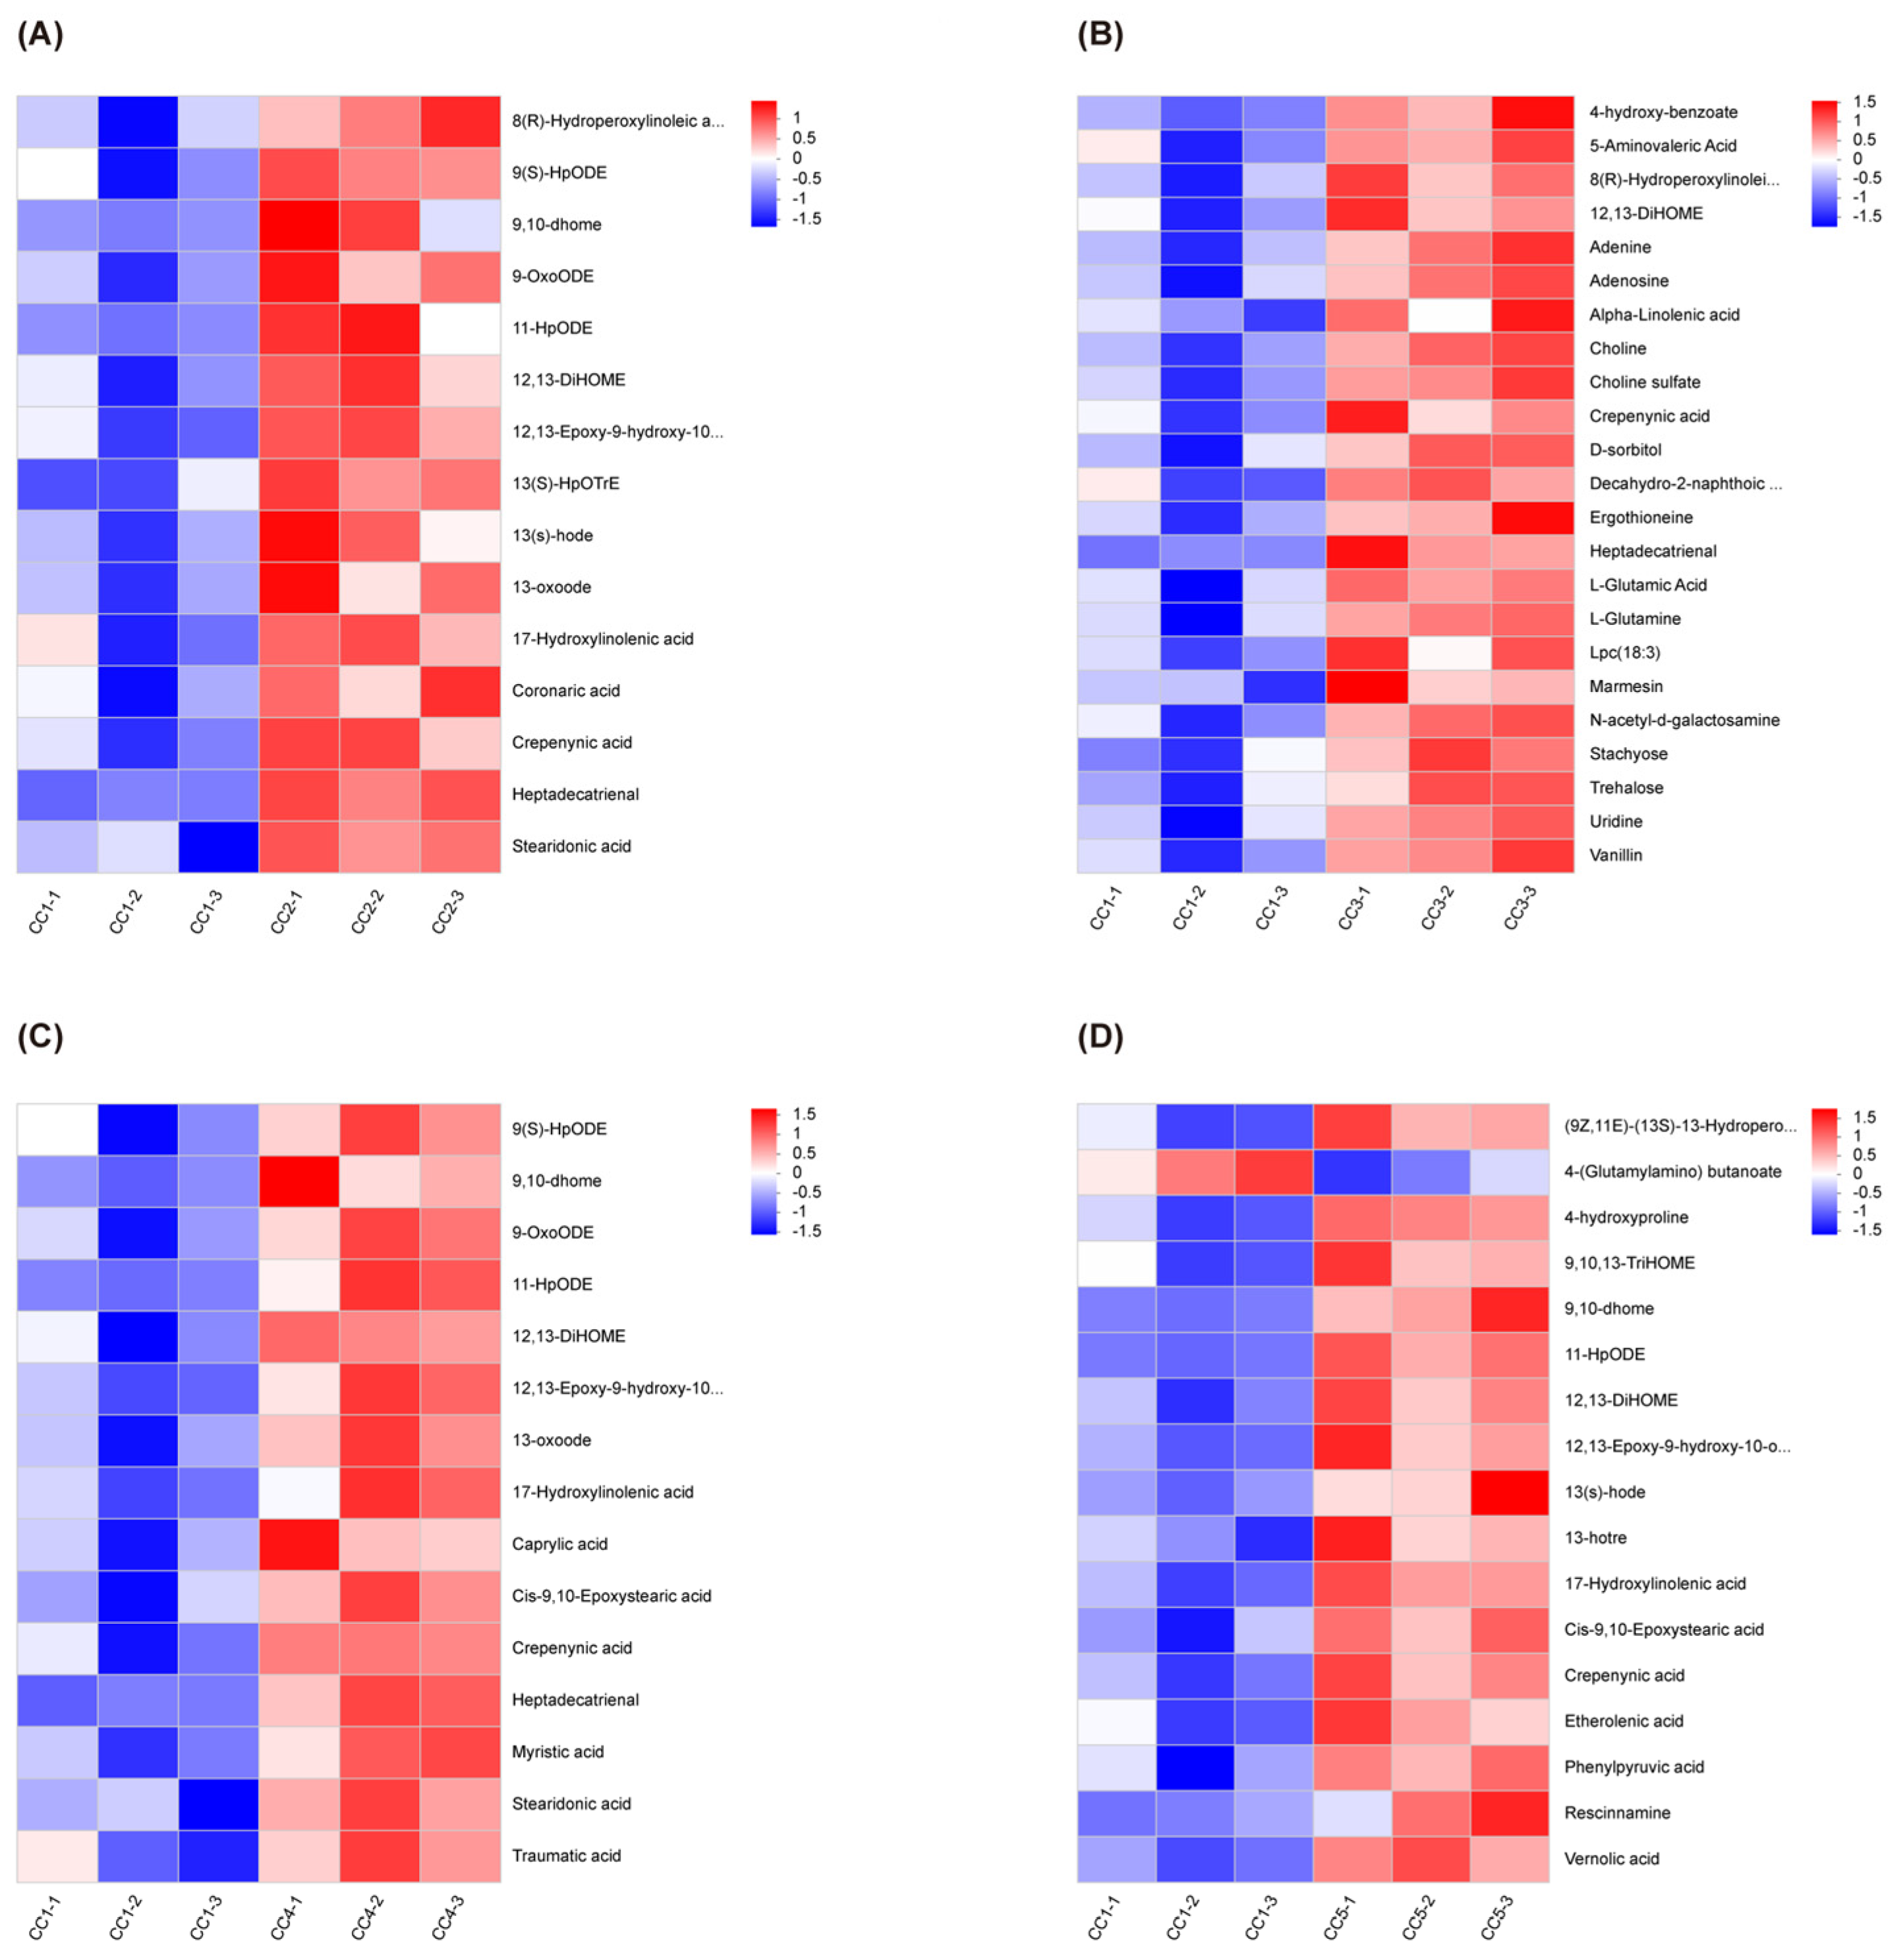
Based on the significantly enriched pathways described above, we further extracted the key differential metabolites associated with these pathways in each comparison group (Figure 7; Table S4). In the CC1 vs. CC4 group, one key differential metabolite—leukotriene B4 (LTB4)-was identified after FDR correction, primarily enriched in the PPAR signaling pathway and eicosanoid pathways. In the CC1 vs. CC5 group, three key differential metabolites were identified after FDR correction: 11-hydroperoxyoctadecadienoic acid (11-HpODE), 3-hydroxyoctanoate, and gemfibrozil, primarily enriched in linoleic acid metabolism, the cAMP signaling pathway, and the chemical carcinogenesis-receptor activation pathway.
Notably, among the key differential metabolites identified above, gemfibrozil and 3-hydroxyoctanoate exhibited a consistent downward trend, while 11-HpODE and LTB4 showed increased expression levels.

3.5. Correlation Analysis of Differential Metabolites and Microbial Communities

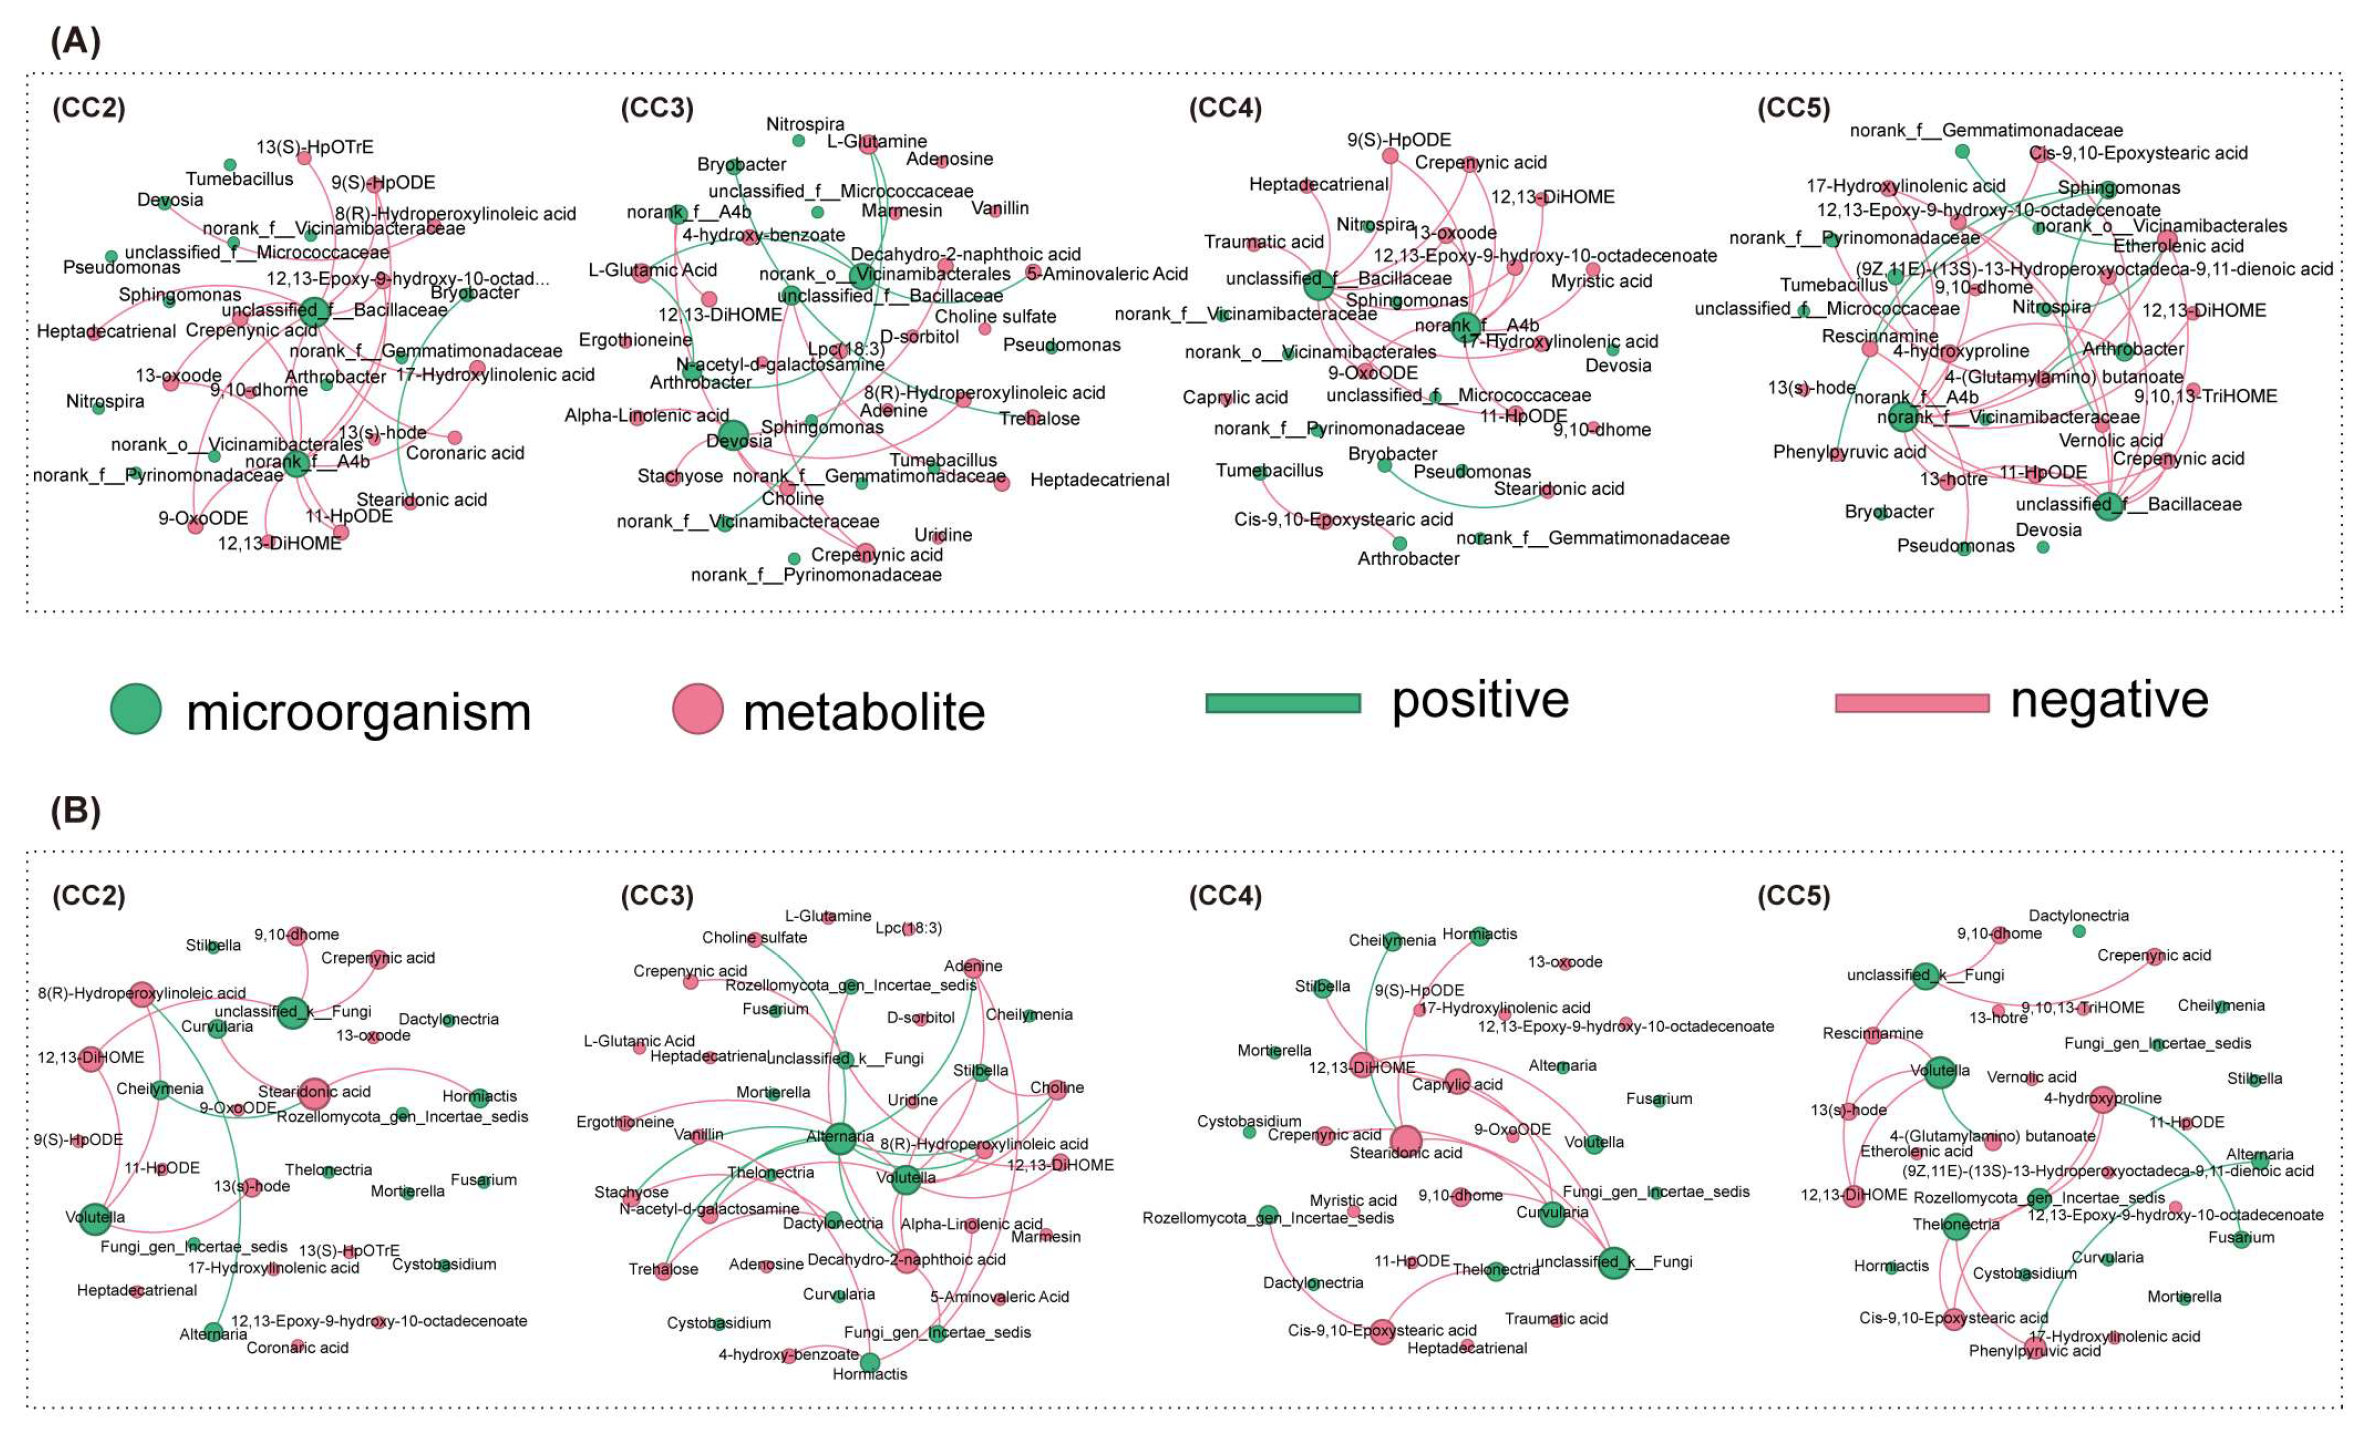
To further explore the relationship between microbial communities and rhizosphere metabolites under continuous cropping, Spearman correlation analysis (bacteria: |r| > 0.6, p < 0.05; fungi: |r| > 0.4, p < 0.05) was performed to construct correlation networks between the top 10 most abundant microbial genera (including key differential taxa) and key differential metabolites (Figure 8; Tables S5 and S6).
In the bacterial community (Figure 8A, Table S5), four bacterial genera in the CC2 group were significantly correlated with 13 metabolites. Specifically, Devosia showed a significant negative correlation with 8(R)-hydroxy-linolenic acid, while Bryobacter was significantly positively correlated with stearidonic acid. In the CC3 group, seven bacterial genera were significantly correlated with 12 metabolites. For instance, Devosia exhibited significant negative correlations with stachyose, decahydro-2-naphthoic acid, 8(R)-hydroxy-linolenic acid, and α-linolenic acid. Arthrobacter showed significant positive correlations with L-glutamic acid and lysophosphatidylcholine (Lpc(18:3)), while Bryobacter was significantly positively correlated with trehalose. In the CC4 group, five bacterial genera correlated with 13 metabolites. Both Tumebacillus and Arthrobacter were significantly negatively correlated with cis-9,10-epoxystearic acid, while Bryobacter remained significantly positively correlated with stearidonic acid. In the CC5 group, nine bacterial genera were significantly correlated with 15 metabolites. Tumebacillus and Arthrobacter were significantly negatively correlated with cis-9,10-epoxystearic acid and 4-hydroxyproline. Arthrobacter also showed a significant positive correlation with 4-(glutamylamino)butanoate. Furthermore, Sphingomonas was significantly positively correlated with rescinnamine, phenylpyruvic acid, and vernolic acid, whereas Pseudomonas was significantly negatively correlated with rescinnamine. Nitrospira showed a significant positive correlation with etherolenic acid.
In the fungal community (Figure 8B, Table S6), six genera in the CC2 group were significantly correlated with six metabolites. Volutella was significantly positively correlated with 12,13-DiHOME, 13(S)-HODE, and 8(R)-hydroxy-linolenic acid. Curvularia and Hormiactis were significantly positively correlated with stearidonic acid, while Cheilymenia showed a significant negative correlation with it. In the CC3 group, nine fungal genera correlated with 14 metabolites. Among them, Volutella showed significant positive correlations with 12,13-DiHOME, 8(R)-hydroxy-linolenic acid, adenine, decahydro-2-naphthoic acid, and ergothioneine. Hormiactis was significantly positively correlated with 4-hydroxybenzoic acid, vanillin, and α-linolenic acid. Alternaria exhibited significant negative correlations with several sugars and cholines (stachyose and choline), while Gibellulopsis was significantly positively correlated with stachyose and trehalose. In the CC4 group, eight fungal genera were significantly correlated with six metabolites. Curvularia and Hormiactis remained significantly positively correlated with stearidonic acid, whereas Cheilymenia was significantly negatively correlated. Gibellulopsis and Curvularia were significantly positively correlated with caprylic acid. Volutella was significantly positively correlated with 12,13-DiHOME, and Thelonectria was significantly positively correlated with cis-9,10-epoxystearic acid. In the CC5 group, six fungal genera correlated with nine metabolites. Volutella was significantly positively correlated with rescinnamine, 12,13-DiHOME, and 13(S)-HODE, but significantly negatively correlated with 4-(glutamylamino)butanoate. Thelonectria showed significant positive correlations with 4-hydroxyproline, phenylpyruvic acid, and cis-9,10-epoxystearic acid. Alternaria was significantly positively correlated with phenylpyruvic acid, while Fusarium showed a significant negative correlation with 4-hydroxyproline.
Notably, across all continuous cropping groups, several uncultured bacterial taxa belonging to Bacillaceae and Acidobacteriota, along with multiple taxonomically undefined fungal groups (including uncultured Rozellomycota), consistently exhibited significant negative correlations with lipid peroxidation derivatives and amino acid compounds.

4. Discussion

Long-term monoculture often leads to soil nutrient imbalances, which in turn inhibit crop growth [21]. In the present study, soil pH, organic matter, and alkali-hydrolyzable nitrogen content decreased significantly with the extension of the continuous cropping duration for Chinese chive, whereas electrical conductivity (EC) gradually increased. These results align with previous reports showing that continuous cropping induces a slight decrease in soil pH and salinization [22,23,24]. Soil acidification reduces the bioavailability of nutrients and interferes with the adsorption of trace elements, ultimately diminishing soil fertility and crop yield—a key driver of continuous cropping obstacles [25]. Similar conclusions were reached by Zhang et al. [26] in their study on continuous tea monoculture. Notably, the contents of AP and AK exhibited distinct trends, with AP initially decreasing before increasing, and AK initially increasing before decreasing. This asynchronous nutrient dynamic is largely consistent with the findings of Yang et al. [27] regarding tobacco, but differs from the observations reported by Yuan et al. [28] for turmeric. This non-equilibrium shift in nutrients may be attributed to two factors: first, the heavy application of phosphate fertilizers during the initial year to establish vigorous seedlings, followed by phosphorus accumulation as plant uptake weakened in later stages; and second, the sufficient supply of potassium fertilizers throughout the cropping period, where enhanced microbial immobilization in the later years potentially caused the consumption of AK to exceed its replenishment. In summary, long-term continuous cropping leads to selective nutrient depletion and accumulation in the soil of Chinese chive, exacerbating nutrient imbalances and subsequently inducing continuous cropping obstacles.
Soil enzyme activity is a key indicator for evaluating nutrient cycling capacity and soil health [29]. In this study, the activities of urease, alkaline phosphatase, sucrase, and catalase all followed a trend of an initial increase followed by a subsequent decrease as the continuous cropping duration extended. The transient rise in enzyme activities during the early stages of continuous cropping (CC1–CC3) may represent an adaptive compensatory response of the plant-microbe system to mild stress; specifically, the initial input of rhizosphere metabolites and litter provided microorganisms with labile carbon sources, thereby stimulating microbial metabolism and the secretion of extracellular enzymes. However, after four years of continuous cropping, enzyme activities significantly declined to levels near or below the baseline, indicating that soil nutrient cycling and antioxidant detoxification functions could no longer be sustained. This dynamic is consistent with the patterns reported in the continuous monoculture of crops such as turmeric and millet [28,30]. Specifically, catalase is responsible for scavenging excess H2O2 produced by roots, and the decline in its activity signifies a disruption of the rhizospheric redox balance. The reduction in catalase activity coincided temporally with the substantial accumulation of oxidized fatty acids in rhizosphere metabolites observed in this study, suggesting that roots undergo persistent oxidative stress in the later stages of continuous cropping, and the inherent detoxification capacity of the soil is insufficient to offset the negative effects of autotoxic substances. Collectively, these results demonstrate that once the continuous cropping of Chinese chive exceeds three years, soil basal fertility and biochemical functions enter a stage of decline.
The impact of continuous cropping on soil microbial communities is not merely a reduction in diversity but rather a directional succession of community structure, a phenomenon previously observed in crops such as lily [31] and tomato [32]. In the present study, bacterial richness decreased significantly after CC4. PCoA and ANOSIM further confirmed a significant separation in community structures, indicating that the duration of continuous cropping is the primary driver of rhizospheric microbial succession in Chinese chive [11]. Venn diagram analysis showed that the number of unique ASVs for both bacteria and fungi reached its minimum at CC4, suggesting that four years of continuous cropping represents a critical point for the microbial community. At the phylum level, the continuous enrichment of Acidobacteriota further validates the trends of soil acidification and oligotrophication [33,34]. Ascomycota remained the absolute dominant phylum, and its “decrease-then-increase” trend in relative abundance is closely linked to its high metabolic adaptability, allowing it to decompose diverse plant-derived and host organic residues [35]; this mirrors the shifts in fungal community structure reported in continuous melon cultivation [36]. At the genus level, the relative abundances of potentially beneficial bacteria, such as Nitrospira, Sphingomonas, and Pseudomonas, generally declined with the extension of cropping years. Conversely, soil-borne pathogens, including Thelonectria, Volutella, and Alternaria, were significantly enriched in the later stages of continuous cropping. Notably, the abundances of Tumebacillus and Arthrobacter increased initially and then decreased. This dynamic may reflect a concentration-dependent response of rhizospheric microbes to the accumulation of autotoxic substances. Overall, the continuous cropping of Chinese chive results in a distinct separation of rhizospheric microbial community structure, characterized by the decline of beneficial microbes and the accumulation of potential pathogens, driving functional succession toward a state detrimental to plant health.
Rhizosphere metabolites are the primary source of allelochemicals, and the autotoxic effects resulting from the accumulation of high concentrations of these substances are considered a direct trigger for continuous cropping obstacles [37]. In this study, 1175 metabolites were identified in the rhizosphere of Chinese chive, among which oxidized fatty acids (e.g., 9,10-DiHOME, 11-HpODE, 12,13-DiHOME, and 13-OxoODE) were the most abundant metabolic category. This profile differs from most reported continuous cropping systems where phenolic acids typically dominate [38,39]. Oxidized fatty acids are direct products of membrane lipid peroxidation; their substantial efflux indicates that the root cell membrane system is undergoing an assault by reactive oxygen species (ROS) under continuous cropping stress. Furthermore, these compounds possess intrinsic allelopathic activity, which can inhibit root growth by inducing rhizospheric redox imbalances and amino acid metabolic disorders, thereby exacerbating programmed cell death in root tips [40,41]. For instance, 13(S)-HpODE has been shown in Perilla frutescens to interfere with cell membrane biosynthesis and organelle regeneration [42]. Additionally, the accumulation of phenolic acids (vanillin and 4-hydroxybenzoic acid) and coumarins (marmesin) contributes to autotoxicity [43,44]. The allelopathic effects of phenolic acids in the rhizosphere characteristically stimulate growth at low concentrations but inhibit it at high concentrations; at elevated levels, they can hinder root development, impair nutrient uptake and soil enzyme activity, and indirectly aggravate continuous cropping obstacles by altering the microbial community structure [45,46]. Marmesin (a furanocoumarin) detected in this study can directly inhibit seed germination and seedling growth [47]. Simultaneously, the efflux of amino acids such as glutamate and glutamine, alongside the accumulation of osmoregulatory substances like stachyose and trehalose, further confirms from a metabolic perspective that the roots of Chinese chive are under severe continuous cropping stress. The presence of lysophosphatidylcholine, a degradation product of membrane phospholipids, provides direct evidence that the integrity of the membrane structure has been compromised. Collectively, these results indicate that continuous cropping promotes the accumulation of allelochemicals and triggers a root oxidative burst, which subsequently damages the rhizospheric micro-ecosystem and inhibits plant growth.
The most critical finding of this study lies in the differentiated correlation patterns between autotoxic substances and microbial communities. Spearman correlation analysis revealed that beneficial bacteria (such as Devosia, Tumebacillus, Arthrobacter, and Pseudomonas) were significantly negatively correlated with various oxidized fatty acids and phenolic acids. Conversely, pathogenic fungi (such as Hormiactis, Thelonectria, and Volutella) exhibited significant positive correlations with the same classes of autotoxic substances. This contrasting pattern, in which beneficial microbes are inhibited while pathogens are promoted during the mid-to-late stages of continuous cropping (CC3–CC5), is highly consistent with findings in the Dictyophora rubrovalvata continuous cropping system [48]. Together, these results confirm that allelochemicals exuded by roots can selectively inhibit beneficial microorganisms while facilitating the proliferation of pathogens, thereby driving the succession of the rhizospheric microbial community toward a pathogenic state. Notably, Arthrobacter showed a significant positive correlation with L-glutamine, suggesting that certain rhizospheric microbes can utilize amino acids leaked from the roots as a nutrient source, which reflects the differentiated response strategies of microorganisms to stress signals.
Based on these findings, we hypothesize that a positive feedback mechanism may contribute to continuous cropping obstacles in Chinese chive. Specifically continuous cropping is associated with la slight decrease in soil pH and nutrient imbalance, which may create initial stress; this stress may induce a root reactive oxygen species (ROS) burst and membrane lipid peroxidation, leading to the production and efflux of oxidized fatty acids and other compounds. These putative allelochemicals accumulate in the rhizosphere and may suppress root growth. Furthermore, these compounds were negatively associated with putatively beneficial bacteria and positively associated with pathogenic fungi, suggesting a potential link to microbial community succession. Finally, the activity of antioxidant enzyme systems (e.g., catalase) declines, which may fail to scavenge ROS and putative allelochemicals, potentially exacerbating root damage.
Several limitations of this study should be acknowledged. First, soil samples were collected at a single time point (30 days after regrowth). As Chinese chive is a perennial vegetable harvested multiple times per year, the results represent a single phenological snapshot and do not capture potential seasonal or inter-annual variations. Future studies with multi-season and multi-year sampling are needed to validate the observed trends. Second, this study did not include measurements of soil micronutrients (e.g., Fe, Mn, Cu, Zn), which are known to be essential for soil enzyme activities and specific microbial functional groups. Future studies integrating micronutrient dynamics would provide a more comprehensive understanding of continuous cropping-induced soil degradation. Despite these limitations, our findings provide valuable insights into the mechanisms of continuous cropping obstacles and offer a basis for developing sustainable management practices for Chinese chive production.

5. Conclusions

This study systematically investigated the impacts of continuous cropping of Chinese chive on soil physicochemical properties, soil enzyme activities, microbial communities, and rhizosphere metabolites. The results suggest that continuous cropping is associated with alterations in soil properties, reductions in soil enzyme activities, shifts in microbial community structures, and accumulation of putative allelochemicals. The present study further indicates that oxidized fatty acids were the most consistently accumulated metabolites after FDR correction, suggesting that lipid peroxidation products may serve as key chemical indicators of continuous cropping stress. Additionally, we identified associative networks between these metabolites and specific microbial genera, which may provide insights into the ecological interactions underlying microbial community succession. These findings support the tentative recommendation that crop rotation after the third year may help sustain soil health and productivity, but this recommendation requires validation in dedicated rotation trials.

Supplementary Materials

The following supporting information can be downloaded at: https://www.mdpi.com/article/10.3390/horticulturae12091070/s1. Table S1: All annotated metabolites, Table S2: Candidate differential metabolites, Table S3: KEGG pathways associated with differential metabolites, Table S4: KEGG pathways associated with differential metabolites, Table S5: Correlation between bacteria communities and differential metabolites, Table S6: Correlation between fungal communities and differential metabolites.

Author Contributions

Y.L. Investigation, Writing—original draft, Writing—review and editing. Z.Y. and J.X. Data curation, Visualization. J.L., X.Z. and K.C. Conceptualization, Methodology, Writing—review and editing. J.F. and R.M. Investigation. Resources. L.Y. Conceptualization, Methodology, Funding acquisition, Resources, Writing—review & editing. All authors have read and agreed to the published version of the manuscript.

Funding

This work was supported by the National Key Research and Development Program of China (2021YFD1600300); the Key Research and Development Program of Ningxia Hui Autonomous Region (2021BBF02006); the Key Research and Development Program of Ningxia Hui Autonomous Region (2023BCF01042).

Data Availability Statement

The datasets presented in this study can be found in online repositories. The raw sequencing data were deposited into the NCBI Sequence Read Archive (SRA) database under the accession number SRP700138. The untargeted metabolomics raw data have been deposited in the OMIX database of the National Genomics Data Center (NGDC) under accession number OMIX019984 and are publicly accessible at https://ngdc.cncb.ac.cn/omix/release/OMIX019984 (accessed on 26 August 2026).

Acknowledgments

We are thankful to all agencies and contributors that aided this work. We thank Jianbing Feng and Rui Ma for assistance in locating the study site and for sharing their expertise. We thank the reviewers for their suggestions and comments on the manuscript. We are particularly grateful to the editor and reviewers for their help in improving our manuscript. The authors acknowledge the use of Deepseek (version 2.3.1, DeepSeek Company, Hangzhou, China) for language polishing and grammatical refinement during the final preparation of this manuscript.

Conflicts of Interest

The authors declare no conflict of interest.

References

  1. Xie, B.; Xiao, X.; Li, H.; Wei, S.; Li, J.; Gao, Y.; Yu, J. Moderate Salinity of Nutrient Solution Improved the Nutritional Quality and Flavor of Hydroponic Chinese Chives (Allium tuberosum Rottler). Foods 2023, 12, 204. [Google Scholar] [CrossRef] [Scilit]
  2. Liu, N.; Hu, M.; Liang, H.; Tong, J.; Xie, L.; Wang, B.; Ji, Y.; Han, B.; He, H.; Liu, M.; et al. Physiological, transcriptomic, and metabolic analyses reveal that mild salinity improves the growth, nutrition, and flavor properties of hydroponic Chinese chive (Allium tuberosum Rottler ex Spr). Front. Nutr. 2022, 9, 1000271. [Google Scholar] [CrossRef] [Scilit]
  3. Haq, M.Z.U.; Yu, J.; Yao, G.; Yang, H.; Iqbal, H.A.; Tahir, H.; Cui, H.; Liu, Y.; Wu, Y. A Systematic Review on the Continuous Cropping Obstacles and Control Strategies in Medicinal Plants. Int. J. Mol. Sci. 2023, 24, 12470. [Google Scholar] [CrossRef] [Scilit]
  4. Yan, W.; Liu, X.; Cao, S.; Yu, J.; Zhang, J.; Yao, G.; Yang, H.; Yang, D.; Wu, Y. Molecular basis of Pogostemon cablin responding to continuous cropping obstacles revealed by integrated transcriptomic, miRNA and metabolomic analyses. Ind. Crop Prod. 2023, 200, 116862. [Google Scholar] [CrossRef] [Scilit]
  5. Liao, J.; Xia, P. Continuous cropping obstacles of medicinal plants: Focus on the plant-soil-microbe interaction system in the rhizosphere. Sci. Hortic. 2024, 328, 112927. [Google Scholar] [CrossRef] [Scilit]
  6. Li, H.; Yang, Y.; Lei, J.; Gou, W.; Crabbe, M.J.C.; Qi, P. Effects of Continuous Cropping of Codonopsis pilosula on Rhizosphere Soil Microbial Community Structure and Metabolomics. Agronomy 2024, 14, 2014. [Google Scholar] [CrossRef] [Scilit]
  7. Shen, W.; Hu, M.; Qian, D.; Xue, H.; Gao, N.; Lin, X. Microbial deterioration and restoration in greenhouse-based intensive vegetable production systems. Plant Soil 2021, 463, 1–18. [Google Scholar] [CrossRef] [Scilit]
  8. Gong, B.; He, Y.; Luo, Z.; Peng, H.; Cai, H.; Zhu, Y.; Bin, J.; Ding, M. Response of rhizosphere soil physicochemical properties and microbial community structure to continuous cultivation of tobacco. Ann. Microbiol. 2024, 74, 4. [Google Scholar] [CrossRef] [Scilit]
  9. Wang, J.; Li, M.; Zhou, Q.; Zhang, T. Effects of continuous cropping Jiashi muskmelon on rhizosphere microbial community. Front. Microbiol. 2023, 13, 1086334. [Google Scholar] [CrossRef] [Scilit]
  10. Li, Y.; Shi, C.; Wei, D.; Gu, X.; Wang, Y.; Sun, L.; Cai, S.; Hu, Y.; Jin, L.; Wang, W. Soybean continuous cropping affects yield by changing soil chemical properties and microbial community richness. Front. Microbiol. 2022, 13, 1083736. [Google Scholar] [CrossRef] [Scilit]
  11. Gu, Y.; Wang, Y.; Wang, P.; Wang, C.; Ma, J.; Yang, X.; Ma, D.; Li, M. Study on the Diversity of Fungal and Bacterial Communities in Continuous Cropping Fields of Chinese Chives (Allium tuberosum). BioMed. Res. Int. 2020, 2020, 3589758. [Google Scholar] [CrossRef] [Scilit]
  12. Liu, Y.; Evans, S.E.; Friesen, M.L.; Tiemann, L.K. Root exudates shift how N mineralization and N fixation contribute to the plant-available N supply in low fertility soils. Soil Biol. Biochem. 2022, 165, 108541. [Google Scholar] [CrossRef] [Scilit]
  13. Anderson, H.M.; Cagle, G.A.; Majumder, E.L.W.; Silva, E.; Dawson, J.; Simon, P.; Freedman, Z.B. Root exudation and rhizosphere microbial assembly are influenced by novel plant trait diversity in carrot genotypes. Soil Biol. Biochem. 2024, 197, 109516. [Google Scholar] [CrossRef] [Scilit]
  14. Shi, H.; Yang, J.; Li, Q.; PinChu, C.; Song, Z.; Yang, H.; Luo, Y.; Liu, C.; Fan, W. Diversity and correlation analysis of different root exudates on the regulation of microbial structure and function in soil planted with Panax notoginseng. Front. Microbiol. 2023, 14, 1282689. [Google Scholar] [CrossRef] [Scilit]
  15. Pang, Z.; Xu, P. Probiotic model for studying rhizosphere interactions of root exudates and the functional microbiome. ISME J. 2024, 18, wrae223. [Google Scholar] [CrossRef] [Scilit]
  16. Ma, H.; Ren, Z.; Luo, A.; Fang, X.; Liu, R.; Wu, C.; Shi, X.; Li, J.; Lv, H.; Sun, X.; et al. Self-alleviation of continuous-cropping obstacles in potato via root-exudate-driven recruitment of growth-promoting bacteria. Plant Commun. 2025, 6, 101372. [Google Scholar] [CrossRef] [Scilit]
  17. Liu, Y.; Lu, R.; Tian, G.; Li, X.; Zhao, S.; Luo, L.; Ye, C.; Mei, X.; Zhu, S.; Yang, M. Root-secreted saponins weaken soil disease suppression ability by shaping rhizosphere microbial communities in Panax notoginseng. Microbiol. Res. 2025, 299, 128263. [Google Scholar] [CrossRef] [Scilit]
  18. Huang, W.; Sun, D.; Wang, R.; An, Y. Integration of Transcriptomics and Metabolomics Reveals the Responses of Sugar Beet to Continuous Cropping Obstacle. Front. Plant Sci. 2021, 12, 711333. [Google Scholar] [CrossRef] [Scilit]
  19. Li, Z.; Lian, D.; Zhang, S.; Yao, Y.; Lin, B.; Hong, J.; Wu, S.; Li, H. Continuous Cropping Duration Alters Green Pepper Root Exudate Composition and Triggers Rhizosphere Feedback Inhibition. Agronomy 2025, 15, 2010. [Google Scholar] [CrossRef] [Scilit]
  20. Wang, R.; Liu, J.; Jiang, W.; Ji, P.; Li, Y. Metabolomics and Microbiomics Reveal Impacts of Rhizosphere Metabolites on Alfalfa Continuous Cropping. Front. Microbiol. 2022, 13, 833968. [Google Scholar] [CrossRef] [Scilit]
  21. Wang, Y.; Wang, Y.; Li, J.; Cai, Y.; Hu, M.; Lin, W.; Wu, Z. Effects of continuous monoculture on rhizosphere soil nutrients, growth, physiological characteristics, hormone metabolome of Casuarina equisetifolia and their interaction analysis. Heliyon 2024, 10, e26078. [Google Scholar] [CrossRef] [Scilit]
  22. Lv, H.; Rui, S.; LingLing, H.; YueChen, L.; Xu, D.; MingXia, W.; QiAn, Z.; Li, J.; Ding, Q.; CongSheng, Y.; et al. Continuous watermelon cropping impairs plant growth by modifying soil biochemistry and rhizosphere microbial communities. Front. Microbiol. 2025, 16, 1648481. [Google Scholar] [CrossRef] [Scilit]
  23. Ji, W.; Zhang, N.; Su, W.; Wang, X.; Liu, X.; Wang, Y.; Chen, K.; Ren, L. The impact of continuous cultivation of Ganoderma lucidum on soil nutrients, enzyme activity, and fruiting body metabolites. Sci. Rep. 2024, 14, 10097. [Google Scholar] [CrossRef] [Scilit]
  24. Pang, Z.; Dong, F.; Liu, Q.; Lin, W.; Hu, C.; Yuan, Z. Soil Metagenomics Reveals Effects of Continuous Sugarcane Cropping on the Structure and Functional Pathway of Rhizospheric Microbial Community. Front. Microbiol. 2021, 12, 627569. [Google Scholar] [CrossRef] [Scilit]
  25. Zhang, J.; Luo, S.; Yao, Z.; Zhang, J.; Chen, Y.; Sun, Y.; Wang, E.; Ji, L.; Li, Y.; Tian, L.; et al. Effect of Different Types of Continuous Cropping on Microbial Communities and Physicochemical Properties of Black Soils. Diversity 2022, 14, 954. [Google Scholar] [CrossRef] [Scilit]
  26. Zhang, Y.; Wang, B.; Wang, G.; Zheng, Z.; Chen, Y.; Li, O.; Peng, Y.; Hu, X. Acidification induce chemical and microbial variation in tea plantation soils and bacterial degradation of the key acidifying phenolic acids. Arch. Microbiol. 2024, 206, 239. [Google Scholar] [CrossRef] [Scilit]
  27. Yang, B.; Feng, C.; Jiang, H.; Chen, Y.; Ding, M.; Dai, H.; Zhai, Z.; Yang, M.; Liang, T.; Zhang, Y. Effects of long-term continuous cropping on microbial community structure and function in tobacco rhizosphere soil. Front. Microbiol. 2025, 16, 1496385. [Google Scholar] [CrossRef] [Scilit]
  28. Huang, Y.; Gan, K.; Lin, W.; Yan, Z.; Wei, S.; Shi, L.; Zhang, Z. Continuous cropping alters rhizosphere microbial communities and soil properties reducing Curcuma kwangsiensis yield. Sci. Rep. 2025, 15, 39668. [Google Scholar] [CrossRef] [Scilit]
  29. Zhou, Y.; Biro, A.; Wong, M.Y.; Batterman, S.A.; Staver, A.C. Fire decreases soil enzyme activities and reorganizes microbially mediated nutrient cycles: A meta-analysis. Ecology 2022, 103, e3807. [Google Scholar] [CrossRef] [Scilit]
  30. Zhang, P.; Xia, L.; Sun, Y.; Gao, S. Soil nutrients and enzyme activities based on millet continuous cropping obstacles. Sci. Rep. 2024, 14, 17329. [Google Scholar] [CrossRef] [Scilit]
  31. Zhang, Y.; Wang, J.; Zhao, Y.; Liu, J. Effect of continuous lily cropping on rhizosphere microbial structures. Front. Microbiol. 2025, 16, 1658893. [Google Scholar] [CrossRef] [Scilit]
  32. Li, M.; Chen, X.; Cui, Y.; Yue, X.; Qi, L.; Huang, Y.; Zhu, C. Mechanism of soil microbial community degradation under long-term tomato monoculture in greenhouse. Front. Microbiol. 2025, 16, 1587397. [Google Scholar] [CrossRef] [Scilit]
  33. Gao, Z.; Hu, Y.; Han, M.; Xu, J.; Wang, X.; Liu, L.; Tang, Z.; Jiao, W.; Jin, R.; Liu, M.; et al. Effects of continuous cropping of sweet potatoes on the bacterial community structure in rhizospheric soil. BMC Microbiol. 2021, 21, 102. [Google Scholar] [CrossRef] [Scilit]
  34. Xi, H.; Shen, J.; Qu, Z.; Yang, D.; Liu, S.; Nie, X.; Zhu, L. Effects of Long-term Cotton Continuous Cropping on Soil Microbiome. Sci. Rep. 2019, 9, 18297. [Google Scholar] [CrossRef] [Scilit]
  35. Manici, L.M.; Caputo, F.; De Sabata, D.; Fornasier, F. The enzyme patterns of Ascomycota and Basidiomycota fungi reveal their different functions in soil. Appl. Soil. Ecol. 2024, 196, 105323. [Google Scholar] [CrossRef] [Scilit]
  36. Han, R.; Shi, Y.; Wang, H.; Kuang, Z.; Hailati, D.; Shen, Z.; Ma, Y.; Xue, N. Impacts of continuous melon cropping on soil properties and microbial network restructuring. J. Arid Land 2025, 17, 1458–1481. [Google Scholar] [CrossRef] [Scilit]
  37. Haq, M.Z.U.; Bai, Z.; Gu, G.; Liu, Y.; Yang, D.; Yang, H.; Yu, J.; Wu, Y. Continuous cropping obstacles in medicinal plants: Driven by soil microbial communities and root exudates. A review. Plant Sci. 2025, 359, 112686. [Google Scholar] [CrossRef] [Scilit]
  38. Li, A.; Jin, K.; Zhang, Y.; Deng, X.; Chen, Y.; Wei, X.; Hu, B.; Jiang, Y. Root exudates and rhizosphere microbiota in responding to long-term continuous cropping of tobacco. Sci. Rep. 2024, 14, 11274. [Google Scholar] [CrossRef] [Scilit]
  39. Ma, H.; Li, J.; Luo, A.; Lv, H.; Ren, Z.; Yang, H.; Fang, X.; Shahzad, M.A.; Qu, H.; Zhang, K.; et al. Vanillin, a Newly Discovered Autotoxic Substance in Long-Term Potato Continuous Cropping Soil, Inhibits Plant Growth by Decreasing the Root Auxin Content and Reducing Adventitious Root Numbers. J. Agric. Food Chem. 2023, 71, 16993–17004. [Google Scholar] [CrossRef] [Scilit]
  40. Chakraborty, N.; Mitra, R.; Dasgupta, D.; Ganguly, R.; Acharya, K.; Minkina, T.; Popova, V.; Churyukina, E.; Keswani, C. Unraveling lipid peroxidation-mediated regulation of redox homeostasis for sustaining plant health. Plant Physiol. Biochem. 2024, 206, 108272. [Google Scholar] [CrossRef] [Scilit]
  41. Iuchi, K.; Takai, T.; Hisatomi, H. Cell Death via Lipid Peroxidation and Protein Aggregation Diseases. Biology 2021, 10, 399. [Google Scholar] [CrossRef] [Scilit]
  42. Liu, Y.; Xie, M.; Xue, T.; Sui, X.; Sun, H.; Li, C.; Song, F. Short-term continuous cropping leads to a decline in rhizosphere soil fertility by modulating the perilla root exudates. Rhizosphere 2024, 32, 100966. [Google Scholar] [CrossRef] [Scilit]
  43. Wu, B.; Shi, S.; Zhang, H.; Lu, B.; Nan, P.; Yun, A. Anabolic metabolism of autotoxic substance coumarins in plants. PeerJ 2023, 11, e16508. [Google Scholar] [CrossRef] [Scilit]
  44. Wu, B.; Shi, S.; Zhang, H.; Du, Y.; Jing, F. Study on the Key Autotoxic Substances of Alfalfa and Their Effects. Plants 2023, 12, 3263. [Google Scholar] [CrossRef] [Scilit]
  45. Zhou, Y.; Liu, Y.; Jiang, C.; El-Desouki, Z.; Riaz, M.; Wang, C.; Zhang, X.; Ding, J.; Chen, Z.; Liu, H.; et al. Effects of Exogenous Application of Phenolic Acid on Soil Nutrient Availability, Enzyme Activities, and Microbial Communities. Agriculture 2025, 15, 1067. [Google Scholar] [CrossRef] [Scilit]
  46. Kanjana, N.; Li, Y.; Shen, Z.; Mao, J.; Zhang, L. Effect of phenolics on soil microbe distribution, plant growth, and gall formation. Sci. Total Environ. 2024, 924, 171329. [Google Scholar] [CrossRef] [Scilit]
  47. Aliotta, G.; Cafiero, G.; Fiorentino, A.; Strumia, S. Inhibition of radish germination and root growth by coumarin and phenylpropanoids. J. Chem. Ecol. 1993, 19, 175–183. [Google Scholar] [CrossRef] [Scilit]
  48. Lu, C.; Qian, G.; Luo, L.; Peng, Y.; Ren, H.; Yan, B.; Xu, Y. Elucidation of Mechanism of Soil Degradation Caused by Continuous Cropping of Dictyophora rubrovalvata Using Metagenomic and Metabolomic Technologies. Microorganisms 2025, 13, 2186. [Google Scholar] [CrossRef] [Scilit]
Figure 1. Soil enzyme activities under continuous cropping of Chinese chive. (A) Catalase (CAT); (B) Alkaline phosphatase (AKP); (C) Urease (UE); (D) Sucrase (SC). Values are presented as means ± SD (n = 3). Different lowercase letters above the bars indicate significant differences among treatments (one-way ANOVA, Duncan’s test, p < 0.05).
Horticulturae 12 01070 g001
Figure 2. Principal Coordinate (A) PCoA of bacterial communities under different continuous cropping treatments; (B) PCoA of fungal communities under different continuous cropping treatments. Dots of different colors represent samples from distinct groups; closer proximity between points indicates a higher similarity in species composition.
Horticulturae 12 01070 g002
Figure 3. Composition of soil microbial communities under different continuous cropping treatments. (A,B) Venn diagrams for bacteria and fungi. (C,D) Relative abundance of bacteria at the phylum and genus levels. (E,F) Relative abundance of fungi at the phylum and genus levels.
Horticulturae 12 01070 g003
Figure 4. Differential species analysis of soil microbial communities under different continuous cropping treatments. (A) Bacterial communities. (B) Fungal communities.
Horticulturae 12 01070 g004
Figure 5. Composition of rhizosphere metabolites under different continuous cropping treatments. (A) Principal Component Analysis (PCA) of rhizosphere metabolites. (B) Number of up-regulated and down-regulated differentially expressed metabolites (DEMs). (C) Classification of all identified metabolites at the class level based on the Human Metabolome Database (HMDB). The class percentages in panel C are calculated based on the 777 metabolites with HMDB Class-level annotations (out of 1175 total identified metabolites). The remaining 398 metabolites lacked HMDB Class-level classification and were excluded from this analysis. (D) Orthogonal Partial Least Squares-Discriminant Analysis (OPLS-DA) score plots of rhizosphere metabolites between the control and treatment groups. Model parameters include R2X, R2Y, and Q2Y, where R2X and R2Y represent the cumulative explanatory power of the OPLS-DA model for the X and Y matrices, respectively, and Q2Y evaluates the predictive capability of the model. Values closer to 1 indicate higher stability and reliability of the model. (E) Volcano plot of differential metabolites, where red, blue, and gray dots represent up-regulated, down-regulated, and non-significant metabolites, respectively.
Horticulturae 12 01070 g005
Figure 6. KEGG enrichment analysis of differential metabolites. (A,B) Differential metabolic pathways and KEGG enrichment analysis for CC1 vs. CC2. (C,D) CC1 vs. CC3. (E,F) CC1 vs. CC4. (G,H) CC1 vs. CC5. In the bar charts (A,C,E,G), the horizontal axis represents the KEGG secondary classification, the vertical axis denotes the number of metabolites annotated to each pathway, and different colors indicate different metabolic categories. In the bubble plots (B,D,F,H), the horizontal axis represents the enrichment factor, and the vertical axis represents the KEGG pathways. The size of the bubbles reflects the number of metabolites enriched in the corresponding pathway, while the color indicates the significance of enrichment (p-value).
Horticulturae 12 01070 g006
Figure 7. Clustering heatmaps of differential metabolites enriched in critical pathways. (A) CC1 vs. CC2. (B) CC1 vs. CC3. (C) CC1 vs. CC4. (D) CC1 vs. CC5.
Horticulturae 12 01070 g007
Figure 8. Correlation between the relative abundance of the top 10 (A) bacteria and (B) fungi, key differential species, and differentially expressed metabolites within metabolic pathways. Green dots represent microorganisms, and red dots represent metabolites. Green and red lines denote positive and negative correlations, respectively. The size of each dot represents the absolute value of the Spearman correlation coefficient.
Horticulturae 12 01070 g008
Table 1. Soil physicochemical properties under continuous cropping of Chinese chive.
TreatmentpHEC (μs/cm)SOM (g/kg)TN (g/kg)AN (mg/kg)AP (mg/kg)AK (mg/kg)
CC18.31 ± 0.05 a92.68 ± 4.75 b24.32 ± 1.38 a0.20 ± 0.076.38 ± 1.80 a34.57 ± 7.9828.70 ± 8.05 c
CC28.28 ± 0.02 ab105.84 ± 10.99 b21.92 ± 1.65 ab0.17 ± 0.015.26 ± 1.02 a31.22 ± 4.3570.70 ± 18.75 b
CC38.25 ± 0.06 b111.88 ± 6.37 b21.20 ± 4.23 ab0.14 ± 0.065.01 ± 0.60 ab32.62 ± 5.0798.90 ± 13.71 a
CC48.20 ± 0.03 c122.06 ± 20.63 b19.96 ± 1.63 b0.14 ± 0.023.53 ± 1.37 b35.14 ± 20.5165.13 ± 5.36 b
CC58.16 ± 0.04 c174.16 ± 56.22 a12.99 ± 4.28 c0.14 ± 0.051.57 ± 0.73 c33.03 ± 9.0958.17 ± 16.48 b
F-value********ns***ns***
Soil organic matter (SOM), total nitrogen (TN), alkaline nitrogen (AN), available phosphorus (AP), and available potassium (AK). Values are presented as means ± SD (n = 3). Within each column, means followed by the same letter are not significantly different at the 5% probability level according to Duncan’s multiple range test. Letters are only presented for variables with significant overall F-tests (p < 0.05). Significance levels for one-way ANOVA are indicated as: ** p < 0.01, *** p < 0.001, and ns, not significant (p ≥ 0.05).
Table 2. Soil bacterial and fungal alpha diversity under continuous cropping of Chinese chive.
MicroorganismsTreatmentSobsACEChao1ShannonSimpsonCoverage
BacteriaCC11512 ± 25 a1515.15 ± 25.05 a1516.34 ± 24.60 a6.82 ± 0.02 0.0018 ± 0.00010.9994
CC21384 ± 33 ab1401.52 ± 27.65 ab1386.42 ± 32.82 ab6.67 ± 0.07 0.0023 ± 0.00000.9997
CC31311 ± 126 b1323.05 ± 106.41 b1312.04 ± 127.44 b6.62 ± 0.17 0.0027 ± 0.00100.9997
CC41283 ± 47 b1284.37 ± 47.19 b1284.02 ± 47.30 b6.51 ± 0.14 0.0033 ± 0.00150.9997
CC51340 ± 90 b1342.62 ± 90.83 b1342.33 ± 91.07 b6.62 ±0.08 0.0024 ± 0.00040.9996
F-value***nsnsns
FungiCC1317 ± 62 316.92 ± 62.09 316.85 ± 62.17 3.49 ± 0.740.1240 ± 0.07451.0000
CC2258 ± 19 258.39 ± 27.65 258.25 ± 18.53 3.50 ± 0.780.0784 ± 0.04861.0000
CC3356 ± 54.17 356.71 ± 53.80 356.59 ± 53.81 3.96 ± 0.480.0544 ± 0.02521.0000
CC4268 ± 9 268.50 ± 8.01 268.15 ± 8.94 3.44 ± 0.400.0875 ± 0.04200.9999
CC5317 ± 54 317.81 ± 54.69 317.65 ± 54.53 3.56 ± 0.520.0904 ± 0.06650.9999
F-valuensnsnsnsnsns
Values are presented as means ± SD (n = 3). Within each column, means followed by the same letter are not significantly different at the 5% probability level according to Duncan’s multiple range test. Letters are only presented for variables with significant overall F-tests (p < 0.05). Significance levels for one-way ANOVA are indicated as: * p < 0.05 and ns, not significant (p ≥ 0.05).
Disclaimer/Publisher’s Note: The statements, opinions and data contained in all publications are solely those of the individual author(s) and contributor(s) and not of MDPI and/or the editor(s). MDPI and/or the editor(s) disclaim responsibility for any injury to people or property resulting from any ideas, methods, instructions or products referred to in the content.