1. Introduction
Spinach (
Spinacia oleracea L.) belongs to the genus Spinacia within the subfamily Amarantoideae of the family Amaranthaceae. It is an annual or biennial herbaceous plant whose primary edible organ is its green leaves [
1]. Currently, spinach is cultivated in more than 60 countries, with the global planting area showing an annual upward trend. According to the Food and Agriculture Organization of the United Nations, more than 735 thousand ha of spinach were planted worldwide in 2023 [
2]. During the vegetative growth stage of spinach, leaves cluster on the shortened stem. Most leaves are round, elliptic or round-pointed, while a few are halberd-shaped or with several serrated lobes. The leaf color is mostly dark green or green, and a few are red. In the reproductive growth stage, most leaves are halberd-shaped or triangular-ovate and grow on the flower stem [
3,
4]. The leaf traits of spinach are important traits that affect the marketability of spinach, and are also important traits that are concerned with germplasm innovation and new variety breeding of spinach.
Leaf traits are quantitative traits and susceptible to environmental influences, which constitutes one major challenge in basic and applied research on spinach. Exploring the genetic patterns governing spinach leaf traits via genetic model analysis is of great significance for spinach germplasm innovation and new variety breeding. The analytical procedure for major gene–polygene mixed genetic model identification of quantitative traits based on backcross populations can effectively detect major genes and polygenes underlying plant quantitative traits [
5,
6]. This model has been applied to Lagerstroemia indica, rape, corn, tomato, eggplant, chrysanthemum [
7,
8,
9,
10,
11,
12], and other plant species. Liu et al. identified 13 QTLs associated with spinach leaf traits using SLAF-seq and KASP genotyping, and nominated
Spo10792,
Spo21018 and
Spo21019 as candidate genes regulating leaf width [
13]. Using GBS-derived SNPs, Ma et al. determined five SNP markers associated with leaf surface texture, 14 markers linked to petiole color, and seven markers correlated with leaf margin traits in spinach [
14]. Liu et al. detected a significant correlation between root architecture and leaf traits in spinach, and revealed that genotypes with halberd-shaped leaves tended to develop larger root systems than those with nearly round leaves [
15]. Cai et al. mapped five QTLs for leaf color via GBS-based genetic mapping, with
ORF11,
ORF12 and
ORF17 proposed as candidate genes controlling spinach leaf pigmentation [
16].
The polar localization (asymmetric distribution) of
PIN proteins in plants is highly correlated with the auxin transport direction.
PIN proteins are considered the primary transporters mediating the asymmetric distribution of auxin. The function of
PIN proteins is regulated at multiple levels, including transcriptional regulation, subcellular trafficking, and post-translational modification [
17].
PIN proteins are modulated by various phytohormones and environmental stimuli, including cytokinin, gibberellin, and abscisic acid. The distribution of auxin is regulated by the distribution of
PIN proteins, which further governs plant growth and development [
18]. Eight
PIN family members designated
PIN1–
PIN8 have been identified in Arabidopsis thaliana.
PIN1 is broadly expressed in multiple organs, localized in the stele and inner cortex of root tips as well as shoot apical meristems; it participates in gravitropism, embryogenesis, vascular differentiation and leaf primordia initiation [
19].
PIN2 is mainly specifically expressed in the meristem and elongation zone of root tips as well as root caps of lateral roots. Its core function is to mediate basipetal auxin transport in root meristems and elongation zones. Loss-of-function mutants exhibit obvious phenotypes including shortened root length and impaired root gravitropic response. Overexpression of
PIN2 can markedly enhance auxin transport from shoots to roots, and it is a key member in the regulation of root gravity [
20].
PIN3 is highly expressed in vascular tissue and root caps. Upon gravity stimulation,
PIN3 undergoes polar redistribution to mediate root gravitropism; it is also involved in lateral root formation, phototropism and shade avoidance responses [
21,
22].
PIN4 is abundantly expressed in the quiescent center of root tips, regulating radicle formation and apical meristem development and participating in phototropic responses [
23].
PIN5 localizes to the endoplasmic reticulum and maintains auxin homeostasis between the cytoplasm and endoplasmic reticulum, contributing to embryogenesis, root elongation and lateral root formation, etc. [
24].
PIN6 is localized at both the endoplasmic reticulum and plasma membrane, and functions in lateral root development and nectar secretion [
25,
26].
PIN7 accumulates in apical columella cells and participates in root gravitropism and embryonic polarity establishment [
27].
PIN8 is localized to the endoplasmic reticulum, antagonizes PIN5 activity, takes part in pollen development, and may modulate the later stages of lateral root initiation [
28].
Gene clusters are groups of genes that are physically closely adjacent, functionally related or homologous on chromosomes. Their key features are that they generally participate in the same metabolic pathway or biological process, and jointly regulate secondary metabolite synthesis, plant growth and development, as well as stress defense responses, ensuring the integrity and coordination of biological functions [
29,
30]. Genes within a gene cluster contain conserved cis-acting elements and regulatory patterns, and exhibit synergistic expression upon induction by specific developmental stages or environmental conditions [
31]. The compact linkage distribution and common regulation mode of gene clusters can ensure the integrity of the biological genetic recombination process, and improve the signal transduction and metabolic efficiency of organisms, which is of great significance for organisms to adapt to the complex living environment. The “
FAR1-ULP-zf-GRF” gene cluster is a local gene cluster formed by physically close neighbors of three functional related genes, FAR1, ULP, and zf-GRF, on the chromosome in the plant genome. It is common in Arabidopsis thaliana, rice, and corn, and belongs to the functional coordination type gene cluster [
32,
33,
34].
FAR1 and its homolog
FHY3 are key components of the phytochrome A-mediated far-red light signaling pathway [
35,
36]. Members of the
FAR1 family (
FRS family) exert specific functions in multiple growth and developmental processes, including the regulation of flowering time, maintenance of meristem activity, and regulation of carbon metabolism during vegetative growth such as hypocotyl elongation. Their transposase-derived structural characteristics are closely associated with functional differentiation of this gene family [
37].
ULP-mediated
SUMO modification can also indirectly regulate the growth rate of plant vegetative organs by modulating the activity of growth-related transcription factors, serving as an indispensable regulatory link during plant organ development [
38]. GRF proteins contain highly conserved domains, which have been identified in Arabidopsis thaliana, Zanthoxylum bungeanum, corn, wheat, and rice. In Arabidopsis thaliana,
GRF/zf-GRF proteins interact with
ZF-HD transcription factors;
GRF3 directly activates the expression of
HB33 to regulate leaf size, cell proliferation, and leaf senescence [
39].
In this study, spinach inbred lines P1 and P2 were used as parents to develop a six-generation segregating population. Genetic analysis of leaf length, leaf width and petiole length in spinach was performed via the mixed major gene plus polygene inheritance model. Whole-genome resequencing was conducted on the two parents and 152 F2 individuals for QTL mapping of leaf-related traits, followed by screening of underlying candidate genes. The QTL identification for leaf length, leaf width and petiole length is expected to develop tightly linked molecular markers for marker-assisted breeding and germplasm innovation in spinach.
3. Results
3.1. Leaf Phenotypic Characteristics of P1, P2, F1 and F2 Populations
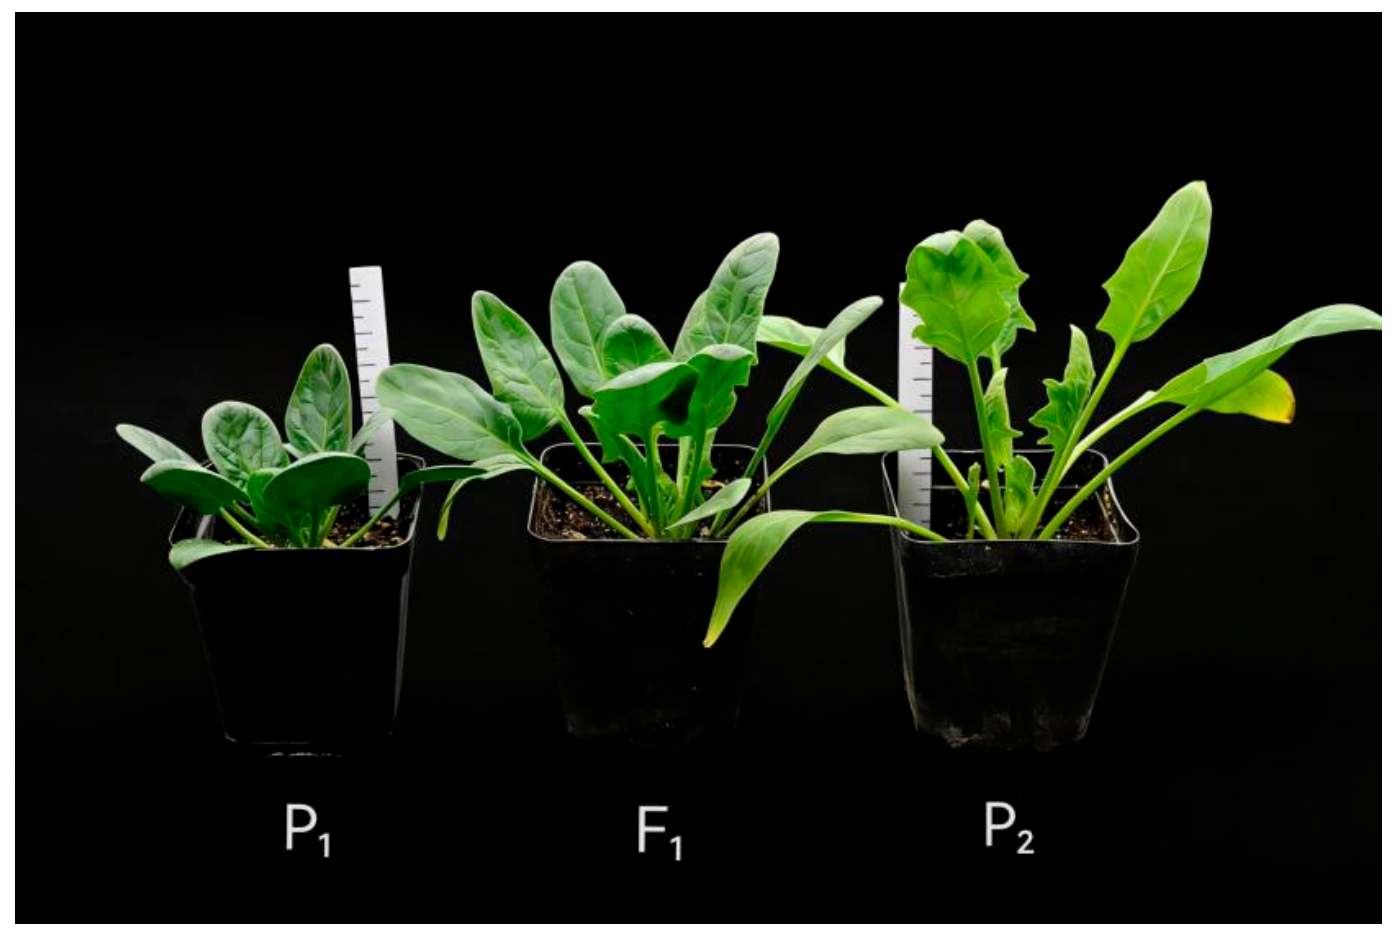
Phenotypes of both parents and the F
1 generation are presented in
Figure 1. Under the three cultivation modes, the average leaf length of parent P
1 ranged from 4.12 to 5.58 cm, the average leaf width ranged from 3.16 to 4.78 cm, and the average petiole length ranged from 0.98 to 2.23 cm. For parent P
2, the average leaf length ranged from 9.64 to 9.83 cm, the average leaf width ranged from 5.33 to 6.28 cm, and the average petiole length ranged from 4.68 to 7.35 cm. For the F
1 generation, the average leaf length ranged from 7.00 to 10.60 cm, the average leaf width ranged from 4.80 to 6.04 cm, and the average petiole length ranged from 2.58 to 7.08 cm. Petiole lengths of F
1 plants showed significant differences among the three cultivation modes. Detailed data are listed in
Table 2.
Under the three cultivation modes, the average leaf length of the F
2 population ranged from 7.23 to 8.85 cm, the average leaf width ranged from 4.43 to 5.83 cm, and the average petiole length ranged from 4.27 to 5.10 cm. Among all treatments, spinach grown in outdoor nutrition bowls exhibited the minimum standard deviation of leaf width at 0.71, and the maximum coefficient of variation for petiole length across the three cultivation regimes is listed in
Table 3. Leaf length, leaf width and petiole length of the F
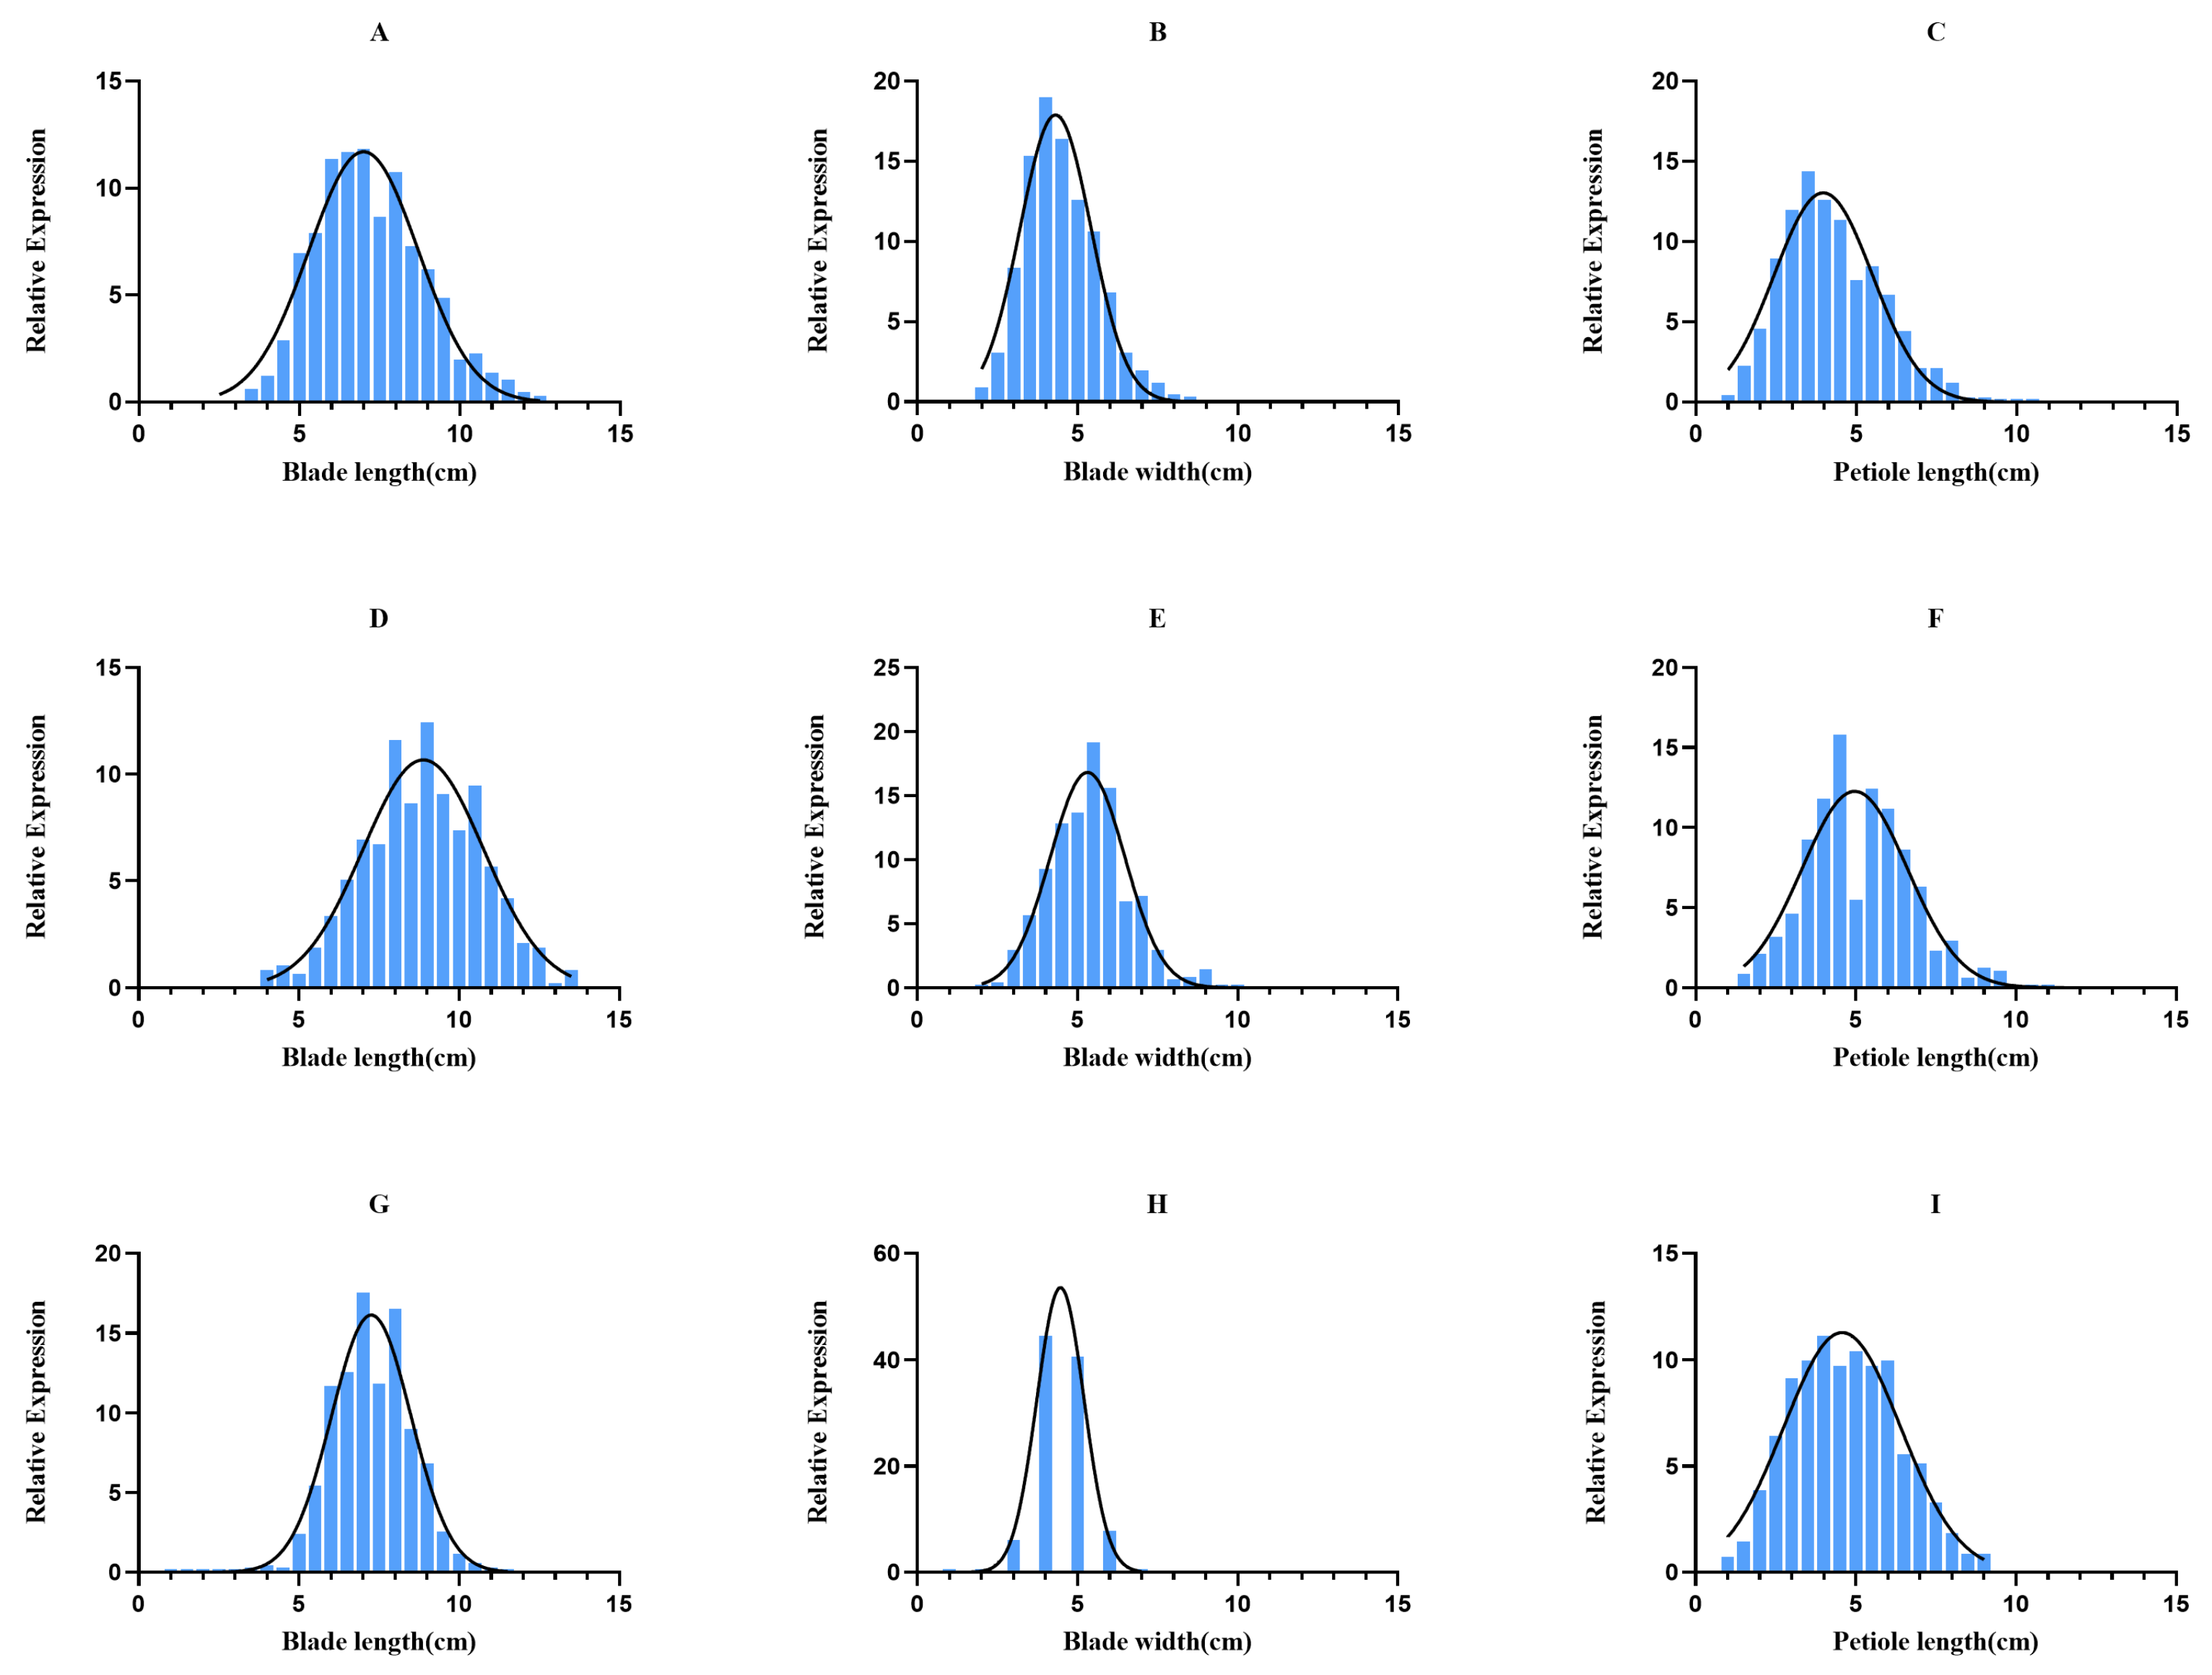
2 population showed continuous normal or approximately normal distributions. Skewness ranged from −0.83 to 0.51, and kurtosis ranged from −0.75 to 1.31. The absolute values of all skewness were less than 3, and all kurtosis values were higher than −3, conforming to a normal distribution. Detailed frequency distribution results are presented in
Figure 2.
3.2. Correlation Analysis of Leaf Type Traits
For spinach grown in the greenhouse, the correlation coefficient between leaf length and leaf width was the highest at 0.735, whereas the lowest value of 0.332 occurred between petiole length and leaf width. Under plastic shed cultivation, leaf length and leaf width had the maximum correlation coefficient of 0.759, and the minimum correlation coefficient of 0.537 was found between petiole length and leaf width. For plants cultivated in outdoor nutrition bowls, leaf length and petiole length showed the strongest correlation of 0.566, while the weakest correlation of 0.309 existed between petiole length and leaf width. Detailed results are shown in
Table 4.
3.3. Analysis of Genetic Model of Leaf Length
According to the principle of the minimum AIC (Akaike Information Criterion) value, three genetic models with low AIC values and minor differences were screened out from 24 genetic models as candidate models. The detailed results are shown in
Table 5. The candidate genetic models for leaf length of spinach grown in the greenhouse were MX1-AD-ADI, MX2-ADI-ADI and MX2-ADI-AD, with corresponding AIC values of 3426.019, 3431.390 and 3435.632. The candidate genetic models for leaf length of spinach grown in the plastic shed were MX1-AD-ADI, PG-ADI and MX2-ADI-ADI, with AIC values of 2208.610, 2216.300 and 2218.521. The candidate genetic models for leaf length of spinach cultivated in outdoor nutrition bowls were MX2-A-AD, PG-ADI, and MX1-AD-ADI, and their AIC values were 2729.798, 2733.780, and 2737.780, respectively.
MX1-AD-ADI was the shared genetic segregation model with the minimum AIC value among the three candidate genetic segregation models under all three cultivation modes. Two identical candidate genetic segregation models existed for leaf length between spinach grown in the greenhouse and that grown in the plastic shed: the MX1-AD-ADI model and the MX2-ADI-ADI model. Meanwhile, two shared candidate genetic segregation models for leaf length were detected between spinach cultivated in the plastic shed and those grown in outdoor nutrition bowls: the MX1-AD-ADI model and the PG-ADI model.
The candidate genetic segregation models were subjected to goodness-of-fit tests. For spinach cultivated in the greenhouse, none of the three candidate genetic segregation models for leaf length showed statistical significance; thus, MX1-AD-ADI was determined as the optimal genetic segregation model for leaf length under greenhouse cultivation. For spinach grown in the plastic shed, all three candidate genetic segregation models for leaf length failed to reach statistical significance, and MX1-AD-ADI was identified as the optimal model for leaf length in this cultivation pattern. For spinach cultivated in outdoor nutrition bowls, two statistical parameters of the MX2-A-AD model reached significance, meaning this model was not eligible as the final optimal genetic segregation model. Neither the PG-ADI model nor the MX1-AD-ADI model exhibited statistically significant test parameters. The AIC values of the PG-ADI and MX1-AD-ADI models differed by 4.00. Considering that MX1-AD-ADI was the shared genetic segregation model across all three cultivation patterns, MX1-AD-ADI was ultimately selected as the optimal genetic segregation model for leaf length in the outdoor nutrition bowl treatment, as detailed in
Table S1.
In summary, the optimal genetic segregation model controlling leaf length in spinach was MX1-AD-ADI, corresponding to a mixed inheritance model of an additive-dominant major gene plus additive-dominant-epistatic polygenes.
The first-order and second-order genetic parameters corresponding to the optimal candidate genetic segregation model under different cultivation patterns were analyzed (
Table S4).
Among the first-order genetic parameters, the population mean value for leaf length of spinach cultivated in the greenhouse was 6.7699; the additive effect of the first major gene was −1.1899, and the dominant effect of the first major gene was −1.5968, revealing that dominance played a leading role. For spinach grown in the plastic shed, the population mean value of leaf length was 5.8166, the additive effect of the first pair of major genes was −0.6166, and the dominant effect of the first pair of major genes was 1.7883, indicating a dominant-effect predominance. For spinach cultivated in outdoor nutrition bowls, the population mean value of leaf length was 4.2144, and the additive effect of the first pair of major genes was −0.0944; the dominant effect of the first major gene was 0.0083, which suggested that additive genetic effects were predominant.
Second-order genetic parameter results showed that major gene heritability for leaf length in BC1, BC2 and F2 under greenhouse cultivation was 2.96%, 43.89% and 45.17%, respectively, while polygene heritability for BC1, BC2 and F2 was 80.40%, 49.38% and 43.05%, respectively. This indicated that polygenes contributed the largest genetic effect in the BC1 generation, and the genetic effects of major genes and polygenes were comparable in BC2 and F2 generations.
For spinach cultivated in the plastic shed, major gene heritability for leaf length in BC1, BC2 and F2 was 74.29%, 23.25% and 30.48%, respectively, and polygene heritability for the three generations was 15.13%, 63.79% and 63.66%, respectively. Major genes exerted the strongest genetic effect in the BC1 generation, whereas polygenes dominated genetic variation in BC2 and F2 generations.
Under outdoor nutrition bowl cultivation, major gene heritability for leaf length in BC1, BC2 and F2 was 1.74%, 1.68% and 0.45%, respectively, and polygene heritability was 76.21%, 71.66% and 79.69%, respectively, demonstrating that polygenes contributed the primary genetic effect across BC1, BC2 and F2 generations.
3.4. Genetic Model Analysis of Leaf Width
According to the principle of the minimum AIC value, three genetic models with small AIC values and minor differences were screened from 24 genetic models as candidate models, as shown in
Table 6. The candidate genetic segregation models for leaf width of spinach grown in the greenhouse were MX2-ADI-ADI, MX1-AD-ADI and MX2-ADI-AD, respectively, with AIC values of 2763.743, 2772.203 and 2775.383, respectively. The candidate genetic segregation models for leaf width of spinach grown in the plastic shed were 2MG-ADI, MX2-ADI-ADI, and MX1-AD-ADI, respectively, with AIC values of 1808.736, 1810.166, and 1813.526, respectively. The candidate genetic segregation models for leaf width of spinach grown in outdoor nutrition bowls were MX2-A-AD, PG-ADI, and MX1-AD-ADI, respectively, with AIC values of 1863.962, 1864.805, and 1868.806, respectively.
MX1-AD-ADI was the shared genetic segregation model with the lowest AIC value among the three candidate genetic segregation models across all three cultivation modes. Two shared candidate genetic segregation models for leaf width were identified between spinach cultivated in the greenhouse and that grown in the plastic shed: MX1-AD-ADI and MX2-ADI-ADI.
Then goodness-of-fit tests were performed on the candidate models. For spinach cultivated in the greenhouse, none of the three candidate genetic segregation models for leaf width reached statistical significance. The AIC values of the MX1-AD-ADI and MX2-ADI-ADI models differed by 8.640. Since MX1-AD-ADI was the shared genetic segregation model across the three cultivation modes, MX1-AD-ADI was selected as the optimal candidate genetic segregation model for leaf width under greenhouse cultivation. For spinach grown in the plastic shed, the three candidate genetic segregation models for leaf width also failed to reach statistical significance. The AIC difference between the MX1-AD-ADI model and the 2MG-ADI model was 4.790. Given that MX1-AD-ADI was the common model for all three cultivation modes, MX1-AD-ADI was determined as the optimal candidate genetic segregation model for leaf width in the plastic shed. One out of the three candidate genetic segregation models for leaf width of spinach cultivated in outdoor nutrition bowls reached statistical significance, and the AIC values of MX1-AD-ADI and MX2-A-AD differed by 4.844. Considering MX1-AD-ADI was shared among all three cultivation patterns, MX1-AD-ADI was identified as the optimal candidate genetic segregation model for leaf width of spinach grown in outdoor nutrition bowls, as listed in
Table S2.
In summary, the optimal candidate genetic segregation model governing leaf width was MX1-AD-ADI, which corresponds to a mixed inheritance model of an additive-dominant major gene plus additive-dominant-epistatic polygenes.
The first- and second-order genetic parameters of the optimal candidate genetic segregation models across various cultivation regimes were analyzed (
Table S4).
Among the first-order genetic parameters, the population mean value of leaf width for spinach cultivated in the greenhouse was 5.6422. The additive effect of the first major gene was −0.8622, and the dominant effect of the first major gene was −0.9179, revealing that genetic variation was mainly controlled by dominant effects. The population mean value of leaf width for spinach grown in the plastic shed was 4.2775. The additive effect of the first pair of major genes was −0.7175, and the dominant effect of the first major gene was −0.7523, indicating a predominance of dominant genetic effects. The population mean value of leaf width for spinach grown in outdoor nutrition bowls was 3.1972. The additive effect of the first major gene was −0.0372, and the dominant effect of the first major gene was 0.0017, demonstrating that additive effects dominated genetic variation.
Second-order genetic parameter results showed that major gene heritability for leaf width in BC1, BC2 and F2 of spinach under greenhouse cultivation was 1.01%, 29.44% and 42.87%, respectively, while polygene heritability for BC1, BC2 and F2 was 86.06%, 64.95% and 43.15%, respectively. This suggested that polygenes contributed the largest genetic effect across BC1, BC2 and F2 generations.
For spinach cultivated in the plastic shed, major gene heritability for leaf width in BC1, BC2 and F2 was 2.62%, 40.36% and 24.68%, respectively, and polygene heritability for the three generations was 74.75%, 51.48% and 67.35%, respectively, indicating that polygenes exerted the primary genetic effect in BC1, BC2 and F2 generations.
Under outdoor nutrition bowl cultivation, major gene heritability for leaf width in BC1, BC2 and F2 was 1.65%, 1.55% and 0.31%, respectively, and polygene heritability was 66.86%, 81.29% and 70.57%, respectively, which illustrated that polygenes contributed the predominant genetic effect in BC1, BC2 and F2 generations.
3.5. Genetic Model Analysis of Petiole Length
According to the principle of the minimum AIC value, three genetic models with small AIC values and minor differences were screened from 24 genetic models as candidate models, as shown in
Table 7. The candidate genetic segregation models for petiole length of spinach grown in the greenhouse were MX1-AD-ADI, MX2-ADI-AD and 2MG-AD, respectively, with AIC values of 3173.305, 3173.460 and 3173.480, respectively. The candidate genetic segregation models for petiole length of spinach grown in the plastic shed were MX2-A-AD, MX2-ADI-AD, and PG-ADI, respectively, with AIC values of 2082.589, 2087.501, and 2097.831, respectively. The candidate genetic segregation models for petiole length of spinach grown in outdoor nutrition bowls were MX2-ADI-ADI, MX2-ADI-AD and 2MG-ADI, respectively, with AIC values of 3105.550, 3107.860 and 3116.587, respectively.
MX1-AD-ADI was the shared genetic segregation model with the lowest AIC value among the three candidate genetic segregation models across all three cultivation modes.
Then goodness-of-fit tests were performed on the candidate models. Under greenhouse cultivation, none of the three candidate genetic segregation models for spinach petiole length reached statistical significance, and the AIC values of the MX2-ADI-AD and MX1-AD-ADI models differed by 0.155. Since MX2-ADI-AD was the shared genetic segregation model across the three cultivation modes, MX2-ADI-AD was identified as the optimal candidate genetic segregation model for petiole length under greenhouse cultivation.
For plastic shed cultivation, one statistical parameter of both the MX2-A-AD model and the PG-ADI model reached significance, so neither could be selected as the final candidate genetic segregation model; meanwhile, the MX2-ADI-AD model failed to reach statistical significance. Consequently, MX2-ADI-AD was determined as the optimal candidate genetic segregation model for petiole length in plastic shed cultivation.
For spinach cultivated in outdoor nutrition bowls, neither the MX2-ADI-AD model nor the MX2-ADI-ADI model for petiole length reached statistical significance. Four statistical parameters of the 2MG-ADI model reached significance, meaning this model was ineligible to serve as the final candidate genetic segregation model, and the AIC values between the MX2-ADI-AD and MX2-ADI-ADI models differed by 2.310. Given that MX2-ADI-AD was the common genetic segregation model for all three cultivation modes, MX2-ADI-AD was selected as the optimal candidate genetic segregation model for petiole length under outdoor nutrition bowl cultivation, as detailed in
Table S3.
In summary, the optimal candidate genetic segregation model controlling petiole length was MX2-ADI-AD, corresponding to a mixed inheritance model containing two pairs of additive-dominant-epistatic major genes plus additive-dominant polygenes.
The first-order and second-order genetic parameters corresponding to the optimal candidate genetic segregation model under different cultivation modes were analyzed (
Table S4).
Among the first-order genetic parameters, the population mean value of petiole length for spinach cultivated in the greenhouse was 3.4768. The additive effect values of the first and second major genes were both −0.9652; the dominant effect values of the first and second major genes were 0.9270 and 0.4664, respectively. The polygenic additive effect was −0.6904, and the polygenic dominant effect was 1.3475, revealing that genetic variation was predominantly controlled by dominant effects. The population mean value of petiole length for spinach cultivated in the plastic shed was 4.2743. The additive effect values of the first pair and second pair of major genes were both −1.1664; the dominant effect values of the first pair and second pair of major genes were −1.3557 and −0.4315, respectively. The polygenic additive effect was −0.0394, and the polygenic dominant effect was 2.1379, indicating a predominance of dominant genetic effects. The population mean value of petiole length for spinach grown in outdoor nutrition bowls was 5.3949, and the additive effect values of the first pair and the second pair of major genes were both 0.1179. The dominant effect values of the first pair and the second pair of major genes were −0.0539 and 0.3082, respectively; the polygenic additive effect was −2.3883, and the polygenic dominant effect was −0.9610, demonstrating that dominant effects dominated genetic variation.
Second-order genetic parameter results showed that major gene heritability for petiole length in BC1, BC2 and F2 of spinach under greenhouse cultivation was 37.35%, 61.45% and 66.30%, respectively, while polygene heritability for BC1, BC2 and F2 was 36.63%, 24.65% and 16.80%, respectively. This indicated that major genes contributed the largest genetic effect across BC1, BC2 and F2 generations.
For spinach cultivated in the plastic shed, major gene heritability for petiole length in BC1, BC2 and F2 was 70.12%, 74.71% and 61.81%, respectively, and polygene heritability for the three generations was 18.75%, 13.38% and 31.37%, respectively, showing that major genes exerted the predominant genetic effect in BC1, BC2 and F2 generations.
Under outdoor nutrition bowl cultivation, major gene heritability for petiole length in BC1, BC2 and F2 was 74.57%, 61.86% and 76.47%, respectively, and polygene heritability was 6.46%, 0.00% and 11.36%, respectively, which illustrated that major genes had the greatest genetic effect in BC1, BC2 and F2 generations.
3.6. Construction of High-Density Genetic Map of Spinach
The two parents and 152 F
2 individuals were subjected to whole-genome resequencing. The P
1 and P
2 samples generated 18.6 million and 22.72 million clean reads (counted separately for paired-end Read 1 and Read 2), corresponding to 27.19 Gb and 33.99 Gb of sequencing data, respectively. A total of 468.99 Gb of sequencing data was obtained from the 152 F
2 individuals, with an average Q30 value of 93.34% (
Table 8). The average mapping rate of clean reads for each F
2 individual reached 98.06% (
Table 9). The average sequencing depth for both parental lines exceeded 20×, with a genome coverage ratio (regions covered by at least 1× reads) higher than 90%. The average sequencing depth of F
2 samples was 3.45×, and their genome coverage ratio (≥1×) was greater than 78.12% (
Table 10).
SNP markers were developed, yielding a total of 1,382,243 SNPs that were assigned to six linkage groups. These SNPs were used to generate bin markers, and bin markers shorter than 5 kb were retained. Segregation distortion filtering was conducted to remove polymorphic markers with severe segregation distortion (Chi-square test p < 0.0001). After screening, 13,545 filtered bin markers were retained.
Using HighMap software (Beijing Biomarker Technology Co., Ltd. Beijing, China) [
43], we repeatedly eliminated redundant markers and sorted the remaining 13,545 bin markers. The software calculated optimal recombination frequencies between markers to optimize marker ordering, and 5900 valid bin markers were finally obtained for high-density genetic map construction.
These bin markers were classified into six linkage groups. HighMap analysis determined the linear order of markers within each linkage group and estimated genetic distances between adjacent markers; a genetic map with a total genetic length of 843.48 cM was ultimately constructed. The lengths of the six linkage groups ranged from 103.76 to 179.88 cM. The fourth linkage group contained the largest number of total bin markers at 1188, while the third linkage group had the fewest bin markers with a count of 544. The fourth linkage group had the longest total genetic distance of 179.88 cM, and the fifth linkage group had the shortest total genetic distance at 103.76 cM. The third linkage group exhibited the largest average marker interval of 0.25 cM, and the fifth linkage group showed the smallest average interval at 0.10 cM. The maximum gap on the first linkage group reached 7.09 cM, whereas the sixth linkage group had the smallest maximum gap, which was 1.64 cM. The proportion of intervals smaller than 5 cM across the six linkage groups ranged from 99.82% to 100.00%, as shown in
Table 11.
3.7. QTL Analysis of Leaf Type
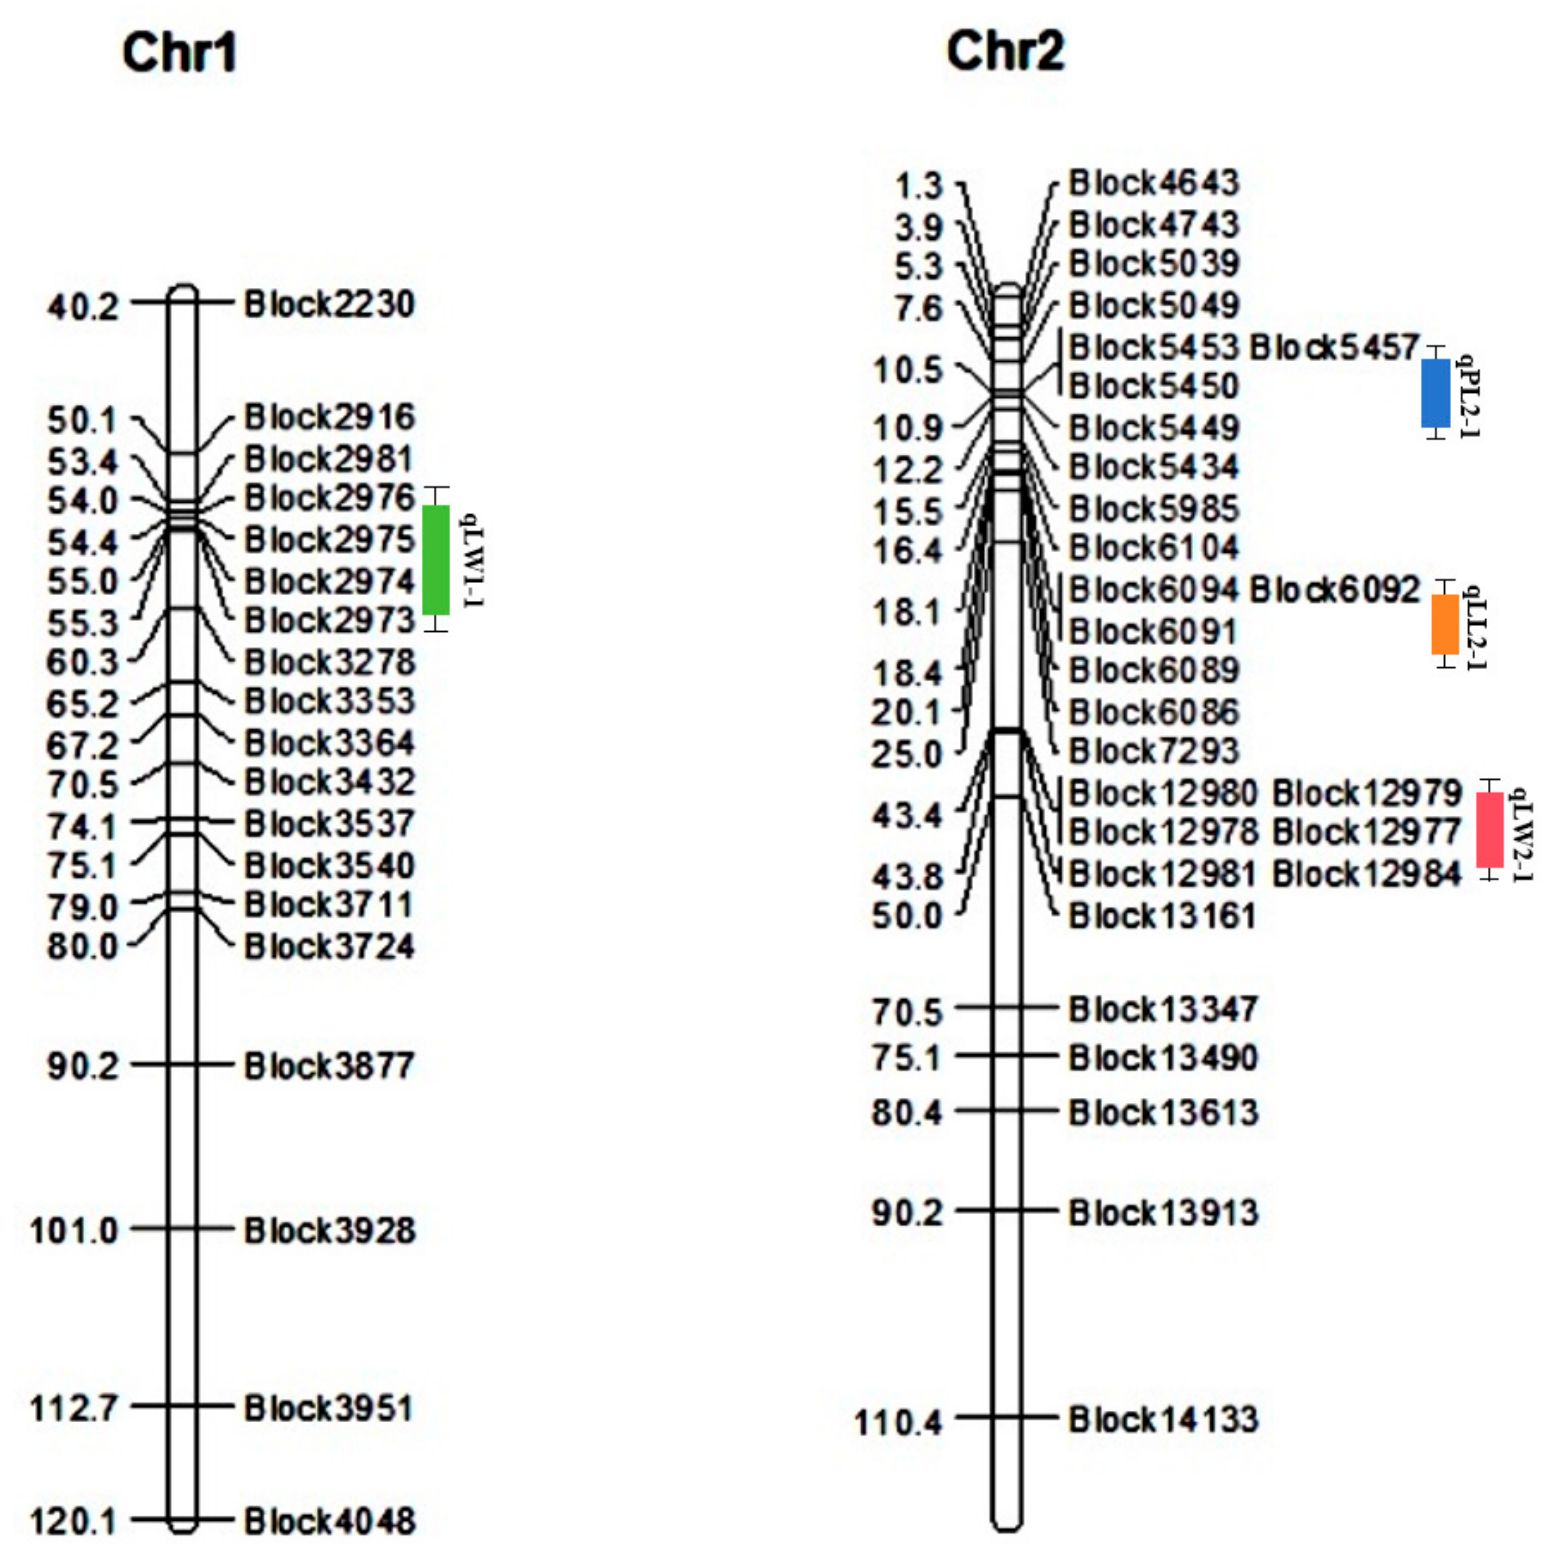
QTL mapping for leaf-related traits in the F
2 population was performed using MapChart 2.32 software. One QTL controlling leaf length, designated qLL2-1, was mapped onto chromosome 2. Two QTLs associated with leaf width, namely qLW1-1 and qLW2-1, were located on chromosome 1 and chromosome 2, respectively. One QTL for petiole length was detected on chromosome 2 and named qPL2-1, as illustrated in
Figure 3.
The candidate interval for the spinach leaf-length QTL qLL2-1 spanned between bin markers Block6089 and Block6094, with an LOD score of 6.767, an additive effect of −0.792, and a phenotypic variance explained (PVE) of 17.48%. The candidate intervals for leaf-width QTLs qLW1-1 and qLW2-1 were located between bin markers Block2973 and Block2976, and between bin markers Block12977 and Block12984, respectively. Their LOD values were both 3.000, additive effects were −0.229 and −0.257, and phenotypic variance-explained (PVE) values were 4.44% and 6.99%, respectively. The candidate interval for the spinach petiole-length QTL qPL2-1 was positioned between bin markers Block5449 and Block5457, with an LOD value of 6.588, an additive effect of −0.842, and a phenotypic variance-explained value of 17.26%, as shown in
Table 12.
3.8. Determination of Candidate Genes
3.8.1. Candidate Genes for Leaf Length and Leaf Width
No candidate genes were identified within the candidate interval for the leaf-length QTL qLL2-1 in spinach. The two leaf-width QTLs qLW1-1 and qLW2-1 contained two and 13 genes in their respective intervals, as summarized in
Table 13. These 15 genes were annotated against the spinach reference gene database. According to functional annotation data from the SpinachBase database,
SOV1g017270 primarily functioned in cell cycle regulation, chromosome stability and polyamine metabolism to maintain genomic stability.
SOV2g023070 functioned in single-stranded DNA binding, participating in DNA replication, repair and recombination to preserve genome stability.
SOV2g023120 catalyzed phenylalanine biosynthesis and was involved in the production of aromatic amino acids and secondary metabolites.
SOV2g023110 participated in abiotic stress responses and improved plant stress tolerance.
SOV2g023150 eliminated reactive oxygen species such as hydrogen peroxide, alleviated oxidative stress, and protected chloroplasts and cellular structures.
SOV2g023160 bound RNA and took part in RNA processing, stabilization and translational regulation.
SOV2g023060 encoded a protein with unknown function.
SOV2g023170 interacted with the small GTPase ROP to regulate cytoskeleton dynamics and signal transduction.
SOV2g023100 mediated retrotransposon transposition via reverse transcriptase and integrase, thereby affecting genomic structure and evolution. Based on their annotated functions, we speculated that these nine genes were unlikely to participate in spinach leaf development.
Combined with gene functional annotation, the remaining six genes potentially associated with leaf development, namely
SOV1g017280,
SOV2g023090,
SOV2g023140,
SOV2g023050,
SOV2g023130, and
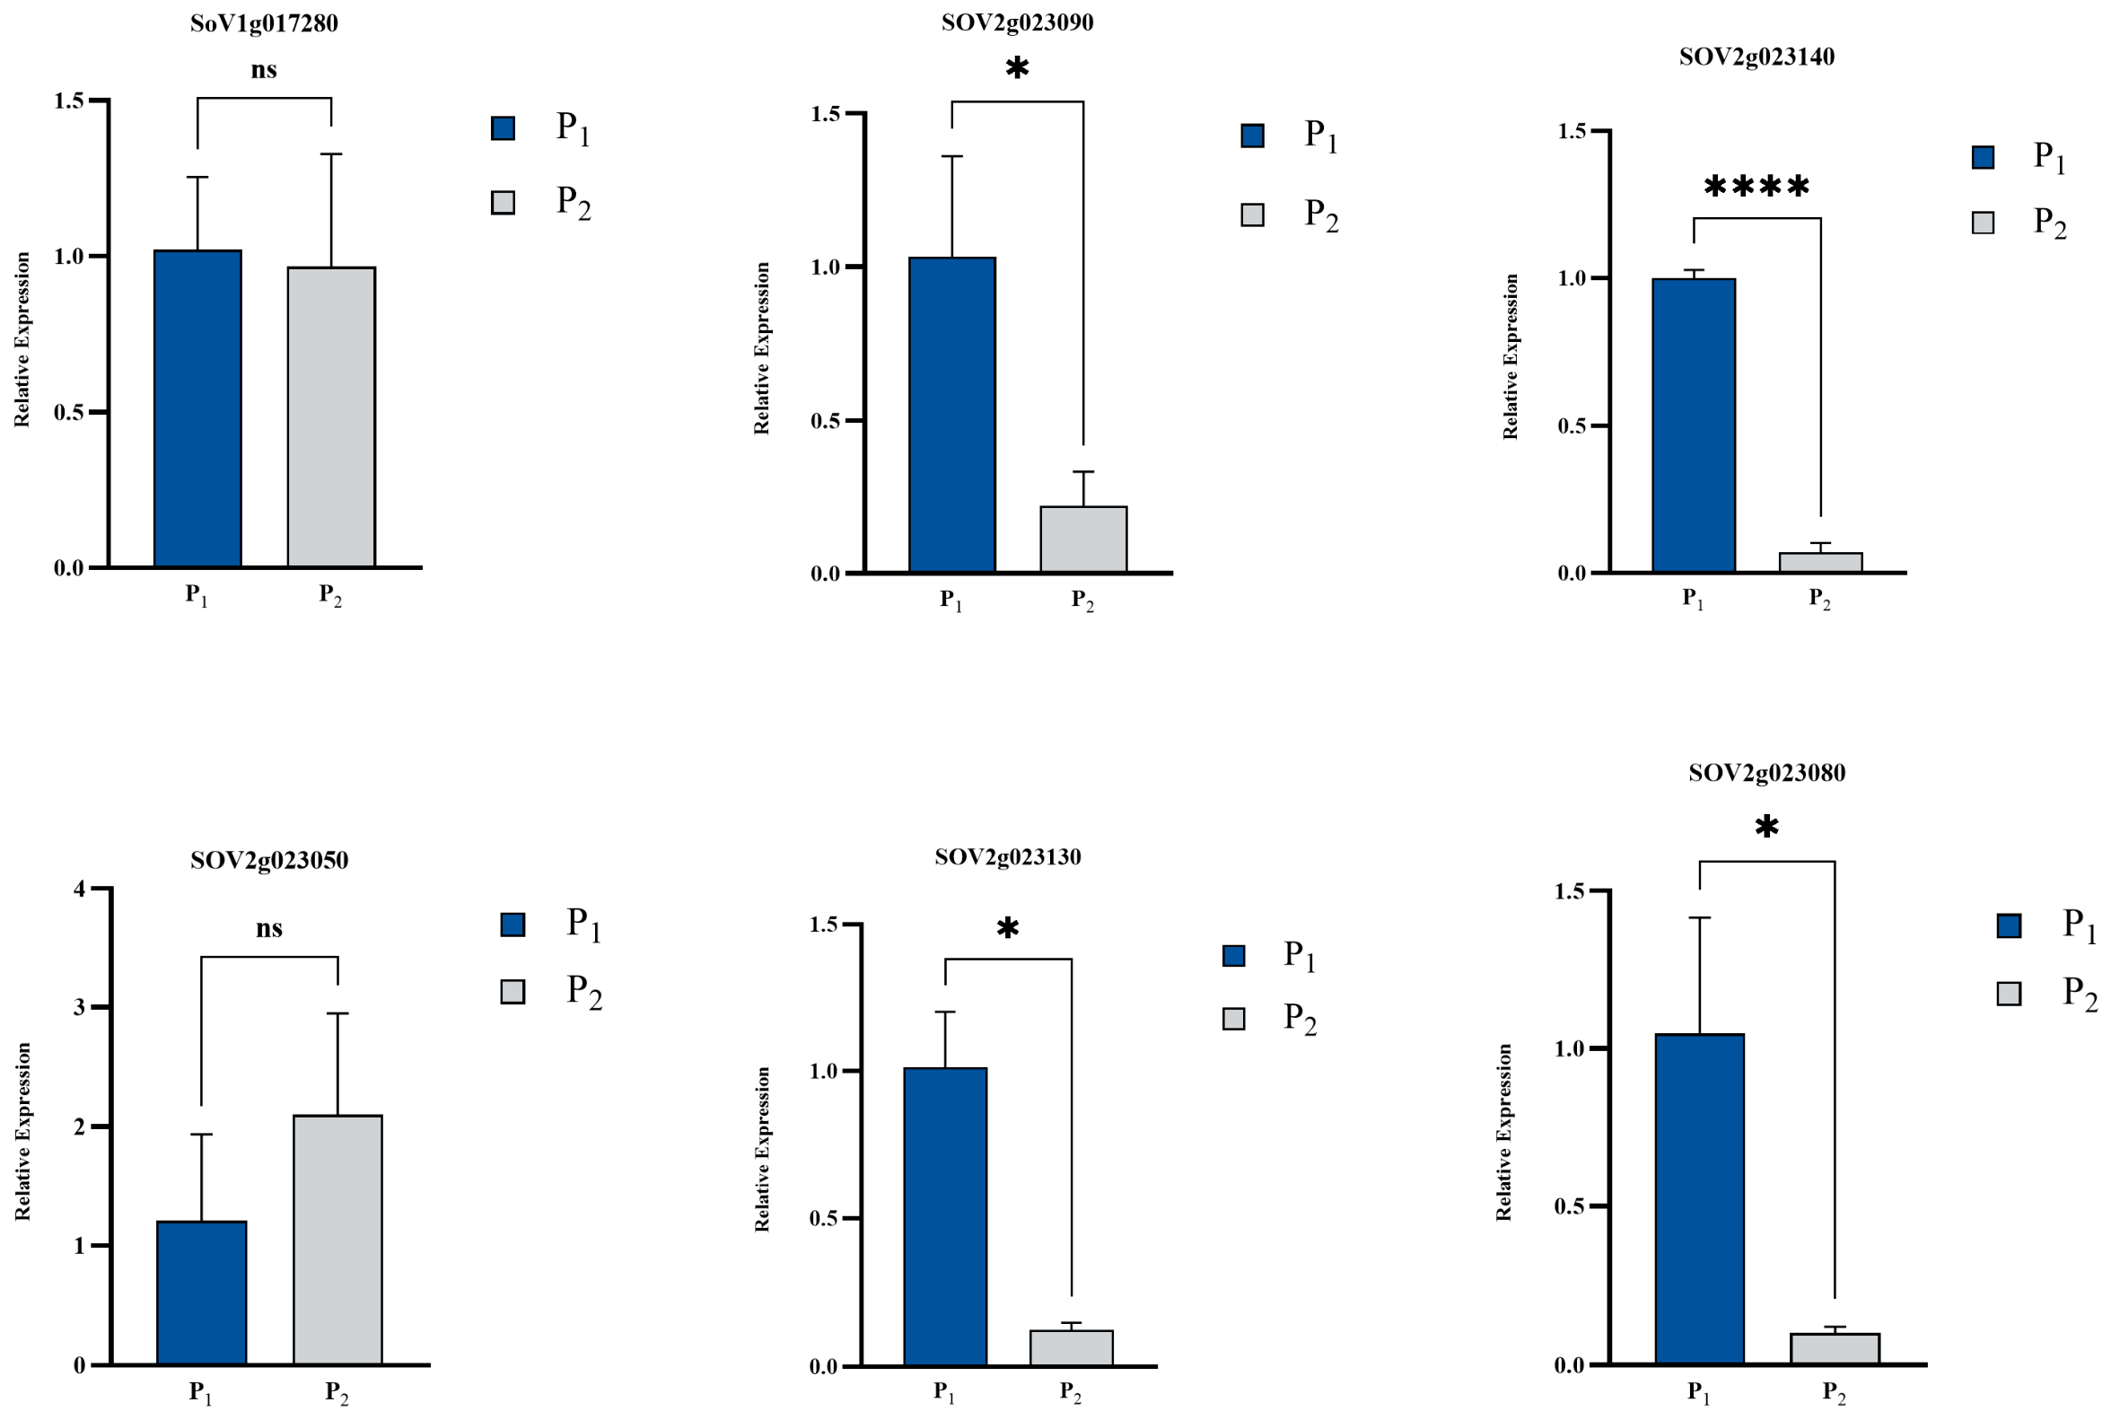
SOV2g023080, were regarded as candidate genes regulating spinach leaf width. The expression patterns of these six genes were quantified in the two parental lines P
1 and P
2. The results showed that the transcript abundance of
SOV1g017280 and
SOV2g023050 exhibited no significant difference between the two parents. The expression levels of
SOV2g023090,
SOV2g023130 and
SOV2g023080 were significantly higher in P
1 than those in P
2. The transcript level of
SOV2g023140 was also significantly higher in P
1 relative to P
2, as presented in
Figure 4.
SOV2g023090 modulated protein activity through dephosphorylation and participated in signal transduction as well as growth and developmental regulation.
SOV2g023130 encoded a core signaling kinase that transmitted signals related to stress, phytohormones, growth and development to modulate downstream gene expression.
SOV2g023080 functioned in the ubiquitin–proteasome pathway, governing protein degradation, DNA repair and developmental processes.
SOV2g023140 encodes a putative
PIN auxin transporter that participates in auxin transport and distribution, further regulating plant organ formation and polar growth. Taken together,
SOV2g023140 was proposed as the key candidate gene responsible for leaf width regulation in spinach, and was designated
SpPINL2.
3.8.2. Candidate Genes for Petiole Length
Four genes were located within the candidate interval for the spinach petiole-length QTL (qPL2-1). According to gene annotation results,
SOV2g003700 encoded a protein with unknown function. The main function of
SOV2g003710 was to participate in the regulation of light signaling, flowering time and plant growth and development. The main function of
SOV2g003720 was to mediate the removal of
SUMO modifications and regulate protein localization, protein stability and signaling pathways.
SOV2g003690 was a zinc finger nucleic acid-binding protein that participated in transcriptional regulation, RNA binding, and the regulation of growth and development. Among these genes,
SOV2g003710,
SOV2g003720 and
SOV2g003690 formed a “
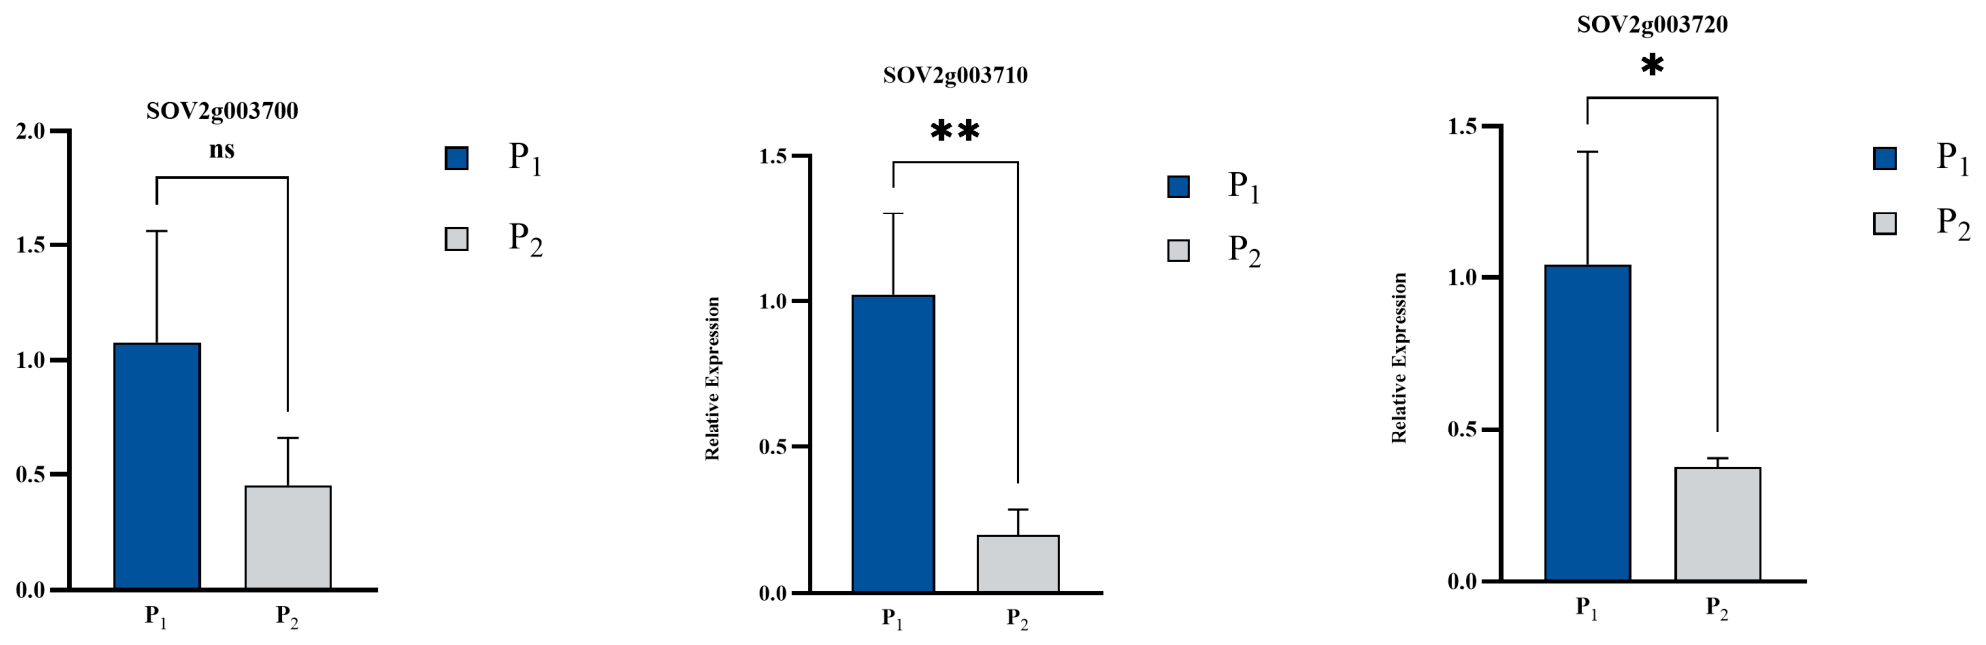
FAR1-ULP-zf-GRF” gene cluster. Expression levels of the four genes were quantified in the two parental lines. The results showed that
SOV2g003690 was not expressed in either parent;
SOV2g003700 showed no significant difference in expression between the two parents. The expression level of
SOV2g003720 in P1 was significantly higher than that in P2, while the expression level of
SOV2g003710 in P1 was extremely significantly higher than that in P2, as shown in
Figure 5. Therefore, this gene cluster was selected as a candidate gene cluster regulating petiole length in spinach and named
SpFAR1-ULP-zf-GRF.
4. Discussion
Different cultivation patterns exert substantial effects on the phenotypes of arugula and Chinese cabbage [
44,
45]. In the present study, leaf length and petiole length of spinach grown in outdoor nutrition bowls were longer than those of spinach cultivated in the greenhouse; meanwhile, leaf width of spinach grown in outdoor nutrition bowls was greater than that of greenhouse-grown spinach. We innovated and revised the criteria for selecting the optimal genetic segregation model: instead of merely adopting the rule of the smallest AIC value paired with goodness-of-fit test deviation, we applied a comprehensive criterion that integrates AIC values and minor goodness-of-fit deviations. Using this strategy, the shared optimal genetic segregation models governing spinach leaf traits were identified across the three cultivation modes. The optimal model for leaf length was MX1-AD-ADI, for leaf width was MX1-AD-ADI, and for petiole length was MX2-ADI-AD. The identification of consistent genetic models across divergent cultivation environments minimized the interfering effects caused by different cultivation conditions. Such shared genetic models are therefore more reliable than models obtained from only a single cultivation pattern. The above genetic model also provides a theoretical basis for germplasm innovation in spinach.
During spinach breeding, petiole length receives greater attention than other leaf-related traits, and it serves as one of the key indicators for breeders to assess the DUS characteristics of spinach varieties. Previous studies also verified a significant positive correlation between leaf length and leaf width, while no significant correlation was detected between leaf length and petiole length in spinach [
46,
47]. Our results indicate that petiole length had the largest coefficient of variation among the measured spinach traits; leaf length and leaf width were strongly correlated, whereas the correlation between leaf length and petiole length was weak. These findings provide a theoretical basis highlighting the importance of petiole length selection in spinach breeding programs.
Genotype–environment interaction is ubiquitous in plants, describing the differential phenotypic responses of distinct genotypes when exposed to varied environmental conditions [
48]. Such interactions constitute a major source of phenotypic variation, adaptive differentiation, and trait instability across heterogeneous environments. With advances in quantitative genetics and genomics, accumulating studies have demonstrated that plant growth, development and agronomic traits are generally modulated by genetic loci together with external environments. Gene–environment interactions broadly regulate plant responses to stress, photoperiod and climatic cues, and substantially shape phenotypic plasticity [
49,
50]. Meanwhile, numerous QTL mapping and multi-environment trials in crop genetics and breeding have validated gene–environment interactions, laying a theoretical foundation for dissecting complex genetic traits and enhancing cultivar adaptability [
51,
52]. Environmental conditions can alter gene heritability, and divergent environments exert distinct effects on genetic variances and phenotypic variances [
53,
54,
55,
56]. In the present study, identical optimal genetic models were detected across different cultivation patterns; nevertheless, estimation of first- and second-order genetic parameters within these shared models revealed significant differences in major gene and polygene genetic parameters under alternative cultivation regimes. These discrepancies may stem from environmental regulation on the function and expression of relevant genes.
To clarify the novelty of leaf-shape QTLs identified in the present study, we compared the physical intervals of leaf-morphology-associated QTLs mapped on spinach chromosomes 1 and 2 in our research with the leaf-shape QTL mapping results published in 2021. Using a BC1 population, four QTLs for leaf length distributed on linkage groups 3 and 5, three QTLs for leaf width all located on linkage group 3, and two QTLs for petiole length mapped on linkage group 5 were reported. For the QTLs controlling leaf length and petiole length in that experiment, no data are available to map their linkage groups to corresponding chromosomal positions. The QTLs for leaf width identified in that study were also located on chromosome 1, yet within distinct intervals compared with those detected in the present experiment.
The candidate interval of qLL2-1 controlling leaf length in this study resides on chromosome 2 with a relatively high phenotypic contribution rate of 17.48%. Notably, no annotated genes were found within this interval, implying that this region may be tightly linked to the causal candidate genes regulating spinach leaf length. Subsequent screening of candidate genes for spinach leaf length should focus on genes upstream and downstream of this genomic region. The candidate intervals of leaf-width QTLs qLW1-1 and qLW2-1 are located on chromosomes 1 and 2, respectively, while the petiole-length QTL qPL2-1 was anchored to chromosome 2.
PIN proteins mediate polar auxin asymmetric distribution via their polar subcellular localization, thereby participating in numerous biological processes that modulate plant growth and development. The
PIN gene family is highly conserved and exhibits species-specific characteristics across plants. Eight
PIN members have been identified in Arabidopsis thaliana, with obvious divergence in subcellular localization and biological function. In addition, variable numbers of
PIN homologous genes have been successively characterized in crops including rice, maize and sorghum [
57,
58]. In the present study, a candidate gene
SpPINL2 (
SOV2g023140) related to the regulation of spinach leaf width was screened. The expression level of this gene was extremely significantly higher in P
1 than that in P
2, implying its potential involvement in spinach leaf width development.
The plant-specific synergistic functional gene cluster
FAR1-ULP-zf-GRF widely exists in Arabidopsis thaliana, rice, maize and other plant species. Within this cluster,
FAR1,
ULP and
zf-GRF individually participate in light signaling pathways,
SUMO modification of proteins, and regulation of organ growth and cell proliferation, respectively. Multiple genes synergistically regulate diverse plant growth and developmental processes [
32,
39,
59,
60]. In this study, a three-gene
FAR1-ULP-zf-GRF cluster was mapped to chromosome 2 in spinach. The
zf-GRF gene (
SOV2g003690) showed no detectable expression in either parent, while the expression levels of
FAR1 (
SOV2g003710) and
ULP (
SOV2g003720) were significantly higher in P
1 than those in P
2. We speculated that
FAR1 (
SOV2g003710),
ULP (
SOV2g003720) and
zf-GRF (
SOV2g003690) jointly constitute the
FAR1-ULP-zf-GRF gene cluster in spinach to regulate petiole elongation. Nevertheless, the exact biological function of this cluster requires further experimental validation in follow-up research.