Article

Evolutionary Dynamics of the Tubulin Gene Family Across Plants and Identification of PaTUA1 as a Candidate Gene Associated with Apricot Kernel Development


Key Laboratory of Non-Timber Forest Germplasm Enhancement and Utilization of National Forestry and Grassland Administration, Zhengzhou 450003, China
*
Authors to whom correspondence should be addressed.
Horticulturae 2026, 12(7), 837; https://doi.org/10.3390/horticulturae12070837
Submission received: 28 May 2026 / Revised: 4 July 2026 / Accepted: 6 July 2026 / Published: 9 July 2026
(This article belongs to the Section Genetics, Genomics, Breeding, and Biotechnology (G2B2))

Abstract

Tubulins are essential cytoskeletal components involved in plant cell division and expansion, yet their evolutionary dynamics across plant lineages and potential roles in horticultural seed/kernel development remain insufficiently understood. Here, we identified 2535 tubulin-related genes from 97 plant genomes and performed an integrated phylogenomic analysis. Phylogenetic and synteny network analyses resolved four ancient clades, including α-, β-,γ-tubulin and FtsZ, all of which were predominantly subjected to purifying selection. The α- and β-tubulin subfamilies exhibited lineage-specific expansion in angiosperms, particularly in eudicots, and these expansions were associated with ancient WGD and WGT events while retaining relatively conserved chromosomal contexts. By employing a pyramid-structured microsynteny framework across 12 Rosaceae genomes, we further traced the orthologous conservation and lineage-specific rearrangements of tubulin loci, with Prunus armeniaca as a reference. Spatiotemporal transcriptome profiling of Siberian apricot and kernel apricot revealed a group of tubulin genes highly expressed during key stages of kernel development, highlighting PaTUA1 as a priority candidate gene. Transient overexpression of PaTUA1 in wounded developing apricot kernels was associated with short-term increases in average phytohormone concentrations, including IAA, GA3, BR, and cytokinins. Together, these results suggest that PaTUA1 represents a promising candidate gene associated with hormone-related responses during apricot kernel development, providing a basis for future functional validation rather than direct evidence of kernel-size determination.

1. Introduction

Tubulins are core components of the plant cytoskeleton and play fundamental roles in cell division, cell expansion, intracellular organization, and organ morphogenesis. In plants, α- and β-tubulins form heterodimers that assemble into microtubules, which participate in spindle formation, phragmoplast organization, cortical microtubule array establishment, chromosome segregation, cell plate formation, and anisotropic cell expansion. γ-tubulin is mainly involved in microtubule nucleation and the organization of microtubule initiation sites, thereby contributing to the spatial patterning and dynamic stability of microtubule arrays [1,2,3]. FtsZ proteins, as ancient tubulin-related proteins, are primarily associated with chloroplast and organelle division, providing an evolutionary link between prokaryotic cell division systems and eukaryotic cytoskeletal components [4]. Beyond their structural functions, plant microtubules are increasingly recognized as dynamic regulators of organ growth by coordinating cell division orientation, mechanical signal perception, cell wall deposition, and directional cell expansion [5,6,7]. In crop species, perturbation of tubulin-related genes can directly affect yield-related traits. For example, mutation of maize tubulin folding cofactor B disrupts microtubule homeostasis and reduces both endosperm cell number and cell size, whereas natural variation in the rice α-tubulin gene WG4 regulates grain shape by affecting cortical microtubule organization [8,9]. These findings suggest that tubulin genes may provide an important cytoskeleton-based entry point for understanding organ size formation in crops.
During plant evolution, the tubulin gene family has been shaped by both deep functional conservation and lineage-specific diversification. The essential cellular functions of α-, β- and γ-tubulins impose strong evolutionary constraints on their protein sequences, conserved domains, and subcellular functions. However, the copy number, subfamily composition, chromosomal distribution, and retention pattern of duplicated tubulin genes vary considerably among plant lineages, implying that gene duplication and differential retention may have contributed to functional diversification [1,2,3]. Whole-genome duplication and whole-genome triplication events are major forces driving gene family expansion in plants, and duplicated genes may subsequently be lost, retained under dosage constraints, or diverge through sub-functionalization and neofunctionalization [10,11,12]. Therefore, a multi-species phylogenomic framework integrating phylogenetic classification, synteny networks, duplication history, and selection pressure analysis is necessary to distinguish deeply conserved tubulin lineages from lineage-specific expansions. However, such a broad evolutionary framework remains limited for plant tubulin genes, particularly in relation to their potential contribution to crop organ development.
Apricot (Prunus armeniaca L.) is an economically important Rosaceae stone fruit crop used for fresh fruit, processing, and kernel production. In kernel-used apricot, kernel size is directly associated with yield, commercial value, and processing potential. Recent genomic and transcriptomic studies have provided important resources for understanding apricot domestication, adaptive divergence, and kernel-related quality traits [13,14,15]. Nevertheless, compared with major model crops, the molecular basis of apricot kernel size formation remains poorly understood. In particular, how cytoskeleton-related genes respond to local hormonal signals to mediate cell proliferation and expansion during apricot kernel growth remains largely unknown. Seed and kernel size are generally determined by coordinated cell proliferation, cell expansion, storage accumulation, and hormone-mediated developmental regulation involving the embryo, endosperm, and seed coat [14,16,17]. Given the established roles of microtubules in cell division orientation, anisotropic expansion, and tissue morphogenesis, tubulin genes may be involved in the developmental regulation of apricot kernel growth. However, whether specific tubulin members are evolutionarily conserved, developmentally expressed, and functionally associated with kernel development in apricot remains unclear.
In this study, we investigated the plant tubulin gene family from both macroevolutionary and trait-associated perspectives. We first identified α-, β-, γ-tubulin, and FtsZ members across 97 representative plant genomes and integrated phylogenetic reconstruction, gene family expansion analysis, synteny network analysis, and selection pressure estimation to clarify their evolutionary conservation and lineage-specific diversification. We then focused on 12 Rosaceae genomes to examine the microsyntenic conservation and structural rearrangement of tubulin loci using P. armeniaca as the reference species. Finally, by integrating spatiotemporal transcriptome profiling, VIP-based statistical prioritization, RT-qPCR validation, transient overexpression, and phytohormone quantification in developing apricot kernels, we identified PaTUA1 as a candidate tubulin gene potentially associated with hormone-related responses during kernel development. This study provides a plant-wide evolutionary framework for the tubulin gene family and suggests a possible connection between tubulin-mediated cytoskeletal regulation and hormone-associated kernel responses in apricot.

2. Materials and Methods

2.1. Plant Genome Selection

A total of 97 representative plant genomes were selected to investigate the evolutionary dynamics of the tubulin gene family across major plant lineages. Species were included according to the following criteria: (i) representation of the main plant lineages relevant to tubulin evolution, including algae, bryophytes, lycophytes, basal angiosperms, monocots, and eudicots; (ii) availability of annotated protein, coding sequence, genome annotation (GFF/GTF), and chromosome or scaffold coordinate files; (iii) preference for chromosome-level or high-contiguity assemblies; and (iv) inclusion of Rosaceae species and major model/crop species required for apricot-focused comparative analysis. Protein sequences, coding sequences, and annotation files were downloaded from Ensembl Plants (https://plants.ensembl.org), the Genome Database for Rosaceae (https://www.rosaceae.org), and related genome repositories; all public genome resources were downloaded or re-checked on 20 February 2026. For genes with multiple transcript isoforms, only the longest protein-coding transcript was retained to avoid redundancy. Genome annotation files were processed to extract gene chromosomal coordinates for subsequent gene duplication, synteny, and microsynteny analyses. Prunus armeniaca was included as the focal Rosaceae species and processed using the same criteria. Detailed information for all genomes, including species names, assembly versions, Taxon ID, data sources is provided in Supplementary Table S1.

2.2. Identification and Domain Validation of Tubulin Gene Family Members

Tubulin family members were identified using a combined HMM- and domain-validation strategy, following the general approaches used in previous genome-wide tubulin family studies. The conserved Tubulin/FtsZ domain profile PF00091 was retrieved from the Pfam database (accessed on 24 February 2026) and used as the query for HMMER searches against the protein datasets of the 97 selected plant genomes [18]. Candidate proteins with an E-value lower than 1 × 10⁻⁵ were retained for preliminary screening. Domain coverage was calculated as the aligned region length divided by the length of the corresponding HMM profile. To avoid missing divergent Tubulin/FtsZ-related proteins across broad plant lineages, candidates with PF00091 coverage ≥50% were initially retained, but final candidates were accepted only after conserved-domain validation using Pfam and the NCBI Conserved Domain Database. For α-, β-, and γ-tubulin candidates, proteins were required to contain complete or near-complete tubulin domain architecture, whereas FtsZ candidates were required to contain a complete or near-complete Tubulin/FtsZ-type conserved domain supported by conserved-domain annotation. Redundant isoforms were removed according to the longest-transcript criterion. Proteins containing internal stop codons, extremely short coding regions, severely truncated Tubulin/FtsZ domains, or incomplete conserved regions were discarded. When a candidate protein contained more than one Tubulin/FtsZ-related domain hit, the sequence was retained only once and assigned to a subfamily according to the best HMMER bit score, conserved-domain annotation, and its position in the phylogenetic tree. The final non-redundant tubulin gene set was used for phylogenetic reconstruction, synteny analysis, and downstream comparative analyses.

2.3. Sequence Alignment and Phylogenetic Analysis

The full-length amino acid sequences of the identified tubulin proteins were aligned using MAFFT v7.520 with the L-INS-i algorithm [19]. Poorly aligned or ambiguously aligned regions were trimmed using trimAl v1.2rev59 with the parameters -seqoverlap 50 -resoverlap 0.5 [20]. Maximum-likelihood phylogenetic trees were constructed using IQ-TREE v2.1.2. The best-fit amino acid substitution model was selected by ModelFinder, and branch support was evaluated with 1000 bootstrap replicates [21]. The resulting phylogenetic trees were visualized and annotated using iTOL, https://itol.embl.de (accessed on 8 March 2026). Tubulin subfamilies were classified based on phylogenetic topology and conserved domain features.

2.4. Syntenic Block Detection and Synteny Network Construction

To examine the conservation and rearrangement of tubulin loci across plant genomes, whole-genome syntenic relationships were identified using a synteny-network-based comparative genomics strategy [22]. All-against-all protein sequence comparisons were performed among the 97 plant genomes using DIAMOND v2.0.15 [23]. The resulting homologous gene pairs, together with the corresponding gene position files, were used to identify intraspecific and interspecific syntenic blocks using MCScanX https://github.com/wyp1125/MCScanX (accessed on 12 March 2026) with default parameters [24]. Syntenic blocks containing tubulin genes were extracted from the whole-genome collinearity results to construct tubulin-specific synteny networks. Each node in the network represented a tubulin gene, and edges represented syntenic homologous relationships. The network was visualized using Cytoscape v3.9.1 and Gephi v0.10.1.

2.5. Ka, Ks, and Ka/Ks Analysis

To evaluate the evolutionary constraints acting on tubulin genes, syntenic tubulin gene pairs were extracted from the collinearity results. Protein sequences of each gene pair were aligned using MAFFT, and the corresponding coding sequence alignments were generated based on the protein alignments. Non-synonymous substitution rates (Ka), synonymous substitution rates (Ks), and Ka/Ks ratios were calculated using KaKs_Calculator with the Nei–Gojobori (NG) method [25]. Before statistical analysis, gene pairs were excluded if the codon alignment contained premature stop codons, the aligned coding region was shorter than 150 codons, more than 20% of aligned codons were ambiguous or gapped, or the substitution estimates were unreliable, including Ks ≤ 0, Ks > 5, Ka > 5, or undefined/infinite Ka/Ks values. The Ka/Ks values were compared among α-tubulin, β-tubulin, γ-tubulin, and FtsZ clades to infer clade-specific selective constraints. Because Ks saturation, lineage-specific rate variation, and ancient duplication events may affect substitution-rate estimates, Ka/Ks values were interpreted as evidence of relative selective constraint rather than as precise duplication dating.

2.6. Rosaceae Microsynteny Analysis

To further investigate the conservation of tubulin loci in Rosaceae, 12 representative Rosaceae genomes were selected for family-level phylogenetic and microsynteny analyses. Tubulin genes from these genomes were identified using the same HMM-based strategy described above. A Rosaceae-specific maximum-likelihood phylogenetic tree was reconstructed using the identified tubulin proteins. For microsynteny analysis, P. armeniaca was used as the focal reference genome, and pairwise collinearity relationships between P. armeniaca and other Rosaceae species were extracted from MCScanX results. Genome-wide collinear blocks were displayed as background links, while syntenic gene pairs containing tubulin homologs were highlighted to trace orthologous conservation and lineage-specific rearrangements. The microsynteny plots were generated using TBtools v2.466.

2.7. Gene Expression Profiles

Public RNA-seq datasets from the P. armeniaca project PRJCA001987 were used to analyze the expression patterns of apricot tubulin genes [26]. The selected samples covered different tissues and developmental stages, including developing kernels, fruits, leaves, flowers, and flower buds from different apricot types. Raw reads were filtered using fastp v0.20.1 with the -l 50 option to remove low-quality reads and short reads. Clean reads were mapped to the P. armeniaca ‘Yinxiangbai’ reference genome using HISAT2, and gene expression levels were quantified as fragments per kilobase of transcript per million mapped reads (FPKM) using StringTie v2.1.7. For descriptive heatmaps, the expression matrix of apricot tubulin genes was extracted, log2(FPKM + 1) transformed, and subjected to row-scaled Z-score normalization before hierarchical clustering. The heatmaps were generated in R (v4.3.2) using the ComplexHeatmap package (v2.26.0) with hierarchical clustering based on the normalized expression matrix. Because the RNA-seq data were generated from bulk tissues, the expression profiles represent average transcript abundance across mixed cell types. To quantitatively prioritize candidate tubulin genes during kernel development, the log2(FPKM + 1)-transformed expression matrix of apricot tubulin genes from kernel-development samples was analyzed using partial least squares-discriminant analysis (PLS-DA), and variable importance in projection (VIP) scores were calculated for each gene. Tubulin genes were ranked according to their VIP scores, and the complete ranking is provided in Supplementary Table S4. This VIP-based ranking was used as a quantitative complement to phylogenetic identity, conserved microsynteny, expression profiling, and RT-qPCR validation, rather than as independent evidence of gene function.

2.8. Transient Overexpression Assay

Developing apricot kernels were carefully excised, the seed coats were removed, and the exposed cotyledon tissues were gently scratched with a sterile scalpel. The materials were immersed for 15 min in Agrobacterium tumefaciens suspension (OD600 = 0.75, containing 10 mM MES, 10 mM MgCl2 and 150 μM acetosyringone) carrying the PaTUA1 overexpression vector or empty vector (control). After wiping off surface bacteria, kernels were co-cultured at 25 °C under dark conditions. Samples were collected at 1, 2, 3 and 4 d post-infection, snap-frozen in liquid nitrogen and stored at −80 °C for subsequent analysis. Each treatment and time point included three independent biological replicates, with marginal tissues from five kernels mixed for each replicate. Referencing the previous experimental methods, RT-qPCR analysis was performed on transient overexpression samples using the PaTUA1-specific primer pair (forward: TAACCAACAGCGCATTCGAG, reverse: ACAGCATGCCATGTACTTGC), with PaActin used as the internal reference for normalization [27].

2.9. Analysis of Phytohormone Dynamics

The temporal dynamics of phytohormone accumulation across bulk kernel tissues were analyzed using a liquid chromatography-tandem mass spectrometry (LC-MS/MS) workflow adapted from previously published plant-hormone methods [27]. Frozen kernel tissue (0.2 g) was ground in liquid nitrogen, spiked with internal standards, and extracted twice with pre-cooled 80% methanol containing 0.1% formic acid via sonication at 4 °C for 30 min. After centrifugation (12,000 rpm, 10 min, 4 °C), the pooled supernatants were purified using a C18 solid-phase extraction (SPE) cartridge. The SPE cartridge was washed with ultrapure water, and the hormones were eluted with 80% methanol. The eluate was evaporated to dryness under nitrogen at 35 °C, reconstituted in 200 μL of mobile phase (A/B = 80/20, v/v), and filtered through a 0.22 μm membrane prior to analysis. Phytohormones (IAA, GA3, BR, CTK, and ZT) were analyzed using a Waters ACQUITY UPLC™ coupled with a Xevo™ TQ-S triple quadrupole mass spectrometer (Waters, Milford, MA, USA) with an electrospray ionization (ESI) source. Quantification was performed using the internal standard method combined with external calibration curves. All experiments were performed with three biological replicates. Because whole-kernel tissue was used, the values represent average tissue-level hormone concentrations rather than cell-type-specific hormone dynamics.

2.10. Statistical Analysis

Statistical analyses were performed using R(v4.3.2) or GraphPad Prism v9.0. For comparisons of Ka, Ks, and Ka/Ks values among different tubulin clades, one-way analysis of variance (ANOVA) was conducted followed by Tukey’s HSD multiple-comparison test. For RT-qPCR and hormone measurements, differences between the PaTUA1 overexpression group and the empty vector control at each time point were evaluated using Student’s t-test. Data are presented as means ± standard deviation from three biological replicates. Statistical significance was indicated as p < 0.05, p < 0.01, and p < 0.001, unless otherwise specified.

3. Results and Discussion

3.1. The Tubulin Gene Family Shows Ancient Divergence and Lineage-Specific Expansion

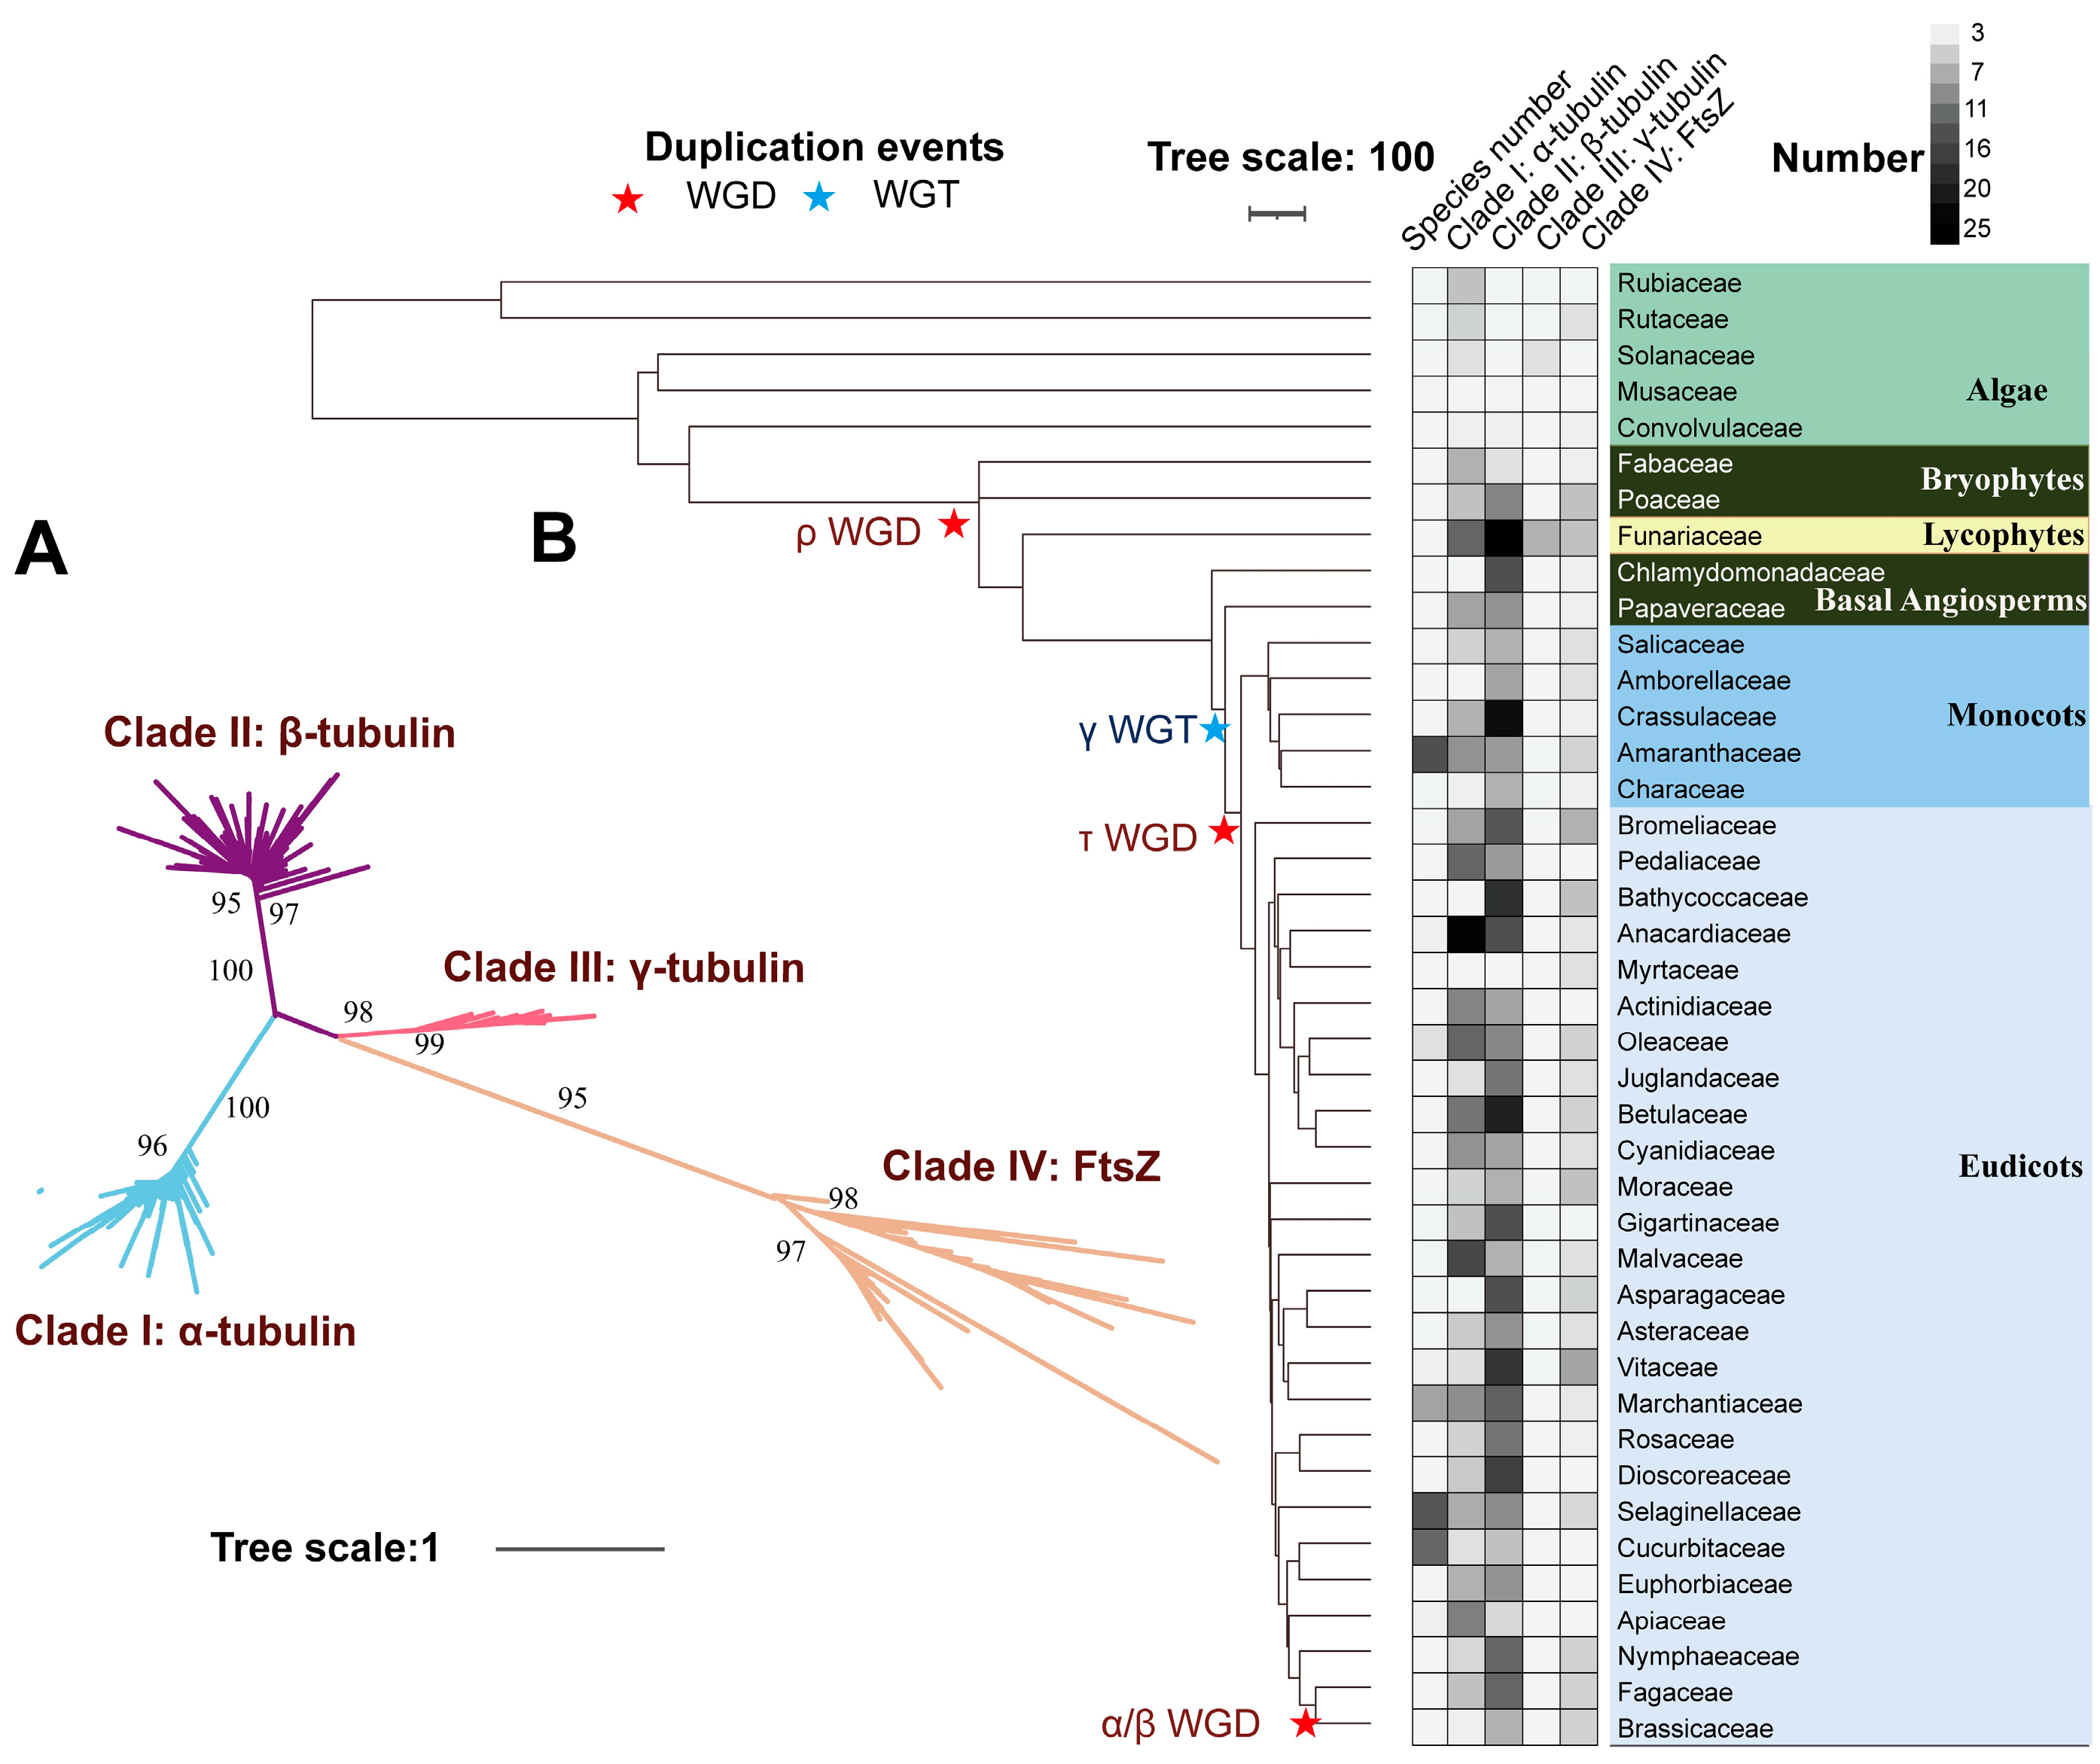
To establish a plant-wide evolutionary framework for the tubulin gene family, we identified 2535 tubulin-related genes from 97 representative plant genomes and reconstructed a maximum-likelihood phylogenetic tree (Supplement Table S2). The resulting phylogeny clearly resolved four major clades corresponding to α-, β-, γ-tubulin, and FtsZ, with generally strong branch support (Figure 1A). Among these clades, α-tubulin and β-tubulin represented the two largest groups, containing 822 and 1138 members, respectively, indicating that canonical microtubule-forming tubulins have been extensively retained during plant evolution. We next compared the copy number distribution of the four tubulin clades across major plant lineages. Tubulin gene numbers varied markedly among the examined species, ranging from 4 to 28 copies per genome (Figure 1B). Compared with γ-tubulin and FtsZ, α- and β-tubulin generally showed broader distribution and higher copy numbers, suggesting unequal expansion and retention among tubulin subfamilies.
We then mapped tubulin copy numbers onto the species phylogeny together with major genome duplication events to examine whether copy-number patterns were consistent with known polyploidization history. The expansion of α- and β-tubulin genes broadly coincided with several ancient polyploidization events, including τ WGD, γ WGT, ρ WGD, and α/β WGD (Figure 1B). This association suggests that whole-genome duplication and triplication events contributed to the expansion of plant tubulin genes, whereas subsequent lineage-specific gene retention and loss likely shaped their present-day copy number variation. Overall, these results indicate that plant tubulin genes were resolved into deeply conserved evolutionary clades but underwent unequal expansion among lineages and subfamilies.

3.2. Evolutionary Constraint and Syntenic Conservation of Plant Tubulin Genes

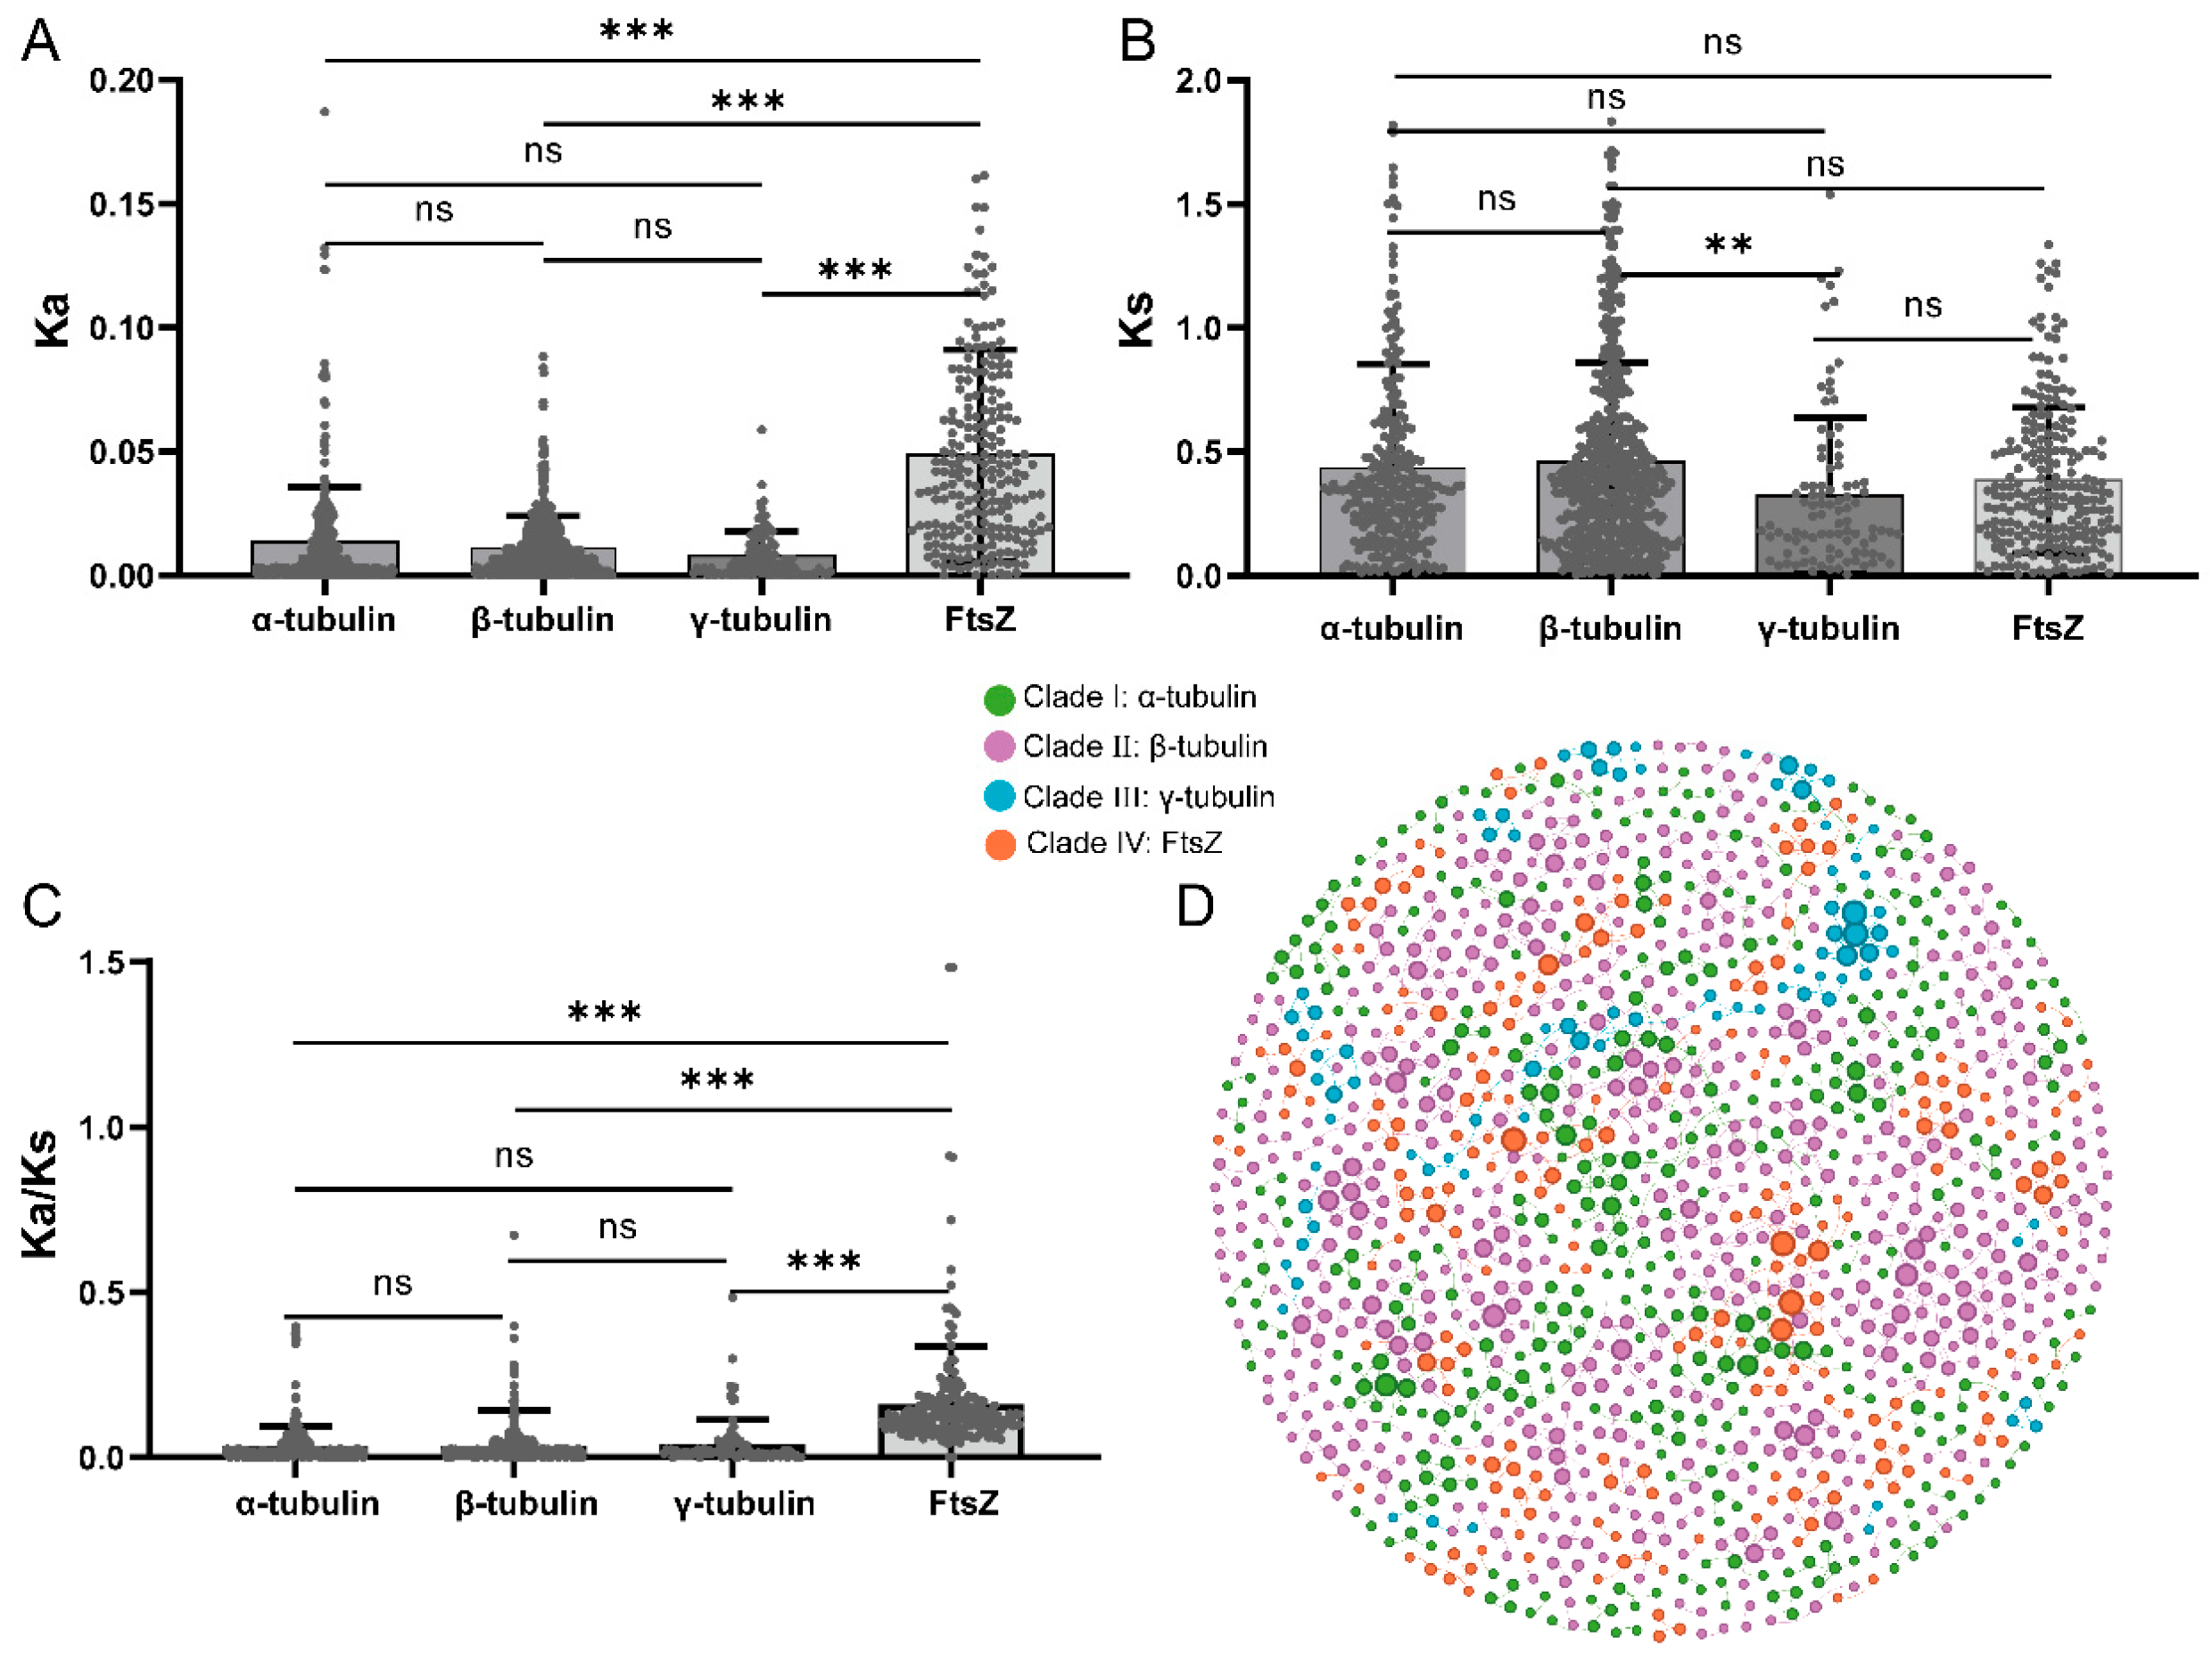
Having resolved the four major tubulin clades, we next evaluated clade-specific evolutionary constraints by calculating Ka, Ks, and Ka/Ks values for syntenic gene pairs. The Ka values differed significantly among clades, with FtsZ showing the highest mean Ka value, whereas α-, β-, and γ-tubulin displayed relatively lower values (Figure 2A, Supplement Table S3). This suggests that canonical tubulins have experienced stronger protein-coding sequence conservation than FtsZ. The Ks values showed relatively moderate differences among clades, although a significant difference was observed between β-tubulin and γ-tubulin (Figure 2B). Further analysis of Ka/Ks ratios revealed that most tubulin gene pairs had values below 1, indicating that the family has been mainly subjected to purifying selection during plant evolution (Figure 2C). Notably, FtsZ exhibited significantly higher Ka/Ks values than the other three clades, suggesting relatively relaxed selective constraints or faster sequence divergence.
Synteny network analysis further revealed extensive collinear relationships among plant tubulin genes (Figure 2D). α- and β-tubulin formed large and highly connected networks, whereas γ-tubulin showed fewer syntenic links and FtsZ was distributed across multiple network regions. Together, these results indicate that plant tubulin genes are generally conserved under purifying selection, while different clades show unequal evolutionary rates and syntenic conservation patterns.

3.3. Rosaceae Tubulin Genes Retain Ancient Clades and Conserved Microsyntenic Relationships

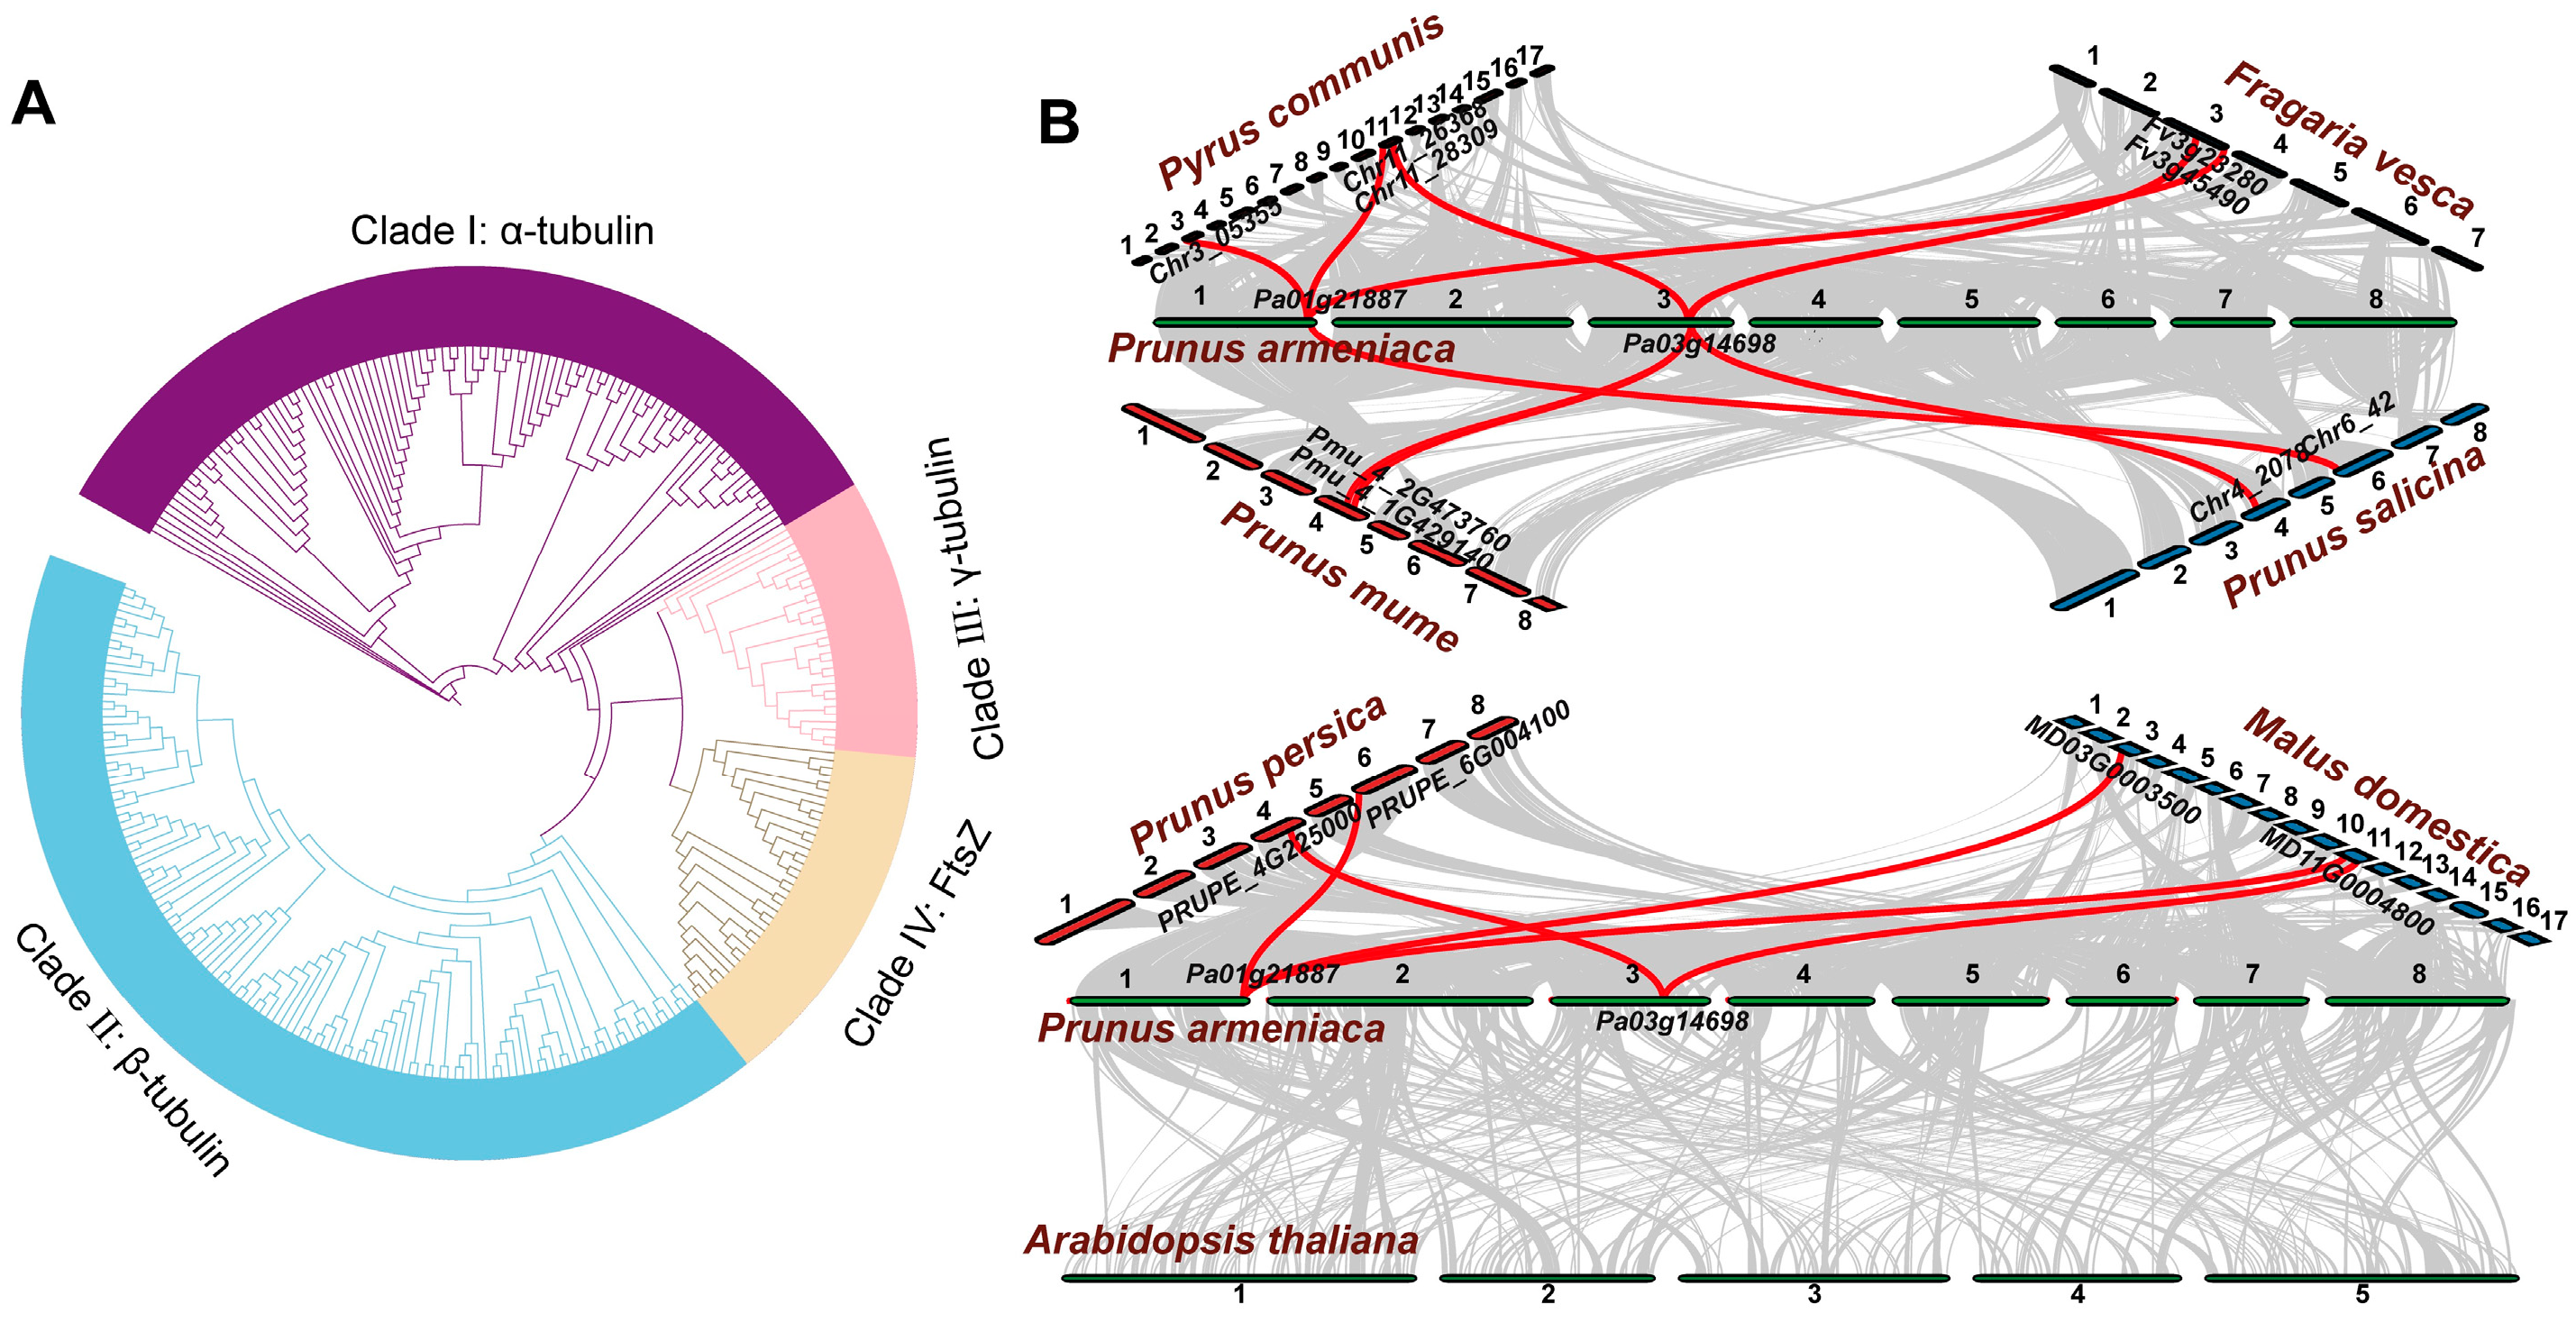
Subsequently, microsynteny analysis was performed using Prunus armeniaca as the focal species. Accordingly, 290 tubulin genes identified from 12 representative Rosaceae genomes were used to reconstruct a maximum-likelihood phylogenetic tree, which again grouped Rosaceae tubulins into four major clades: α-, β-, γ-tubulin, and FtsZ (Figure 3A). Among them, α- and β-tubulin contained more members than γ-tubulin and FtsZ, indicating unequal retention and expansion of tubulin subfamilies within Rosaceae. We then performed microsynteny analysis using Prunus armeniaca as the focal species. Several apricot tubulin loci, including Pa01g21887 and Pa03g14698, showed clear syntenic relationships with homologous regions in pear, strawberry, European plum, Chinese plum, peach, apple, and Arabidopsis (Figure 3B). The syntenic links were more continuous among Rosaceae species than between apricot and Arabidopsis, suggesting stronger conservation of tubulin genomic neighborhoods within the family.
In particular, apricot tubulin homologs shared conserved chromosomal blocks with closely related Prunus species, such as peach, Japanese apricot, and Chinese plum. These results indicate that many apricot tubulin genes have been retained in conserved microsyntenic regions after Rosaceae diversification, while limited chromosomal rearrangements may have contributed to lineage-specific locus variation. Together, the Rosaceae-scale phylogeny and microsynteny analysis support the evolutionary conservation of apricot tubulin genes and provide a basis for identifying candidate members associated with kernel development.

3.4. Spatiotemporal Expression Profiling Identifies PaTUA1 as a Candidate Gene Associated with Apricot Kernel Development

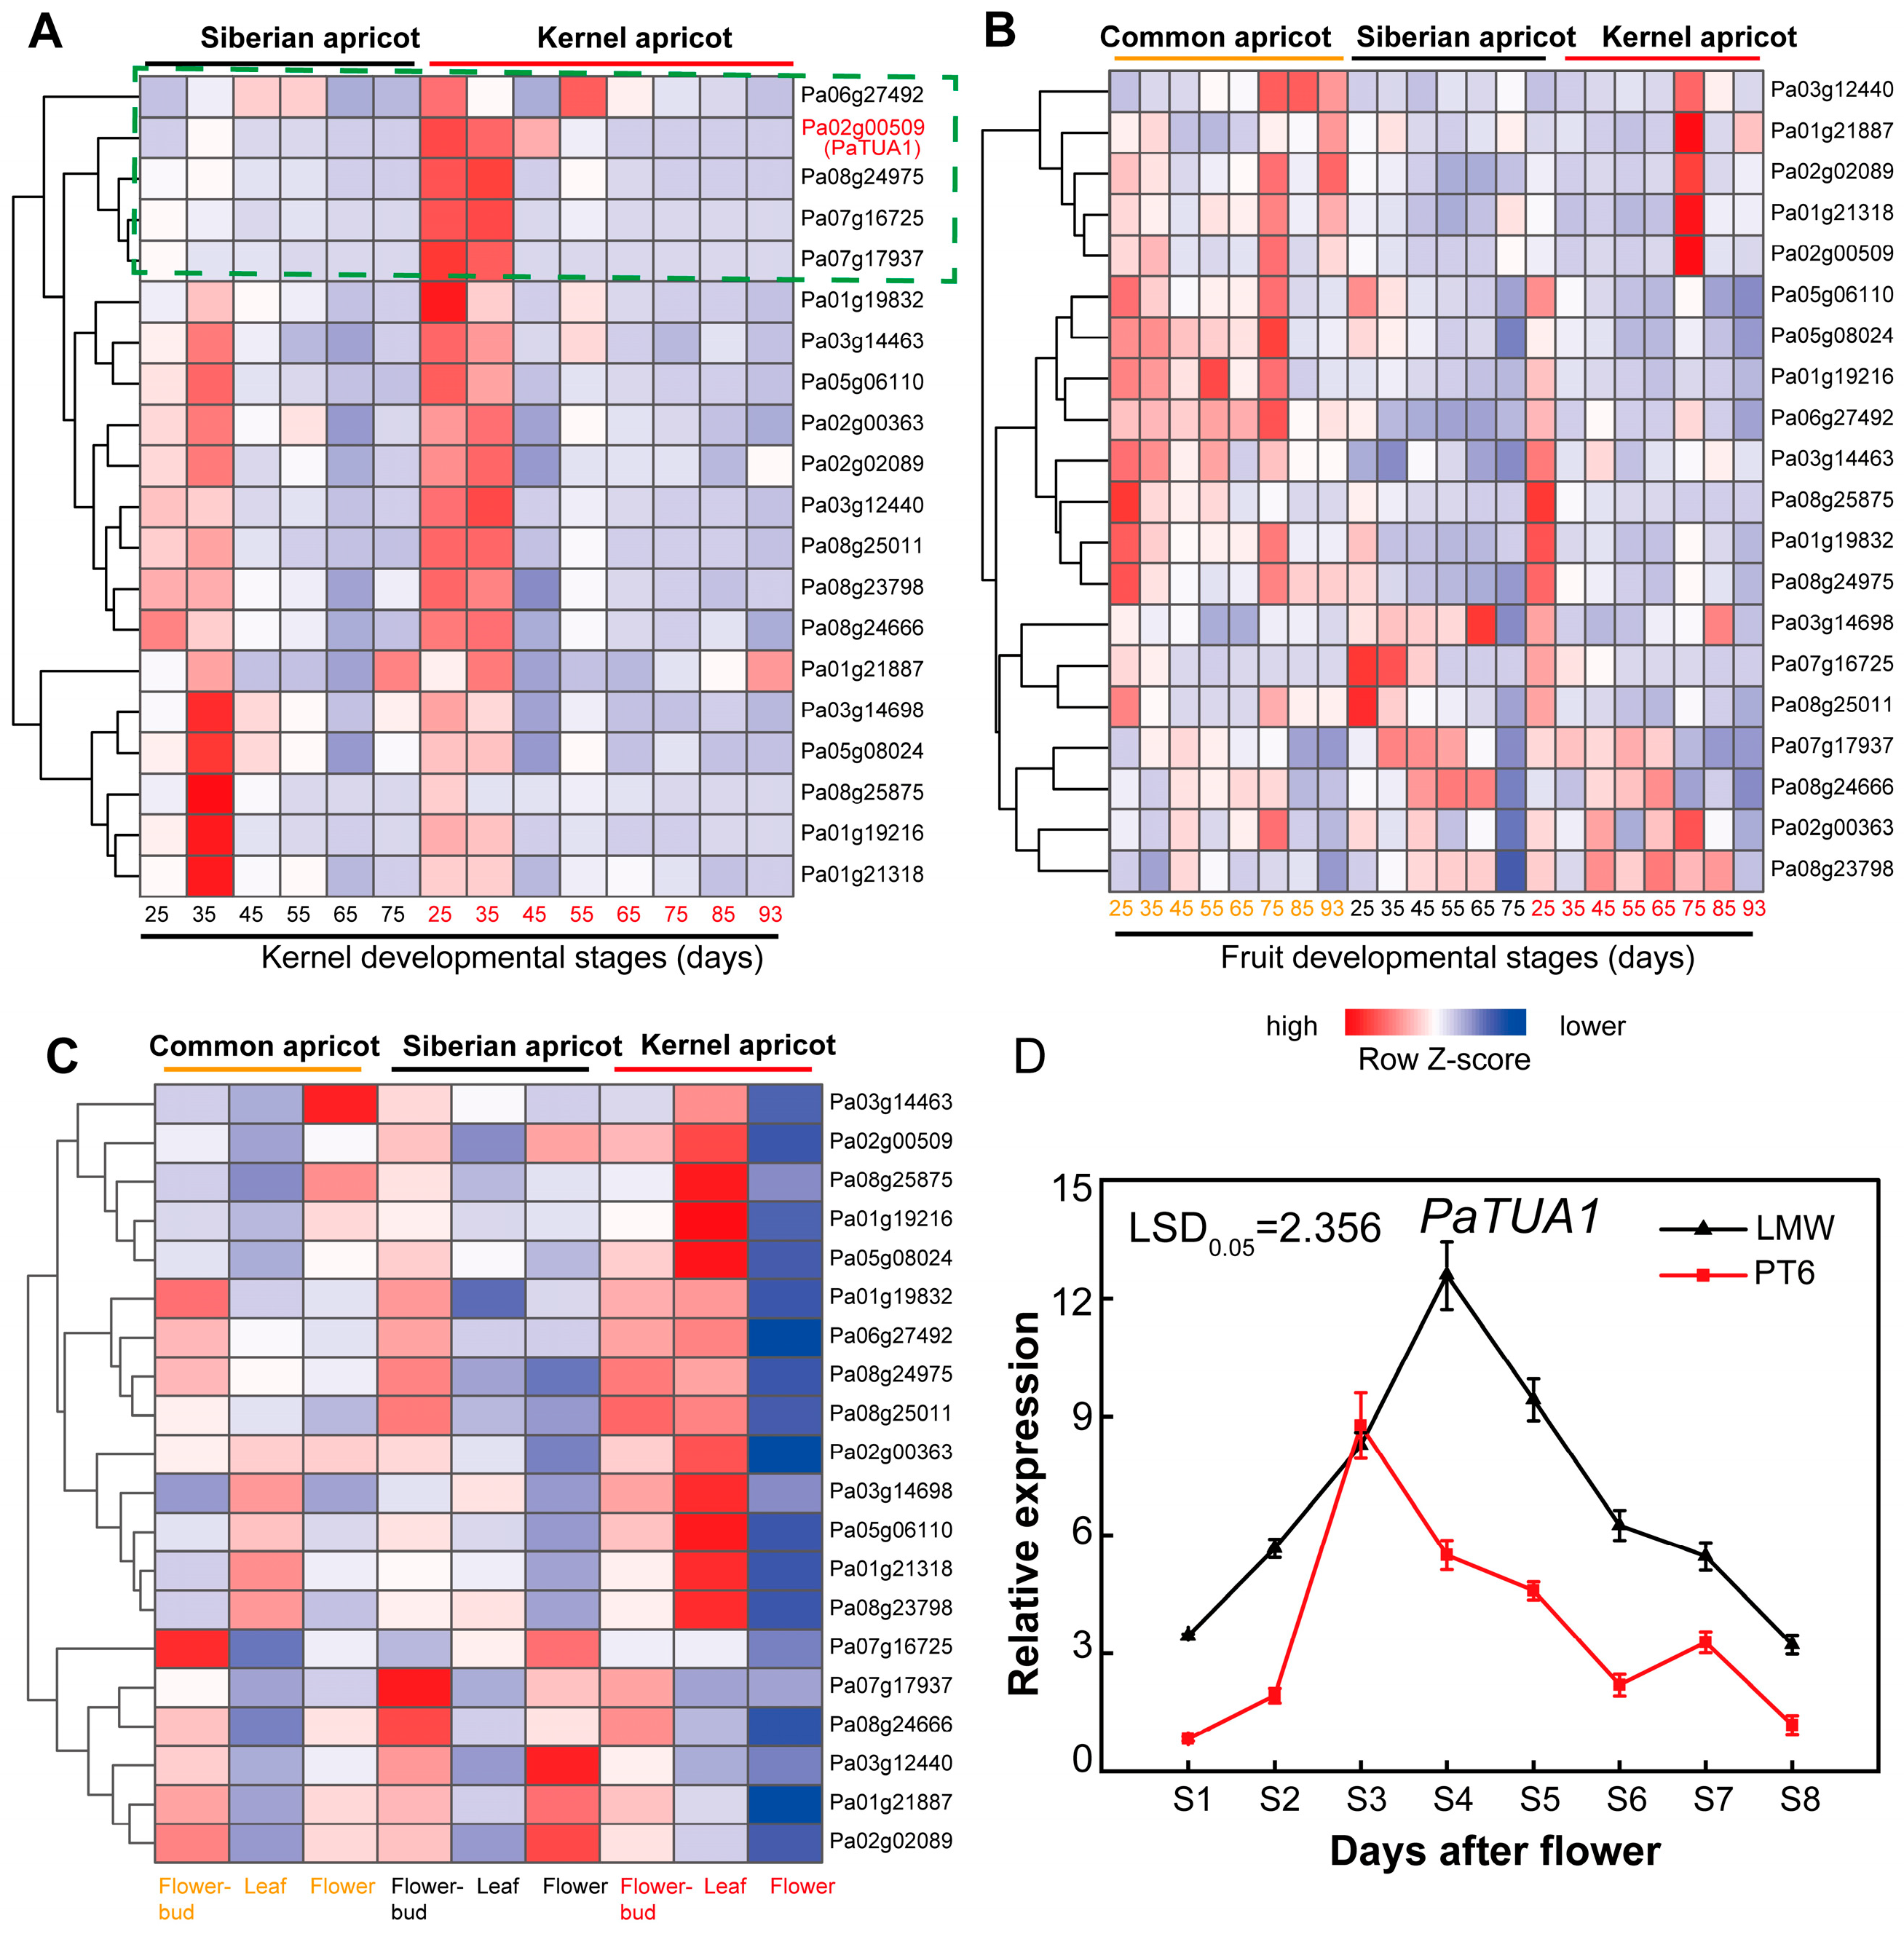
After defining the evolutionary conservation of apricot tubulin genes, we examined their spatiotemporal expression profiles to identify candidates associated with kernel development. During kernel development, tubulin genes showed clear stage- and genotype-dependent expression patterns between Siberian apricot and kernel apricot (Figure 4A). Notably, Pa02g00509, together with Pa06g27492, Pa08g24975, Pa07g16725, and Pa07g17937, formed a highly expressed cluster during early-to-mid kernel development in kernel apricot, which accompanied the active phase of kernel growth. Expression analysis across fruit developmental stages further revealed that several tubulin genes, including Pa01g21887, Pa02g00509, Pa01g21318, Pa05g06110, and Pa06g27492, were preferentially expressed at specific stages or in specific apricot types (Figure 4B). Spatial expression profiling showed that many tubulin genes accumulated more strongly in reproductive tissues, especially flower buds and flowers, than in leaves, likely as a consequence of the high cytoskeletal dynamics in these actively dividing tissues (Figure 4C). These patterns indicate functional differentiation among apricot tubulin members during reproductive development.
To avoid relying solely on descriptive expression patterns for candidate prioritization, we further performed a PLS-DA/VIP-based ranking of tubulin-gene expression across kernel-development samples. PaTUA1 (Pa02g00509) obtained the highest VIP score (2.33) among all analyzed tubulin genes, followed by Pa01g21318 (VIP score = 2.14) and Pa06g27492 (VIP score = 2.06) (Supplementary Table S4). This quantitative result was consistent with the phylogenetic identity, conserved microsyntenic context, expression profiling, and RT-qPCR validation of PaTUA1. However, the VIP ranking should be interpreted as a candidate-prioritization metric rather than direct functional evidence.
Based on its combined α-tubulin phylogenetic identity, conserved microsyntenic context, kernel-associated expression pattern, highest VIP ranking, and RT-qPCR validation, Pa02g00509 was selected for further validation and designated as PaTUA1. RT-qPCR analysis in two apricot accessions with contrasting kernel sizes—the large-kernel cultivar Longwangmao (LMW) and the small-kernel cultivar PT6—confirmed that PaTUA1 displayed a stage-specific expression pattern, with expression peaking at S4 in LMW and S3 in PT6 (Figure 4D). The differential expression dynamics between the two accessions suggest that PaTUA1 is associated with kernel developmental progression at the expression level, but this association does not by itself establish a causal role in kernel-size determination. Together, these spatiotemporal expression patterns identify PaTUA1 as a priority candidate gene for further functional analysis in apricot kernel development.

3.5. Transient Overexpression of PaTUA1 Is Associated with Increased Phytohormone Accumulation in Apricot Kernels

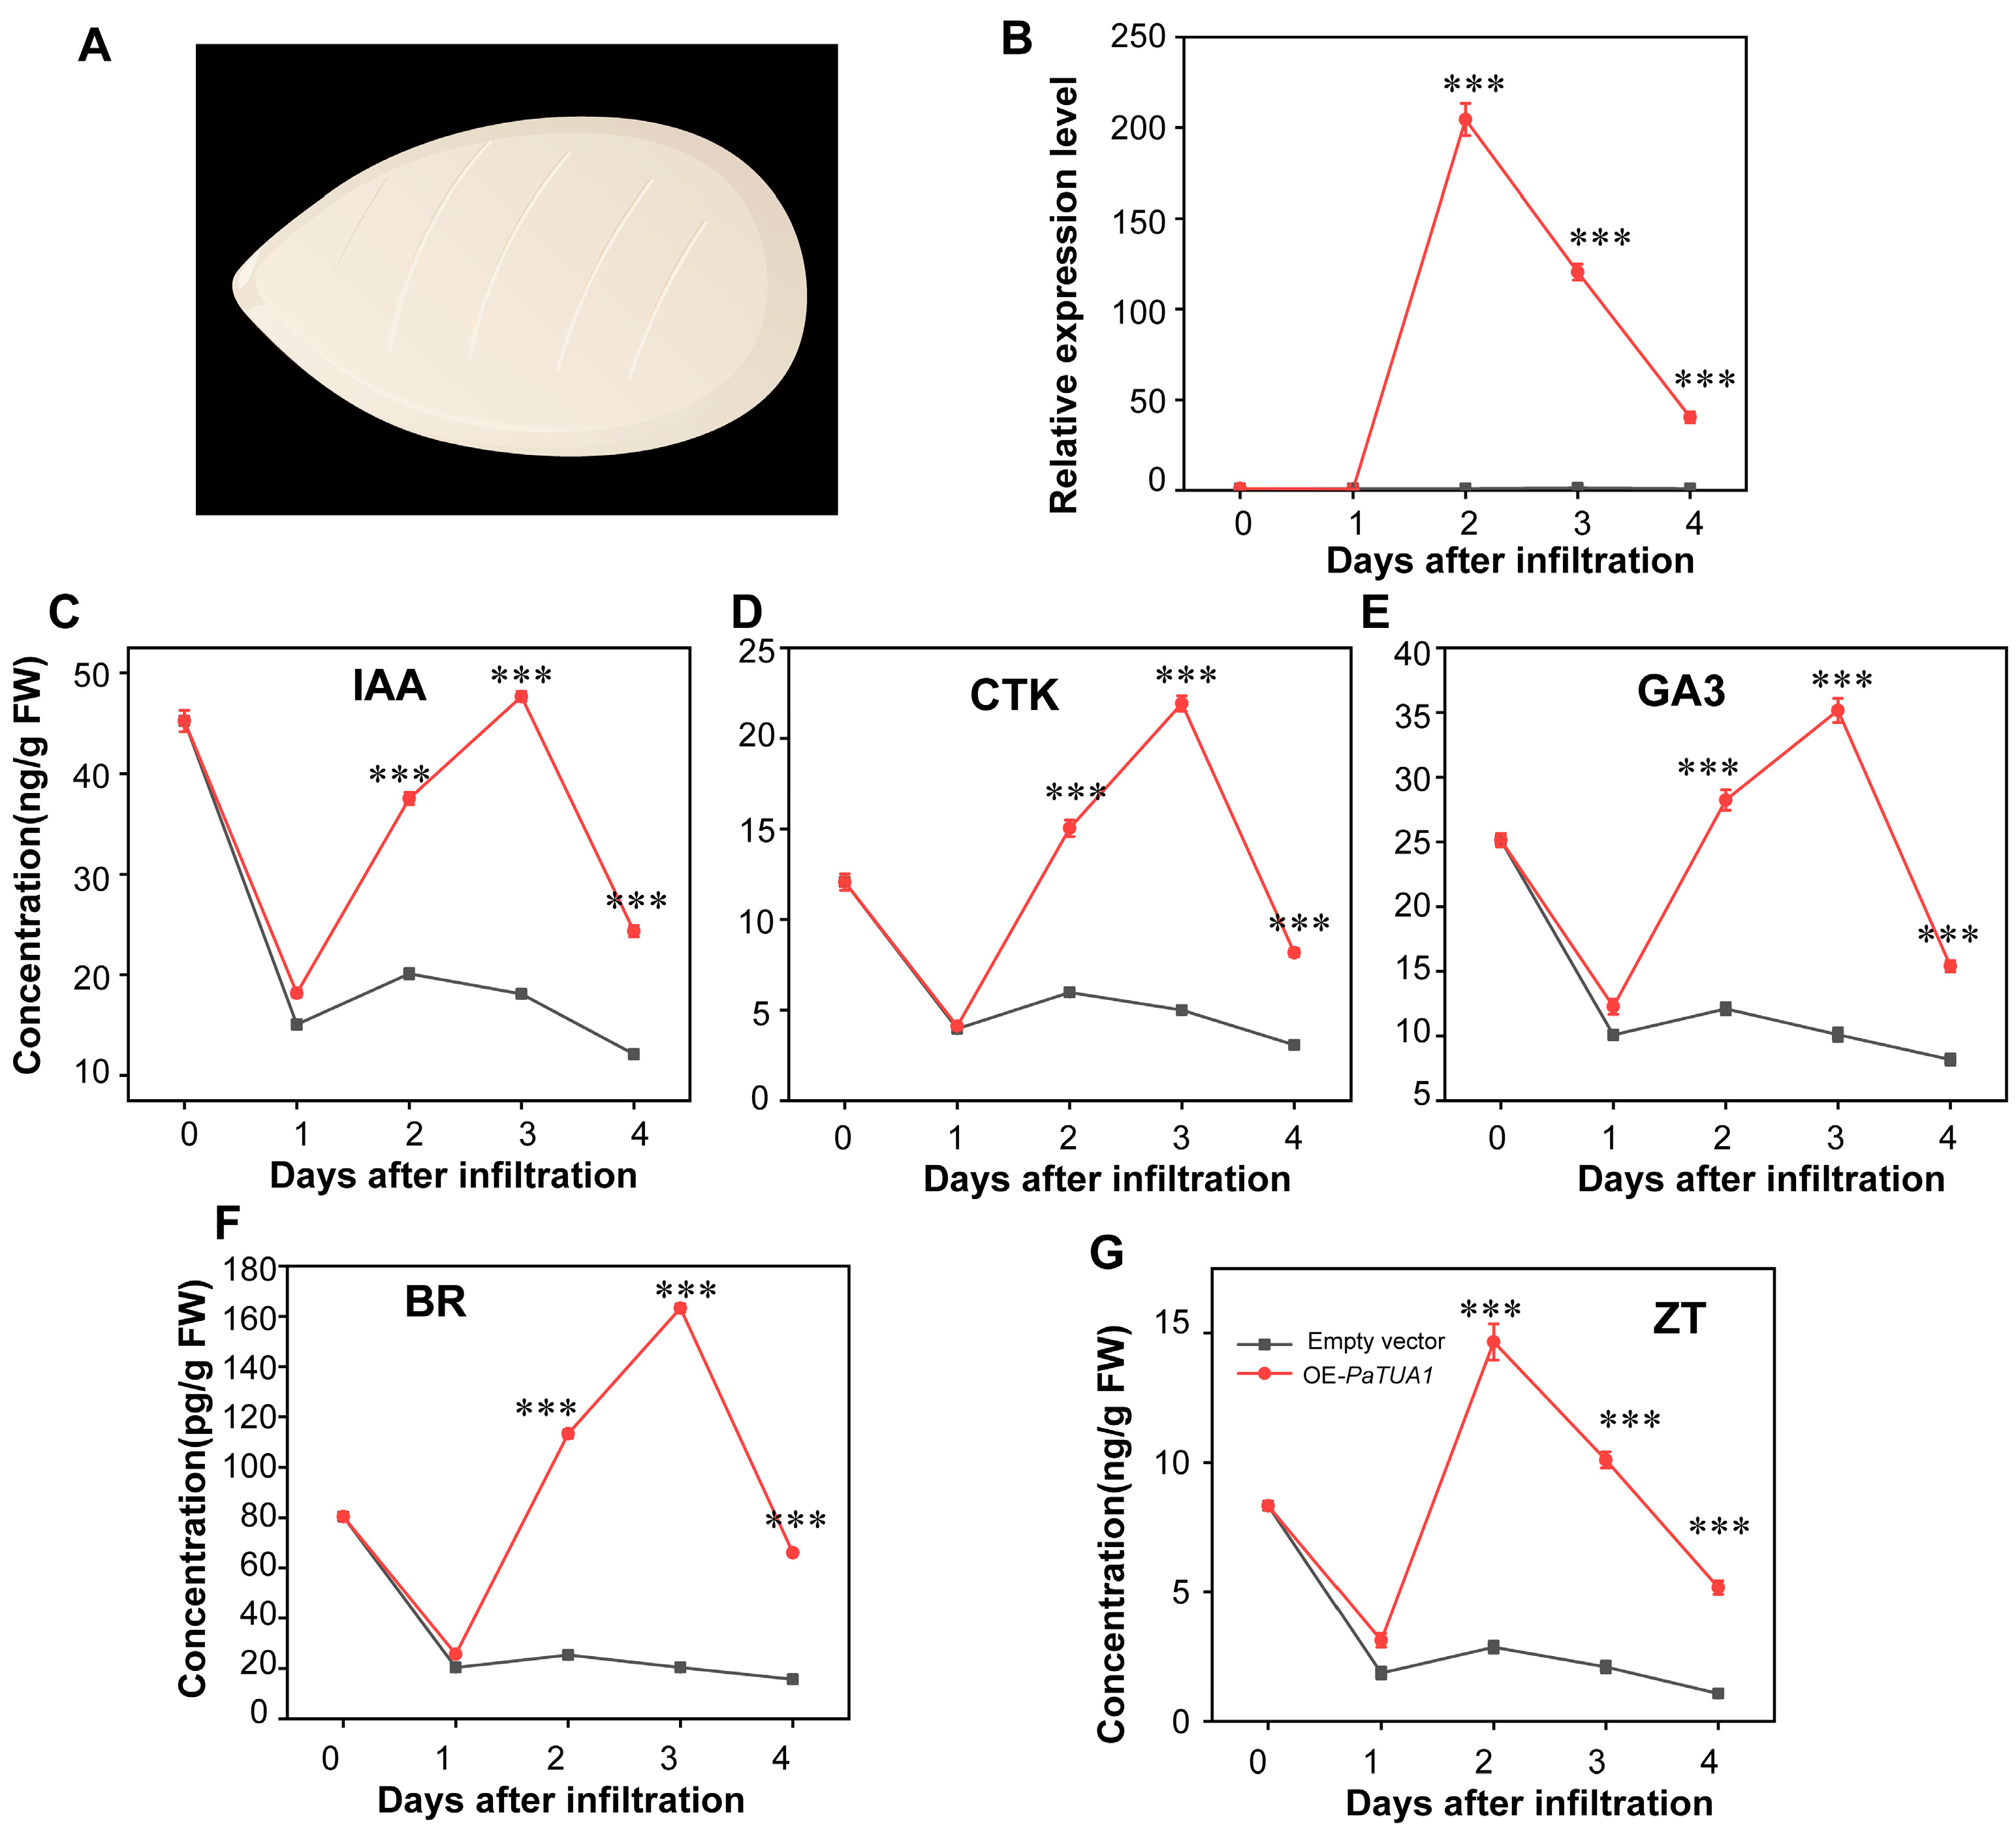
Based on its prominent kernel-associated expression pattern, PaTUA1 was selected for Agrobacterium-mediated transient overexpression analysis in wounded developing apricot kernels (Figure 5A). RT-qPCR analysis confirmed that PaTUA1 was successfully induced in OE-PaTUA1 kernels, with its transcript level peaking at 2 d post-infiltration and reaching approximately 200-fold higher than that in the empty vector control (Figure 5B). Although PaTUA1 expression declined thereafter, it remained significantly higher than the control at later time points, indicating an effective but transient overexpression response. We next examined whether PaTUA1 overexpression affected endogenous phytohormone accumulation. Compared with the empty vector control, OE-PaTUA1 kernels showed significantly increased levels of several growth-related hormones, including IAA, CTK, GA3, BR, and ZT, mainly from 2 to 4 d post-infiltration (Figure 5C–G). Among these hormones, IAA, CTK, GA3, and BR reached their highest levels at 3 d post-infiltration, whereas ZT peaked earlier at 2 d post-infiltration. These results indicate that transient overexpression of PaTUA1 is associated with short-term changes in average hormone accumulation in developing apricot kernels. Because the measurements were obtained from heterogeneous, wounded, and Agrobacterium-infiltrated bulk tissues, the observed differences may reflect direct or indirect effects of PaTUA1, altered hormone synthesis, transport or degradation, or stress responses associated with the infiltration procedure. Therefore, these data should be interpreted as preliminary evidence for hormone-related responses rather than as proof that PaTUA1 directly regulates kernel developmental phenotypes or mature kernel size.

4. Discussion

Plant tubulins represent an ancient and functionally constrained cytoskeletal gene family that has been repeatedly shaped by genome duplication and lineage-specific retention during plant evolution. In this study, phylogenomic analysis across 97 plant genomes resolved four major clades, including α-, β-, γ-tubulin, and FtsZ. This classification is consistent with the established functional framework of the tubulin/FtsZ superfamily, in which α- and β-tubulins form the core heterodimers of microtubules, γ-tubulin participates in microtubule nucleation, and FtsZ represents a tubulin-related system mainly associated with organellar division and chloroplast division evolution [2,3,28,29]. The broader expansion of α- and β-tubulin genes in angiosperms, particularly in eudicots, is consistent with preferential retention of canonical microtubule-forming tubulins during the evolution of complex plant organs and reproductive structures. Such retention is likely associated with ancient polyploidization events, including the core-eudicot γ whole-genome triplication, followed by lineage-specific duplicate retention, dosage constraint, and functional divergence [10,11,30,31]. Nevertheless, the present copy-number and synteny analyses support temporal correspondence and positional conservation, not a formal causal test of WGD/WGT-driven expansion. In parallel, most tubulin homologs in this study showed Ka/Ks values lower than 1, indicating predominant purifying selection. This strong constraint is consistent with the essential roles of microtubules in mitosis, cytokinesis, cortical microtubule organization, and anisotropic cell expansion [2,3,7]. In contrast, the relatively higher Ka and Ka/Ks values of FtsZ suggest that this ancient tubulin-related clade may have experienced relaxed selective constraints or faster sequence divergence, possibly reflecting its distinct evolutionary trajectory in plastid division systems [4]. Therefore, the combined phylogenetic, selection-pressure, and synteny-network analyses support a conserved but differentially diversified evolutionary pattern for plant tubulin genes and provide the classification framework used for apricot candidate-gene screening.
At the Rosaceae scale, apricot tubulin genes retained the four ancient clades and showed clear microsyntenic conservation with homologous loci in pear, strawberry, plum, peach, apple, and other related species. This indicates that many apricot tubulin loci were inherited from conserved ancestral genomic blocks and remained relatively stable after Rosaceae diversification. However, despite this genomic conservation, apricot tubulin genes exhibited distinct expression divergence across tissues, developmental stages, and apricot types, suggesting that duplicated tubulin members may have undergone functional partitioning during reproductive development. PaTUA1 was prioritized because it combined α-tubulin phylogenetic identity, conserved syntenic context, kernel-associated expression, genotype-dependent RT-qPCR dynamics, and the highest VIP score in the PLS-DA-based expression ranking. Thus, our prioritization reflects a combined biological and quantitative strategy rather than a simple descriptive selection; nevertheless, the VIP score ranks PaTUA1 within the analyzed expression dataset and does not demonstrate biological causality. This expression pattern is biologically meaningful because seed and kernel size are generally determined by coordinated cell proliferation, cell expansion, storage accumulation, and hormone-mediated developmental regulation [17,32]. Recent studies in cereal crops further support a direct connection between microtubule-related genes and seed/grain size. For example, the rice α-tubulin gene WG4 regulates grain shape by affecting cell expansion, whereas maize tubulin folding cofactor B is required for endosperm cell division and cell growth through maintaining microtubule homeostasis [8,9]. These findings provide comparative support for considering PaTUA1 a candidate, but they do not substitute for direct functional evidence in apricot. Moreover, because the transcriptome data were derived from bulk tissues, the observed expression values represent averages across multiple cell types and cannot resolve local cell-type-specific expression, hormone gradients, or mechanosensitive responses.
Transient overexpression of PaTUA1 provided preliminary evidence that this gene is associated with hormone-related responses during apricot kernel development. OE-PaTUA1 kernels showed increased average concentrations of IAA, GA3, BR, and cytokinins, especially during the early post-infiltration period. Such an association is plausible because plant microtubule arrays are increasingly recognized as dynamic regulatory hubs that integrate hormonal, mechanical, and cell wall-related signals during organ growth [6,7,29]. Cytokinin has been shown to guide microtubule dynamics during the transition from proliferative to differentiated cell states, while brassinosteroids influence cell expansion partly through their effects on microtubule organization, cell wall properties, and hormone crosstalk [33,34,35,36]. In addition, recent studies on seed size and yield regulation indicate that hormone signaling, particularly BR-related regulatory modules, can have substantial effects on grain size and yield-related traits [16,32]. Nevertheless, the present assay captures short-term responses in wounded and Agrobacterium-infiltrated bulk tissues, and the measured hormone values represent averages across heterogeneous kernel tissues. These measurements cannot distinguish whether the observed responses result from direct regulation by PaTUA1, indirect downstream effects, altered hormone synthesis, transport or degradation, or stress responses associated with wounding and Agrobacterium infiltration. Consequently, the current data do not demonstrate that PaTUA1 determines mature kernel size. Future studies should combine stable overexpression or gene silencing, microtubule cytological observation, in situ or cell-type-resolved expression analysis, measurements of cell number and cell size, hormone biosynthesis/metabolism gene analysis, and mature kernel phenotyping to determine whether PaTUA1 directly contributes to kernel enlargement. Overall, this study identifies PaTUA1 as a promising candidate gene associated with cytoskeleton-related and hormone-related responses during apricot kernel development that warrants further functional investigation.

5. Conclusions

This study identified 2535 tubulin-related genes from 97 plant genomes and resolved them into four ancient clades: α-, β-, γ-tubulin, and FtsZ. Comparative phylogenomic, selection-pressure, and synteny analyses revealed a conserved but differentially expanded tubulin gene family, with α- and β-tubulin copy-number patterns broadly consistent with ancient polyploidization history. Rosaceae microsynteny, gene expression profiling, and PLS-DA/VIP-based ranking further highlighted PaTUA1 as a priority α-tubulin candidate associated with apricot kernel development. Transient overexpression of PaTUA1 in wounded developing kernels was associated with short-term changes in average phytohormone accumulation across bulk kernel tissues. Taken together, PaTUA1 should be regarded as a promising candidate gene associated with hormone-related responses during apricot kernel development, and its causal role in kernel growth, mature kernel size, and potential effects in other organs requires further functional validation.

Supplementary Materials

The following supporting information can be downloaded at: https://www.mdpi.com/article/10.3390/horticulturae12070837/s1, Table S1: Taxonomic classification of the 97 species; Table S2: Gene family members identified in different species; Table S3: Ka, Ks, and Ka/Ks values of syntenic tubulin gene pairs across plant genomes; Table S4: Variable importance in projection (VIP) scores of apricot tubulin genes used for candidate-gene prioritization during kernel development.

Author Contributions

Conceptualization, Y.Y. and T.W.; Methodology, K.Y. and Y.Y.; Software, K.Y. and H.L. (Huimin Liu); Validation, K.Y., H.L. (Hui Li), N.J., L.W. and H.L. (Huimin Liu); Formal Analysis, K.Y.; Investigation, K.Y., N.J., L.W. and H.L. (Hui Li); Resources, Y.Y. and T.W.; Data Curation, K.Y.; Writing—Original Draft Preparation, K.Y.; Writing—Review & Editing, Y.Y. and T.W.; Visualization, K.Y.; Supervision, Y.Y. and T.W.; Project Administration, Y.Y.; Funding Acquisition, Y.Y. All authors have read and agreed to the published version of the manuscript.

Funding

This work was supported by the Science and Technology Research Project of Henan Province (Grant No. 262102111154); The Project Supported by National Natural Science Foundation of China (Grant No. U2571221).

Institutional Review Board Statement

Not applicable.

Informed Consent Statement

Not applicable.

Data Availability Statement

All data are displayed in the manuscript and Supplementary Files.

Acknowledgments

During the preparation and revision of this manuscript, the authors used OpenAI ChatGPT 5.5 and Google Gemini 3.1 Pro for writing-related assistance, including language polishing, improvement of sentence clarity and structure, organization of writing logic, and refinement of the manuscript according to reviewers’ comments. The authors have reviewed and edited the output and take full responsibility for the content of this publication.

Conflicts of Interest

The authors declare no conflict of interest.

References

  1. Chumová, J.; Kourová, H.; Trögelová, L.; Daniel, G.; Binarová, P. γ-Tubulin Complexes and Fibrillar Arrays: Two Conserved High Molecular Forms with Many Cellular Functions. Cells 2021, 10, 776. [Google Scholar] [CrossRef] [PubMed]
  2. Liu, B.; Lee, Y.-R.J. Spindle assembly and mitosis in plants. Annu. Rev. Plant Biol. 2022, 73, 227–254. [Google Scholar] [CrossRef] [PubMed]
  3. Hsiao, A.-S.; Huang, J.-Y. Microtubule regulation in plants: From morphological development to stress adaptation. Biomolecules 2023, 13, 627. [Google Scholar] [CrossRef] [PubMed]
  4. Liu, M.; Yu, J.; Yang, M.; Cao, L.; Chen, C. Adaptive evolution of chloroplast division mechanisms during plant terrestrialization. Cell Rep. 2024, 43, 113521. [Google Scholar] [CrossRef]
  5. Bao, Z.; Xu, Z.; Zang, J.; Bürstenbinder, K.; Wang, P. The morphological diversity of plant organs: Manipulating the organization of microtubules may do the trick. Front. Cell Dev. Biol. 2021, 9, 647021. [Google Scholar] [CrossRef] [PubMed]
  6. Stöckle, D.; Reyes-Hernández, B.J.; Barro, A.V.; Nenadic, M.; Winter, Z.; Marc-Martin, S.; Bald, L.; Ursache, R.; Fujita, S.; Maizel, A.; et al. Microtubule-based perception of mechanical conflicts controls plant organ morphogenesis. Sci. Adv. 2022, 8, eabm4974. [Google Scholar] [CrossRef] [PubMed]
  7. Yan, Y.; Sun, Z.; Yan, P.; Wang, T.; Zhang, Y. Mechanical regulation of cortical microtubules in plant cells. N. Phytol. 2023, 239, 1609–1621. [Google Scholar] [CrossRef]
  8. Liu, Y.; Guo, L.; Qu, G.; Xiang, Y.; Zhao, X.; Yuan, H.; Li, T.; Kang, L.; Tang, S.; Tu, B.; et al. Wide grain 4, encoding an alpha-tubulin, regulates grain size by affecting cell expansion in rice. Crop J. 2023, 11, 1931–1936. [Google Scholar] [CrossRef]
  9. Zhou, Q.; Fu, Z.; Li, M.; Shen, Q.; Sun, C.; Feng, Y.; Liu, Y.; Jiang, J.; Qin, T.; Mao, T.; et al. Maize tubulin folding cofactor B is required for cell division and cell growth through modulating microtubule homeostasis. N. Phytol. 2023, 239, 1707–1722. [Google Scholar] [CrossRef]
  10. Van de Peer, Y.; Ashman, T.-L.; Soltis, P.S.; Soltis, D.E. Polyploidy: An evolutionary and ecological force in stressful times. Plant Cell. 2021, 33, 11–26. [Google Scholar] [CrossRef] [PubMed]
  11. Almeida-Silva, F.; Van de Peer, Y. Whole-genome duplications and the long-term evolution of gene regulatory networks in angiosperms. Mol. Biol. Evol. 2023, 40, msad141. [Google Scholar] [PubMed]
  12. Feng, X.; Chen, Q.; Wu, W.; Wang, J.; Li, G.; Xu, S.; Shao, S.; Liu, M.; Zhong, C.; Wu, C.-I.; et al. Genomic evidence for rediploidization and adaptive evolution following the whole-genome triplication. Nat. Commun. 2024, 15, 1635. [Google Scholar] [CrossRef] [PubMed]
  13. Groppi, A.; Liu, S.; Cornille, A.; Decroocq, S.P.; Bui, Q.T.; Tricon, D.; Cruaud, C.; Arribat, S.; Belser, C.; Marande, W.; et al. Population genomics of apricots unravels domestication history and adaptive events. Nat. Commun. 2021, 12, 3956. [Google Scholar] [CrossRef] [PubMed]
  14. Zhang, Y.; Bao, W.; Wuyun, T.-N.; Huang, M.; Chen, C.; Ao, D.; Yang, R.; Huang, H.; Wang, L. Transcriptome analysis reveals genes associated with the bitter-sweet trait of apricot kernels. For. Res. 2024, 4, e007. [Google Scholar] [CrossRef]
  15. Zhang, D.; Zhao, Z. Selection of key genes for apricot kernel oil synthesis based on transcriptome analysis. Foods 2025, 14, 568. [Google Scholar] [CrossRef] [PubMed]
  16. Tang, S.; Zhao, Z.; Liu, X.; Sui, Y.; Zhang, D.; Zhi, H.; Gao, Y.; Zhang, H.; Zhang, L.; Wang, Y.; et al. An E2–E3 pair contributes to seed size control in grain crops. Nat. Commun. 2023, 14, 3091. [Google Scholar] [PubMed]
  17. Boccaccini, A.; Cimini, S.; Kazmi, H.; Lepri, A.; Longo, C.; Lorrai, R.; Vittorioso, P. When size matters: New insights on how seed size can contribute to the early stages of plant development. Plants 2024, 13, 1793. [Google Scholar] [CrossRef] [PubMed]
  18. Mistry, J.; Chuguransky, S.; Williams, L.; Qureshi, M.; Salazar, G.A.; Sonnhammer, E.L.L.; Tosatto, S.C.E.; Paladin, L.; Raj, S.; Richardson, L.J.; et al. Pfam: The protein families database in 2021. Nucleic Acids Res. 2021, 49, D412–D419. [Google Scholar] [PubMed]
  19. Katoh, K.; Standley, D.M. MAFFT multiple sequence alignment software version 7: Improvements in performance and usability. Mol. Biol. Evol. 2013, 30, 772–780. [Google Scholar] [CrossRef] [PubMed]
  20. Capella-Gutiérrez, S.; Silla-Martínez, J.M.; Gabaldón, T. trimAl: A tool for automated alignment trimming in large-scale phylogenetic analyses. Bioinformatics 2009, 25, 1972–1973. [Google Scholar] [CrossRef] [PubMed]
  21. Nguyen, L.-T.; Schmidt, H.A.; von Haeseler, A.; Minh, B.Q. IQ-TREE: A fast and effective stochastic algorithm for estimating maximum-likelihood phylogenies. Mol. Biol. Evol. 2015, 32, 268–274. [Google Scholar] [PubMed]
  22. Gamboa-Tuz, S.D.; Pereira-Santana, A.; Zhao, T.; Schranz, M.E. Applying synteny networks (SynNet) to study genomic arrangements of protein-coding genes in plants. In Plant Comparative Genomics; Springer: Cham, Switzerland, 2022; pp. 199–215. [Google Scholar]
  23. Buchfink, B.; Reuter, K.; Drost, H.-G. Sensitive protein alignments at tree-of-life scale using DIAMOND. Nat. Methods. 2021, 18, 366–368. [Google Scholar] [PubMed]
  24. Wang, Y.; Tang, H.; DeBarry, J.D.; Tan, X.; Li, J.; Wang, X.; Lee, T.-H.; Jin, H.; Marler, B.; Guo, H.; et al. MCScanX: A toolkit for detection and evolutionary analysis of gene synteny and collinearity. Nucleic Acids Res. 2012, 40, e49. [Google Scholar] [CrossRef] [PubMed]
  25. Zhang, Z.; Li, J.; Zhao, X.-Q.; Wang, J.; Wong, G.K.-S.; Yu, J. KaKs_Calculator: Calculating Ka and Ks through model selection and model averaging. Genom. Proteom. Bioinform. 2006, 4, 259–263. [Google Scholar]
  26. Chen, T.; Chen, X.; Zhang, S.; Zhu, J.; Tang, B.; Wang, A.; Dong, L.; Zhang, Z.; Yu, C.; Sun, Y.; et al. The genome sequence archive family: Toward explosive data growth and diverse data types. Genom. Proteom. Bioinform. 2021, 19, 578–583. [Google Scholar] [CrossRef]
  27. Yang, Y.; Chen, M.; Zhu, Q.; Lv, Y.; Liu, C.; Wei, Y.; Cha, G.; Shi, X.; Ren, X.; Ding, Y. The transcription factors AdNAC3 and AdMYB19 regulate kiwifruit ripening through brassinosteroid and ethylene signaling networks. Plant Physiol. 2025, 197, kiaf084. [Google Scholar] [PubMed]
  28. Liu, R.; Wu, M.; Liu, H.-L.; Gao, Y.-M.; Chen, J.; Yan, H.-W.; Xiang, Y. Genome-wide identification and expression analysis of the NF-Y transcription factor family in Populus. Physiol. Plant. 2021, 171, 309–327. [Google Scholar] [PubMed]
  29. Yagi, N.; Fujita, S.; Nakamura, M. Plant microtubule nucleating apparatus and its potential signaling pathway. Curr. Opin. Plant Biol. 2024, 82, 102624. [Google Scholar] [CrossRef] [PubMed]
  30. Jiao, Y.; Leebens-Mack, J.; Ayyampalayam, S.; Bowers, J.E.; McKain, M.R.; McNeal, J.; Rolf, M.; Ruzicka, D.R.; Wafula, E.; Wickett, N.J.; et al. A genome triplication associated with early diversification of the core eudicots. Genome Biol. 2012, 13, R3. [Google Scholar] [CrossRef] [PubMed]
  31. Panchy, N.; Lehti-Shiu, M.; Shiu, S.-H. Evolution of gene duplication in plants. Plant Physiol. 2016, 171, 2294–2316. [Google Scholar] [CrossRef] [PubMed]
  32. Jiang, S.; Wu, L.; Huang, L.; Li, Y. Genetic and molecular mechanisms of phytohormone-mediated seed size control in crops. J. Genet. Genom. 2025, 52, 1460–1474. [Google Scholar] [CrossRef]
  33. Montesinos, J.C.; Abuzeineh, A.; Kopf, A.; Juanes-García, A.; Ötvös, K.; Petrášek, J.; Sixt, M.; Benková, E. Phytohormone cytokinin guides microtubule dynamics during cell progression from proliferative to differentiated stage. EMBO J. 2020, 39, EMBJ2019104238. [Google Scholar] [CrossRef]
  34. Ackerman-Lavert, M.; Savaldi-Goldstein, S. Growth models from a brassinosteroid perspective. Curr. Opin. Plant Biol. 2020, 53, 90–97. [Google Scholar] [CrossRef] [PubMed]
  35. Aryal, D.; Alferez, F. Brassinosteroids: Biosynthesis, signaling, and hormonal crosstalk as related to fruit yield and quality. Plants 2025, 14, 1865. [Google Scholar] [CrossRef] [PubMed]
  36. Wang, J.; Wang, G.; Liu, W.; Yang, H.; Wang, C.; Chen, W.; Zhang, X.; Tian, J.; Yu, Y.; Li, J.; et al. Brassinosteroid signals cooperate with katanin-mediated microtubule severing to control stamen filament elongation. EMBO J. 2022, 42, EMBJ2022111883. [Google Scholar]
Figure 1. Phylogenetic relationships and copy number distribution of the tubulin gene family across plant lineages. (A) Unrooted maximum-likelihood (ML) phylogenetic tree of the tubulin gene family. The terminal branches are clustered into four distinct clades: Clade I (α-tubulin,), Clade II (β-tubulin,), Clade III (γ-tubulin), and Clade IV (FtsZ). Numbers on the branches indicate high-confidence bootstrap support values. (B) Copy-number variations of tubulin clades mapped onto the species phylogeny. The species tree on the left illustrates the evolutionary relationships among the representative plant genomes. Red and blue star symbols mapped on the branches indicate major whole-genome duplication (WGD) and whole-genome triplication (WGT) events, respectively (e.g., ρ WGD, γ WGT, τ WGD, and α/β WGD). The central heatmap displays the gene copy numbers for Clades I to IV within each species. The grayscale intensity corresponds to the degree of gene enrichment. The rightmost color blocks categorize the species into major evolutionary lineages, advancing from Algae, Bryophytes, Lycophytes, Basal Angiosperms, Monocots, to Eudicots.
Horticulturae 12 00837 g001
Figure 2. Evolutionary selection pressure and phylogenomic synteny network of the tubulin gene family. (AC) Distribution of the non-synonymous substitution rate (Ka) (A) synonymous substitution rate (Ks) (B), and Ka/Ks ratio (C) for duplicated tubulin gene pairs within the four defined clades (α-tubulin, β-tubulin, γ-tubulin, and FtsZ). Each dot represents an individual paralogous gene pair. Black horizontal lines indicate the mean values. Statistical significance was evaluated by one-way ANOVA followed by Tukey’s HSD multiple-comparison test. ** p < 0.01, *** p < 0.001; ns, not significant. The uniformly low Ka/Ks ratios (< 1) across all clades indicate predominant purifying selection. (D) Global phylogenomic synteny network of tubulin genes across 97 plant genomes. Each node represents a tubulin gene, and edges connect syntenic homologous gene pairs identified by collinearity analysis.
Horticulturae 12 00837 g002
Figure 3. Phylogenetic reconstruction and complex synteny network of the tubulin gene family in Rosaceae. (A) phylogenetic tree of tubulin proteins identified from 12 representative Rosaceae genomes. The distinct colored ranges indicate the four conserved subfamilies: Clade I (α-tubulin, purple), Clade II (β-tubulin, blue), Clade III (γ-tubulin, pink), and Clade IV (FtsZ, yellow). (B) Pyramid-structured dual synteny analysis centering on Prunus armeniaca (apricot). The plot illustrates the collinear relationships between the P. armeniaca genome (center) and other representative species, including Pyrus communis, Fragaria vesca, Prunus mume, and Prunus salicina (top panel), as well as Prunus persica, Malus domestica, and the model plant Arabidopsis thaliana (bottom panel). Gray lines in the background denote genome-wide collinear blocks, whereas the prominent red lines specifically trace the syntenic tubulin gene pairs, highlighting cross-species orthology and chromosomal rearrangements.
Horticulturae 12 00837 g003
Figure 4. Spatiotemporal expression profiles of tubulin genes and identification of key candidates involved in apricot kernel development. (A) Heatmap showing the expression patterns of tubulin genes during kernel developmental stages (25 to 93 d after anthesis) in Siberian apricot and Kernel apricot. The green dashed box highlights a cluster of genes exhibiting specific high expression during the early-to-mid stages of kernel development in Kernel apricot. The candidate gene PaTUA1 is highlighted in red. (B) Expression profiles of tubulin genes during fruit developmental stages across three apricot ecotypes (Common apricot, Siberian apricot, and Kernel apricot). (C) Tissue-specific expression patterns (flower bud, leaf, and flower) among the three apricot ecotypes. The color scale (Row Z-score) indicates low (blue) to high (red) expression levels.The font colors on the x-axis represent the different apricot ecotypes: yellow for Common apricot, green for Siberian apricot, and red for Kernel apricot. (D) RT-qPCR was performed to validate the relative expression of PaTUA1 during kernel development. Samples were collected at eight developmental stages (S1–S8), corresponding to 20, 25, 30, 40, 50, 60, 80 and 100 days after flowering (DAF), respectively. Two apricot cultivars with contrasting kernel sizes, Longwangmao (LMW; large-kernel) and PT6 (small-kernel) were evaluated. Data represent the means ± SD. The least significant difference (LSD0.05) is indicated.
Horticulturae 12 00837 g004
Figure 5. Transient overexpression of PaTUA1 in wounded apricot kernels and its association with endogenous phytohormone accumulation. (A) Schematic diagram illustrating the agroinfiltration method for transient gene expression in the developing apricot kernel. (B) RT-qPCR validation of PaTUA1 relative expression levels at 0, 1, 2, 3, and 4 d post-infiltration. The red line represents the OE-PaTUA1 group, while the black line denotes the empty vector control. (CG) Dynamic changes in average phytohormone concentrations measured from bulk kernel tissues following infiltration: (C) Indole-3-acetic acid (IAA), (D) Cytokinins (CTK), (E) Gibberellin A3 (GA3), (F) Brassinosteroids (BR), and (G) Zeatin (ZT). Data represent means ± SD from three biological replicates, with five kernels pooled per replicate. Asterisks indicate statistically significant differences between the OE-PaTUA1 and the control groups at the corresponding time points, as determined by Student’s t-test (*** p < 0.001).
Horticulturae 12 00837 g005
Disclaimer/Publisher’s Note: The statements, opinions and data contained in all publications are solely those of the individual author(s) and contributor(s) and not of MDPI and/or the editor(s). MDPI and/or the editor(s) disclaim responsibility for any injury to people or property resulting from any ideas, methods, instructions or products referred to in the content.