Article

Pre-Harvest Seaweed Biostimulant Applications: Optimizing Concentration, Timing, and Frequency for Cultivar-Specific Improvements in Potato Yield and Quality


1
Academy of Agriculture and Forestry Sciences, Qinghai University, No. 251 Ningda Road, Xining 810016, China
2
Laboratory of Qinghai-Xizang Plateau Biotechnology (Qinghai University), Ministry of Education, No. 251 Ningda Road, Xining 810016, China
3
Engineering Research Center of Potato in Northwest Region, Ministry of Education, No. 251 Ningda Road, Xining 810016, China
4
Laboratory for Research and Utilization of Qinghai Xizang Plateau Germplasm Resources, No. 253 Ningda Road, Xining 810016, China
*
Authors to whom correspondence should be addressed.
These authors contributed equally to this work.
Horticulturae 2026, 12(7), 836; https://doi.org/10.3390/horticulturae12070836 (registering DOI)
Submission received: 26 May 2026 / Revised: 5 July 2026 / Accepted: 7 July 2026 / Published: 8 July 2026

Abstract

The aim of this study was to optimize the pre-harvest application of seaweed-based biostimulants (BIOs) to improve potato yield, quality, and post-storage attributes. To achieve this, six potato cultivars differing in maturity periods were subjected to three BIO concentrations (2.4, 7.2, and 9.6 g/L), application timings (from planting to post-bloom), and frequencies (1–4 applications). The results indicated that BIO efficacy was strongly cultivar-specific. Responsive cultivars (such as ‘Minshu No. 1’, ‘Leshu No. 1’, ‘Xiazhai 65’, and ‘Qingshu No. 2’) showed significant yield increases when treated with 7.2 or 9.6 g/L BIO applied 3 to 4 times during key developmental stages (from seedling to 3 weeks after full bloom). In contrast, ‘Qingshu No. 10’ and ‘Qingshu No. 9’ exhibited no significant response. Post-storage analysis revealed that optimal BIO treatments in responsive cultivars (‘Minshu No. 1’ and ‘Xiazhai 65’) delayed the losses in dry matter content and starch content after 3 months of storage at 7.5 °C. Furthermore, BIO application significantly enhanced the uptake of potassium (K) in ‘Minshu No. 1’, ‘Xiazhai 65’, and ‘Qingshu No. 2’ potatoes. In conclusion, applying 7.2 g/L BIO three times during the seedling to post-bloom period is a potential strategy to enhance yield and quality for responsive early- and mid-maturing potato cultivars, offering a targeted solution for sustainable potato production.

1. Introduction

Potatoes (Solanum tuberosum L.) are valued for their large tuber size, uniform shape, golden-brown skin color, starchy texture, and versatile culinary applications, traits widely preferred by consumers [1,2,3]. For farmers and processors, ideal potato cultivars should combine high yield, resistance to mechanical damage during harvest and handling, and prolonged storage stability to prevent sprouting or sugar accumulation [4,5,6]. However, potatoes were prone to post-harvest deterioration, including weight loss, fungal infections, and cold-induced sweetening [7,8]. Furthermore, extended storage periods exacerbated tuber softening, surface browning, and glycoalkaloid accumulation, significantly reducing marketability in supply chains [9]. Therefore, the key challenge lied in achieving rapid growth maturity, maintaining firmness and low reducing sugar content after storage, and minimizing physiological disorders while extending shelf life. The pre-harvest application of biostimulants (BIOs) might offer viable solutions to these industry demands.
BIOs are a diverse group of materials with various origins (including microbial, plant, and seaweed extracts) and modes of action. Unlike traditional fertilizers, which provide essential nutrients, BIOs enhance plant nutritional efficiency, improve tolerance to abiotic stress, and increase crop quality and yield [10]. Seaweed-based BIOs, derived from Ascophyllum nodosum, Ecklonia maxima, Laminaria spp., and Sargassum, are among the most widely recognized and commercially available BIOs. These extracts contain complex mixtures of natural compounds, including polysaccharides, phenolics, cytokinins, betaines, and trace elements [11,12,13]. The mechanisms of action of BIOs include the stimulation of root development, enhancement of nutrient uptake efficiency, modulation of phytohormone balance, and activation of antioxidant defense systems to mitigate stress responses [14]. In agricultural practice, BIOs are typically applied via foliar spraying or soil drenching. Foliar application is particularly popular due to its rapid absorption through the leaf cuticle and stomata, allowing for precise timing relative to critical growth stages [11,12,13]. Common BIO application concentrations range from 1 to 10 g/L, with frequencies varying from single applications to repeated sprays every 2–3 weeks, depending on the specific product label and crop requirements. In potatoes, a study reported that the pre-harvest foliar application of 10 g/L BIO extracted from brown alga (Phaeophyceae) increased tuber yield and improved nitrogen (N) uptake in the ‘Satina’, ‘Sylvana’, and ‘Volumia’ potato cultivars [14]. Similarly, BIO treatments on ‘Maris Piper’ potatoes enhanced tuber yield by 33% [15]. By contrast, a recent study reported that BIO sprays failed to affect dry matter, protein, total sugars, monosaccharides, sucrose, and L-ascorbic acid content in three early-maturing ‘Denar’, ‘Lord’, and ‘Miłek’ potato cultivars [16]. Notably, field trials with the cultivar ‘Irga’ revealed that the BIO extracted from Ascophyllum nodosum and Ecklonia maxima not only reduced the incidence of early blight but also enhanced medium-sized tubers [17]. Taken together, these findings suggested that pre-harvest BIO sprays might serve as a sustainable strategy to optimize tuber quality attributes, extend storability, and enhance stress resilience in potatoes, though cultivar-specific responses and environmental interactions require further investigation.
However, despite these promising laboratory and small-scale field results, there is a lack of standardized, large-scale commercial protocols for using BIOs on potatoes. Furthermore, there is little information available on whether factors such as cultivar, application concentration, frequency, and timing collectively impact the efficacy of BIO spraying. Given the variability in biological responses to BIOs, understanding these interactions was critical for practical implementation. Therefore, the first objective of this study was to evaluate the cultivar-specific responses and optimal application concentration, frequency, and timing of seaweed-based BIOs in potato cultivation, addressing the current knowledge gap in practical implementation guidelines for growers. The second objective of this study was to investigate the efficacy of pre-harvest BIO sprays in improving the quality and nutrient uptake of potatoes at harvest and post-harvest quality and physiological disorders. The final goal was to provide growers with useful guidance for spraying BIOs on potatoes.

2. Materials and Methods

2.1. Plant Material

Experiments were conducted at the Experiment Field of the Academy of Agriculture and Forestry Sciences of Qinghai University, located in Xining, Qinghai, China (36.73° N, 101.75° W, elevation 2314 m, average annual rainfall about 500 mm). The soil type at the experimental field is classified as chestnut soil (semi-arid regions characterized by moderate organic matter, good drainage, and a calcic horizon) with slight alkalinity (pH 7.5–8.5). No irrigation was performed in the field. Standard fertilization (136.5 kg/ha of actual N was applied once before planting), pesticide, and herbicide practices were conducted on all plants. The meteorological data during the 2022–2024 growing seasons are summarized in Supplemental S1.
Seaweed-based BIOs (Stimplex®, included 99.99% Ascophyllum nodosum extract, Acadian Seaplants Limited, Dartmouth, NS, Canada) were used in this study. The concentrations of BIOs were expressed as active ingredients. Each row was sprayed using an electric sprayer (Model CZ0001, Wuyi Zhipu E-Commerce Co., Jinhua, China) with an 18 L plastic container. Spraying was conducted when the outdoor temperature was below 27 °C, and applications were performed when rainfall was not predicted in 24 h. Six potato cultivars were selected based on their maturity periods: early-maturing ‘Minshu No. 1’ (85 days to maturity), mid-maturing ‘Leshu No. 1’ (100 d to maturity) and ‘Xiazhai 65’ (110 d to maturity), and late-maturing ‘Qingshu No. 2’ (115 d to maturity), ‘Qingshu No. 10’ (120 d to maturity), and ‘Qingshu No. 9’ (135 d to maturity). Harvest times corresponded directly to these maturity indicators to ensure physiological comparability across treatments.

2.2. Experimental Designs

To optimize BIO application strategies, a sequential experimental approach was adopted. First, Experiment 1 screened the optimal concentration and frequency using late-maturing cultivars to identify baseline responses. Second, Experiment 2 evaluated the optimal timing and frequency for early-, mid-, and late-maturing cultivars, focusing on those showing positive responses in Experiment 1. Finally, Experiment 3 refined the parameters for the responsive or non-responsive cultivars by testing higher concentrations and frequencies. All experiments utilized a completely randomized design with three replicates per treatment. The specific treatments applied in each experiment are summarized in Table 1.

2.2.1. Experiment 1: Optimum BIO Concentration and Frequency

In 2022, three late-maturing potato cultivars (‘Qingshu No. 2’, ‘Qingshu No. 10’, and ‘Qingshu No. 9’) were selected. The concentrations of 2.4 and 7.2 g/L were chosen based on Stimplex® label reports indicating the effective minimum and maximum ranges for BIO application. These concentrations are well below the levels typically required for direct fertilizing effects (which often require > 50 g/L for macronutrients), ensuring that the observed effects are due to BIOs rather than nutrient supply. The treatments with three replicates of three plots each (one plot including three rows [25 plants per row], 7 m long and 6 m wide) were treated as follows: (1) control: untreated plants; (2) 2.4 g/L BIO 1: BIO was applied once (June 28) after 6 weeks of planting; (3) 2.4 g/L BIO 2: BIO was applied twice (June 28 and July 18) after 6 and 9 weeks of planting; (4) 2.4 g/L BIO 3: BIO was applied 3 times after 6, 9, and 12 (June 28, July, and August 8) weeks of planting; (5) 7.2 g/L BIO 1: BIO was applied once after 6 weeks of planting; (6) 7.2 g/L BIO 2: BIO was applied twice after 6 and 9 weeks of planting; (7) 7.2 g/L BIO 3: BIO was applied three times after 6, 9, and 12 weeks of planting. At harvest, plants were manually uprooted using a shovel, ensuring a consistent digging depth of 0.2–0.3 m to avoid tuber damage. Tubers were carefully extracted, and adhering soil was removed by gentle brushing. The total yield, tuber weight distribution, dry matter content, starch content, and reducing sugar content were evaluated. After storing at 7.5 °C and 90% relative humidity (RH) for 3 months, the dry matter content, starch content, reducing sugar content, and incidences of decay and sprouting were determined.

2.2.2. Experiment 2: Optimum BIO Frequency and Timing

Based on the results of Experiment 1, ‘Qingshu No. 2’ had a high response to 7.2 g/L, but not in ‘Qingshu No. 10’ and ‘Qingshu No. 9’, which had a long development period. Therefore, the early-maturing ‘Minshu No. 1’ and mid-maturing ‘Leshu No. 1’ and ‘Xiazhai 65’ potato cultivars and the BIO concentration of 7.2 g/L were taken into consideration in this experiment. The treatments in 2023 included: (1) control: untreated plants; (2) BIO T1: BIO was applied once at planting (April 27); (3) BIO T2: BIO was applied once at full bloom (FB, June 25 for ‘Minshu No. 1’, June 30 for ‘Leshu No. 1’, June 30 for ‘Xiazhai 65’, and July 10 for ‘Qingshu No. 2’); (4) BIO T3: BIO was applied once at 3 weeks after FB; (5) BIO T1 + T2: BIO was applied twice at planting and FB; (6) BIO T2 + T3: BIO was applied twice at FB and 3 weeks after FB; (7) BIO T1 + T2 + T3: BIO was applied three times at planting, FB, and 3 weeks after FB. The harvest and storage evaluation was performed as described in Experiment 1.

2.2.3. Experiment 3: Optimization of Cultivar Response and Application Intensity

The responsive cultivars from previous experiments, such as ’Minshu No. 1’, ‘Xiazhai 65’, and ‘Qingshu No. 2’, and non-responsive cultivars, such as ‘Qingshu No. 9’, were selected. This experiment aimed to determine if higher concentrations or additional applications would further enhance yield. Treatments in 2024 included: (1) control: untreated plants; (2) 7.2 g/L BIO 3: 7.2 g/L BIO was applied three times at seedling (June 5), FB (June 26 for ‘Minshu No. 1’, June 26 for ‘Xiazhai 65’, July 1 for ‘Qingshu No. 2’, and July 1 for ‘Qingshu No. 9’), and 3 weeks after FB; (3) 9.6 g/L BIO 3: 9.6 g/L BIO was applied three times at seedling, FB, and 3 weeks after FB; (4) 7.2 g/L BIO 4a: 7.2 g/L BIO was applied four times at seedling, 10 d after seedling, FB, and 3 weeks after FB; (5) 7.2 g/L BIO 4b: 7.2 g/L BIO was applied four times at seedling, FB, 10 d after FB, and 3 weeks after FB. The harvest and storage evaluation was performed as described in Experiment 1. Additionally, the nutrients of the tuber were determined at harvest.

2.3. Evaluations of Total Yield and Tuber Weight Distribution

The total yield (TY) per plot was determined by weighing all tubers. Data were expressed in kg/plot based on the plot area. After weighing, all tubers in each treatment per replicate were graded into three size classes based on diameter and weight: small: diameter < 40 mm or weight < 150 g; medium: diameter 40–60 mm or weight 150–250 g; large: diameter > 60 mm or weight > 250 g. The weight of tubers in each size class was recorded. Tuber weight distribution was expressed as the percentage by weight [17]. From the medium class, 70 uniform tubers per replicate were randomly selected and stored for subsequent quality evaluations.

2.4. Evaluations of Dry Matter Content, Total Starch Content, and Reducing Sugar Content

One hundred grams of sliced samples from 10 tubers in each treatment per replicate was cut using a stainless-steel slicer and immediately weighed, then placed in pre-weighted aluminum trays. Samples were dried in a forced-air electric oven for 24 h at 75 °C until constant weight. The dry matter content (DMC) was expressed as the percentage residue of the sample after drying [18].
To measure the starch content (SC) [19], 0.5 g of samples from 10 tubers in each treatment per replicate was homogenized in 2 mL of distilled water and then centrifuged at 5,000 g for 20 min at 4 °C. The supernatant was collected for assaying the reducing sugar content. The residue was added to 4 mL 80% (v/v) ethanol and re-centrifuged. Next, the residue was treated with 2.5 mL 80% (v/v) ethanol and placed at 80 °C for 30 min, then re-centrifuged. Finally, 0.5 mL of distilled water and 4.5 mL of 52% (v/v) perchloric acid were added to the residue, then boiled for 15 min. The supernatant was diluted 50-fold with distilled water. A 0.2 mL aliquot was added to 0.4 mL of distilled water and 3.6 mL of the reaction solution containing 88% (v/v) H2SO4 and 0.32% (w/v) anthrone, then boiled for 5 min. The absorbance at 620 nm was then measured using a UV/visible spectrophotometer (Model T6, Purkinje General Instrument Co., Beijing, China). Glucose was used to create a standard calibration curve, and the data were presented as the percentage starch of the sample on a fresh weight basis.
To determine the reducing sugar content (RSC) [19], 0.35 mL of the supernatant from the initial centrifugation step (total starch analysis) was added to 1.65 mL of distilled water and 2 mL of the reaction solution containing 1% (w/v) 3,5-dinitrosalicylic acid, 30% (w/v) Rochelle salt, and 1.6% (w/v) NaOH, then boiled for 5 min. The absorbance at 540 nm was then measured. Glucose was used to create a standard calibration curve, and the data were presented as mg/glucose equivalent (GE) kg on a fresh weight basis.

2.5. Evaluations of Decay and Sprouting Incidences

After storage, fifty tubers from each treatment per replicate were transferred to a dark room at 20 °C with 60% RH for sprouting evaluation. Decay incidence was assessed immediately after removal from storage and was defined as the percentage of tubers showing any visible pathological lesions or surface blemishes on the tuber surface. Sprouting incidence was determined after 7 d of storage at 20 °C and was defined as the percentage of tubers developing sprouts with a minimum length of >2 mm.

2.6. Determination of Nutrients

For Experiment 3, 10 tubers from each treatment per replicate were cut and washed, oven-dried at 65 °C, and ground to pass through a 2 mm sieve. After digesting in a microwave system using nitric acid and hydrogen peroxide, an inductive coupled plasma optical emission spectrometer (Model 725, Agilent Technologies, Santa Clara, CA, USA) was used to determine the potassium (K), calcium (Ca), magnesium (Mg), ferric (Fe), and zinc (Zn) content of the sample. Data were expressed on a dry weight basis as mg/kg.

2.7. Statistical Analysis

Experiments were performed using a completely randomized design. The analysis of variance (ANOVA) was carried out to assess the significant differences in the data using Tukey’s honestly significant difference (HSD) test at p < 0.05. The analyses were conducted using 19.0 IBM SPSS Statistics software (IBM Co., Armonk, NY, USA). Origin software (version 2021b, OriginLab, Northampton, MA, USA) was used for the principal component analysis (PCA). The PCA was conducted among total yield (TY), small-size weight (SSW), medium-size weight (MSW), large-size weight (LSW), dry matter content at harvest (DMC-H), starch content at harvest (SC-H), reducing sugar content at harvest (RSC-H), dry matter content after storage (DMC-AS), starch content after storage (SC-AS), reducing sugar content after storage (RSC-AS), decay, sprouting, K, Ca, Mg, Fe, and Zn. Principal components with variances of under 10% or eigenvalues of under 1.0 were dropped from the data.

3. Results

3.1. Effects of Application Concentration and Frequency of BIO on Late-Maturing Potato Cultivars at Harvest and After Storage

For the harvest evaluation (Table 2), the application of 2.4 or 7.2 g/L BIO either once (after 6 weeks of planting) or twice (after 6 and 9 weeks of planting) had no effect on TY, medium-tuber weight, DMC, SC, or RSC in ‘Qingshu No. 2’ potatoes. However, three applications of 7.2 g/L BIO significantly increased TY and small-tuber weight, while decreasing large-tuber weight. For ‘Qingshu No. 10’ potatoes, no significant difference was observed in TY, medium-tuber weight, DMC, or SC between the control and any BIO treatment. However, three applications of both 2.4 and 7.2 g/L BIO resulted in higher RSC, but lower large-tuber weight compared to the control. For ‘Qingshu No. 9’ potatoes, no significant difference was observed in any evaluation attribute between the control and each BIO treatment.
For the post-harvest evaluation (Table 3), no significant difference was found in DMC, SC, RSC, decay incidence, or sprouting incidence of ‘Qingshu No. 2’, ‘Qingshu No. 10’, and ‘Qingshu No. 9’ potatoes between the control and any BIO treatment.

3.2. Effects of Application Frequency and Timing of BIO on Early-, Mid-, and Late-Maturing Potato Cultivars at Harvest and After Storage

For the harvest evaluation (Table 4), single (T1, T2, and T3) or split (T1 + T2 and T2 + T3) applications of 7.2 g/L BIO had no effect on TY, small/medium-tuber weight, DMA, SC, or RSC in ‘Minshu No. 1’ potatoes. However, the three applications (T1 + T2 + T3) of BIO significantly increased TY and larger-tuber weight. For ‘Leshu No. 1’ potatoes, BIO treatment did not affect the small/large-tuber weight, DMA, SC, or RSC. However, three applications and BIO T3 resulted in higher medium-tuber weight compared to the control. Furthermore, a significantly higher TY was observed in the BIO T2, T3, and T1 + T2 + T3 treatments compared to the control. For ‘Xiazhai 65’ potatoes, no significant difference was observed in yield, tuber weight distribution, or quality between the control and any BIO treatment. For ‘Qingshu No. 2’ potatoes, BIO T2 + T3 and T1 + T2 + T3 treatments resulted in higher TY compared to other treatments. Additionally, an increase in small-tuber weight paralleling the decrease in large-tuber weight was observed in BIO T2 + T3 and T1 + T2 + T3 treatments.
For the post-harvest evaluation (Table 5), neither single, split, nor three-time applications of BIO affect DMC, SC, RSC, decay incidence, or sprouting incidence in ‘Minshu No. 1’, ‘Leshu No. 1’, ‘Xiazhai 65’, or ‘Qingshu No. 2’ potatoes after 3 months of storage at 7.5 °C.

3.3. Effects of Increasing Concentration and Frequency of BIO on Early-, Mid-, and Late-Maturing Potato Cultivars at Harvest and After Storage

For the harvest evaluation (Table 6), applications of BIO at 7.2 (3 or 4 times) or 9.6 (3 times) g/L did not affect RSC or medium-tuber weight, but significantly increased the TY, medium/large-tuber weight DMC, and SC in ‘Minshu No. 1’ potatoes, with no significant difference among the BIO treatments. For ‘Xiazhai 65’ potatoes, all BIO treatments increased TY, medium/large-tuber weight, DMC, and SC, but did not affect small-tuber weight or RSC. For ‘Qingshu No. 2’ potatoes, no significant difference was observed in small/medium-tuber weight, DMC, or SC between the control and any BIO treatment; however, all BIO treatments resulted in higher TY with lower large-tuber weight and RSC compared to the control. For ‘Qingshu No. 9’ potatoes, increasing the application concentration from 7.2 to 9.6 g/L or frequency from three to four times had no effect on TY, tuber weight distribution, or quality attributes compared to the control.
For the post-harvest evaluation (Table 7), three-time applications of 7.2 and 9.6 g/L BIO and four-time applications of 7.2 g/L BIO maintained higher DMC and SC in ‘Minshu No. 1’ and ‘Xiazhai 65’ potatoes compared to the control. No significant difference was observed in RSC, decay incidence, or sprouting incidence among the treatments. For ‘Qingshu No. 2’ potatoes, spraying 7.2 g/L BIO four times (treatments 4a and 4b) delayed the reduction in SC. However, no significant difference was found in DMC, RSC, decay incidence, or sprouting incidence between the control and any BIO treatment. For ‘Qingshu No. 9’ potatoes, none of the BIO treatments affected post-storage quality attributes.
For the nutrient uptake evaluation (Table 8), applications of BIO at 7.2 (three and four times) and 9.6 (three times) g/L significantly increased K and Fe uptakes in ‘Minshu No. 1’ potatoes. Notably, 7.2 g/L BIO 4b treatment resulted in a higher Ca content compared to the control. For ‘Xiazhai 65’ potatoes, all BIO treatments did not affect Ca, Mg, or Fe uptake. However, they increased K and Zn uptake. For ‘Qingshu No. 2’ potatoes, 9.6 (three times) and 7.2 (four times) g/L BIO treatments resulted in a high K uptake. However, the BIO did not affect the Ca, Mg, Fe, or Zn uptakes. For ‘Qingshu No. 9’ potatoes, the BIO application had no effect on the uptake of any nutrient.

3.4. Principal Component Analysis

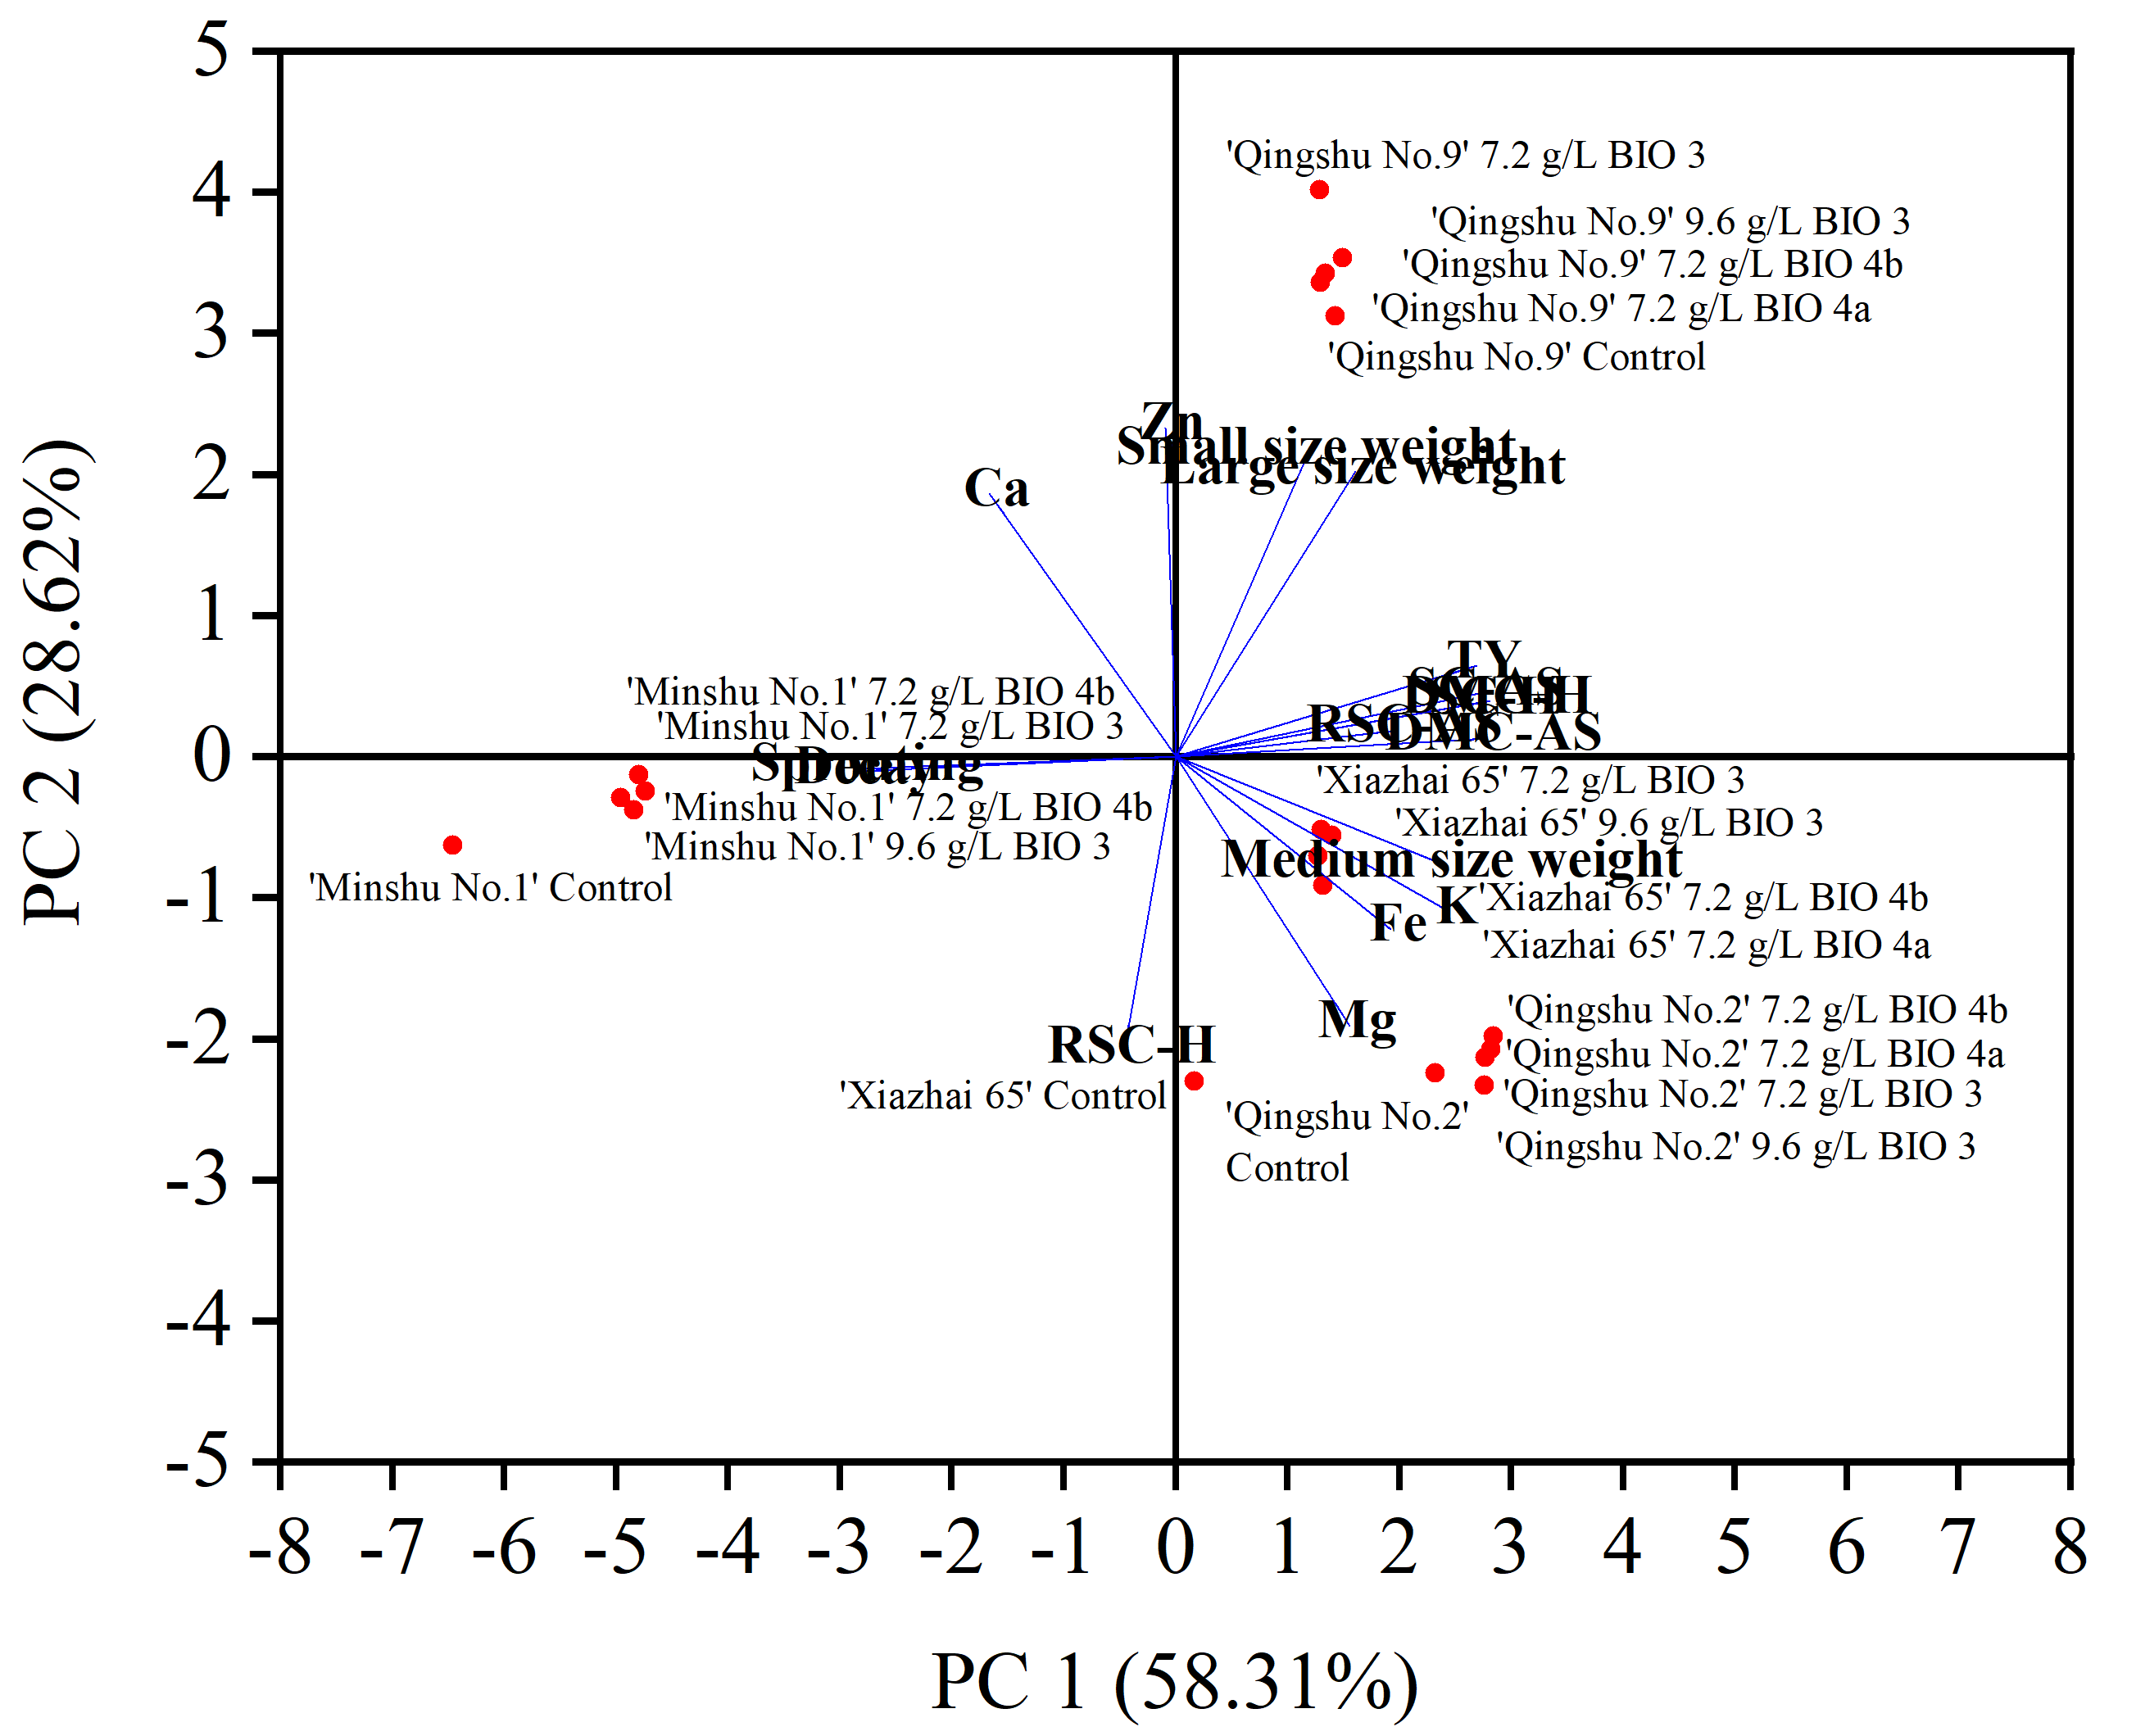
Two principal components accounted for 86.93% of the total variation in the data, with 58.31% from PC1 and 28.62% from PC2 (Figure 1). For PC1, TY, MSW, DMC-H, SC-H, MDA-AS, SC-AS, RSC-AS, and K were positively correlated with PC1, whereas decay and sprouting were negatively correlated with PC1, suggesting that PC1 might be related to yield, storage quality attributes, and post-harvest disorder development. For PC2, SSW, LSW, Ca, and Zn were positively correlated with PC2, whereas RSC-H, Mg, and Fe were negatively correlated with PC2, suggesting that PC2 might be related to tuber weight distribution and nutrient uptake. Regardless of treatment, the responsive cultivars, ‘Minshu No. 1’ and ‘Xiazhai 65’ potatoes, were plotted on the negative axes of the PC2 and were characterized by high RSC-H, Mg, Fe, K, and MSW, while the non-responsive cultivar, ‘Qingshu No. 9’ potatoes, was plotted on the positive axes of the PC2 and was characterized by high SSW, LSW, Ca, and Zn. Compared to the control ‘Minshu No. 1’ and ‘Xiazhai 65’ potatoes, the scores for these two BIO-treated cultivars showed changes in TY, SC-AS, SC-H, DMC-H, RSC-AS, and DMC-AS; compared to the control ‘Qingshu No. 9’ potatoes, the scores for BIO-treated potatoes showed substantial changes in SSW, LSW, Ca, and Zn.

4. Discussion

4.1. The Optimum Application Concentration of BIO on Potatoes and Their Responses to BIO

In sweet cherries, spraying 1 and 2 mL/L BIO effectively increased the fruit dimensions and yield of late-maturing ‘Skeena’ and ‘Staccato’ cherries [20,21]. While these studies utilized Ascophyllum nodosum extracts similar to the Stimplex® used here, commercial formulations vary widely in concentration and auxiliary ingredients, which can influence results. Furthermore, increasing the BIO concentration to 5 g/L provided greater effects on accelerating color development and improving the quality and antioxidant properties in mid-maturing ‘Bing’ cherries [22]. In cucumbers, foliar spraying of 10 g/L BIO displayed higher fungal resistance associated with enhanced plant biomass compared to the control and 5 g/L BIO treatment [23]. Similarly, foliar application of 10 g/L BIO effectively increased tuber yield in ‘Satina’, ‘Sylvana’, and ‘Volumia’ potatoes [14]. However, 3–10 and 4.8–8.5 g/L BIO had little influence on the quality of mangoes and potatoes, respectively [24]. It is important to note that, while some of the earlier literature suggested reductions in biotic stress, strictly speaking, BIOs were defined by their ability to improve nutrient efficiency, tolerance to abiotic stress, and crop quality traits, rather than acting as direct pesticides. Any observed reduction in disease incidence was likely an indirect result of improved plant health and enhanced natural defense mechanisms. Taken together, previous findings indicated that elevating the application concentration of BIOs might confer substantial benefits in enhancing the quality of fruits and vegetables; however, a significant risk of non-response could arise due to variability in species-specific responses. In this study, increasing the concentration of BIO application from 2.4 to 7.2 g/L showed a great effect on enhancing TY in ‘Qingshu No. 2’ potatoes (Table 2); furthermore, when the application concentration of BIO increased from 7.2 to 9.6 g/L, an enhanced TY was still observed, but no difference was found between these two treatments (Table 6). Taken together, the results confirm that a BIO concentration at 7.2 g/L has the potential to increase the yield in ‘Qingshu No. 2’ potatoes, while further increasing the concentration does not bring additional yield benefits. Notably, the ‘Minshu No. 1’ and ‘Leshu No. 1’ potato cultivars displayed similar responses to the BIO as the ‘Qingshu No. 2’. However, the ‘Qingshu No. 10’ and ‘Qingshu No. 9’ potatoes had no response to the BIO, indicating that the response of potatoes to BIO application is significantly affected by cultivar differences. Additionally, the PCA results further supported the finding that the BIO enhanced yield increase and improved quality attributes in responsive cultivars (Figure 1). One possible explanation for the disparity in potato response to the BIO might be due to the different days to maturity between the different potato cultivars. As was previously observed in sweet cherries, BIOs showed no effect on the quality of the late-maturing ‘Lapins’ sweet cherry cultivar, while BIOs displayed a greater effect on the quality of mid-maturing ‘Bing’ cherries [22]. Similar results were observed in this study; the BIO had no improvement on late-maturing ‘Qingshu No. 9’ potatoes with 135 d to maturity, but it had a strong effect on ‘Minshu No. 1’, ‘Xiazhai 65’, and ‘Qingshu No. 2’ potato cultivars with 85, 110, and 115 d to maturity, respectively. It is unclear why the potato cultivar with a long maturity period had no response to BIO. Additional studies are required to further explain this disparity.

4.2. The Optimum Application Frequency and Timing of BIO on Potatoes

The potato plant develops through five phenological stages: pre-planting, planting to sprout germination, sprout germination to emergence, emergence to tuber initiation, and tuber initiation to maturity [25]. The Stimplex® label claims that it can be first used for roots and tubers in soil at planting and then repeated in soil or foliar applications every 2–3 weeks until harvest. In this study, a single application of BIO at planting, seeding, or after 6 weeks of planting and split applications after 6 and 9 weeks of planting or planting plus FB did not affect TY in ‘Qingshu No. 2’ potatoes (Table 2, Table 4 and Table 6). However, spraying the BIO twice at FB and 3 weeks after FB and increasing the BIO application frequency to three and four times increased TY, suggesting that multiple applications of BIO can achieve more yield improvement effects than a single application. Similar results were observed in BIO-treated ‘Minshu No. 1’ potatoes; only BIO spraying three and four times can bring additional yield benefits (Table 4 and Table 6). Interestingly, when no BIO was applied at planting, no significantly increased TY was observed in either potato cultivar (Table 4), indicating that foliar spraying during potato plant development could provide more benefit to yield improvement than soil application, perhaps due to the BIO possibly penetrating the cuticle of the leaf or the stomata and then directly entering the cells [26,27]. This conclusion simplifies the field application process for BIOs in potato production and helps to reduce the labor input of growers.
While some studies have reported that BIO extracts can reduce the incidence of biotic stresses like early blight [17] or Jonathan spot [28], these effects might be attributed to the strengthening of the plant’s innate immune system and cell wall integrity rather than direct antimicrobial activity. In strawberry, peach, and lemon fruits, the BIO extracted from brown (Laminaria digitata and Undaria pinnatifida) and red (Porphyra umbilicalis, Eucheuma denticulatum, and Gelidium pusillum) seaweeds effectively inhibited fruit decay by enhancing the activities of peroxidase, polyphenoloxidase, and phenylalanine aminoacylase and increasing the contents of phenolic compounds [29]. In potatoes, BIO extracted from Ascophyllum nodosum showed a positive retention potential for vitamin C, total carbohydrates, proteins, phenolics, flavonoids, and antioxidant activity during 28 d of storage at 22 ± 2 °C [30]. However, in Experiment 1, spraying BIO three times after 6, 9, and 12 weeks of planting did not affect DMC, SC, RSC, decay incidence, or sprouting incidence of ‘Qingshu No. 2’, ‘Qingshu No. 10’, and ‘Qingshu No. 9’ potatoes after storage at 7.5 °C for 3 months (Table 3); similarly, in Experiment 2, three-time applications of BIO at planting, FB, and 3 weeks after FB had no effect on any quality attribute or disorder in ‘Minshu No. 1’, ‘Leshu No. 1’, ‘Xiazhai 65’, and ‘Qingshu No. 2’ potatoes after storage (Table 5). In contrast, when the BIO was applied three times at seedling, FB, and 3 weeks after FB and four times (a, seedling, 10 d after seedling, FB, and 3 weeks after FB; b, seedling, FB, 10 d after FB, and 3 weeks after FB), the BIO had a strong effect on delaying the losses in DMA and SC in ‘Minshu No. 1’ and ‘Xiazhai 65’ potatoes. Therefore, the efficacy of pre-harvest BIO spraying on potatoes was particularly affected by application frequency and timing. Taken together, these results indicate that BIO sprays ≥ three times (every 2–3 weeks) from seedling to 3 weeks after full bloom provided greater benefits than single and split treatments in enhancing yield and quality attributes at harvest. In practice, given that dense plant growth increases operational difficulty, the risk of plant damage, and operator exposure to chemicals, making manual spraying of BIO after 3 weeks of FB highly challenging, the use of a drone might be the best choice for spraying until harvest.

4.3. The Efficacy of BIO on Nutrient Uptake in Potatoes

Nutrient uptake is a critical determinant of potato growth, tuber yield, and quality [31,32], and the present study demonstrated that BIO application exerted distinct effects on the accumulation of key macro- and micronutrients in potato tubers. However, the capacity for macro- and micronutrient uptake following BIO application was affected by cultivar-specific responses (Table 8). For example, 7.2 g/L BIO spraying three times significantly increased K and Fe contents in ‘Minshu No. 1’ potatoes by 8.95% and 13.53%, respectively, compared to the control. The three applications of 7.2 g/L BIO increased the K and Zn contents in ‘Xiazhai 65’ potatoes by 6.86% and 31.50%, respectively, compared to the control. In contrast, ‘Qingshu No. 9’ potatoes showed no significant changes in nutrient uptake across all BIO treatments. While increased uptake of micronutrients like Fe and Zn is generally associated with improved nutritional quality, it is important to consider potential health implications. K is an essential electrolyte, and while higher levels are generally beneficial for cardiovascular health, excessive intake can be problematic for individuals with renal impairment. Similarly, while Fe and Zn are crucial for preventing deficiencies, excessively high concentrations in food crops can theoretically lead to adverse health effects if dietary intake exceeds recommended tolerable upper intake levels, although the levels observed in this study are unlikely to pose immediate health risks. Therefore, while BIO-induced biofortification was beneficial for the general population, its impact on specific sensitive groups should be considered in future nutritional assessments. Regarding the study’s scope, although this research focused on K, Ca, Mg, Fe, and Zn due to their direct impact on tuber quality and stress resilience, we acknowledge that N and phosphorus (P) are also primary macronutrients essential for potato growth. Previous research has indicated that Ascophyllum nodosum extracts enhance nutrient acquisition through stimulating root system development [33], activating soil enzymes that facilitate nutrient mineralization [34], and up-regulating the expression of nutrient transporter genes in roots [35,36]. Although we did not measure N and P uptake in this trial, the observed increases in K and Zn suggested that the BIO likely improved overall root foraging efficiency, which would presumably benefit the uptake of other mobile nutrients like N and P as well. Future studies should include comprehensive analysis of N and P to fully elucidate the nutrient mobilization mechanisms of BIOs in potatoes.

5. Conclusions

This study demonstrated that the efficacy of BIO application was highly dependent on cultivar, spraying concentration, frequency, and timing. Based on these findings, we propose the following practical recommendations for potato growers: For early- and mid-maturing cultivars (i.e., ‘Minshu No. 1’, ‘Leshu No. 1’, and ‘Xiazhai 65’), pre-harvest application of 7.2 g/L BIO applied three to four times during critical developmental stages from seedling to 3 weeks after FB is recommended. This protocol significantly increased tuber yield, particularly for medium/large-sized tubers, and enhanced the accumulation of K, Fe, and Zn. Furthermore, this treatment maintained DMC and SC after storage and reduced post-harvest losses. For late-maturing cultivars (i.e., ‘Qingshu No. 9’ and ‘Qingshu No. 10’), no significant yield or quality response was observed for the tested BIO parameters. Therefore, BIO application is not currently recommended for these late-maturing varieties. Growers should select responsive cultivars or alternative strategies if targeting late-maturing varieties. Although the experimental fields were conventionally fertilized, the primary goal was not to correct nutrient deficiencies but to optimize yield potential and tuber quality in a high-potential environment. In such well-managed systems, BIOs serve to enhance physiological efficiency, improve stress resilience, and elevate the nutritional quality of tubers beyond standard fertilization limits. This approach adds value by extending shelf-life stability and enhancing nutrient density. Therefore, BIO application should be viewed as a strategy for quality enhancement and yield improvement in responsive cultivars, rather than a substitute for standard agronomic practices. Despite these promising results, this study has certain limitations. The experiments were conducted under conventional fertilization conditions in the Qinghai Plateau, which may limit the generalizability of the findings to other soil types or climatic zones. Additionally, the specific formulation of the BIO used (Stimplex®) may yield different results with other seaweed extracts. Future research should address these limitations by investigating the uptake of N and P alongside micronutrients, exploring the molecular mechanisms underlying cultivar-specific responses, conducting multi-year, multi-location field trials to validate the stability of these findings under diverse environmental conditions, and assessing the long-term nutritional impact of increased micronutrient uptake on human health.

Supplementary Materials

The following supporting information can be downloaded at: https://www.mdpi.com/article/10.3390/horticulturae12070836/s1. Supplemental S1: Meteorological data in 2022, 2023, and 2024.

Author Contributions

Conceptualization, L.L.; methodology, Z.D. and L.L.; software, Z.D. and L.L.; validation, J.W.; formal analysis, L.L.; investigation, Z.D., H.Z., J.W. and Y.D.; resources, H.Z. and Y.D.; data curation, H.Z., S.Y., C.Z., X.F. and T.N.; writing—original draft preparation, Z.D., L.L., H.Z., S.Y., C.Z., X.F., J.W., T.N. and Y.D.; writing—review and editing, J.W. and Y.D.; visualization, J.W. and Y.D.; supervision, Y.D.; project administration, Y.D.; funding acquisition, Y.D. All authors have read and agreed to the published version of the manuscript.

Funding

This research was funded by the Basic Research Programs of the Science and Technology Department of Qinghai Province (2024-ZJ-738).

Data Availability Statement

The raw data supporting the conclusions of this article will be made available by the authors on request.

Conflicts of Interest

The authors declare no conflicts of interest.

References

  1. Feltran, J.C.; Lemos, L.B.; Vieites, R.L. Technological quality and utilization of potato tubers. Sci. Agric. 2004, 61, 598–603. [Google Scholar] [CrossRef]
  2. Zaheer, K.; Akhtar, M.H. Potato production, usage, and nutrition-a review. Crit. Rev. Food Sci. 2016, 56, 711–721. [Google Scholar] [CrossRef] [PubMed]
  3. Saini, R.; Kaur, S.; Aggarwal, P.; Dhiman, A.; Suthar, P. Conventional and emerging innovative processing technologies for quality processing of potato and potato-based products: A review. Food Control 2023, 153, 109933. [Google Scholar] [CrossRef]
  4. Kumar, D.; Singh, B.P.; Kumar, P. An overview of the factors affecting sugar content of potatoes. Ann. Appl. Biol. 2004, 145, 247–256. [Google Scholar] [CrossRef]
  5. Heltoft, P.; Wold, A.B.; Molteberg, E.L. Maturity indicators for prediction of potato (Solanum tuberosum L.) quality during storage. Postharvest Biol. Technol. 2017, 129, 97–106. [Google Scholar] [CrossRef]
  6. Stark, J.C.; Love, S.L.; Knowles, N.R. Tuber quality. In Potato Production Systems; Stark, J., Thornton, M., Nolte, P., Eds.; Springer: Cham, Switzerland, 2020. [Google Scholar] [CrossRef]
  7. Pinhero, R.G.; Yada, R.Y. Chapter 10—Postharvest storage of potatoes. In Advances in Potato Chemistry and Technology, Singh, J., Kaur, L., Eds.; 2nd ed.; Academic Press: San Diego, CA, USA, 2016; pp. 283–314. [Google Scholar]
  8. Czerko, Z.; Zarzyńska, K.; Boguszewska-Mańkowska, D. Postharvest physiology and storage of potato. In Potato Production Worldwide; Çalişkan, M.E., Bakhsh, A., Jabran, K., Eds.; Academic Press: San Diego, CA, USA, 2023; pp. 261–272. [Google Scholar] [CrossRef]
  9. Mansotra, P. Exploring the role of microbial live factories in post-harvest management of potatoes-possible solution to the optimization of supply chain. In Symbiosis in Nature; Rigobelo, E., Ed.; IntechOpen Limited: London, UK, 2023. [Google Scholar] [CrossRef]
  10. Khan, W.; Rayirath, U.P.; Subramanian, S.; Jithesh, M.N.; Rayorath, P.; Hodges, D.M.; Critchley, A.T.; Craigie, J.S.; Norrie, J.; Prithiviraj, B. Seaweed extracts as biostimulants of plant growth and development. J. Plant Growth Regul. 2009, 28, 386–399. [Google Scholar] [CrossRef]
  11. Battacharyya, D.; Babgohari, M.Z.; Rathor, P.; Prithiviraj, B. Seaweed extracts as biostimulants in horticulture. Sci. Hortic. 2015, 196, 39–48. [Google Scholar] [CrossRef]
  12. Ali, O.; Ramsubhag, A.; Jayaraman, J. Biostimulant properties of seaweed extracts in plants: Implications towards sustainable crop production. Plants 2021, 10, 531. [Google Scholar] [CrossRef] [PubMed]
  13. Nanda, S.; Kumar, G.; Hussain, S. Utilization of seaweed-based biostimulants in improving plant and soil health: Current updates and future prospective. Int. J. Environ. Sci. Technol. 2022, 19, 12839–12852. [Google Scholar] [CrossRef]
  14. Wierzbowska, J.; Cwalina-Ambroziak, B.; Głosek-Sobieraj, M.; Sienkiewicz, S. Effect of biostimulators on yield and selected chemical properties of potato tubers. J. Elem. 2015, 20, 757–768. [Google Scholar] [CrossRef]
  15. Salvage, R.; Cannon, T.; Kingsmill, P.; Liu, F.; Fleming, C.C. A complex biostimulant based on plant flavonoids enhances potato growth and commercial yields. Front. Sustain. Food Syst. 2024, 8, 1368423. [Google Scholar] [CrossRef]
  16. Wadas, W.; Dziugieł, T. Quality of new potatoes (Solanum tuberosum L.) in response to plant biostimulants application. Agriculture 2020, 10, 265. [Google Scholar] [CrossRef]
  17. Głosek-Sobieraj, M.; Cwalina-Ambroziak, B.; Hamouz, K. The effect of growth regulators and a biostimulator on the health status, yield and yield components of potatoes (Solanum tuberosum L.). Gesunde Pflanz. 2018, 70, 1–11. [Google Scholar] [CrossRef]
  18. Simmonds, N.W. Relations between specific gravity, dry matter content and starch content of potatoes. Potato Res. 1977, 20, 137–140. [Google Scholar] [CrossRef]
  19. Dai, H.; Fu, M.; Yang, X.; Chen, Q. Ethylene inhibited sprouting of potato tubers by influencing the carbohydrate metabolism pathway. J. Food Sci. Technol. 2016, 53, 3166–3174. [Google Scholar] [CrossRef] [PubMed]
  20. Correia, S.; Queiros, F.; Ferreira, H.; Morais, M.C.; Afonso, S.; Silva, A.P.; Gonçalves, B. Foliar application of calcium and growth regulators modulate sweet cherry (Prunus avium L.) tree performance. Plants 2020, 9, 410. [Google Scholar] [CrossRef] [PubMed]
  21. Gonçalves, B.; Morais, M.C.; Sequeira, A.; Ribeiro, C.; Guedes, F.; Silva, A.P.; Aires, A. Quality preservation of sweet cherry cv. ‘staccato’ by using glycine-betaine or Ascophyllum nodosum. Food Chem. 2020, 322, 126713. [Google Scholar] [CrossRef] [PubMed]
  22. Zhi, H.; Dong, Y. Seaweed-based biostimulants improves quality traits, postharvest disorders, and antioxidant properties of sweet cherry fruit and in response to gibberellic acid treatment. Sci. Hortic. 2024, 336, 113454. [Google Scholar] [CrossRef]
  23. Jayaraman, J.; Norrie, J.; Punja, Z.K. Commercial extract from the brown seaweed Ascophyllum nodosum reduces fungal diseases in greenhouse cucumber. J. Appl. Phycol. 2011, 23, 353–361. [Google Scholar] [CrossRef]
  24. Melo, T.A.D.; Serra, I.M.R.D.S.; Sousa, A.A.; Sousa, T.Y.O.; Pascholati, S.F. Effect of Ascophyllum nodosum seaweed extract on post-harvest ‘Tommy Atkins’ mangoes. Rev. Bras. Frutic. 2018, 40, e-621. [Google Scholar] [CrossRef]
  25. Singh, U.; Matthews, R.B.; Griffin, T.S.; Ritchie, J.T.; Hunt, L.A.; Goenaga, R. Modeling growth and development of root and tuber crops. In Understanding Options for Agricultural Production; Tsuji, G.Y., Hoogenboom, G., Thornton, P.K., Eds.; Systems Approaches for Sustainable Agricultural Development; Springer: Dordrecht, The Netherlands, 1998; pp. 129–156. ISBN 978-94-017-3624-4. [Google Scholar]
  26. Fageria, N.K.; Filho, M.B.; Moreira, A.; Guimarães, C.M. Foliar fertilization of crop plants. J. Plant Nutr. 2019, 32, 1044–1064. [Google Scholar] [CrossRef]
  27. Niu, J.; Liu, C.; Huang, M.; Liu, K.; Yan, D. Effects of foliar fertilization: A review of current status and future perspectives. J. Soil Sci. Plant Nutr. 2021, 21, 104–118. [Google Scholar] [CrossRef]
  28. Soppelsa, S.; Kelderer, M.; Testolin, R.; Zanotelli, D.; Andreotti, C. Effect of biostimulants on apple quality at harvest and after storage. Agronomy 2020, 10, 1214. [Google Scholar] [CrossRef]
  29. De Corato, U.; Salimbeni, R.; De Pretis, A.; Avella, N.; Patruno, G. Antifungal activity of crude extracts from brown and red seaweeds by a supercritical carbon dioxide technique against fruit postharvest fungal diseases. Postharvest Biol. Technol. 2017, 131, 16–30. [Google Scholar] [CrossRef]
  30. Mbuyisa, S.; Bertling, I.; Ngcobo, B.L. Preserving nutritional quality attributes of potatoes (Solanum tuberosum L.) through pre-plus post-harvest application of various plant extracts. Potato Res. 2025, 68, 4525–4544. [Google Scholar] [CrossRef]
  31. White, P.J.; Bradshaw, J.E.; Finlay, M.; Dale, B.; Ramsay, G.; Hammond, J.P.; Broadley, M.R. Relationships between yield and mineral concentrations in potato tubers. HortScience 2019, 44, 6–11. [Google Scholar] [CrossRef]
  32. Koch, M.; Naumann, M.; Pawelzik, E.; Gransee, A.; Thiel, H. The importance of nutrient management for potato production Part I: Plant nutrition and yield. Potato Res. 2020, 63, 97–119. [Google Scholar] [CrossRef]
  33. De Saeger, J.; Van Praet, S.; Vereecke, D.; Park, J.; Jacques, S.; Han, T.; Depuydt, S. Toward the molecular understanding of the action mechanism of Ascophyllum nodosum extracts on plants. J. Appl. Phycol. 2020, 32, 573–597. [Google Scholar] [CrossRef]
  34. Siwik-Ziomek, A.; Szczepanek, M. Soil extracellular enzyme activities and uptake of N by oilseed rape depending on fertilization and seaweed biostimulant application. Agronomy 2019, 9, 480. [Google Scholar] [CrossRef]
  35. Shukla, P.S.; Borza, T.; Critchley, A.T.; Hiltz, D.; Norrie, J.; Prithiviraj, B. Ascophyllum nodosum extract mitigates salinity stress in Arabidopsis thaliana by modulating the expression of miRNA involved in stress tolerance and nutrient acquisition. PLoS ONE 2018, 13, e0206221. [Google Scholar] [CrossRef] [PubMed]
  36. Balusamy, G.; Prabhakaran, J.; Veerasamy, R.; Kandasamy, V.; Duraisamy, S.; Loganathan, A. Biostimulants as modulators of nutrient transporter activity in crops. J. Plant Nutr. 2026, 49, 1345–1364. [Google Scholar] [CrossRef]
Figure 1. Principal component analysis (PCA) of yield, tuber weight distribution, quality attributes at harvest and after storage, and nutrients of ‘Minshu No. 1’, ‘Xiazhai 65’, ‘Qingshu No. 2’, and ‘Qingshu No. 9’ potatoes.
Horticulturae 12 00836 g001
Table 1. Summary of BIO treatments applied in Experiments 1, 2, and 3.
ExperimentCultivarsBIO Concentration (g/L)BIO FrequencyBIO Application Timing
Exp. 1‘Qingshu No. 2’
‘Qingshu No. 10’
‘Qingshu No. 9’
2.4 and 7.21, 2, and 3 times6 weeks of planting
6 and 9 weeks of planting
6, 9, and 12 weeks of planting
Exp. 2‘Minshu No. 1’
‘Leshu No. 1’
‘Xiazhai 65’
‘Qingshu No. 2’
7.21, 2, and 3 timesT1 (planting)
T2 (full bloom)
T3 (3 weeks after full bloom)
T1 + T2
T2 + T3
T1 + T2 + T3
Exp. 3‘Minshu No. 1’
‘Xiazhai 65’
‘Qingshu No. 2’
‘Qingshu No. 9’
7.2 and 9.63 and 4 times3 (seedling, full bloom, and 3 weeks after full bloom)
4a (seedling, 10 d after seedling, full bloom,
and 3 weeks after full bloom)
4b (seedling, full bloom, 10 d after full bloom,
and 3 weeks after full bloom)
Table 2. Spraying of 2.4 and 7.2 g/L BIO one, two, and three times on yield, tuber weight distribution, and quality attributes of ‘Qingshu No. 2’, ‘Qingshu No. 10’, and ‘Qingshu No. 9’ potato cultivars at harvest (Experiment 1).
CultivarsTreatmentsTY
(kg/Plot)
Tuber Weight DistributionDMC
(%)
SC
(%)
RSC
(mg/kg)
Small-Tuber
Weight (kg)
Medium-Tuber
Weight (kg)
Large-Tuber
Weight (kg)
Qingshu No. 2Control29.93 b9.30 f17.80 ab2.83 a20.25 a20.18 a0.76 ab
2.4 g L−1 BIO 129.83 b11.07 cd16.07 b2.70 a20.30 a20.31 a0.75 ab
2.4 g L−1 BIO 231.37 b10.50 de18.90 ab1.97 bc20.36 a20.52 a0.88 ab
2.4 g L−1 BIO 333.73 b12.17 b20.10 a1.47 c20.02 a20.66 a0.93 a
7.2 g L−1 BIO 129.83 b10.03 ef17.23 ab2.57 ab19.38 a20.40 a0.72 b
7.2 g L−1 BIO 231.30 b11.53 bc17.37 ab2.40 ab20.39 a20.24 a0.83 ab
7.2 g L−1 BIO 334.73 a13.33 a20.07 a1.33 c19.40 a20.07 a0.88 ab
Qingshu No. 10Control35.40 a12.93 ab17.97 a4.50 a23.44 a19.16 a0.98 b
2.4 g L−1 BIO 134.23 a12.70 ab17.40 a4.13 a22.62 a18.81 a1.02 b
2.4 g L−1 BIO 235.07 a13.33 ab18.97 a2.77 b22.45 a19.08 a1.13 ab
2.4 g L−1 BIO 336.83 a15.30 a19.70 a1.83 b22.63 a18.90 a1.23 a
7.2 g L−1 BIO 134.53 a11.73 b17.97 a4.83 a21.81 a18.71 a0.99 b
7.2 g L−1 BIO 234.60 a13.00 ab16.83 a4.77 a22.48 a18.65 a1.12 ab
7.2 g L−1 BIO 336.63 a15.20 a19.13 a2.30 b22.77 a18.73 a1.22 a
Qingshu No. 9Control42.07 a16.53 a20.23 a5.30 a22.73 a19.61 a0.53 a
2.4 g L−1 BIO 141.77 a17.00 a19.40 a5.37 a22.35 a19.56 a0.51 a
2.4 g L−1 BIO 242.50 a16.13 ab20.83 a5.53 a22.02 a19.45 a0.46 a
2.4 g L−1 BIO 341.13 a16.37 a19.23 a5.53 a21.56 a19.76 a0.49 a
7.2 g L−1 BIO 142.73 a16.20 a20.87 a5.67 a22.01 a19.60 a0.47 a
7.2 g L−1 BIO 241.50 a16.90 a19.40 a5.20 a21.96 a19.67 a0.47 a
7.2 g L−1 BIO 342.20 a16.07 a20.67 a5.47 a22.24 a19.68 a0.48 a
Values are presented as means. Different lowercase letters indicate significant differences among means for each column in each cultivar using Tukey’s honestly significant difference (HSD) test at p < 0.05.
Table 3. Spraying of 2.4 and 7.2 g/L BIO one, two, and three times on storage quality attributes of ‘Qingshu No. 2’, ‘Qingshu No. 10’, and ‘Qingshu No. 9’ potato cultivars after storage (Experiment 1).
CultivarsTreatmentsDMC (%)SC (%)RSC (mg/kg)Decay (%)Sprouting (%)
Qingshu No. 2Control19.58 a17.83 a8.21 a23.33 a5.33 a
2.4 g L−1 BIO 119.41 a18.30 a8.50 a22.67 a4.67 a
2.4 g L−1 BIO 219.22 a18.06 a8.46 a24.00 a6.00 a
2.4 g L−1 BIO 319.88 a18.09 a8.55 a24.00 a4.00 a
7.2 g L−1 BIO 119.10 a17.91 a8.01 a23.33 a6.00 a
7.2 g L−1 BIO 219.10 a17.83 a8.02 a21.33 a5.33 a
7.2 g L−1 BIO 318.96 a18.00 a8.45 a22.00 a6.67 a
Qingshu No. 10Control22.97 a16.11 a6.32 a10.67 a0.67 a
2.4 g L−1 BIO 122.45 a16.06 a6.54 a9.33 a2.00 a
2.4 g L−1 BIO 222.02 a15.78 a6.74 a10.00 a1.33 a
2.4 g L−1 BIO 322.18 a15.95 a6.86 a10.67 a2.00 a
7.2 g L−1 BIO 121.62 a16.32 a6.82 a11.33 a2.67 a
7.2 g L−1 BIO 222.29 a16.17 a6.61 a10.00 a2.67 a
7.2 g L−1 BIO 321.68 a16.13 a6.51 a9.33 a3.33 a
Qingshu No. 9Control17.80 a17.12 a3.84 a11.33 a4.00 a
2.4 g L−1 BIO 117.78 a17.43 a3.92 a10.67 a4.67 a
2.4 g L−1 BIO 217.85 a17.25 a3.94 a12.00 a4.00 a
2.4 g L−1 BIO 317.36 a16.88 a4.05 a11.33 a2.00 a
7.2 g L−1 BIO 117.48 a17.11 a4.44 a10.67 a4.00 a
7.2 g L−1 BIO 216.90 a16.79 a4.03 a12.67 a4.67 a
7.2 g L−1 BIO 317.57 a17.07 a4.21 a10.67 a3.33 a
Values are presented as means. Different lowercase letters indicate significant differences among means for each column in each cultivar using Tukey’s HSD test at p < 0.05.
Table 4. Applications of 7.2 g/L BIO at T1, T2, and T3 on yield, tuber weight distribution, and quality attributes of ‘Minshu No. 1’, ‘Leshu No. 1’, ‘Xiazhai 65’, and ‘Qingshu No. 2’ potato cultivars at harvest (Experiment 2).
CultivarsTreatmentsTY
(kg/Plot)
Tuber Weight DistributionDMC
(%)
SC
(%)
RSC
(mg/kg)
Small-Tuber
Weight (kg)
Medium-Tuber
Weight (kg)
Large-Tuber
Weight (kg)
Minshu No. 1Control13.93 b5.50 a7.48 a0.95 c16.19 a12.47 a0.57 a
BIO T114.67 b5.43 a8.27 a0.96 c15.95 a12.20 a0.53 a
BIO T214.57 b5.40 a8.12 a1.05 bc16.10 a12.18 a0.53 a
BIO T314.60 b5.60 a7.92 a0.97 bc15.72 a12.15 a0.51 a
BIO T1 + T214.65 b4.97 a8.25 a1.43 abc15.68 a12.13 a0.55 a
BIO T2 + T314.55 b5.17 a7.83 a1.55 ab15.93 a12.00 a0.52 a
BIO T1 + T2 + T315.85 a5.23 a8.85 a1.77 a15.49 a12.07 a0.50 a
Leshu No. 1Control21.23 c6.32 a12.45 b2.47 a15.74 a13.80 a0.75 a
BIO T121.45 bc5.93 a13.17 ab2.35 a16.16 a13.74 a0.75 a
BIO T223.82 a6.00 a15.22 ab2.58 a16.15 a13.63 a0.71 a
BIO T323.70 ab5.90 a15.68 a2.12 a15.92 a13.67 a0.79 a
BIO T1 + T222.32 abc6.03 a13.92 ab2.37 a15.66 a13.85 a0.77 a
BIO T2 + T323.00 abc6.18 a14.72 ab2.10 a15.75 a14.02 a0.75 a
BIO T1 + T2 + T323.93 a6.53 a15.47 a1.93 a16.02 a13.66 a0.72 a
Xiazhai 65Control24.45 ab6.95 a15.33 ab2.17 a22.04 a18.63 a0.63 a
BIO T123.87 b7.15 a14.63 b2.08 a21.77 a18.96 a0.61 a
BIO T225.17 ab6.87 a16.23 a2.07 a21.32 a18.69 a0.57 a
BIO T325.37 a7.07 a16.28 a2.02 a21.51 a18.93 a0.58 a
BIO T1 + T224.70 ab7.00 a15.58 ab2.12 a21.09 a18.88 a0.61 a
BIO T2 + T325.37 a7.08 a16.33 a1.95 a21.52 a18.62 a0.61 a
BIO T1 + T2 + T325.32 a7.05 a16.18 ab2.08 a21.56 a18.83 a0.63 a
Qingshu No. 2Control33.83 c9.20 c20.70 ab3.93 a20.35 a19.28 a0.93 a
BIO T133.30 c9.63 c20.07 ab3.60 ab20.73 a19.06 a0.98 a
BIO T233.05 c10.80 abc19.20 b3.05 bc20.82 a18.68 a0.98 a
BIO T334.03 c10.40 bc20.52 ab3.12 b19.95 a18.89 a0.91 a
BIO T1 + T233.80 c10.28 c20.27 ab3.25 ab20.90 a18.88 a0.91 a
BIO T2 + T335.12 b11.95 ab20.17 ab3.00 bc20.49 a18.71 a0.96 a
BIO T1 + T2 + T336.23 a12.30 a21.58 a2.35 c19.82 a18.88 a0.98 a
Values are presented as means. Different lowercase letters indicate significant differences among means for each column in each cultivar using Tukey’s HSD test at p < 0.05.
Table 5. Applications of 7.2 g/L BIO at T1, T2, and T3 on storage quality attributes of ‘Minshu No. 1’, ‘Leshu No. 1’, ‘Xiazhai 65’, and ‘Qingshu No. 2’ potato cultivars after storage (Experiment 2).
CultivarsTreatmentsDMC (%)SC (%)RSC (mg/kg)Decay (%)Sprouting (%)
Minshu No. 1Control15.02 a11.10 a1.95 a6.67 a48.67 a
BIO T114.69 a10.97 a1.93 a6.00 a45.33 a
BIO T214.50 a11.31 a1.90 a6.00 a52.67 a
BIO T314.67 a11.25 a1.91 a5.33 a48.00 a
BIO T1 + T214.45 a11.43 a1.87 a6.67 a52.67 a
BIO T2 + T314.68 a11.19 a1.96 a4.00 a52.00 a
BIO T1 + T2 + T314.63 a11.14 a1.89 a5.33 a52.33 a
Leshu No. 1Control14.67 a12.35 a2.38 a14.67 a24.00 a
BIO T115.00 a12.12 a2.30 a14.00 a23.33 a
BIO T214.50 a12.31 a2.39 a15.33 a26.67 a
BIO T314.25 a12.01 a2.30 a14.00 a22.67 a
BIO T1 + T214.26 a11.90 a2.36 a14.67 a25.33 a
BIO T2 + T314.47 a12.28 a2.32 a14.00 a26.67 a
BIO T1 + T2 + T314.47 a11.55 a2.25 a14.00 a26.00 a
Xiazhai 65Control20.63 a16.33 a1.91 a0.67 a2.00 a
BIO T120.91 a16.51 a1.94 a0.00 a2.67 a
BIO T220.43 a16.01 a1.94 a1.33 a2.00 a
BIO T320.91 a16.03 a1.96 a2.67 a4.67 a
BIO T1 + T221.10 a15.74 a1.91 a1.33 a4.67 a
BIO T2 + T320.83 a15.67 a1.99 a2.00 a3.33 a
BIO T1 + T2 + T320.97 a15.74 a2.01 a1.33 a2.67 a
Qingshu No. 2Control19.12 a18.62 a4.18 a2.00 a0.67 a
BIO T119.27 a18.22 a4.00 a1.33 a1.33 a
BIO T219.19 a18.42 a4.05 a3.33 a1.33 a
BIO T319.48 a18.58 a4.17 a2.00 a0.00 a
BIO T1 + T219.36 a18.61 a4.13 a2.00 a0.67 a
BIO T2 + T319.03 a18.30 a4.16 a0.67 a1.33 a
BIO T1 + T2 + T318.93 a18.31 a4.14 a2.00 a0.67 a
Values are presented as means. Different lowercase letters indicate significant differences among means for each column in each cultivar using Tukey’s HSD test at p < 0.05.
Table 6. Applications of 7.2 and 9.6 g/L BIO three times and 7.2 g/L BIO four times on yield, tuber weight distribution, and quality attributes of ‘Minshu No. 1’, ‘Xiazhai 65’, ‘Qingshu No. 2’, and ‘Qingshu No. 9’ potato cultivars at harvest (Experiment 3).
CultivarsTreatmentsTY
(kg/Plot)
Tuber Weight DistributionDMC
(%)
SC
(%)
RSC
(mg/kg)
Small-Tuber
Weight (kg)
Medium-Tuber
Weight (kg)
Large-Tuber
Weight (kg)
Minshu No. 1Control14.95 b6.07 b7.47 a1.42 b13.33 b13.13 b0.73 a
7.2 g L−1 BIO 318.35 a6.70 a9.77 a1.88 a15.32 a14.49 a0.69 a
9.6 g L−1 BIO 317.52 a6.93 a8.77 a1.82 a15.23 a14.18 a0.68 a
7.2 g L−1 BIO 4a17.73 a6.88 a8.90 a1.95 a15.15 a14.61 a0.69 a
7.2 g L−1 BIO 4b17.98 a7.00 a9.05 a1.93 a15.63 a14.67 a0.65 a
Xiazhai 65Control31.47 b7.93 a21.43 b2.10 b19.46 b16.33 b0.65 a
7.2 g L−1 BIO 340.53 a7.63 a29.53 a3.37 a20.80 a17.38 a0.59 a
9.6 g L−1 BIO 341.15 a7.73 a30.02 a3.40 a20.99 a17.62 a0.61 a
7.2 g L−1 BIO 4a40.70 a7.68 a29.85 a3.17 a20.85 a17.96 a0.65 a
7.2 g L−1 BIO 4b41.27 a7.53 a30.43 a3.30 a20.74 a17.58 a0.63 a
Qingshu No. 2Control33.87 b8.80 a21.30 a3.77 a20.46 a19.38 a0.82 a
7.2 g L−1 BIO 337.93 a8.82 a26.27 a2.85 b20.76 a19.48 a0.72 b
9.6 g L−1 BIO 336.57 a8.67 a25.13 a2.77 b20.72 a19.20 a0.72 b
7.2 g L−1 BIO 4a36.77 a8.50 a25.08 a3.18 b20.33 a19.49 a0.71 b
7.2 g L−1 BIO 4b37.28 a8.67 a25.58 a3.03 b20.44 a19.33 a0.70 b
Qingshu No. 9Control41.53 a16.72 a18.72 a6.10 a20.78 a19.01 a0.57 a
7.2 g L−1 BIO 341.32 a17.13 a18.12 a6.07 a21.02 a18.85 a0.50 a
9.6 g L−1 BIO 341.17 a16.93 a17.82 a6.42 a20.82 a19.09 a0.56 a
7.2 g L−1 BIO 4a39.73 a17.00 a16.50 a6.23 a20.79 a19.27 a0.57 a
7.2 g L−1 BIO 4b39.92 a17.03 a16.80 a6.08 a20.88 a18.75 a0.54 a
Values are presented as means. Different lowercase letters indicate significant differences among means for each column in each cultivar using Tukey’s HSD test at p < 0.05.
Table 7. Applications of 7.2 and 9.6 g/L BIO three times and 7.2 g/L BIO four times on storage quality attributes of ‘Minshu No. 1’, ‘Xiazhai 65’, ‘Qingshu No. 2’, and ‘Qingshu No. 9’ potato cultivars after storage (Experiment 3).
CultivarsTreatmentsDMC (%)SC (%)RSC (mg/kg)Decay (%)Sprouting (%)
Minshu No. 1Control12.84 b11.76 b1.94 a10.00 a78.67 a
7.2 g L−1 BIO 314.29 a12.94 a1.89 a6.67 a80.00 a
9.6 g L−1 BIO 314.14 a13.00 a1.93 a8.00 a83.33 a
7.2 g L−1 BIO 4a14.09 a12.42 a1.95 a8.00 a81.33 a
7.2 g L−1 BIO 4b14.21 a12.67 a1.92 a8.67 a82.67 a
Xiazhai 65Control18.27 b14.78 b2.03 a2.00 a3.33 a
7.2 g L−1 BIO 319.30 a15.61 a2.01 a1.33 a3.33 a
9.6 g L−1 BIO 319.25 a15.92 a1.94 a2.00 a4.67 a
7.2 g L−1 BIO 4a19.04 a15.86 a1.91 a2.67 a2.00 a
7.2 g L−1 BIO 4b19.24 a16.06 a1.87 a2.00 a4.67 a
Qingshu No. 2Control18.74 a17.94 c3.50 a1.33 a0.67 a
7.2 g L−1 BIO 318.80 a18.15 bc3.75 a1.33 a0.00 a
9.6 g L−1 BIO 318.47 a18.03 c3.92 a1.33 a0.67 a
7.2 g L−1 BIO 4a18.45 a18.85 a3.79 a1.33 a0.67 a
7.2 g L−1 BIO 4b18.40 a18.76 ab3.85 a0.67 b0.00 a
Qingshu No. 9Control18.31 c18.04 a3.19 a2.00 a7.33 a
7.2 g L−1 BIO 318.42 bc17.86 a3.27 a2.00 a6.00 a
9.6 g L−1 BIO 318.54 abc17.91 a3.21 a1.33 a6.67 a
7.2 g L−1 BIO 4a18.55 abc18.09 a3.23 a2.67 a4.67 a
7.2 g L−1 BIO 4b18.31 c17.88 a3.20 a1.33 a6.00 a
Values are presented as means. Different lowercase letters indicate significant differences among means for each column in each cultivar using Tukey’s HSD test at p < 0.05.
Table 8. Applications of 7.2 and 9.6 g/L BIO three times and 7.2 g/L BIO four times on nutrient uptake of ‘Minshu No. 1’, ‘Xiazhai 65’, ‘Qingshu No. 2’, and ‘Qingshu No. 9’ potato cultivars at harvest (Experiment 3).
CultivarsTreatmentsK (mg/kg)Ca (mg/kg)Mg (mg/kg)Fe (mg/kg)Zn (mg/kg)
Minshu No. 1Control369.88 b9.14 b13.88 a1.70 b2.70 a
7.2 g L−1 BIO 3403.00 a11.31 a13.31 a1.93 a2.70 a
9.6 g L−1 BIO 3402.66 a10.43 ab13.58 a1.93 a2.72 a
7.2 g L−1 BIO 4a404.56 a11.03 a13.62 a1.88 a2.69 a
7.2 g L−1 BIO 4b414.85 a11.46 a13.48 a1.92 a2.67 a
Xiazhai 65Control436.79 b5.70 a14.56 a2.11 a2.00 b
7.2 g L−1 BIO 3466.75 ab6.85 a14.83 a1.93 a2.63 a
9.6 g L−1 BIO 3475.98 a7.08 a14.77 a1.95 a2.69 a
7.2 g L−1 BIO 4a473.95 a6.86 a14.30 a2.00 a2.60 a
7.2 g L−1 BIO 4b470.52 ab6.61 a14.41 a1.94 a2.62 a
Qingshu No. 2Control467.10 b6.51 a16.15 a2.18 a2.54 a
7.2 g L−1 BIO 3490.51 a6.25 a16.44 a2.07 a2.43 a
9.6 g L−1 BIO 3496.26 a6.44 a16.56 a2.13 a2.43 a
7.2 g L−1 BIO 4a497.31 a6.52 a16.37 a2.12 a2.45 a
7.2 g L−1 BIO 4b488.85 a6.01 a16.17 a2.11 a2.46 a
Qingshu No. 9Control431.57 a10.55 a12.99 a1.98 a3.02 a
7.2 g L−1 BIO 3436.18 a10.90 a13.29 a1.85 a3.24 a
9.6 g L−1 BIO 3428.66 a10.46 a13.34 a1.94 a3.22 a
7.2 g L−1 BIO 4a429.18 a10.99 a13.31 a1.95 a3.08 a
7.2 g L−1 BIO 4b424.49 a10.78 a13.36 a1.97 a3.12 a
Values are presented as means. Different lowercase letters indicate significant differences among means for each column in each cultivar using Tukey’s HSD test at p < 0.05.
Disclaimer/Publisher’s Note: The statements, opinions and data contained in all publications are solely those of the individual author(s) and contributor(s) and not of MDPI and/or the editor(s). MDPI and/or the editor(s) disclaim responsibility for any injury to people or property resulting from any ideas, methods, instructions or products referred to in the content.