Article

Comparative Evaluations of Commercial Seaweed Extract Formulations on Germination, Biomass Accumulation and Early Seedling Growth in Capsicum annuum


by
Prabhaharan Renganathan
1,*,
Kristina Borisovna Ukhatkina
1,
Ilya Isidorovich Van Erp
1,
Alfia Mufazalova
1,
Natalia V. Sukhanova
1 and
Lira A. Gaysina
1,2,3,*
1
Department of Bioecology and Biological Education, M. Akmullah Bashkir State Pedagogical University, 450000 Ufa, Russia
2
All-Russian Research Institute of Phytopathology, 143050 Bolshiye Vyazemy, Russia
3
Phystech School of Biological and Medical Physics, Moscow Institute of Physics and Technology, 141701 Dolgoprudny, Russia
*
Authors to whom correspondence should be addressed.
Horticulturae 2026, 12(7), 799; https://doi.org/10.3390/horticulturae12070799
Submission received: 7 June 2026 / Revised: 24 June 2026 / Accepted: 28 June 2026 / Published: 30 June 2026
(This article belongs to the Topic Applications of Biotechnology in Food and Agriculture)

Highlights

What are the main findings?
Commercial seaweed extract formulations produced distinct germination and seedling response profiles in Capsicum annuum under controlled conditions.
KAT achieved the highest final germination percentage, whereas SAGA exhibited the fastest germination and the highest seedling vigor index.
What are the implications of the main findings?
AQUA and SAGA were associated with relatively high biomass values among the evaluated formulations.
Multivariate analyses revealed treatment-associated variation in growth, biomass, and moisture-related traits.

Abstract

Seaweed-derived biostimulants are increasingly used to improve seed germination and early seedling development in horticultural crops. This study evaluated the effects of five commercially available seaweed extract (SWE) formulations (ASCO, AQUA, KAT, SAGA, and BIO) applied at 2 mL L−1 on germination, seedling growth, biomass accumulation, moisture-related traits, and biomass allocation indices of Capsicum annuum L. under controlled conditions. A 10-day in vitro Petri dish bioassay was conducted using five experimental replicates for each treatment. Significant differences among the treatments were observed for several germination, growth, biomass, and moisture-related parameters. KAT exhibited the highest final germination percentage, whereas SAGA exhibited the fastest germination response and the highest seedling vigor index. SAGA was associated with higher root length and total dry weight, whereas AQUA exhibited among the highest root biomass values. BIO recorded the highest moisture content, leaf length, and shoot-to-root ratio. Correlation analysis identified significant relationships among growth and biomass traits, whereas principal component analysis revealed distinct multivariate response patterns among the evaluated formulations. Overall, the commercial SWE formulations showed different response profiles during the early seedling development of C. annuum under the conditions of present study. Further studies are required to evaluate the consistency of these responses across different concentrations, cultivars, and growing environments.

1. Introduction

Chilli pepper (Capsicum annuum L.) is one of the most economically important horticultural crops worldwide, valued for its culinary, nutritional, medicinal, and industrial applications [1]. It contains high concentrations of vitamins, carotenoids, phenolics, capsaicinoids, and other antioxidant metabolites [2]. However, Capsicum seeds frequently exhibit slow and uneven germination, particularly under suboptimal moisture and temperature conditions, resulting in non-uniform seedling emergence and reduced plant establishment [3,4]. These limitations are especially important in commercial nursery production, where uniform seedling development directly influences transplant quality and crop establishment [4]. The germination phase is highly sensitive to fluctuations in moisture, temperature, and nutrient availability, which inhibit metabolic activation, delay radicle emergence, and impair seedling establishment [5]. These early-stage constraints result in heterogeneous crop establishment, reduced root development, and low productivity [6]. These challenges highlight the need for sustainable agronomic inputs that can improve early establishment.
Plant biostimulants, including plant growth-promoting microorganisms and microalgae-based products, have emerged as promising biological tools capable of enhancing plant growth, stress resilience, and crop establishment across diverse crops under different environmental conditions [7,8,9,10,11]. Among them, seaweed extracts (SWEs) have gained considerable attention owing to their rich composition of biologically active compounds and their multifunctional effects on plant physiology [12]. SWEs have been reported to contain diverse bioactive compounds, including auxins, cytokinins, gibberellins, polysaccharides, betaines, amino acids, vitamins, polyphenols, and essential minerals, although their composition varies substantially among seaweed species, extraction methods, and commercial formulations [13]. These compounds have been associated with germination, root development, biomass accumulation, and stress tolerance in plants [14]. Consequently, commercial SWE formulations are increasingly being used as sustainable agronomic inputs to improve crop establishment and growth [15].
Numerous studies have demonstrated that SWEs improve seed germination and early seedling establishment [16]. In addition to germination, SWE application has been reported to promote vegetative growth, biomass accumulation, and stress tolerance in a wide range of horticultural and agronomic crops [17]. However, the magnitude and consistency of these responses vary depending on the macroalgal species composition, extraction technology, formulation characteristics, crop species, application method, and environmental conditions [13]. Recent studies have shown that differences in seaweed source, extraction method, and formulation composition can result in variable germination and seedling growth responses, highlighting the importance of formulation-specific evaluation of commercial biostimulants [18]. Biostimulants derived from Ascophyllum nodosum, Ecklonia maxima, Sargassum spp., and Kappaphycus alvarezii frequently induce species-dependent responses in plants [19]. Although seaweed-derived formulations have improved germination, root development, and biomass accumulation in several crop species [20], research on germination performance, biomass accumulation, biomass allocation, and integrated seedling responses remains relatively limited.
Despite the increasing number of studies describing the beneficial effects of seaweed-derived biostimulants, comparative evaluations of commercially available formulations during the early establishment of C. annuum remain limited. Furthermore, many studies evaluating seaweed-derived biostimulants primarily focus on individual germination, growth, or yield parameters, whereas integrative multivariate approaches capable of examining the relationships among multiple developmental traits are comparatively less common [21,22]. Consequently, differences in the responses of Capsicum seedlings to commercially available SWE formulations remain incompletely understood.
Pearson’s correlation analysis and principal component analysis (PCA) are useful tools for identifying treatment-related response patterns and exploring relationships among developmental variables [23]. However, these approaches have rarely been applied to evaluate commercial SWE formulations during the establishment of Capsicum seedlings. We hypothesized that commercially available SWE formulations would differentially affect germination performance, seedling growth, and biomass accumulation relative to the untreated control during the early establishment of C. annuum. Therefore, the present study aimed to compare the effects of commercially available SWE formulations on germination, seedling growth, biomass accumulation, biomass allocation, and moisture-related parameters in C. annuum under controlled conditions.

2. Materials and Methods

2.1. Plant Material and Experimental Design

Certified seeds of C. annuum L. cv. CO 1 chilli, a widely cultivated cultivar released by the Tamil Nadu Agricultural University (TNAU), Coimbatore, India, were used in this study. Seeds were obtained from the Seed Distribution Center, Thiruvanaikovil, Tiruchirappalli, under the Department of Horticulture and Plantation Crops, Government of Tamil Nadu, India. The seed lot number was MAR25-12-8022-2 and the production year was 2025. According to the TNAU Seed Certification Standards, the seed lot satisfied the certification requirements, including a minimum germination rate of 60% and a minimum genetic purity of 98%. Prior to experimentation, the seeds were stored at 3–5 °C and surface-sterilized with 1% (v/v) sodium hypochlorite for 3 min, followed by three rinses with sterile distilled water [24].
The experiment was conducted in a growth chamber under controlled environmental conditions using a completely randomized design (CRD). Conditions were maintained at 25 ± 1 °C, with a 12 h light/12 h dark photoperiod, 65–70% relative humidity, and a photosynthetic photon flux density of 100 µmol m−2 s−1 [7]. Six treatments were evaluated: five commercial SWE formulations and one untreated control. Each treatment consisted of five independent Petri dishes (experimental units) with ten seeds per dish, resulting in 50 seeds per treatment and 300 seeds in total. Petri dishes were considered experimental units, and treatment effects were evaluated using plate-level replicate means.
The commercial SWE formulations included Sagarika (SAGA; IFFCO, New Delhi, India), Aquamarine (AQUA; ICL Group, Pune, India), Biovita (BIO; PI Industries, Gurugram, India), Katyayani Seaweed Extract (KAT; Katyayani Organics, Bhopal, India), and Asco Zyme (ASCO; Hifield Organics, Chhatrapati Sambhajinagar, India). Although the manufacturer-recommended application rates differed among products (Table 1), all formulations were evaluated at a standardized concentration of 2 mL L−1 to facilitate direct comparisons under identical bioassay conditions. Sterile distilled water was used for the untreated control treatment.
The physicochemical and compositional information presented in Table 1 was compiled from the manufacturer’s product labels and technical documentation.

2.2. Seed Germination Bioassay and Growth Conditions

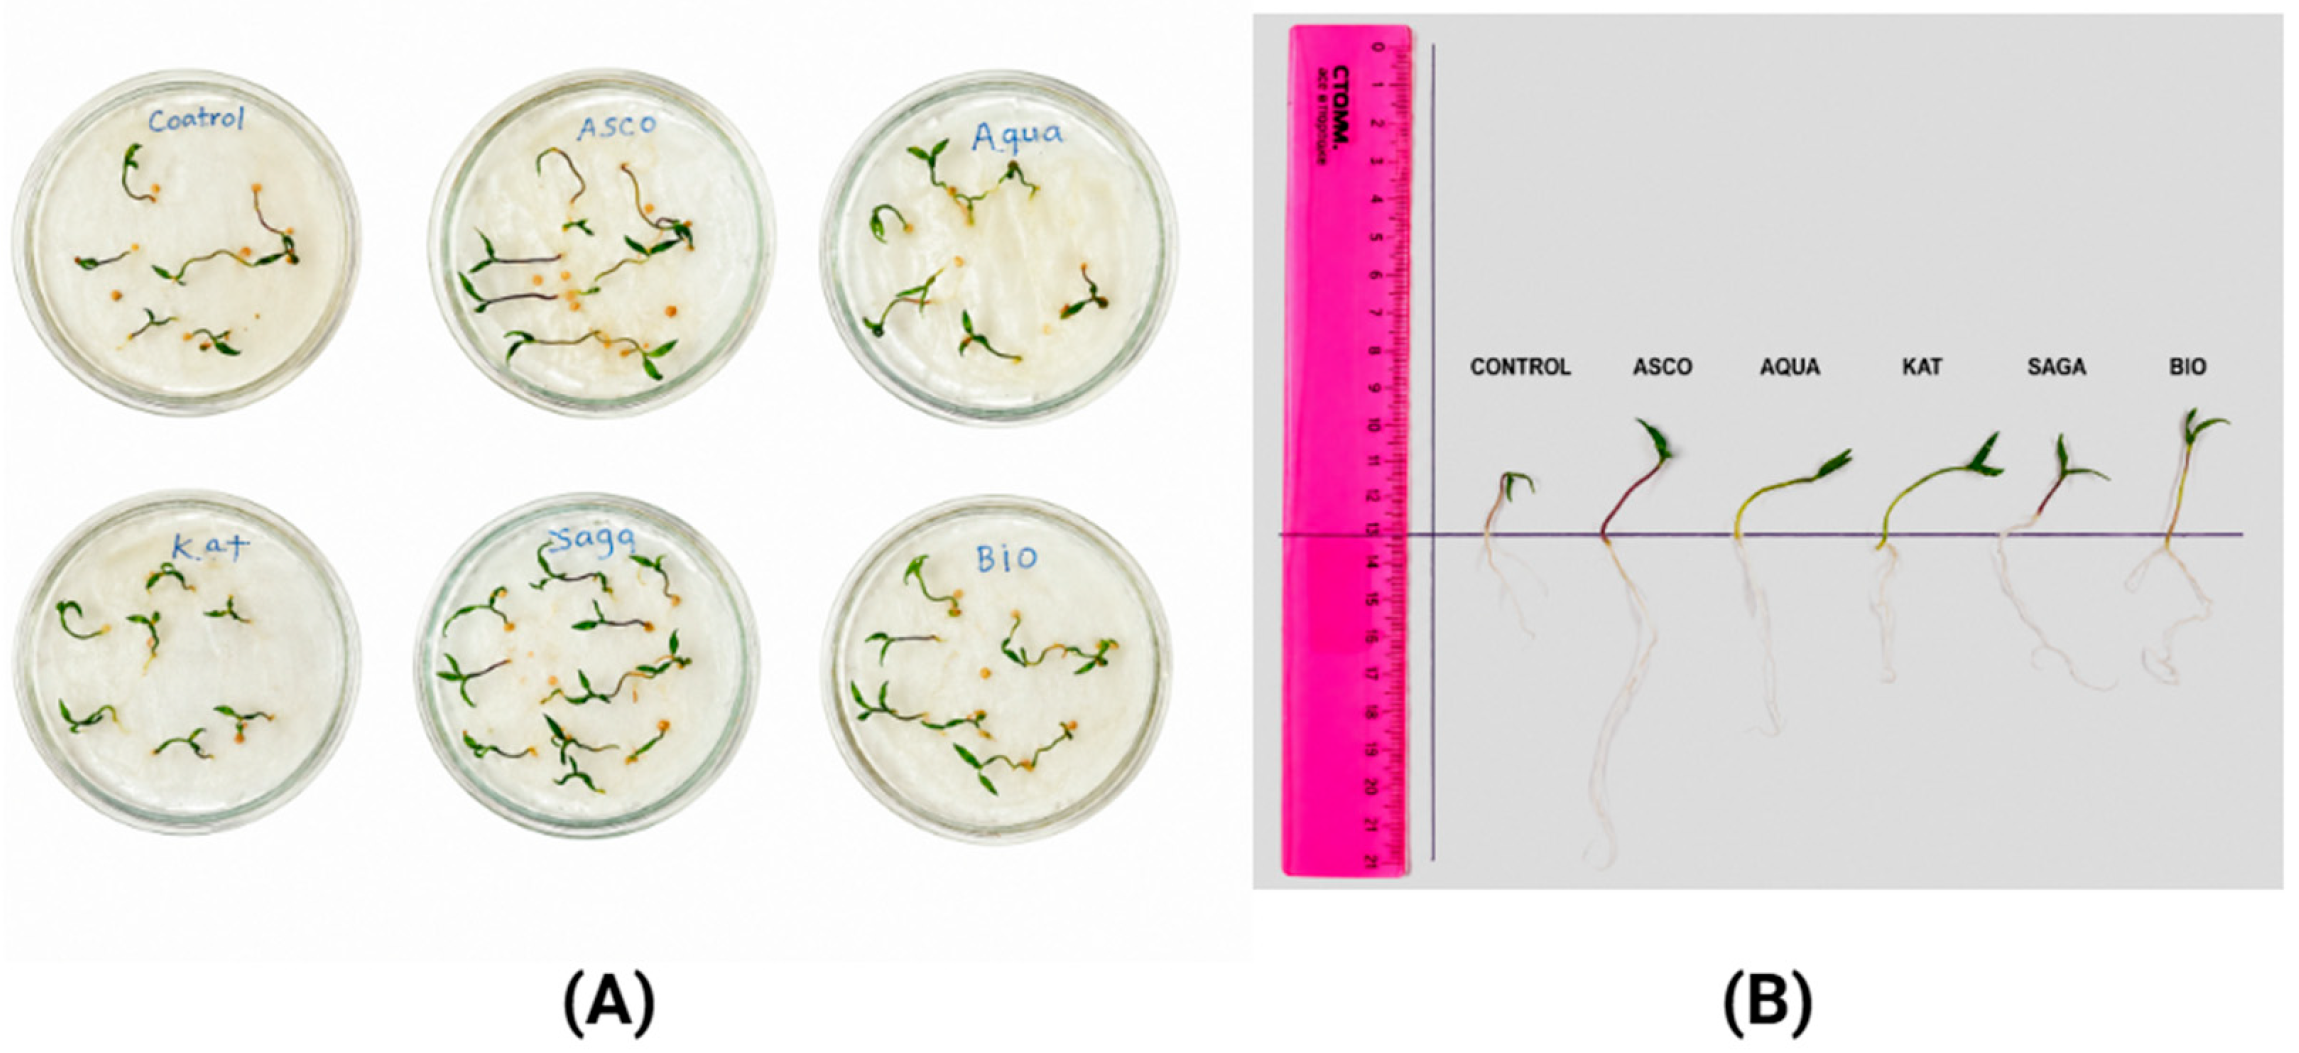
Seed germination and early seedling growth were evaluated using a standardized in vitro Petri plate bioassay (Figure 1). Sterile 90 mm Petri dishes were lined with two layers of sterile Whatman No. 1 filter paper moistened with 5 mL of the respective SWE solution, whereas the seeds used in the control treatment (CON) were moistened with sterile distilled water. Ten surface-sterilized seeds were placed in each dish, and a third sterile filter paper layer was placed over the seeds to maintain uniform moisture contact. Petri dishes were sealed with Parafilm and incubated under the conditions described in Section 2.1. To maintain adequate moisture for seed germination, the Petri dishes were periodically inspected throughout the experimental period. When visible drying of the filter paper was observed, a small volume of sterile distilled water was added to restore the moisture and prevent desiccation. To minimize potential positional effects within the growth chamber, the Petri dishes were randomly arranged and repositioned daily throughout the experiment.
Petri dishes were inspected once daily throughout the 10-day experimental period, and germination was recorded based on visible radicle emergence of >2 mm. On day 10, seedlings were harvested for morphological and biomass assessments. Seedlings with obvious morphological abnormalities were excluded from the growth measurements. No microbial contamination was observed throughout the experiment.

2.3. Germination Parameters

Seed germination was quantified using standardized indices that describe germination capacity, temporal dynamics, and seedling vigor. All indices were calculated at the Petri dish level using the established germination assessment methods.

2.3.1. Final Germination Percentage (FGP)

FGP was calculated as the proportion of seeds that germinated during the experimental period [7].
F G P = N f i n a l S × 100
where Nfinal is the total number of germinated seeds and S is the total number of seeds per replicate.

2.3.2. Mean Germination Time (MGT)

MGT is the average time required for germination and was calculated as follows [26]:
M G T = n i t i n i
where ni is the number of seeds germinated at time ti.

2.3.3. Germination Index (GI)

The GI integrates both the germination rate and capacity [27].
G I = i = 1 k n i t i
where ni is the number of seeds that germinate on day ti.

2.3.4. Coefficient of Velocity of Germination (CVG)

The CVG, which reflects the rate of germination, was calculated as follows [28]
C V G = n i n i t i × 100
where ni is the number of seeds that germinate on day ti.

2.3.5. Time to 50% Germination (T50)

T50 was estimated using linear interpolation as the time required to reach 50% of the final germination achieved in each treatment [29].
T 50 = t i + ( N / 2 ) N i N j N i t j t i
where N is the final cumulative germination, N/2 represents 50% of the final germination achieved by a treatment, and Ni and Nj are the cumulative germination values immediately below and above N/2 at times ti and tj, respectively.

2.3.6. Seedling Vigor Index (SVI)

The SVI, which integrates germination performance and seedling growth, was calculated as follows:
S V I = F G P × M e a n S e e d l i n g L e n g t h
The mean seedling length was calculated using normally germinated seedlings and represented the combined shoot length (SL) and root length (RL) per seedling [30].

2.4. Morphological Growth Measurements

Morphological growth parameters were measured on day 10 of the experiment. Seedlings were gently removed from the Petri dishes, rinsed with sterile distilled water, and blotted dry before measurements. SL was measured from the cotyledonary junction to the apical tip, and RL was measured from the point of radicle emergence to the root-tip. Leaf length (LL) and leaf width (LW) were measured on the first fully expanded true leaf of each normal seedling. All measurements were obtained using a digital Vernier caliper and calibrated ruler and expressed in centimeters (cm) [7]. Measurements from all normal seedlings in each Petri dish were averaged to obtain a single value per experimental unit for statistical analysis.

2.5. Biomass Accumulation Analysis

Fresh and dry biomass were quantified to evaluate the effects of the treatments on the seedling biomass accumulation. Shoots and roots were separated using sterile scalpel blades. Shoot fresh weight (SFW) and root fresh weight (RFW) were measured using an analytical balance (0.0001 g readability). The samples were then oven-dried at 70 °C for 48 h, cooled to room temperature, and weighed to determine the shoot dry weight (SDW) and root dry weight (RDW). The total dry weight (TDW) was calculated as the sum of the SDW and RDW [7].

2.6. Biomass Allocation and Moisture Content Parameters

The moisture content (MC) on a fresh mass basis was calculated as follows [31]:
M C = F W D W F W × 100
where FW and DW represent fresh and dry weights, respectively.
The shoot-to-root ratio (S/R) was calculated as follows [31]:
S / R = S D W R D W
where SDW and RDW denote the shoot and root dry weights, respectively.
The root investment ratio (RIR) was calculated as follows [31]:
R I R = R D W T D W R L S L
where RDW is the root dry weight, TDW is the total dry weight, RL is the root length, and SL is the shoot length. Because RIR is a recently proposed index, it was included as an exploratory metric and interpreted alongside the underlying biomass and growth measurement.

2.7. Statistical Analysis

Data were analyzed using IBM SPSS Statistics v27.0 (IBM Corp., Armonk, NY, USA). Normality and homogeneity of variance were assessed using the Shapiro–Wilk and Levene tests, respectively. No substantial violations of the ANOVA assumptions were observed; therefore, no data transformation was applied. The test statistics and p-values are provided in Supplementary Table S1. Petri dishes (n = 5 per treatment) were considered experimental units, and seedling-level measurements were averaged within each dish prior to analysis. Germination parameters, morphological traits, biomass variables, and biomass allocation indices were analyzed using one-way ANOVA. When significant differences were observed, the means were separated using Tukey’s HSD test at p < 0.05. The results are presented as mean ± standard error based on five experimental replicates for each treatment. Detailed ANOVA outputs, including F-values, degrees of freedom, p-values, and eta-squared effect sizes are provided in Supplementary Table S2. The complete plate-level dataset used for the statistical analyses is provided in Supplementary Data S1.

2.8. Correlation and Multivariate Analysis

Pearson’s correlation analysis was performed to explore the associations among germination, growth, biomass, and moisture-related traits of C. annuum seedlings treated with commercial SWE formulations. Correlation coefficients (r) were calculated using pooled plate-level observations from all treatments (n = 30). The false discovery rate (FDR) correction was applied to account for multiple comparisons. The correlation coefficient, raw p-value, and FDR-adjusted p-value matrices are provided as Supplementary Data S2–S4, respectively.
The variables included FGP, SL, RL, LL, LW, SFW, RFW, SDW, RDW and MC. Correlation analyses were performed using Python 3.10 with the Pandas, NumPy, and SciPy libraries. Pearson correlation heatmaps were generated using Seaborn v0.13.0 and Matplotlib v3.8.0.
PCA was conducted to summarize the multivariate variation among the treatments and identify the variables contributing to the principal axes of variation. All variables were standardized using z-score normalization prior to analysis. Only primary germination, growth, biomass, and moisture-related traits were included in the PCA, whereas derived indices and composite variables were excluded to minimize redundancy. PCA was performed using the scikit-learn library, and biplots were generated to visualize the treatment distribution in multivariate space and variable loadings. The PCA loading matrix and eigenvalue summaries are presented in Supplementary Tables S3 and S4, respectively. All analyses and visualizations were performed in the Jupyter Notebook 7.6.0 environment.

3. Results

3.1. Effects of SWE on Seed Germination Characteristics

3.1.1. Final Germination Percentage

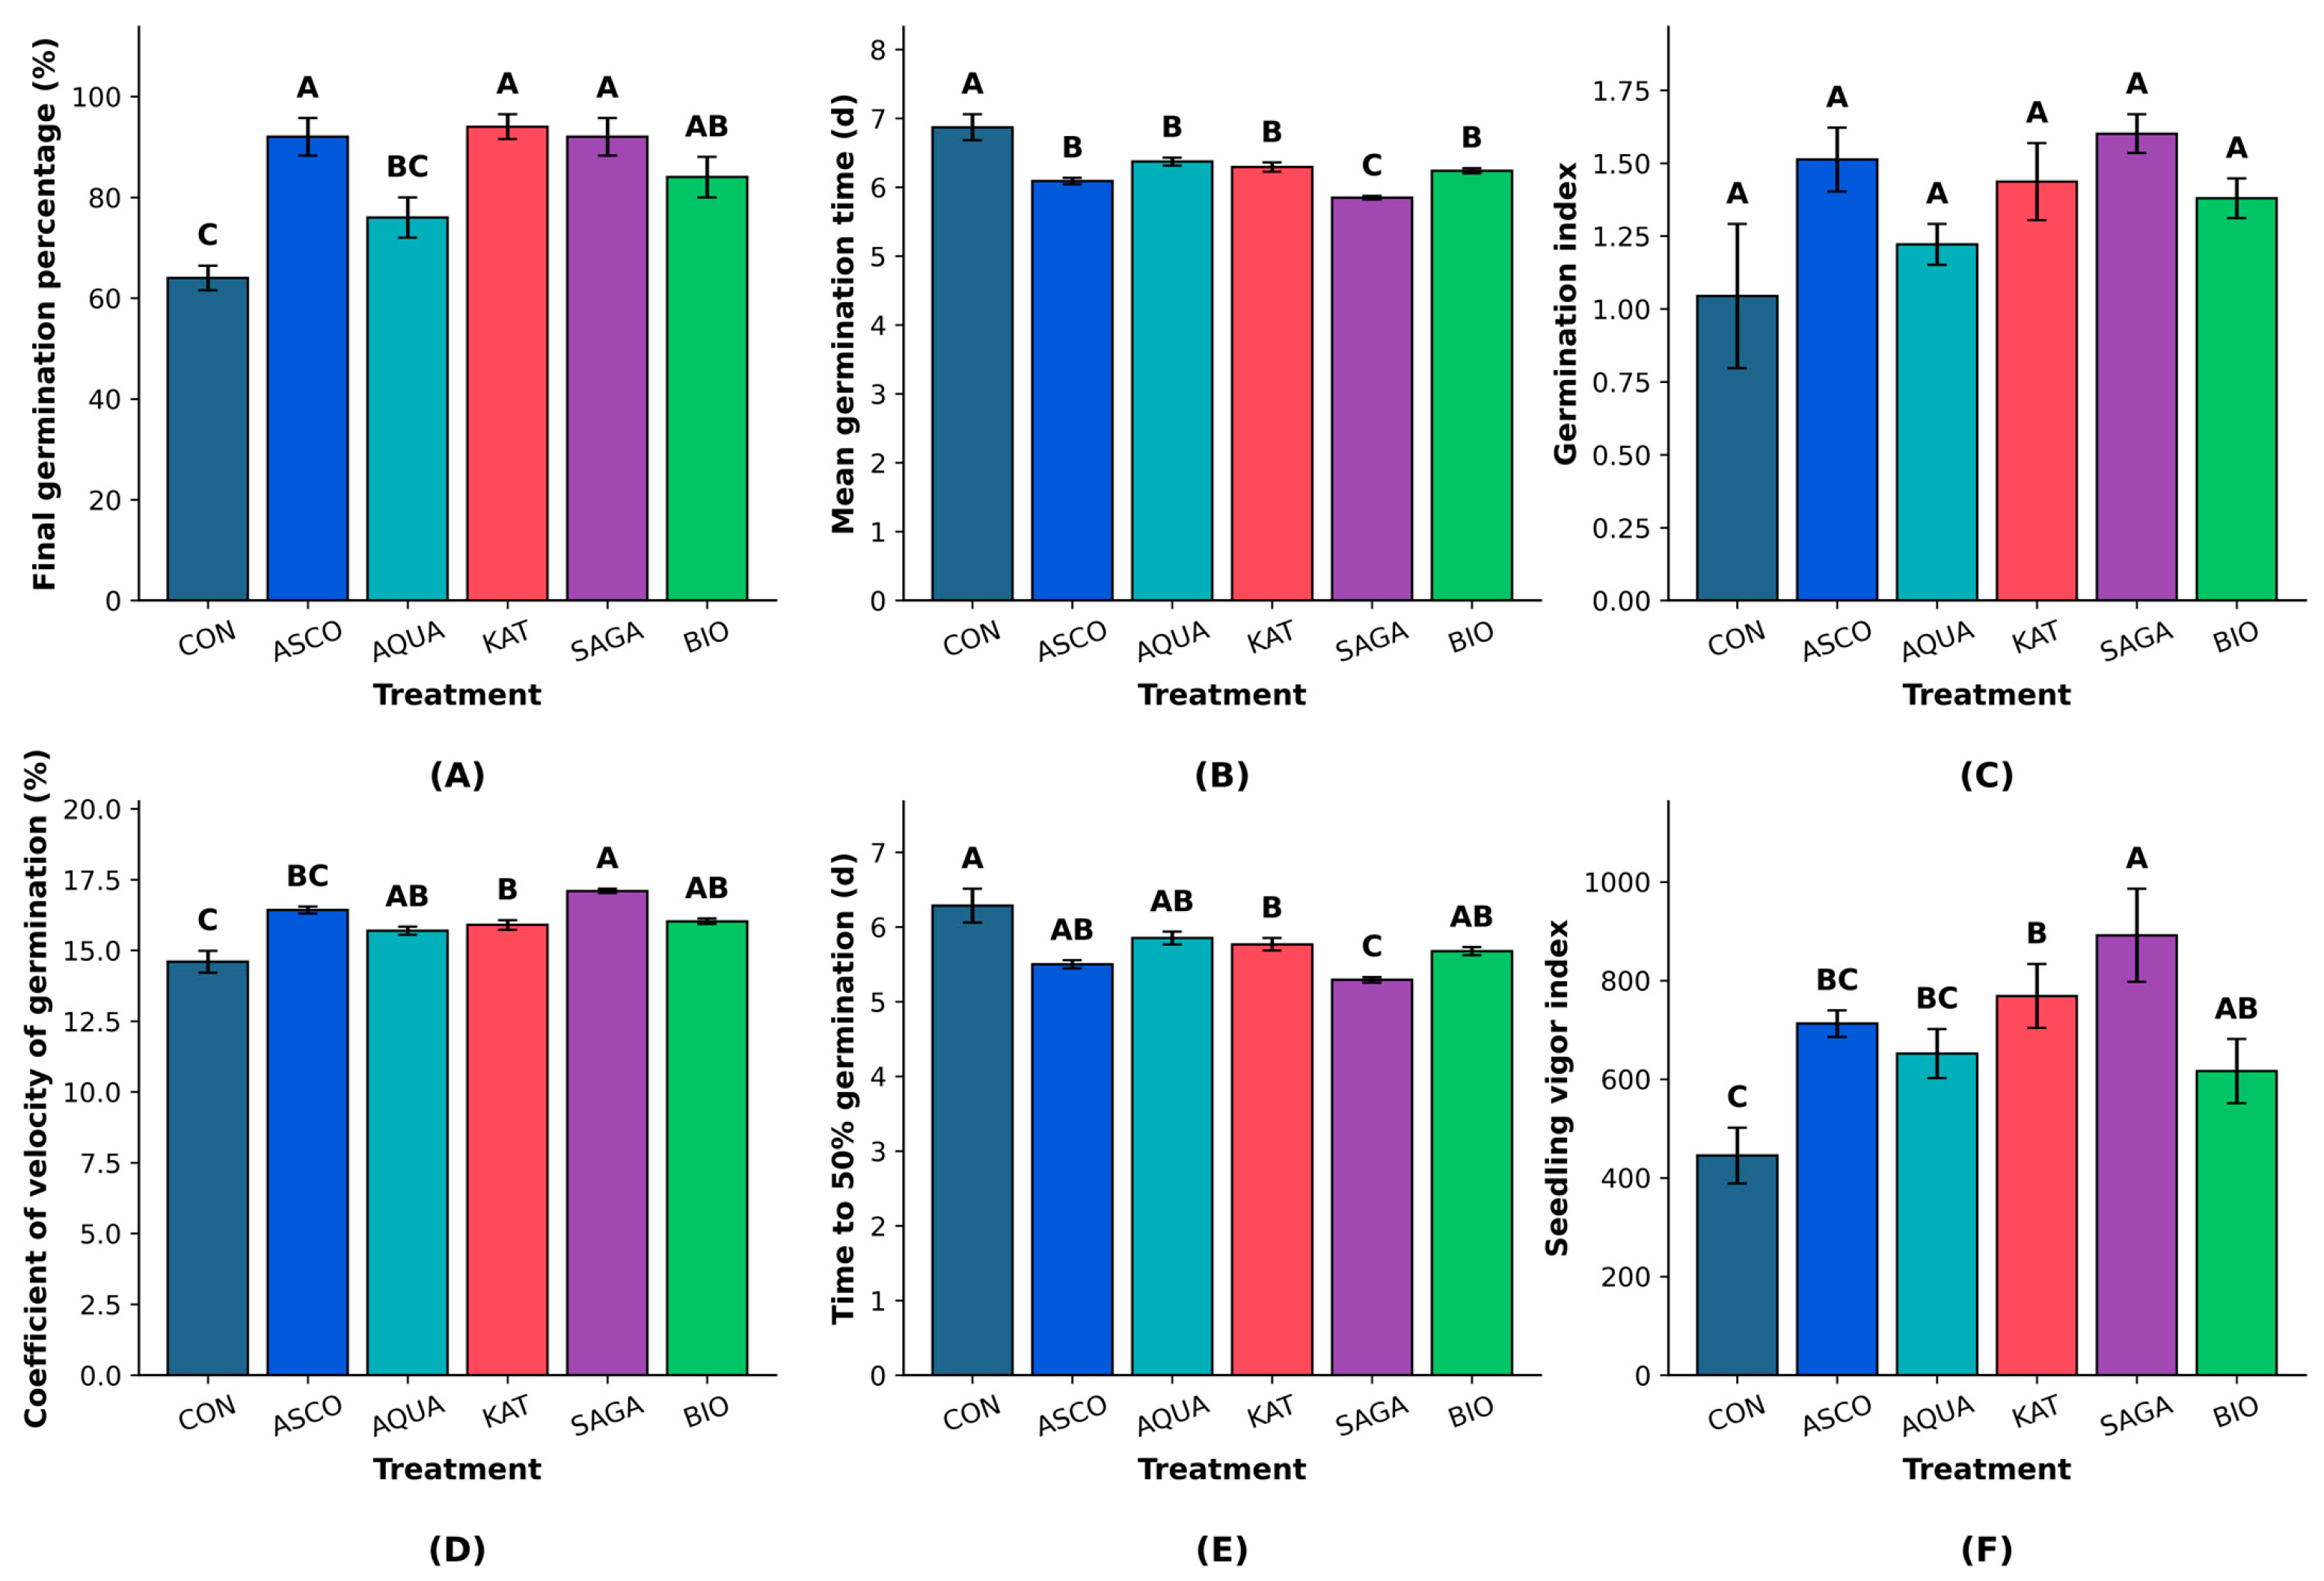
Commercial SWE formulations significantly affected the FGP of C. annuum seedlings (Figure 2A). The highest FGP was observed in KAT (94%), followed by ASCO and SAGA (92%). BIO and AQUA recorded FGP values of 84% and 76%, respectively, whereas CON exhibited the lowest FGP (64%). According to Tukey’s HSD test, KAT, SAGA, and ASCO showed significantly higher FGP than CON. BIO exhibited an intermediate response and did not differ significantly from either CON or the highest-performing treatment. Although AQUA recorded a numerically higher FGP (76%) than CON (64%), the difference was not statistically significant. Compared with CON, KAT, SAGA, ASCO, and BIO exhibited relative FGP values that were 46.9%, 43.8%, 43.8%, and 31.3% higher, respectively.

3.1.2. Germination Dynamics and Germination Speed Indices

Commercial SWE formulations significantly influenced MGT, CVG, and T50. However, no significant treatment effect was observed on the GI (Figure 2B–E). The CON recorded the highest MGT (6.87 d), whereas SAGA exhibited the lowest (5.85 d). Tukey’s HSD analysis indicated that SAGA germinated significantly faster than all other treatments and the CON. ASCO, AQUA, KAT, and BIO formed an intermediate group that did not differ significantly from each other.
A similar pattern was observed for T50, where CON showed the highest value (6.30 d) and SAGA the lowest value (5.30 d). SAGA exhibited a significantly lower T50 than CON, whereas ASCO, AQUA, KAT, and BIO showed intermediate responses.
Although numerical variation was observed in GI, all treatments shared the same significance group; therefore, no statistically significant differences were observed among the treatments (Figure 2C). In contrast, the CVG differed significantly among the treatments (Figure 2D). SAGA recorded the highest CVG (17.08%), followed by ASCO (16.44%), whereas CON exhibited the lowest value (14.63%). SAGA showed significantly higher CVG than CON, whereas ASCO, AQUA, KAT, and BIO displayed intermediate responses.
The cumulative germination curves further supported these observations, with SAGA reaching maximum germination earlier than CON, whereas ASCO, AQUA, KAT, and BIO exhibited intermediate germination dynamics (Figure S6).

3.1.3. Seedling Vigor Index

SVI was significantly affected by the SWE treatment (Figure 2F). SAGA recorded the highest SVI (891.6), followed by KAT (768.6) and ASCO (711.2), whereas CON exhibited the lowest value (447.6). Tukey’s HSD analysis indicated that SAGA showed a significantly higher SVI than the CON. ASCO, AQUA, KAT, and BIO showed intermediate responses and did not differ significantly from either SAGA or CON.

3.2. Effects of Commercial SWE Formulations on Early Seedling Morphology

3.2.1. Shoot and Root Growth

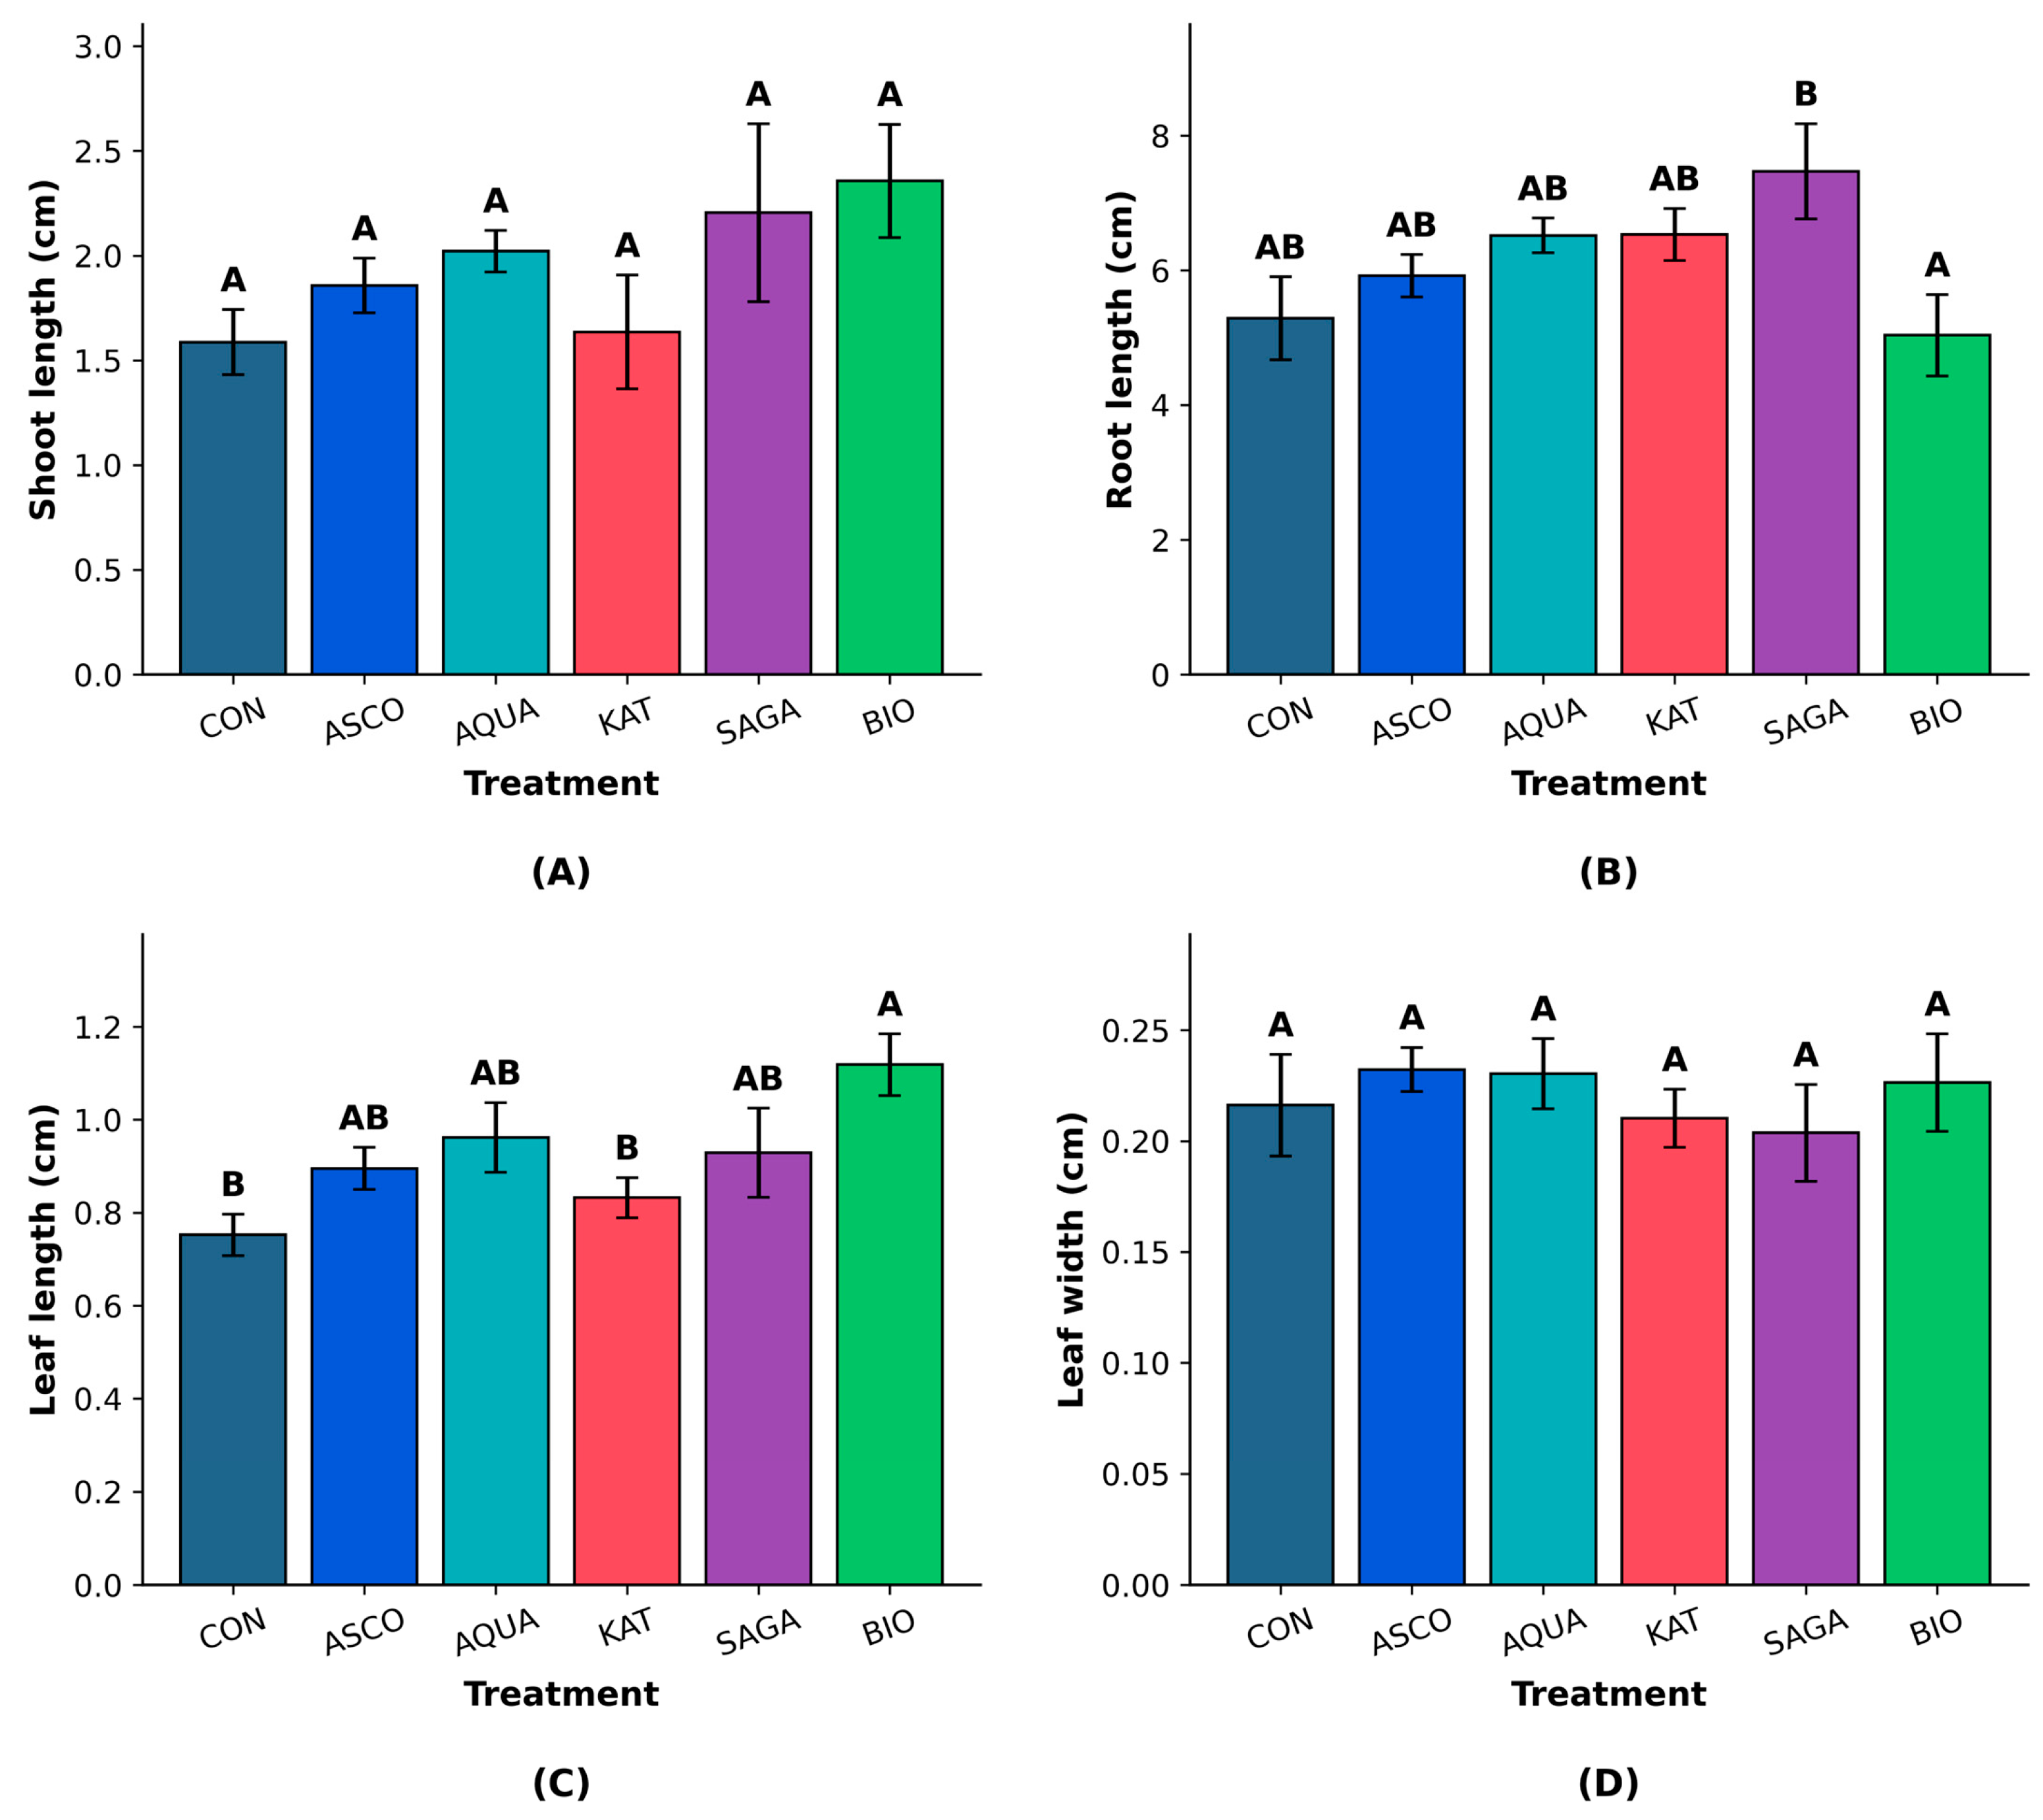
Commercial SWE formulations significantly affected RL, whereas no significant treatment effect was observed on the SL of C. annuum seedlings (Figure 3A,B). Although numerical variation was observed among the treatments for SL, all treatments belonged to the same significance group according to Tukey’s HSD test (Figure 3A). BIO recorded the highest numerical SL (2.36 cm), followed by SAGA (2.22 cm) and AQUA (2.02 cm), whereas CON recorded the lowest value (1.60 cm).
In contrast, significant treatment effects were observed for the RL (Figure 3B). SAGA recorded the highest RL (7.46 cm), which was significantly higher than that of BIO, which exhibited the lowest RL among the SWE treatments (5.03 cm). The CON, ASCO, AQUA, and KAT formed intermediate groups and did not differ significantly from either SAGA or BIO. Although ASCO, AQUA, and KAT exhibited numerically higher RL values than CON, these differences were not statistically significant.

3.2.2. Leaf Development Responses

Commercial SWE formulations significantly influenced LL, whereas LW was not significantly affected by the treatment (Figure 3C,D). BIO showed the highest LL (1.12 cm) and differed significantly from CON and KAT, which recorded the lowest LL values. ASCO, AQUA, and SAGA exhibited intermediate LL values and did not differ significantly from either BIO or CON.
LW ranged from 0.20 to 0.23 cm across the treatments (Figure 3D). Although ASCO and AQUA showed numerically higher LW values than CON, all treatments belonged to the same significance group, indicating the absence of statistically significant treatment effects on LW.

3.3. Effects of Commercial SWE Formulations on Biomass Accumulation

3.3.1. Fresh Biomass Responses

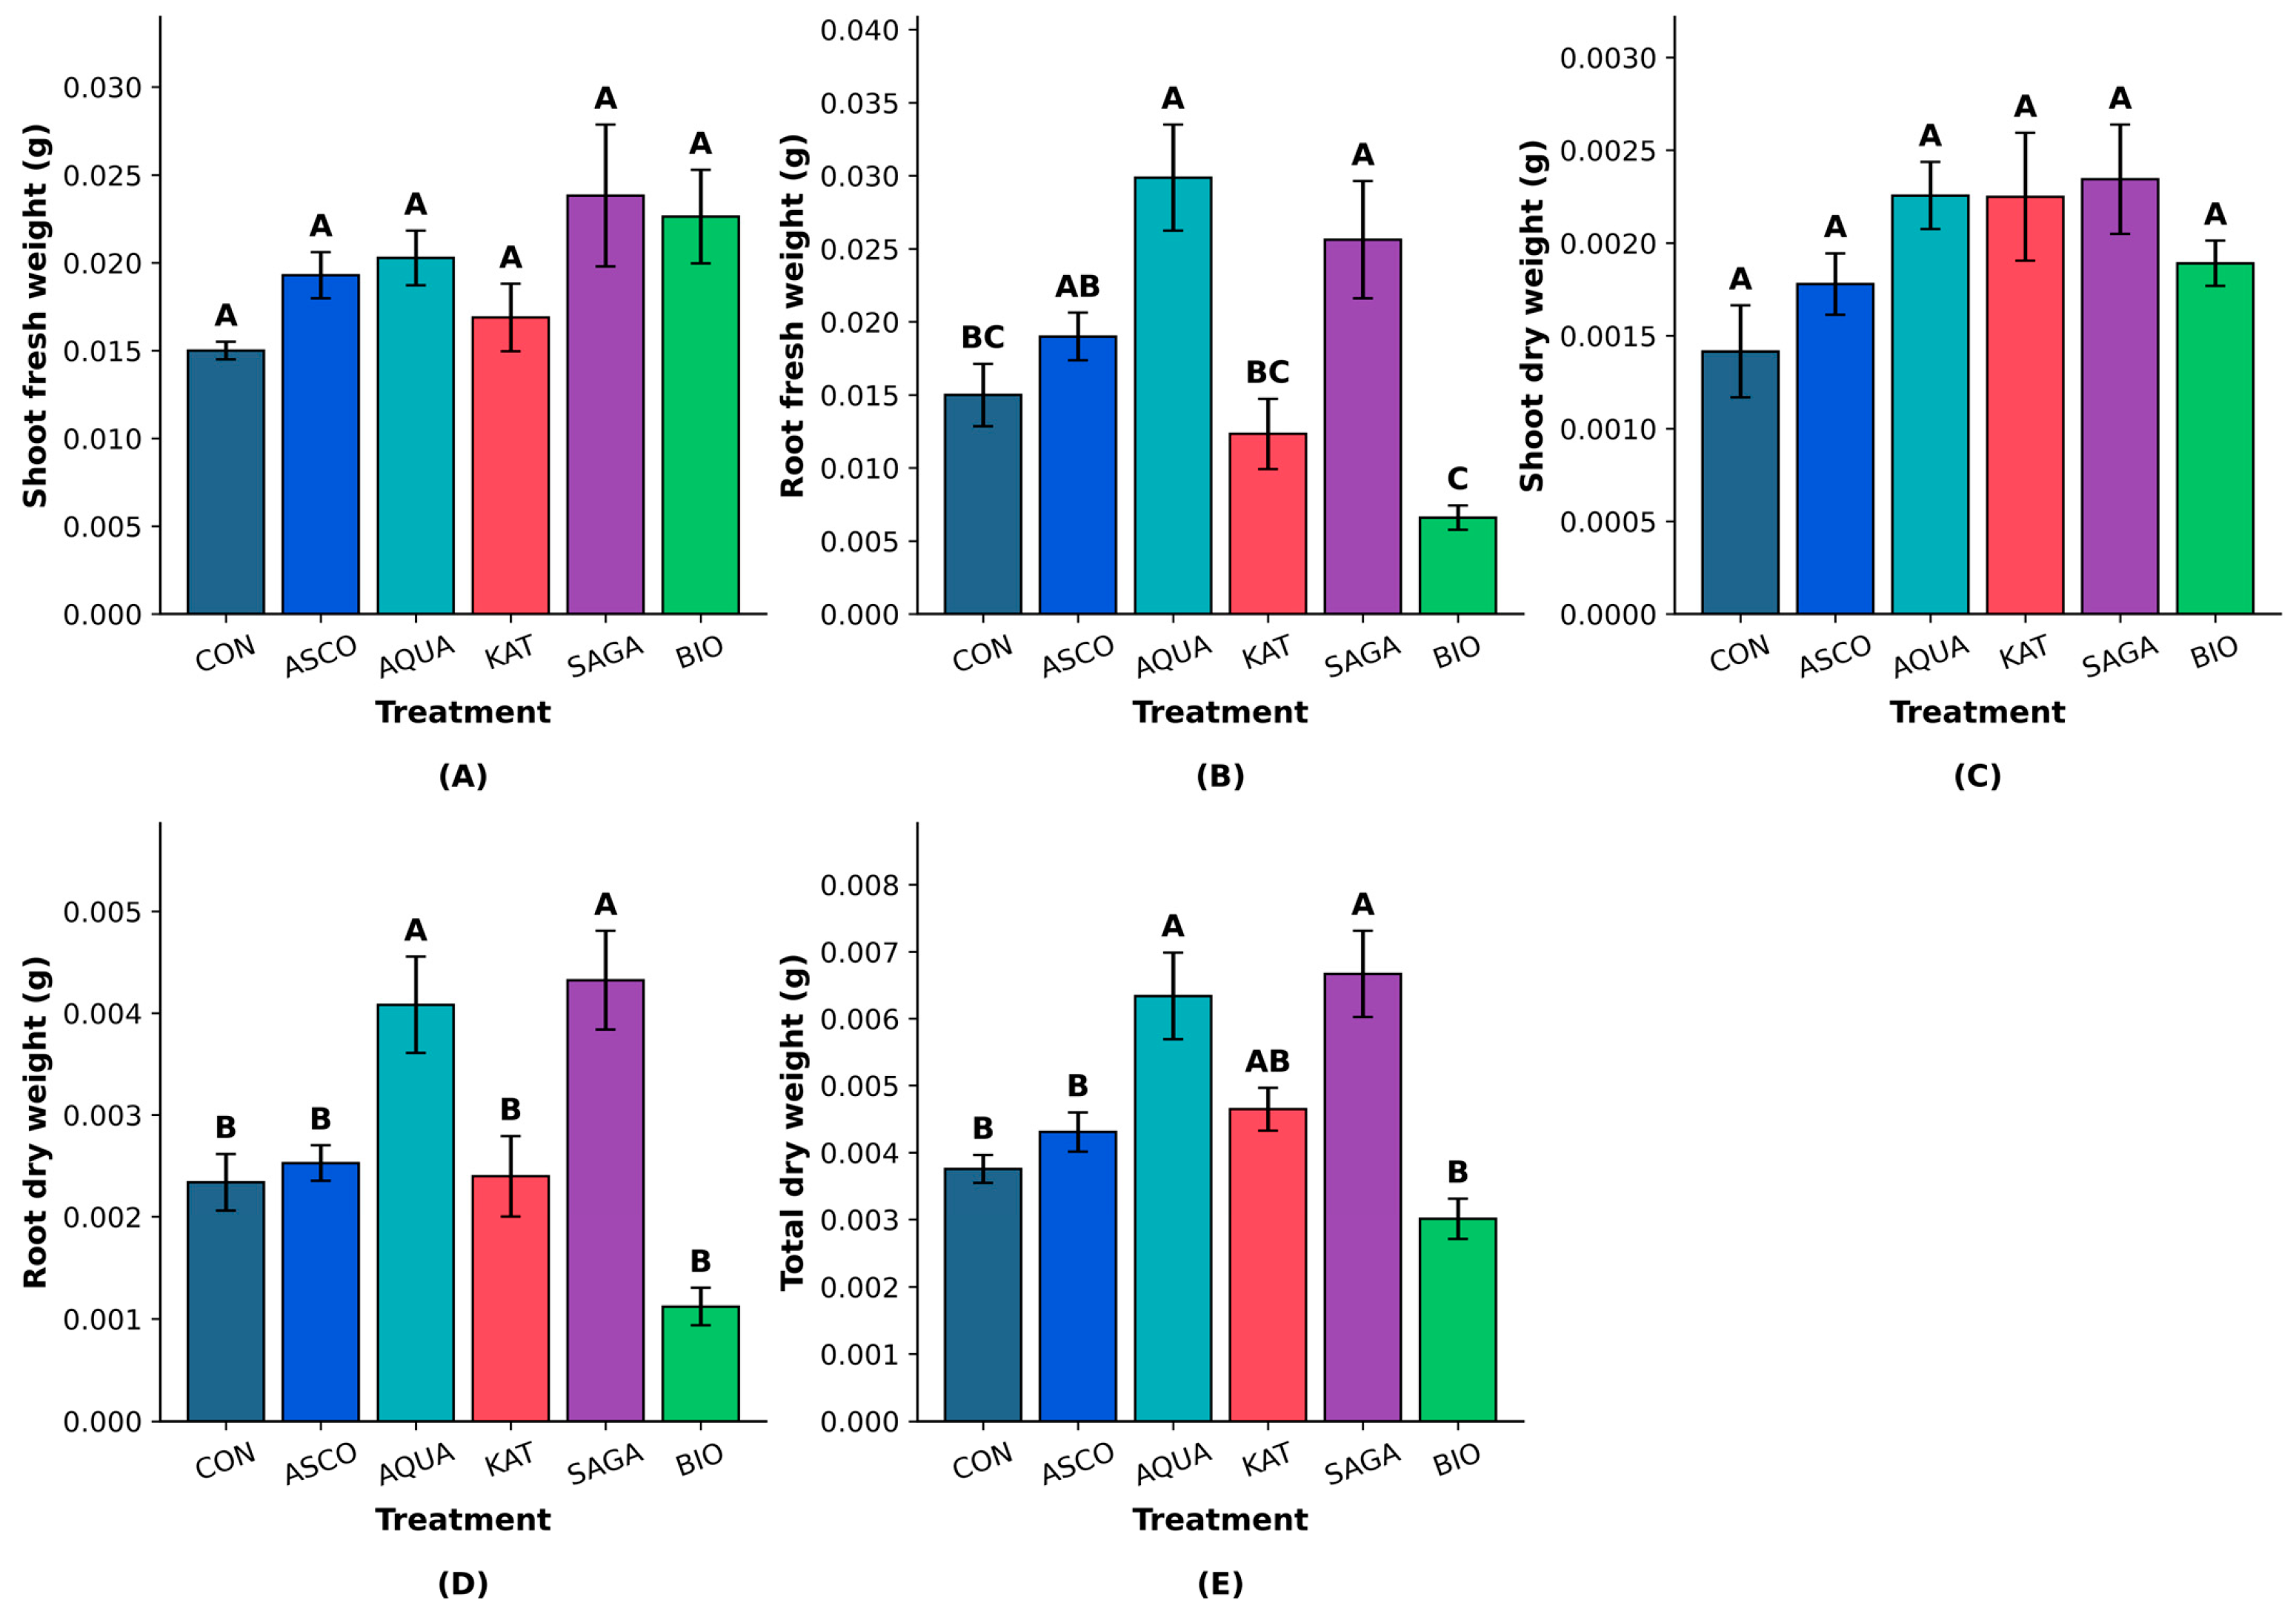
Commercial SWE formulations significantly affected RFW, whereas no significant treatment effect was observed for SFW (Figure 4A,B). However, no significant differences were observed among the treatments for SFW, as all treatments belonged to the same significance group (Figure 4A). Although no significant treatment effects were detected for SFW, SAGA recorded the highest numerical value (0.0238 g), followed by BIO (0.0226 g) and AQUA (0.0203 g), whereas CON exhibited the lowest value (0.0150 g).
Significant differences were observed in the RFW (Figure 4B). AQUA showed the highest RFW (0.0299 g), followed by SAGA (0.0256 g), whereas BIO had the lowest value (0.0066 g). Tukey’s HSD analysis indicated that AQUA and SAGA exhibited significantly higher RFW than BIO. The CON, ASCO, and KAT formed intermediate groups and did not differ significantly from the highest- or lowest-performing treatments. Although AQUA exhibited a numerically 99.3% higher RFW than CON, this difference was not statistically significant.

3.3.2. Dry Biomass Accumulation

Commercial SWE formulations significantly influenced RDW and TDW, whereas no significant treatment effects were observed on SDW (Figure 4C–E). Although no significant treatment effects were detected for SDW, SAGA recorded the highest SDW (0.0023 g), followed closely by AQUA (0.0022 g), whereas CON exhibited the lowest value (0.0014 g). However, all treatments belonged to the same significance group, indicating the absence of statistically significant differences in the SDW.
Significant treatment effects were observed on RDW (Figure 4D). SAGA (0.0043 g) and AQUA (0.0041 g) recorded the highest RDW values, which differed significantly from those of CON, ASCO, KAT, and BIO. BIO exhibited the lowest RDW (0.0011 g), whereas ASCO, KAT, and CON showed intermediate values.
A similar pattern was observed for the TDW (Figure 4E). SAGA recorded the highest TDW (0.0067 g), followed by AQUA (0.0063 g). Both treatments differed significantly from CON, ASCO, and BIO. KAT exhibited an intermediate response and did not differ significantly from the highest- or lowest-performing treatments. BIO recorded the lowest TDW (0.0030 g) among the SWE treatments. Relative to the CON, TDW was 77.7% and 68.6% higher in SAGA and AQUA, respectively.

3.4. Biomass Allocation and Moisture Responses

3.4.1. Moisture Content

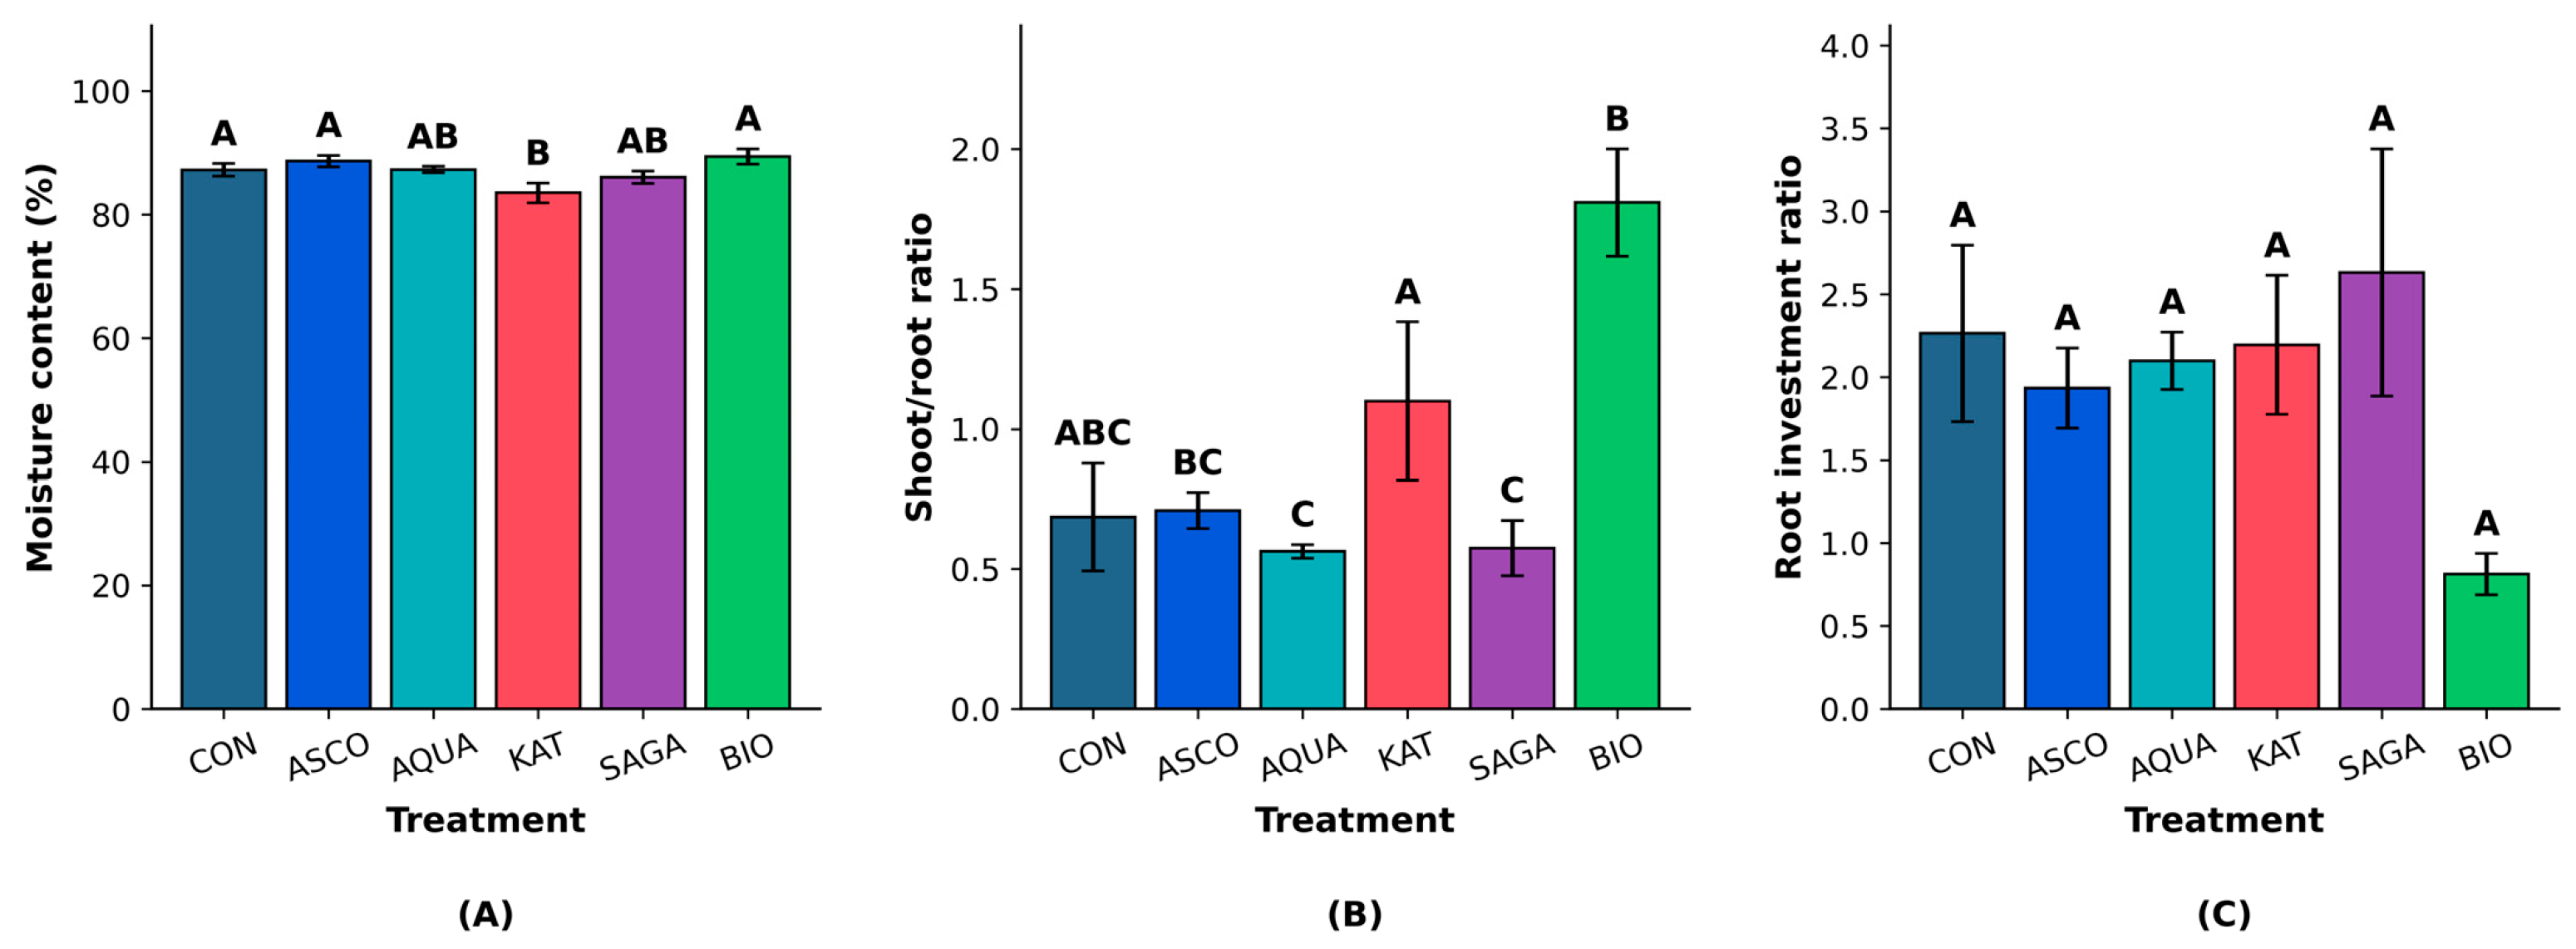
Commercial SWE formulations significantly influenced the seedling MC on a fresh mass basis (Figure 5A). BIO and ASCO recorded the highest MC values (89.41% and 88.68%, respectively), whereas KAT recorded the lowest (83.52%). According to Tukey’s HSD test, BIO and ASCO did not differ significantly from CON, whereas KAT showed significantly lower MC than ASCO and BIO. AQUA and SAGA exhibited intermediate responses and did not differ significantly from the treatments with the highest or lowest MC values.

3.4.2. Biomass Allocation Indices

Commercial SWE formulations significantly affected S/R ratios (Figure 5B). BIO recorded the highest S/R value (1.81) and differed significantly from ASCO, AQUA, and SAGA. KAT also exhibited a relatively high S/R value (1.10), whereas AQUA (0.56) and SAGA (0.57) recorded the lowest values. CON and ASCO displayed intermediate responses and did not differ significantly from most of the treatments. Notably, AQUA and SAGA shared significance groups with CON, indicating that their lower S/R values were not statistically different from those of untreated plants.
RIR varied numerically among the treatments (Figure 5C), ranging from 0.81 in BIO to 2.63 in SAGA. However, all treatments belonged to the same significance group, indicating the absence of statistically significant treatment effects on the RIR. Although SAGA exhibited the highest numerical RIR and BIO the lowest, these numerical differences were not supported by Tukey’s HSD test.

3.5. Correlation Analysis of Germination, Growth, and Biomass Variables

Pearson’s correlation analysis was performed to examine the relationships among primary germination, growth, biomass, and moisture-related traits of C. annuum seedlings treated with commercial SWE formulations (Figure 6). To avoid mathematical redundancy among the derived germination indices, only primary variables were included in the analysis. The complete correlation coefficients, p-values, and FDR-adjusted significance matrices are provided in Supplementary Data S2–S4.
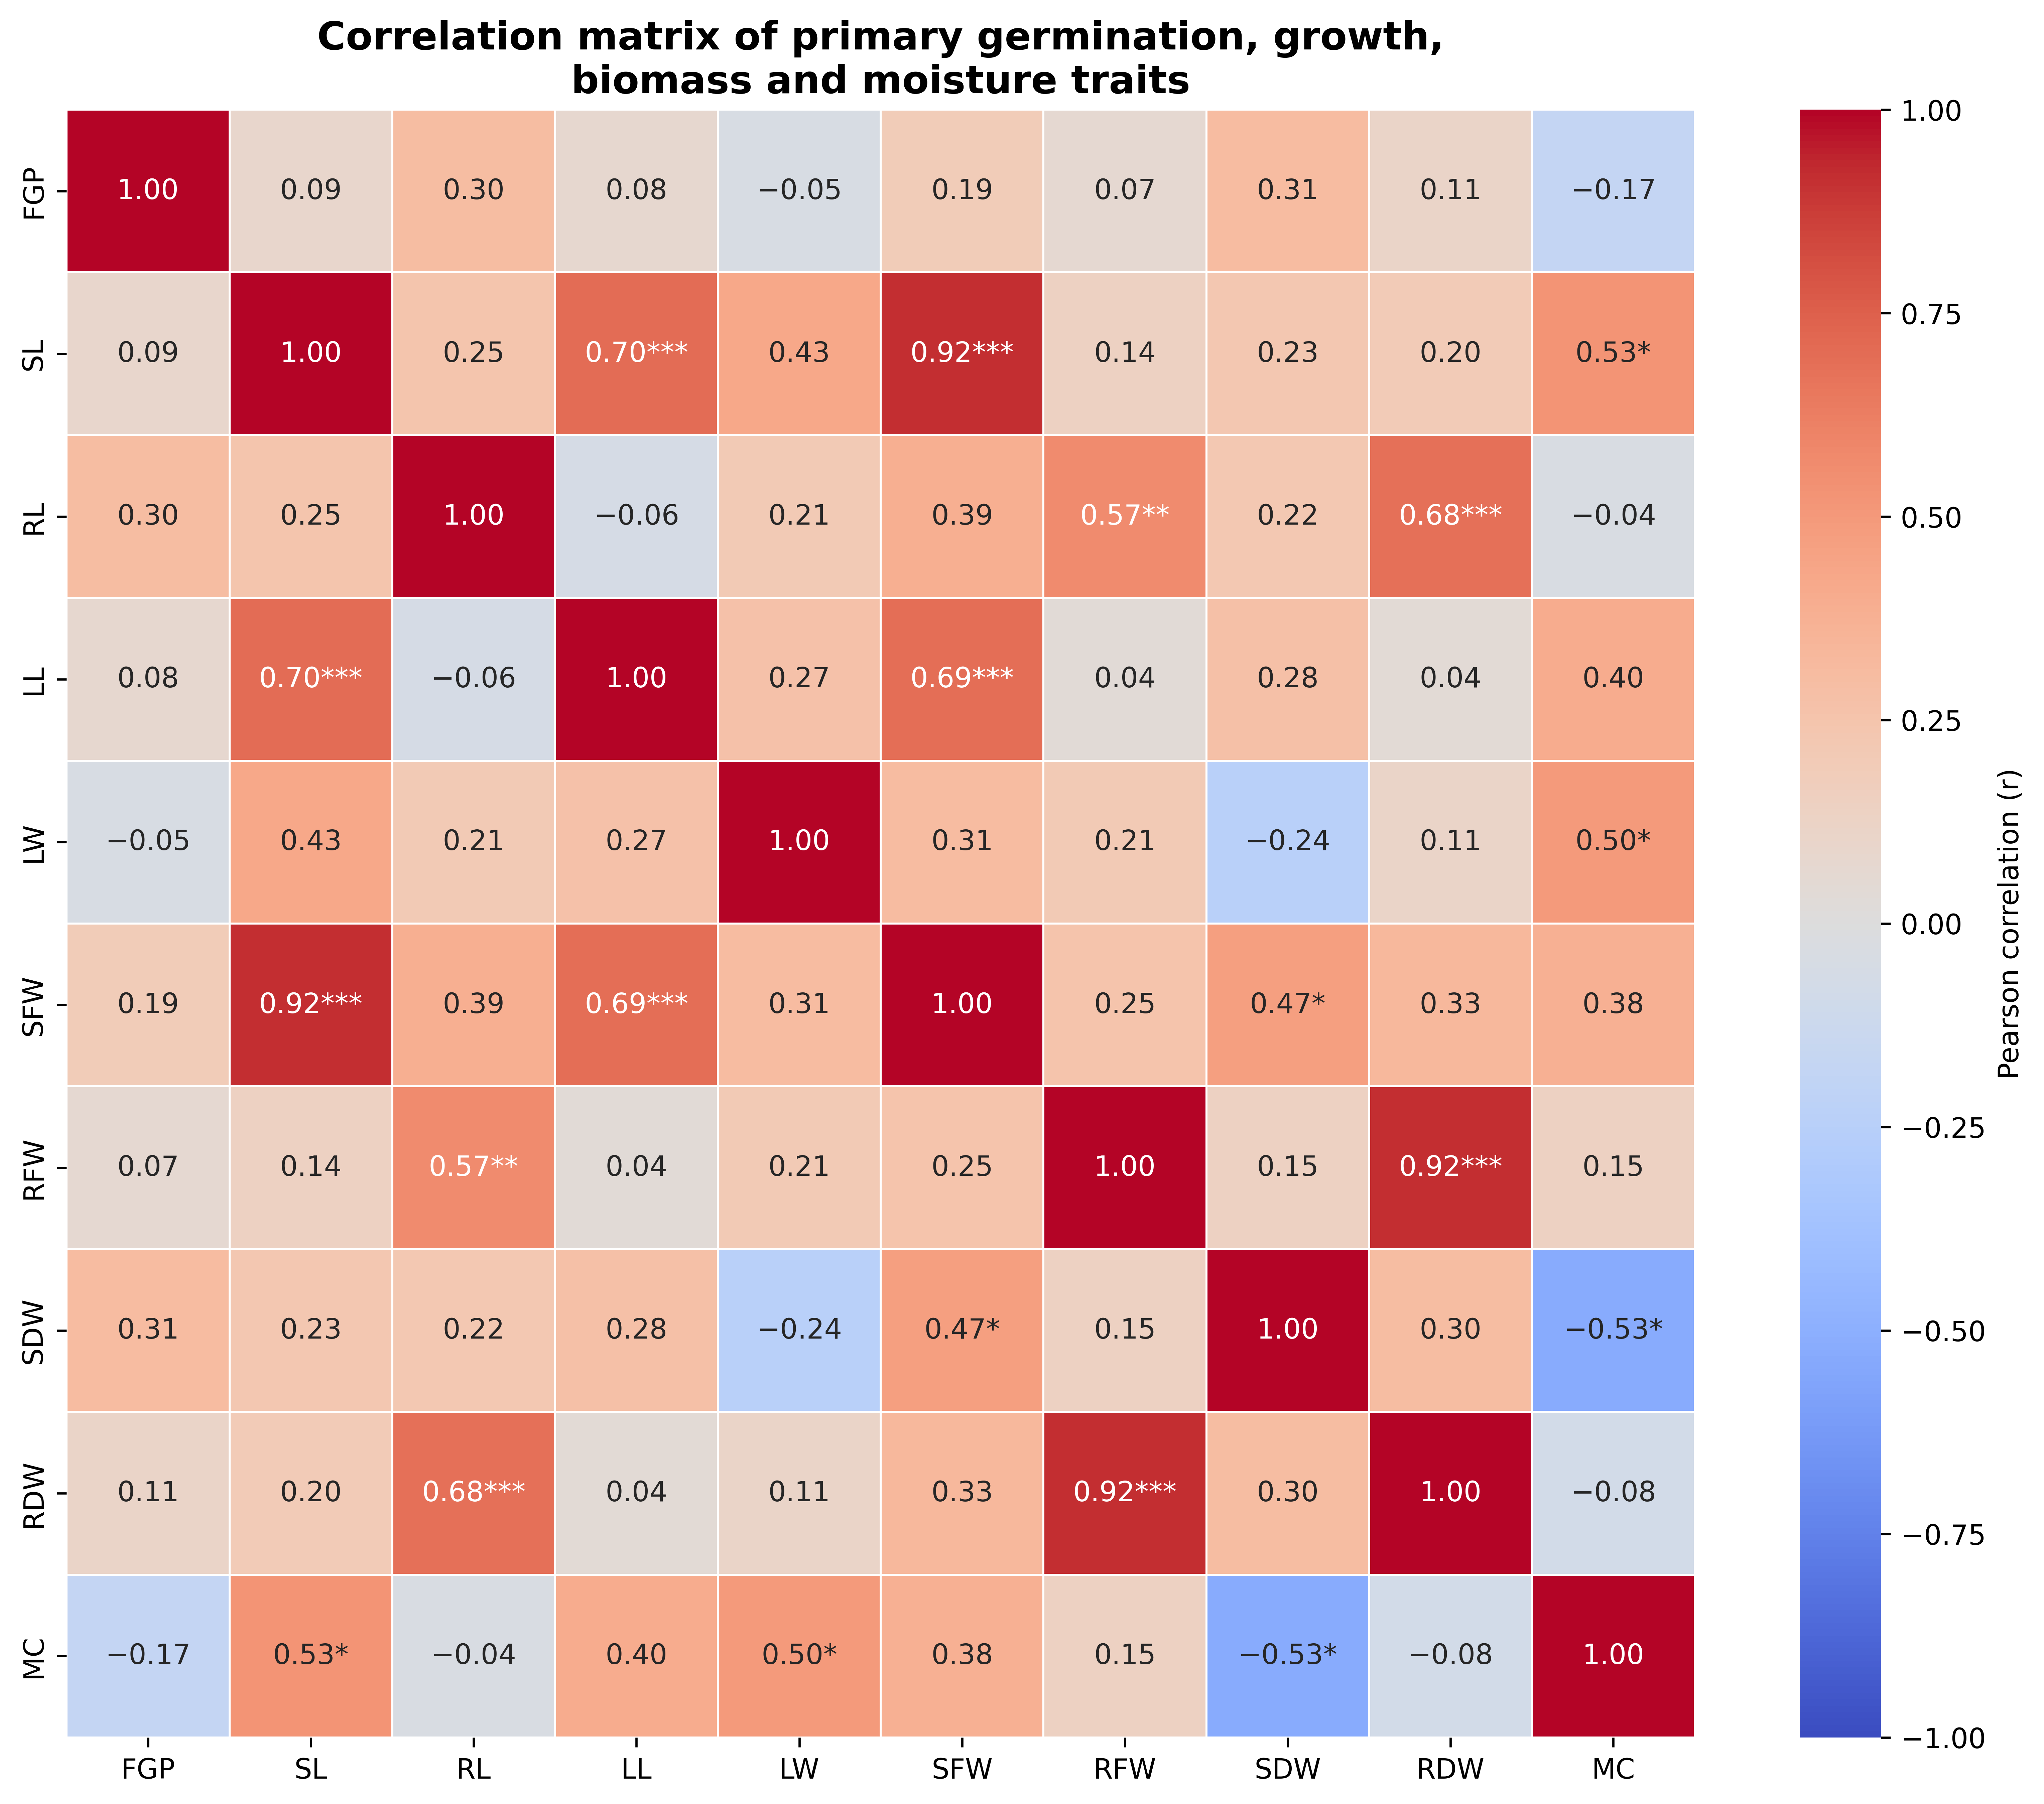
Several significant positive relationships were observed between seedling growth and biomass traits (Figure 6). SL exhibited strong positive correlations with SFW (r = 0.92, q < 0.001) and LL (r = 0.70, q < 0.001) measurements. LL was also positively associated with SFW (r = 0.69; q < 0.001).
Root-related traits also showed strong associations. RL was positively correlated with RFW (r = 0.57, q = 0.008) and RDW (r = 0.68, q < 0.001). In addition, RFW and RDW exhibited the strongest positive relationship among all measured variables (r = 0.92, q < 0.001), indicating a close correspondence between RFW and RDW.
Several moisture-related associations remained significant after FDR correction. MC was positively correlated with SL (r = 0.53, q = 0.016) and LW (r = 0.50, q = 0.027). In contrast, MC was negatively correlated with SDW (r = −0.53, q = 0.016), suggesting that seedlings with higher dry matter accumulation tended to exhibit lower MC.
Among the biomass variables, SFW showed a moderate positive correlation with SDW (r = 0.47, q = 0.040). No significant correlations involving FGP remained after FDR correction, indicating that the variation in FGP was largely independent of subsequent seedling growth and biomass traits under the conditions of this study.

3.6. Principal Component Analysis of Treatment Responses

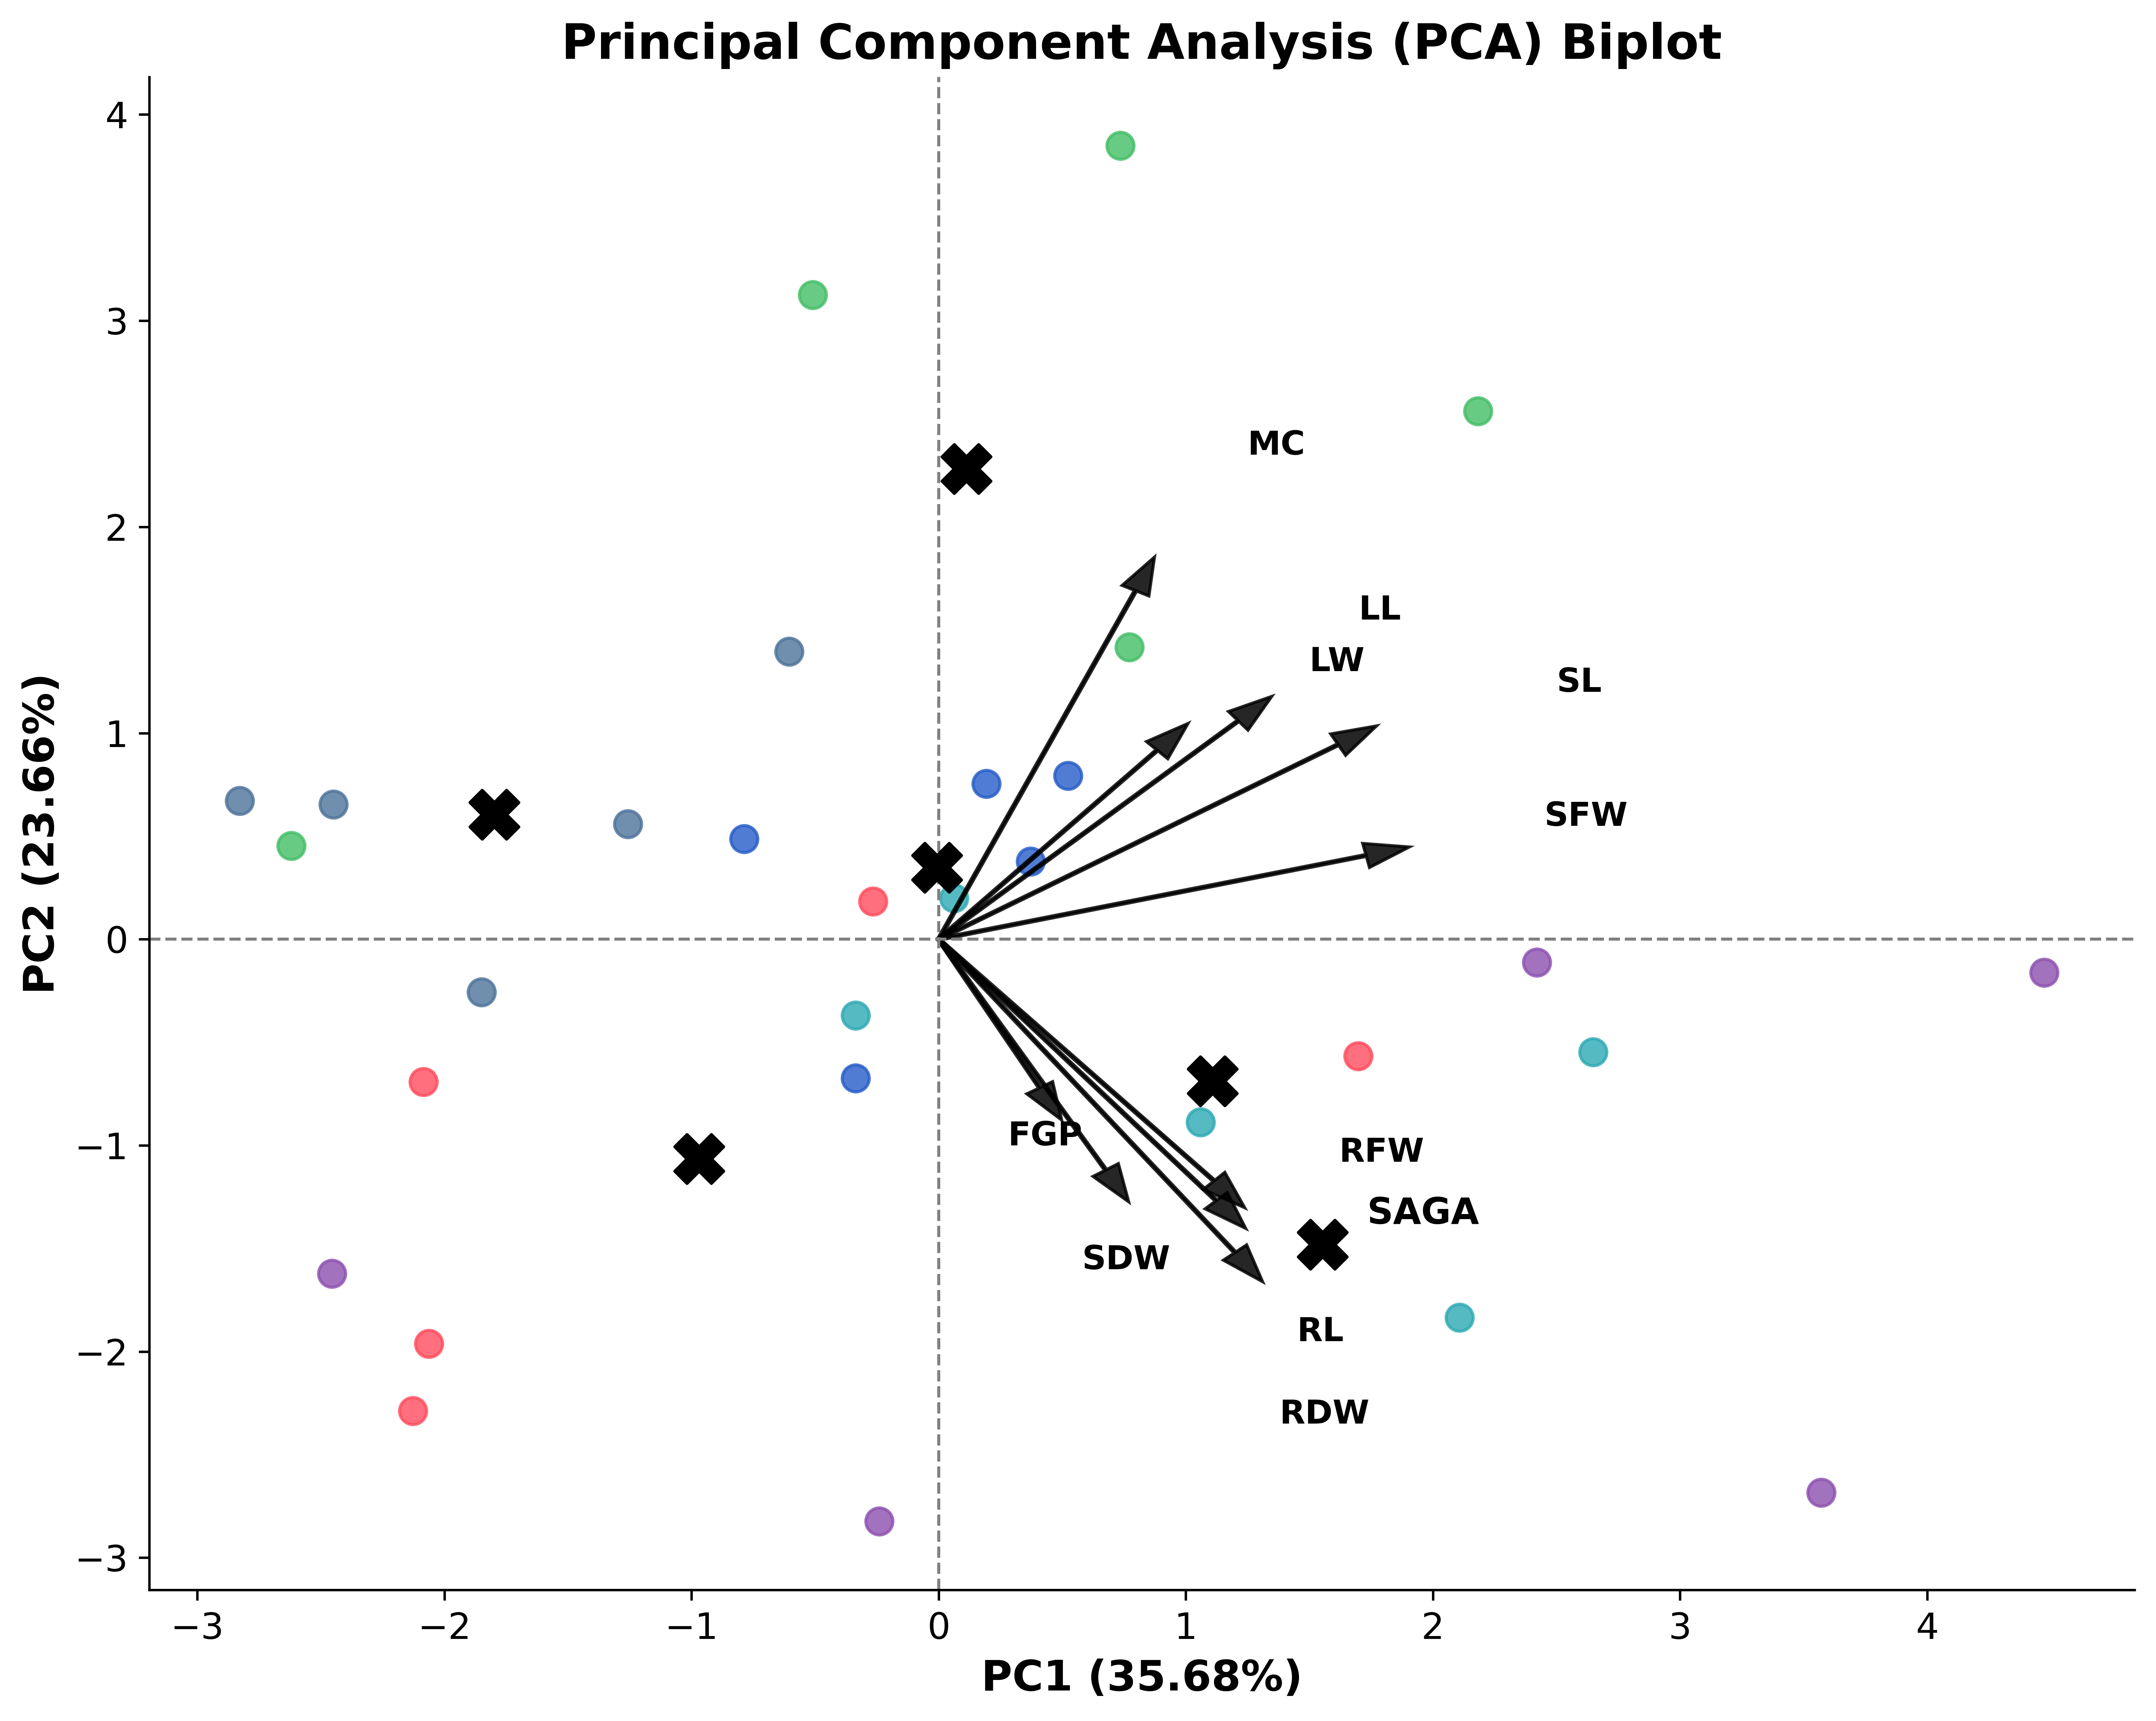
PCA was performed using primary germination, growth, biomass, and moisture-related variables to examine the multivariate treatment responses in C. annuum seedlings (Figure 7). Derived indices were excluded from the analysis to minimize redundancy in the variables. The first two principal components explained 59.34% of the total variance, with PC1 and PC2 accounting for 35.68% and 23.66%, respectively. The complete loading matrix and eigenvalue summaries are provided in Supplementary Tables S3 and S4, respectively.
PCA revealed distinct multivariate response patterns among the treatments. Variables associated with shoot growth and biomass accumulation, including SL, LL, LW, SFW, and MC, were loaded primarily in the positive region of the ordination space. In contrast, root-related biomass traits, including RFW, RDW, and SDW, were oriented in the lower-positive PC1 region. FGP showed a weaker contribution relative to the major growth and biomass variables.
The treatment centroids occupied different regions of the biplots. BIO was positioned in the positive PC2 region and was located in the same region of the ordination space as MC and several shoot growth-related traits. AQUA and SAGA were located on the positive side of PC1 and occupied the same region of the ordination space as root biomass variables, including RFW and RDW. In contrast, CON and KAT were positioned on the negative side of PC1, indicating a multivariate profile distinct from treatments located in the positive PC1 region. ASCO occupied an intermediate position near the origin, reflecting a comparatively balanced response across measured variables.
Overall, the PCA indicated that the variation among treatments was primarily explained by growth, biomass, and moisture-related variables, whereas FGP contributed less strongly to separation along the first two principal components.

4. Discussion

4.1. Commercial SWE Formulations Enhance Germination Performance and Early Seedling Establishment

Commercial SWE formulations influenced several aspects of germination and early seedling establishment in C. annuum, although the magnitude of the response differed between products. Significant treatment effects were observed for FGP, MGT, CVG, T50 and SVI. These findings are consistent with those of previous studies reporting the positive effects of seaweed-based biostimulants on seed germination and early seedling development in pepper, tomato, cucumber, eggplant, and other horticultural crops [32,33,34].
Among the evaluated formulations, KAT showed the highest FGP, whereas SAGA was associated with the most favorable germination dynamics, as evidenced by the lowest MGT and T50 values, highest CVG, and highest SVI. These results indicate that different commercial SWE formulations may influence distinct aspects of germination. Similar formulation-dependent responses have been reported for seaweed-derived biostimulants obtained from A. nodosum, E. maxima, Laminaria digitata, and other macroalgal sources, where differences in raw materials and processing methods can result in variable biological effects on plant growth and development [35,36,37].
The bioactive compositions of the evaluated products were not independently quantified in the present study. According to the manufacturer-reported information (Table 1), the formulations contain diverse bioactive compounds and nutrients that have previously been associated with germination and early growth responses [38]. However, because the chemical composition of the products was not independently verified and the individual constituents were not quantified, direct relationships between product composition and observed responses cannot be established. Consequently, any mechanistic interpretation based on the reported composition of these formulations should be regarded as tentative.
Previous studies have suggested that seaweed-based biostimulants may promote germination through their effects on seed hydration, reserve mobilization, and early seedling growth processes [35,39]. The reduced MGT and T50 values observed, particularly under SAGA treatment, are consistent with reports describing accelerated germination following SWE application in horticultural crops [40]. Nevertheless, the physiological and biochemical mechanisms responsible for the observed responses were not investigated in the present study and therefore remain to be clarified.
The responses observed in this study further indicate that commercial SWE products can produce different response profiles under the tested conditions. Although all products were classified as seaweed-based biostimulants, they differed in their reported seaweed sources, nutrient compositions, and bioactive constituents (Table 1). Similar formulation-dependent variability has been reported previously and is increasingly recognized as an important factor influencing biostimulant performance across crops and growing environments [35,41].
Overall, the results demonstrate that commercial SWE formulations can produce different germination and early seedling establishment in C. annuum, with KAT showing a positive effect on FGP and SAGA exhibiting the most favorable effects on germination rate and seedling vigor. Further studies incorporating chemical characterization and physiological analyses are required to identify the factors responsible for these formulation-specific effects.

4.2. Biostimulant-Mediated Enhancement of Early Seedling Growth and Biomass Accumulation

Commercial SWE formulations influenced several growth and biomass traits of C. annuum seedlings, although the magnitude and nature of the responses varied among the products. Significant treatment effects were observed for RL, LL, RFW, RDW, and TDW, whereas SL, LW, SFW, and SDW were unaffected. These findings are generally consistent with those of previous studies reporting improved seedling growth and biomass accumulation following the application of seaweed-based biostimulants in pepper, eggplant, tomato, and other horticultural crops [42,43].
Among the evaluated formulations, SAGA was associated with the highest RL and total dry biomass accumulation, whereas AQUA showed the highest RFW and, together with SAGA, recorded the highest RDW. These results suggest that the most pronounced treatment responses occurred in root-related growth and biomass traits rather than in shoot growth traits. Similar root-growth responses have been reported following the application of seaweed-derived biostimulants to a range of crop species [18,39].
The evaluated formulations differed in their reported compositions (Table 1), which may have contributed to the observed variation among the products. Commercial SWE formulations contain diverse bioactive compounds, including polysaccharides, amino acids, mineral nutrients, and phytohormone-like substances that have been associated with plant growth promotion [18]. For example, AQUA reportedly contains alginates, mannitol, fucoidans, and related polysaccharides, whereas SAGA contains a broader range of reported constituents, including carbohydrates, mineral nutrients, and plant growth regulator-like compounds. Previous studies have suggested that differences in the composition and biological activity of seaweed-derived biostimulants may influence root development, biomass accumulation, and seedling growth responses, even when products are applied at similar concentrations [44]. Therefore, the contrasting responses observed for AQUA and SAGA may reflect differences in the reported composition and relative abundance of biologically active constituents. However, because the chemical composition of the products was not independently verified, and no biochemical or physiological measurements were performed, the contribution of individual constituents to the observed responses could not be determined in the present study.
Correlation analysis further highlighted the close relationships among several growth and biomass traits. RL was positively associated with both RFW and RDW, while RFW and RDW exhibited one of the strongest positive correlations among all measured variables. Similarly, SL was strongly associated with SFW and LL measurements. These relationships indicate that variations in biomass accumulation are closely linked to seedling growth characteristics during early development.
PCA supported the existence of formulation-dependent response patterns among the evaluated products. AQUA and SAGA were located in the same region of the ordination space as root biomass-related traits, including RFW and RDW, whereas BIO was positioned closer to MC and several shoot growth-related variables. ASCO occupied an intermediate position in ordination space and was not strongly aligned with any specific variable group. These multivariate patterns indicate that the evaluated SWE formulations differed in their distribution across the measured growth, biomass, and moisture-related variables.
Overall, the results indicate that commercial SWE formulations can influence early seedling growth and biomass accumulation in C. annuum, with the most pronounced treatment effects observed for root-related growth and biomass variables. The observed differences among the formulations may reflect variations in their reported composition and warrant further investigation through detailed physiological, biochemical, and chemical characterization studies.

4.3. Root Biomass Allocation and Water Retention Responses

Commercial SWE formulations influenced moisture-related characteristics and biomass allocation patterns in C. annuum seedlings, as indicated by significant treatment effects on MC and S/R. These findings are consistent with those of previous studies reporting that seaweed-based biostimulants can affect root development, biomass distribution, and seedling growth responses in horticultural crops [18,45].
Among the evaluated formulations, BIO recorded the highest MC, and KAT exhibited the lowest. ASCO also maintained a relatively high MC, whereas AQUA and SAGA showed intermediate responses. Similar increases in seedling MC following SWE application have been reported for tomato and other horticultural crops [46,47]. However, because the present study was conducted under controlled laboratory conditions without water deficit stress, these observations should be interpreted as differences in seedling moisture status rather than evidence of enhanced drought tolerance or stress resistance.
BIO exhibited the highest S/R value, whereas AQUA and SAGA recorded comparatively lower S/R values. These differences indicate variations in the relative distribution of shoot and root biomasses among the treatments. AQUA and SAGA were also associated with relatively high root-related growth and biomass values, including RL, RFW, and RDW, compared with several other treatments. Similar increases in root growth and biomass traits following the application of seaweed-derived biostimulants have been previously reported in several horticultural crops [48,49]. However, because AQUA and SAGA did not differ significantly from CON for S/R, and no significant treatment effects were observed for RIR, the present results should not be interpreted as definitive evidence of enhanced root biomass allocation.
The evaluated formulations differed in their reported compositions (Table 1), which may have contributed to the observed differences in biomass allocation and moisture-related traits. For example, AQUA contains alginates, fucoidans, mannitol, and related polysaccharides that have been associated with root growth and developmental responses in plants [18,50]. However, the chemical compositions of the products were not independently verified, and the specific mechanisms responsible for the observed responses were not investigated in the present study.
Multivariate analyses further supported the existence of distinct treatment-associated response patterns. PCA positioned BIO closer to MC and shoot growth-related variables, whereas AQUA and SAGA were located in the same region of the ordination space as root biomass characteristics. These patterns were generally consistent with the univariate responses observed for MC, root growth, and biomass-related traits.
Although the RIR varied numerically among the treatments, no statistically significant differences were observed. Therefore, interpretation of treatment effects on biomass allocation should rely primarily on the significant differences observed for S/R, while recognizing that RIR did not differ significantly among treatments.
Overall, the findings indicate that commercial SWE formulations can influence moisture-related characteristics and biomass allocation patterns during the early seedling development of C. annuum. However, the magnitude and direction of these responses differed among the products, highlighting the importance of formulation-specific evaluations. Further studies under greenhouse and field conditions are required to determine whether these early responses translate into improved plant performance under agronomic conditions.

4.4. Trait Associations and Multivariate Response Patterns

Correlation and principal component analyses were used to explore the relationships among germination, growth, biomass, and moisture-related traits in C. annuum seedlings treated with commercial SWE formulations. These approaches identify statistical associations and multivariate patterns rather than causal relationships [38,51,52].
Correlation analysis revealed several significant positive relationships among growth and biomass traits. SL was strongly associated with SFW and LL, while RL was positively correlated with RFW and RDW. In addition, RFW and RDW exhibited a strong positive relationship, indicating a close correspondence between root fresh and dry biomass measurements. MC was positively associated with SL and LW and negatively associated with SDW, reflecting differences in tissue water and dry matter contents. In contrast, FGP showed no significant correlations with subsequent growth or biomass traits after FDR correction.
PCA complemented these observations by summarizing the multivariate treatment responses. AQUA and SAGA were located in the same region of the ordination space as root biomass-related variables, whereas BIO was positioned closer to MC and several shoot growth-related variables. ASCO occupied an intermediate position and was not strongly aligned with any specific variable group. These patterns were generally consistent with the univariate analyses and reflected differences in the distribution of treatments across the measured growth, biomass, and moisture-related variables.
Overall, the multivariate analyses provided an integrated overview of treatment-associated response patterns and supported the distinct growth, biomass, and moisture-related responses observed among commercial SWE formulations.

4.5. Differential Functional Responses Among Commercial SWE Formulations

The evaluated commercial SWE formulations exhibited distinct response profiles during the early seedling development of C. annuum. KAT showed the highest FGP, whereas SAGA was associated with lower MGT and T50 values, higher CVG and SVI values, greater RL, and higher TDW. AQUA showed the highest root fresh and dry weights, whereas BIO was associated with higher MC, higher LL, and higher S/R ratios. ASCO generally showed intermediate and balanced responses across most of the measured traits. Although the formulations differed in their reported compositions, the specific constituents responsible for these responses could not be identified because the products were not chemically characterized in the present study. Therefore, the observed differences should be interpreted as formulation-dependent responses rather than as evidence of specific mechanisms of action. Overall, the results demonstrate that commercial SWE formulations exhibited different response profiles under the tested conditions, resulting in variation among germination, growth, biomass, and moisture-related traits during early seedling development.

4.6. Study Limitations and Future Perspectives

The present study provides a comparative evaluation of commercially available SWE formulations during the early establishment of C. annuum under controlled conditions. However, several limitations should be considered when interpreting these results. First, the experiment was conducted using a single cultivar, a single application concentration, and a short-term Petri dish bioassay. In addition, this study was based on a single experimental run with five Petri dish replicates per treatment. Therefore, the observed responses may not fully represent the variability expected under greenhouse or field conditions.
Second, the evaluated products were commercial formulations that differed in their reported compositions, and no independent chemical characterization was performed. Consequently, the specific constituents responsible for the observed responses could not be identified. Moreover, because all products were evaluated at a common application rate (2 mL L−1), the observed responses may partly reflect differences in the concentrations and compositions of the active constituents among the formulations. Furthermore, the physicochemical properties, such as pH, electrical conductivity, and osmotic characteristics of the treatment solutions, were not measured and may have contributed to some of the observed treatment differences.
Third, this study focused primarily on germination, seedling growth, biomass accumulation, biomass allocation, and moisture-related traits. Although correlation and principal component analyses provide useful exploratory insights into treatment-associated response patterns, these approaches do not establish causal relationships among variables and may partly reflect shared treatment effects. Similarly, the RIR should be regarded as an exploratory index that requires further validation before broader application.
Finally, this study did not investigate the biochemical, physiological, or molecular mechanisms underlying the observed responses. Consequently, the physiological and biochemical mechanisms underlying the observed differences among the formulations remain unresolved. Future research should include dose–response evaluations, chemical characterization of commercial formulations, assessment of physiological and biochemical responses, and validation under greenhouse and field conditions to determine the consistency and agronomic relevance of the responses observed during the early seedling development.

5. Conclusions

Commercial SWE formulations showed different response profiles during the early seedling development of C. annuum under the conditions of the present study. KAT achieved the highest FGP, whereas SAGA exhibited the fastest germination response, highest seedling vigor index, and highest TDW. AQUA was associated with among the highest root biomass values, whereas AQUA was associated with the highest RFW and RDW, whereas BIO exhibited higher MC, LL, and S/R. Correlation and principal component analyses identified distinct statistical associations and multivariate response patterns among germination, growth, biomass, and moisture-related traits. These findings indicate that commercial SWE formulations can elicit different responses when applied at a common concentration under controlled conditions. Further studies incorporating dose–response assessments, chemical characterization, and greenhouse or field validation are required to determine the consistency and agronomic relevance of these findings.

Supplementary Materials

The following supporting information can be downloaded at: https://www.mdpi.com/article/10.3390/horticulturae12070799/s1. Figure S1. Product labels and technical documentation used for characterization of the commercial SWE formulation Sagarika; Figure S2. Product labels and technical documentation used for characterization of the commercial SWE formulation Aquamarine; Figure S3. Product labels and technical documentation used for characterization of the commercial SWE formulation Biovita; Figure S4. Product labels and technical documentation used for characterization of the commercial SWE formulation Katyayani Seaweed Extract; Figure S5. Product labels and technical documentation used for characterization of the commercial SWE formulation Asco-Zyme; Figure S6. Daily cumulative germination curves of Capsicum annuum seeds treated with different commercial seaweed extract formulations; Table S1. Shapiro–Wilk and Levene test statistics for assessment of ANOVA assumptions; Table S2. One-way ANOVA summary including F-values, degrees of freedom, p-values, and eta-squared effect sizes; Table S3. PCA loading matrix; Table S4. PCA eigenvalues and variance explained; Data S1. Complete plate-level dataset used for statistical analyses; Data S2. Pearson correlation coefficient matrix; Data S3. Raw p-value matrix for Pearson correlation analysis; Data S4. False discovery rate (FDR)-adjusted p-value matrix.

Author Contributions

Conceptualization, P.R., N.V.S. and L.A.G.; methodology, P.R. and K.B.U.; software, P.R.; validation, P.R., N.V.S. and L.A.G.; formal analysis, P.R. and K.B.U.; investigation, P.R.; resources, L.A.G.; data curation, P.R., K.B.U., I.I.V.E. and A.M.; writing—original draft preparation, P.R.; writing—review and editing, P.R., N.V.S. and L.A.G.; visualization, P.R.; supervision, L.A.G.; project administration, P.R.; funding acquisition, L.A.G. All authors have read and agreed to the published version of the manuscript.

Funding

This research did not receive any external funding.

Data Availability Statement

The original contributions presented in this study are included in this article. Further inquiries should be directed to the corresponding authors.

Acknowledgments

The authors used Paperpal (Version 2025.3; Cactus Communications, Mumbai, India), an AI-assisted language editing tool, to improve the grammar, language, and clarity of this manuscript. The authors reviewed and edited all suggested changes and took full responsibility for the final content of the manuscript. All scientific analyses, interpretations, conclusions, and intellectual contributions were performed by the authors.

Conflicts of Interest

The authors declare no conflicts of interest.

References

  1. Food and Agriculture Organization (FAO). Pepper (Capsicum annuum and Capsicum frutescens). FAO Crop Information Database. Available online: https://www.fao.org/land-water/databases-and-software/crop-information/pepper/en (accessed on 21 June 2026).
  2. Hernández-Pérez, T.; Gómez-García, M.R.; Valverde, M.E.; Paredes-López, O. Capsicum annuum (hot pepper): An ancient Latin-American crop with outstanding bioactive compounds and nutraceutical potential. A review. Compr. Rev. Food Sci. Food Saf. 2020, 19, 2972–2993. [Google Scholar] [PubMed]
  3. Korkmaz, A.; Korkmaz, Y. Promotion by 5-aminolevulenic acid of pepper seed germination and seedling emergence under low-temperature stress. Sci. Hortic. 2009, 119, 98–102. [Google Scholar] [CrossRef]
  4. Ozbay, N. Studies on seed priming in pepper (Capsicum annuum L.). In Advances in Seed Priming; Rakshit, A., Singh, H.B., Eds.; Springer: Singapore, 2018; pp. 209–239. [Google Scholar]
  5. Carrera-Castaño, G.; Calleja-Cabrera, J.; Pernas, M.; Gómez, L.; Oñate-Sánchez, L. An updated overview on the regulation of seed germination. Plants 2020, 9, 703. [Google Scholar] [CrossRef] [PubMed]
  6. Farooq, M.A.; Ma, W.; Shen, S.; Gu, A. Underlying biochemical and molecular mechanisms for seed germination. Int. J. Mol. Sci. 2022, 23, 8502. [Google Scholar] [CrossRef] [PubMed]
  7. Renganathan, P.; Yakupova, A.; Filippov, A.; Larionova, I.; Sushchenko, R.; Mufazalova, A.; Khilazhetdinova, L.; Gaysina, K.; Gaysina, L.A. Strain-specific microalgal and cyanobacterial suspensions modulate germination kinetics and early seedling vigor in cucumber. Horticulturae 2026, 12, 414. [Google Scholar] [CrossRef]
  8. Renganathan, P.; Bustamante, G.A.; Ruíz, F.E.; Puente, E.O. Microbial diversity and functional profiles of three commercial biofertilizers and impacts on the bacterial communities of avocado rhizosphere soil. Cienc. Tecnol. Agropecu. 2024, 25, 2. [Google Scholar]
  9. Prabhaharan, R.; Borboa-Flores, J.; Rosas-Burgos, E.C.; Cárdenas-López, J.L.; Ortega-García, J.; Rueda-Puente, E.O. Phaseolus acutifolius associated with Bacillus amyloliquefaciens and Azospirillum halopraeferens under salinity conditions. Biotecnia 2019, 21, 127–132. [Google Scholar] [CrossRef]
  10. Renganathan, P.; Gaysina, L.A.; Rueda-Puente, E.O. Microbial biofertilizers for salinity stress mitigation in hydroponic systems. Curr. Issues Mol. Biol. 2025, 47, 1029. [Google Scholar] [CrossRef] [PubMed]
  11. Renganathan, P.; Borboa-Flores, J.; Rosas-Burgos, E.C.; Cárdenas-López, J.L.; Murillo-Amador, B.; Ortega-García, J.; Rueda-Puente, E.O. Inoculation of nitrogen-fixing halobacteria in the contribution to tolerance to salt stress in tepary bean. Rev. Mex. Cienc. Agríc. 2018, 9, 4289–4300. [Google Scholar]
  12. Renganathan, P.; Gaysina, L.A.; Sainz-Hernández, J.C.; Puente, E.O.R. Molecular Basis and Mechanistic Insights into Ascophyllum nodosum Extract-Mediated Regulation of Plant Growth, Nutrient Acquisition, and Stress Responses. Plants 2026, 15, 1913. [Google Scholar] [CrossRef] [PubMed]
  13. Syaifudin, M.; Xu, J.; Fan, W.; Moussa, M.G.; Zhong, C.; Li, T.; Du, H. Future directions of seaweed-based bioeffectors and biofertilizers. J. Soil Sci. Plant Nutr. 2026, 26, 1996–2019. [Google Scholar] [CrossRef]
  14. Hidangmayum, A.; Sharma, R. Effect of different concentration of commercial seaweed liquid extract of Ascophylum nodosum on germination of onion (Allium cepa L.). Int. J. Sci. Res. 2017, 6, 1488–1491. [Google Scholar] [CrossRef]
  15. European Biostimulants Industry Council (EBIC). Seaweed White Paper; EBIC: Brussels, Belgium, 2023; Available online: https://biostimulants.eu/wp-content/uploads/2024/11/20230116-EN-Seaweed-WhitePaper-v11-final.pdf (accessed on 12 May 2026).
  16. Panwar, V.; Kumar, A.; Pandey, S.; Prasad, R.; Das, N. Effect of seaweed extract on growth and yield of chickpea (Cicer arietinum L.). Int. J. Adv. Biochem. Res. 2026, 10, 1019–1025. [Google Scholar] [CrossRef]
  17. Das, S.; Dhabal, S.; Marandi, S.; Pandit, M.K.; Mondal, S. Role of seaweed biostimulants in plant growth and stress resistance—A review. Int. J. Curr. Microbiol. Appl. Sci. 2025, 14, 211–229. [Google Scholar]
  18. Ali, O.; Ramsubhag, A.; Jayaraman, J. Biostimulant properties of seaweed extracts in plants: Implications towards sustainable crop production. Plants 2021, 10, 531. [Google Scholar] [CrossRef] [PubMed]
  19. Hurtado, A.Q.; Neish, I.C.; Ali, M.K.; Norrie, J.; Pereira, L.; Michalak, I.; Shukla, P.S.; Critchley, A.T. Extracts of seaweeds used as biostimulants on land and sea crops—An efficacious, phyconomic, circular blue economy, with special reference to Ascophyllum (brown) and Kappaphycus (red) seaweeds. In Biostimulants for Crops from Seed Germination to Plant Development; Academic Press: London, UK, 2021; pp. 263–288. [Google Scholar]
  20. Mughunth, R.J.; Velmurugan, S.; Mohanalakshmi, M.; Vanitha, K.J. A review of seaweed extract’s potential as a biostimulant to enhance growth and mitigate stress in horticulture crops. Sci. Hortic. 2024, 334, 113312. [Google Scholar] [CrossRef]
  21. Sujeeth, N.; Petrov, V.; Guinan, K.J.; Rasul, F.; O’Sullivan, J.T.; Gechev, T.S. Current insights into the molecular mode of action of seaweed-based biostimulants and the sustainability of seaweeds as raw material resources. Int. J. Mol. Sci. 2022, 23, 7654. [Google Scholar] [CrossRef] [PubMed]
  22. El Boukhari, M.E.; Barakate, M.; Bouhia, Y.; Lyamlouli, K. Trends in seaweed extract-based biostimulants: Manufacturing process and beneficial effects on soil–plant systems. Plants 2020, 9, 359. [Google Scholar] [PubMed]
  23. Füzy, A.; Kovács, R.; Cseresnyés, I.; Parádi, I.; Szili-Kovács, T.; Kelemen, B.; Rajkai, K.; Takács, T. Selection of plant physiological parameters to detect stress effects in pot experiments using principal component analysis. Acta Physiol. Plant. 2019, 41, 56. [Google Scholar] [CrossRef]
  24. Rueda-Puente, E.O.; Prabhaharan, R.; Murillo-Amador, B.; Ruiz-Espinoza, F.; Puente, M.; Valdez-Cepeda, R.D. Ameliorative effects of salt resistance on physiological parameters in the halophyte Salicornia bigelovii Torr. with plant growth-promoting rhizobacteria. Afr. J. Biotechnol. 2013, 12, 34. [Google Scholar] [CrossRef]
  25. Indian Farmers Fertiliser Cooperative Limited (IFFCO). Sagarika Technical Bulletin. Available online: https://sagarika.com/documents/pdfview/3.pdf (accessed on 5 June 2026).
  26. Soltani, E.; Ghaderi-Far, F.; Baskin, C.C.; Baskin, J.M. Problems with using mean germination time to calculate rate of seed germination. Aust. J. Bot. 2015, 63, 631–635. [Google Scholar] [CrossRef]
  27. Maguire, J.D. Speed of germination—Aid in selection and evaluation for seedling emergence and vigor. Crop Sci. 1962, 2, 176–177. [Google Scholar] [CrossRef]
  28. Ranal, M.A.; Santana, D.G. How and why to measure the germination process? Braz. J. Bot. 2006, 29, 1–11. [Google Scholar] [CrossRef]
  29. Coolbear, P.; Francis, A.; Grierson, D. The effect of low-temperature pre-sowing treatment on germination performance and membrane integrity of artificially aged tomato seeds. J. Exp. Bot. 1984, 35, 1609–1617. [Google Scholar]
  30. Abdul-Baki, A.A.; Anderson, J.D. Vigor determination in soybean seed by multiple criteria. Crop Sci. 1973, 13, 630–633. [Google Scholar] [CrossRef]
  31. Lee, J.H.; Lee, S.; Cha, E.B.; Joo, S.; Lee, J.G.; Nam, S.Y. Plant quality indices: Review, development, and conceptual framework. Hortic. Sci. Technol. 2026, 44, 1–31. [Google Scholar] [CrossRef]
  32. Villa e Vila, V.; Piedade, S.M.; Bouix, C.P.; Rezende, R.; Wenneck, G.S.; Terassi, D.D.; Matumoto-Pintro, P.T.; Marques, P.A. Use of a biostimulant based on seaweed extract as a sustainable input to enhance the quality of solanaceous seedlings. Horticulturae 2024, 10, 642. [Google Scholar] [CrossRef]
  33. Constantin, D.C.; Scurtu, I.; Sbîrciog, G.; Dorobanţu, A. Effects of seaweed extract for seed priming of tomatoes and eggplant on seed germination and seedling vigor. In IX South-Eastern Europe Symposium on Vegetables and Potatoes; Acta Hortic; International Society for Horticultural Science (ISHS): Leuven, Belgium, 2023; Volume 1391, pp. 511–518. [Google Scholar]
  34. Ali, O.; Ramsubhag, A.; Jayaraman, J. Ascophyllum nodosum (Linnaeus) Le Jolis seaweed extract improves seed germination in tomato and sweet pepper under NaCl-induced salt stress. Trop. Agric. 2018, 95, 141–148. [Google Scholar]
  35. Shukla, P.S.; Mantin, E.G.; Adil, M.; Bajpai, S.; Critchley, A.T.; Prithiviraj, B. Ascophyllum nodosum-based biostimulants: Sustainable applications in agriculture for the stimulation of plant growth, stress tolerance, and disease management. Front. Plant Sci. 2019, 10, 655. [Google Scholar] [CrossRef] [PubMed]
  36. Ertani, A.; Francioso, O.; Tinti, A.; Schiavon, M.; Pizzeghello, D.; Nardi, S. Evaluation of seaweed extracts from Laminaria and Ascophyllum nodosum as biostimulants in Zea mays L. using a combination of chemical, biochemical and morphological approaches. Front. Plant Sci. 2018, 9, 428. [Google Scholar] [CrossRef] [PubMed]
  37. Goni, O.; Fort, A.; Quille, P.; McKeown, P.C.; Spillane, C.; O’Connell, S. Comparative transcriptome analysis of two Ascophyllum nodosum extract biostimulants: Same seaweed but different. J. Agric. Food Chem. 2016, 64, 2980–2989. [Google Scholar] [CrossRef] [PubMed]
  38. Hernández-Herrera, R.M.; González-González, M.F.; Velasco-Ramírez, A.P.; Velasco-Ramírez, S.F.; Santacruz-Ruvalcaba, F.; Zamora-Natera, J.F. Seaweed extract components are correlated with seed germination and growth of tomato seedlings. Seeds 2023, 2, 436–448. [Google Scholar] [CrossRef]
  39. Kumari, S.; Sehrawat, K.D.; Phogat, D.; Sehrawat, A.R.; Chaudhary, R.; Sushkova, S.N.; Voloshina, M.S.; Rajput, V.D.; Shmaraeva, A.N.; Marc, R.A.; et al. Ascophyllum nodosum (L.) Le Jolis, a pivotal biostimulant toward sustainable agriculture: A comprehensive review. Agriculture 2023, 13, 1179. [Google Scholar] [CrossRef]
  40. Papoui, E.; Koukounaras, A. Evaluation of Ascophyllum nodosum and Sargassum spp. seaweed extracts on tomato germination under salinity stress. Horticulturae 2025, 11, 290. [Google Scholar] [CrossRef]
  41. Rabhi, M.L.; Derbak, L.; Bendif, H.; Boufahja, F.; Abu-Elsaoud, A.M.; Garzoli, S. Seaweed-derived biostimulants for sustainable crop production: A review. J. Biotechnol. 2025, 408, 201–216. [Google Scholar] [CrossRef] [PubMed]
  42. Melo, P.; Abreu, C.; Bahcevandziev, K.; Araujo, G.; Pereira, L. Biostimulant effect of marine macroalgae bioextract on pepper grown in greenhouse. Appl. Sci. 2020, 10, 4052. [Google Scholar] [CrossRef]
  43. Staykov, N.; Kanojia, A.; Lyall, R.; Ivanova, V.; Alseekh, S.; Petrov, V.; Gechev, T. Sustainable agriculture through seaweed biostimulants: A two-year study demonstrates yield enhancement in pepper and eggplant. Front. Plant Sci. 2025, 16, 1655340. [Google Scholar] [CrossRef] [PubMed]
  44. Khan, W.; Rayirath, U.P.; Subramanian, S.; Jithesh, M.N.; Rayorath, P.; Hodges, D.M.; Critchley, A.T.; Craigie, J.S.; Norrie, J.; Prithiviraj, B. Seaweed extracts as biostimulants of plant growth and development. J. Plant Growth Regul. 2009, 28, 386–399. [Google Scholar] [CrossRef]
  45. Battacharyya, D.; Babgohari, M.Z.; Rathor, P.; Prithiviraj, B. Seaweed extracts as biostimulants in horticulture. Sci. Hortic. 2015, 196, 39–48. [Google Scholar] [CrossRef]
  46. Campobenedetto, C.; Agliassa, C.; Mannino, G.; Vigliante, I.; Contartese, V.; Secchi, F.; Bertea, C.M. A biostimulant based on seaweed (Ascophyllum nodosum and Laminaria digitata) and yeast extracts mitigates water stress effects on tomato (Solanum lycopersicum L.). Agriculture 2021, 11, 557. [Google Scholar] [CrossRef]
  47. Morales-Sierra, S.; Luis, J.C.; Jiménez-Arias, D.; Rancel-Rodríguez, N.M.; Coego, A.; Rodriguez, P.L.; Cueto, M.; Borges, A.A. Biostimulant activity of Galaxaura rugosa seaweed extracts against water deficit stress in tomato seedlings involves activation of ABA signaling. Front. Plant Sci. 2023, 14, 1251442. [Google Scholar] [CrossRef] [PubMed]
  48. Villa e Vila, V.; Rezende, R.; Marques, P.A.; Wenneck, G.S.; Nocchi, R.C.; Terassi, D.D.; Andrean, A.F.; Matumoto-Pintro, P.T. Seaweed extract of Ascophyllum nodosum applied in tomato crop as a biostimulant for improving growth, yield and soil fertility under subtropical conditions. J. Appl. Phycol. 2023, 35, 2531–2541. [Google Scholar] [CrossRef]
  49. Keskin, N.Ç.; Erkoyuncu, M.T. Effect of Ascophyllum nodosum seaweed extract on growth and elemental nutrient composition of safflower (Carthamus tinctorius L.) under salt stress. Turk. J. Agric.-Food Sci. Technol. 2025, 13, 1169–1181. [Google Scholar] [CrossRef]
  50. Mamede, M.; Cotas, J.; Bahcevandziev, K.; Pereira, L. Seaweed polysaccharides in agriculture: A next step towards sustainability. Appl. Sci. 2023, 13, 6594. [Google Scholar] [CrossRef]
  51. Fonseca-Ramos, G.; Hernández-Herrera, R.M.; Barrientos-Ramírez, L.; Espinosa-Antón, A.A. Biostimulant effects of aqueous extracts from wild and cultivated Ulva ohnoi Hiraoka & S. Shimada biomass on mung bean germination and seedling growth. J. Aquat. Plants 2026, 2, 100010. [Google Scholar] [CrossRef]
  52. Zhang, Q.; Masabni, J.; Niu, G. Microbial biostimulants and seaweed extract synergistically influence seedling growth and morphology of three onion cultivars. Horticulturae 2024, 10, 800. [Google Scholar] [CrossRef]
Figure 1. Representative images of Capsicum annuum seedlings grown under different commercial seaweed extract treatments and the untreated control after 10 d. (A) Petri dish-level responses showing germination and seedling development. (B) Representative seedlings illustrating treatment-associated morphological variations. Images were obtained under identical imaging conditions and are presented for visual comparison. Quantitative analyses were performed using the measurements collected from all experimental units.
Horticulturae 12 00799 g001
Figure 2. Effects of commercial SWE formulations on the germination characteristics of C. annuum seedlings under controlled conditions. (A) Final germination percentage (FGP, %), (B) mean germination time (MGT, d), (C) germination index (GI), (D) coefficient of velocity of germination (CVG, %), (E) time to 50% germination (T50, d), and (F) seedling vigor index (SVI). Values are presented as mean ± standard error based on five Petri dish replicates per treatment (n = 5). Different uppercase letters indicate significant differences among treatments according to Tukey’s HSD test (p < 0.05).
Horticulturae 12 00799 g002
Figure 3. Effects of commercial SWE formulations on early seedling morphology of C. annuum under controlled conditions. (A) Shoot length (SL, cm), (B) root length (RL, cm), (C) leaf length (LL, cm), and (D) leaf width (LW, cm). Values are presented as mean ± standard error based on five Petri dish replicates per treatment (n = 5). Different uppercase letters indicate significant differences among treatments according to Tukey’s HSD test (p < 0.05).
Horticulturae 12 00799 g003
Figure 4. Effects of commercial SWE formulations on biomass accumulation characteristics of C. annuum seedlings under controlled conditions. (A) Shoot fresh weight (SFW, g), (B) root fresh weight (RFW, g), (C) shoot dry weight (SDW, g), (D) root dry weight (RDW, g), and (E) total dry weight (TDW, g). Values are presented as mean ± standard error based on five Petri dish replicates per treatment (n = 5). Different uppercase letters indicate statistically significant differences among treatments according to Tukey’s HSD test (p < 0.05).
Horticulturae 12 00799 g004
Figure 5. Effects of commercial SWE formulations on moisture content and biomass allocation indices of C. annuum seedlings under controlled conditions. (A) Moisture content on a fresh-mass basis (MC, %), (B) shoot-to-root ratio (S/R), and (C) root investment ratio (RIR). Values are presented as mean ± standard error based on five Petri dish replicates per treatment (n = 5). Different uppercase letters indicate significant differences among treatments according to Tukey’s HSD test (p < 0.05).
Horticulturae 12 00799 g005
Figure 6. Correlation heatmap showing Pearson’s correlation coefficients among primary germination, growth, biomass, and moisture-related traits of C. annuum seedlings treated with commercial SWE formulations. Correlation heatmap showing Pearson’s correlation coefficients among primary germination, growth, biomass, and moisture-related traits of C. annuum seedlings treated with commercial SWE formulations. Correlation coefficients were calculated using Pearson’s correlation analysis, and significance was determined after false discovery rate (FDR) correction. * indicates q < 0.05, ** indicates q < 0.01, and *** indicates q < 0.001. Red and blue colors indicate positive and negative correlations, respectively.
Horticulturae 12 00799 g006
Figure 7. Principal component analysis (PCA) biplot showing multivariate relationships among primary germination, growth, biomass, and moisture-related traits of C. annuum seedlings treated with commercial SWE formulations. Colored circles represent individual Petri dish replicates per treatment (n = 5), whereas black crosses indicate treatment centroids. The arrows represent variable loadings vectors, with their direction and length indicating the relative contribution of variables to the principal component axes. PC1 and PC2 explained 35.68% and 23.66% of the total variance, respectively.
Horticulturae 12 00799 g007
Table 1. The manufacturer-reported composition, nutrient profile, and application characteristics of the commercial SWE formulations evaluated in this study.
ProductManufacturerSeaweed SourceReported Bioactive ConstituentsReported Nutrient and Physicochemical CompositionRecommended DosageReference
SagarikaIndian Farmers Fertiliser Cooperative Limited (IFFCO), IndiaRed and Brown AlgaeAuxins (400–600 ppm), cytokinins (200–400 ppm), gibberellins (500–800 ppm), proteins, carbohydrates, inorganic salts and other inherent nutrientsN: 0.25–0.30%; P: 0.03–0.04%; K: 14–18%; Na: 1.0–1.5%; Ca: 0.15–0.20%; Si: 0.20–0.25%; Mg: 0.35–0.45%; Fe: 0.02–0.03%; S: 0.10–0.15%; Cu: 50–70 mg kg−1; Mn: 15–20 mg kg−1; Co: 5–10 mg kg−1; Zn: 5–12 mg kg−1; pH: 7.8–8.3; EC: 3.53 mS cm−1; specific gravity: 1.1–1.2 g cm−3; total organic matter: 7.0–7.5%; moisture content: 70–72%500 mL acre−1Product label and technical bulletin (Batch No. IFF-252; Mfg. June 2025) [25]
AquamarineICL Group Ltd., IsraelAscophyllum nodosumAlginates, mannitol, fucoidansANE: 99.35%; total organic matter: 8–12%; Alginic acids: 2.0–3.3%; Mannitol: 0.8–1.2%; Fucoidans: 2–3%; K2O (soluble): 3–5%1.5–2.0 L ha−1Product label and technical bulletin (Batch No. P1863A_0624; Mfg. September 2025)
BiovitaPI Industries, IndiaAscophyllum nodosumCytokinins, auxins, proteins, amino acids, micronutrientsSWE: ≥20%; S: 200 ppm; Mg: 500 ppm; Ca: 500 ppm; Na: 5000 ppm; B: 20 ppm; Fe: 20 ppm; Mn: 1 ppm; Cu: 1 ppm; Zn: 5 ppm; pH > 9.5; specific gravity > 1.15 g cm−32 mL L−1 of water or 400 mL acre−1Product label and technical specification sheet (Batch No. 25BXN134; Mfg. June 2025)
Katyayani Seaweed ExtractKatyayani Organics, IndiaBrown seaweed extractAuxins, cytokinin, gibberellin-like compounds, betaines, phenolics, fucoidan, laminarin, amino acidsSeaweed solids: 20–30%; Organic matter: 40–50%; Alginic acid: 0.4–16%; Mannitol: 0.5–7%; Amino acids: 3–25%; N: 1–6%; P2O5: 0.2–8%; K2O: 3–21%2–3 mL L−1Product label and technical information sheet (Batch No. SE-J01; Mfg. July 2025)
Asco-ZymeHifield Organics, IndiaAscophyllum nodosumPresent, but not quantitatively specifiedANE: 20% (w/w minimum); sodium propyl paraben: 0.25%; water: 79.75%650 mL ha−1Product label (Batch No. 251112; Mfg. November 2025)
Product composition, nutrient profiles, and application recommendations were compiled from the manufacturer’s labels and technical documentation and were not independently verified. Copies of the source documents used for product characterization are provided in Figures S1–S5.
Disclaimer/Publisher’s Note: The statements, opinions and data contained in all publications are solely those of the individual author(s) and contributor(s) and not of MDPI and/or the editor(s). MDPI and/or the editor(s) disclaim responsibility for any injury to people or property resulting from any ideas, methods, instructions or products referred to in the content.