Article

Screening and Validation of qRT-PCR Reference Genes in Different Tissues and Autumn Leaf Coloration Period of Euonymus maackii


Beijing Key Laboratory of Ornamental Plants Germplasm Innovation & Molecular Breeding, National Engineering Research Center for Floriculture, Beijing Laboratory of Urban and Rural Ecological Environment, Key Laboratory of Genetics and Breeding in Forest Trees and Ornamental Plants of Education Ministry, School of Landscape Architecture, Beijing Forestry University, Beijing 100083, China
*
Author to whom correspondence should be addressed.
Horticulturae 2026, 12(7), 773; https://doi.org/10.3390/horticulturae12070773
Submission received: 20 May 2026 / Revised: 18 June 2026 / Accepted: 20 June 2026 / Published: 24 June 2026

Abstract

Euonymus maackii is an important ornamental tree species valued for its autumn foliage in northern China. To precisely elucidate the molecular mechanisms underlying the distinct leaf coloration types in E. maackii during autumn, this study aimed to identify the optimal reference genes for qRT-PCR normalization across different tissues, developmental stages, and autumn leaf coloration types. Using 10 different tissues of E. maackii as experimental materials, 10 candidate reference genes were comprehensively evaluated for expression stability using three software tools, including geNorm, and the RefFinder online platform, with structural genes of the pigment biosynthesis pathway employed for validation. The comprehensive evaluation revealed that TIP41 was the most stable reference gene across different tissues, developmental stages, and the full sample set; EF-1α exhibited the highest stability among samples representing different autumn leaf coloration types; and GAPDH was the least stable in all sample groups. Quantitative validation of target genes demonstrated that when EF-1α and TIP41 were used in combination for normalization, the expression patterns of pigment biosynthesis structural genes were highly consistent with the phenotypic changes observed in autumn leaf coloration. In summary, this study recommends TIP41 as a universal reference gene for expression analysis across different tissues and developmental stages of E. maackii; for studies involving different autumn leaf coloration types, a dual-reference normalization approach combining EF-1α and TIP41 is recommended.

1. Introduction

Euonymus maackii is a deciduous small tree belonging to the genus Euonymus in the family Celastraceae. It is an excellent autumn foliage plant in northern China [1]. Autumn-colored tree species play a significant role in beautifying the environment, enriching garden landscapes, and bridging the gap in visual appeal between spring and autumn; they are indispensable ornamental plants in landscape design [2]. Plants of the genus Euonymus generally possess excellent characteristics such as vigorous growth, tolerance to poor soils, pruning tolerance, and strong stress resistance, making them widely used in landscape construction [3]. Among species in this genus, the E. maackii is at its most ornamental in autumn, when its leaves turn yellow or red and its fruits turn pink; upon splitting, the fruits reveal orange–red arils. The interplay of colorful foliage and pink fruits creates a striking visual effect, and this exceptional ornamental value makes it an indispensable autumn-colored tree species in landscape design across northern China [4]. In recent years, green-leaved plants with monotonous coloration have failed to meet public demands for urban landscapes [5]. Therefore, a thorough analysis of the molecular regulatory mechanisms underlying the autumn leaf coloration in E. maackii is of great significance for developing superior cultivars with longer ornamental periods and more vibrant colors through molecular breeding techniques.
In elucidating the mechanisms underlying autumn leaf coloration in E. maackii, accurately determining the spatiotemporal expression patterns of key structural genes and transcription factors is a critical step. Quantitative real-time PCR (qRT-PCR), with its high sensitivity, strong specificity, and good reproducibility, has become the technique of choice for detecting the transcriptional levels of such genes [6]. However, the accuracy of qRT-PCR results depends heavily on the standardization of data; that is, an internal reference gene with constant expression levels must be included to eliminate systematic experimental errors such as variations in RNA quality, reverse transcription efficiency, and sample volume [7]. Ideal internal reference genes are typically involved in fundamental cellular biochemical metabolic processes. Common candidate genes include those encoding transcription elongation factors (elongation factor 1-α, EF-1α), structural proteins such as actin (ACT) and tubulins (α-tubulin, TUA; β-tubulin, TUB), and metabolic enzymes like glyceraldehyde-3-phosphate dehydrogenase (GAPDH), cyclophilin (CYP), and phosphoglycerate kinase (PGK). Additionally, genes encoding ubiquitin-conjugating enzymes (UBC), protein phosphatase 2C (PP2C), and the phosphatase activator TIP41 (TIP41) are frequently utilized for normalization [8,9,10,11]. In theory, internal reference genes should not be affected by experimental conditions; however, numerous studies have shown that there is no single internal reference gene that is universal across species and conditions. A large number of previous studies have shown that the optimal types of reference genes can undergo drastic changes, whether in quantitative analysis of the anthocyanin synthesis pathway [12,13] or under different developmental stages and stress treatments [14,15]. This heterogeneity of expression profiles is not only widely present among plants of different families and genera but also shows significant differences among closely related species within the same genus [16] and different physiological phenotypes of the same species (such as different flower color genotypes) [17]. Therefore, directly applying empirical reference genes in a specific experimental system carries a high risk, and conducting independent reference gene assessment for specific species and treatment conditions is a prerequisite for ensuring data reliability.
For the woody plant E. maackii, the selection of reference genes poses a significant challenge. First, E. maackii comprises a wide range of tissue types, from highly lignified old roots and stem phloem to tender leaf buds and flowers, with significant differences in intracellular metabolic components. Second, autumn leaf coloration is accompanied by chlorophyll degradation and the massive synthesis of carotenoids and anthocyanin glycosides; these physiological changes are highly likely to cause fluctuations in the expression of traditional housekeeping genes. Although there has been considerable research on E. maackii regarding its landscape applications and physiological characteristics, current investigations into the molecular mechanisms underlying its leaf color formation remain largely confined to the stages of cultivation technique improvement and preliminary physiological indicator monitoring [2,3]. The molecular regulatory networks underlying its tissue differentiation and the various autumn leaf color types remain unclear, particularly given the lack of systematic and accurate screening and evaluation of qRT-PCR internal reference genes for this species across different developmental stages and physiological coloration periods. In light of this, this study used E. maackii as the experimental material and constructed 10 representative sample. Ten candidate internal reference genes, including ACT7, EF1-α, and TUB, were selected, and their stability was comprehensively evaluated using three algorithms—geNorm [7], NormFinder [18], and BestKeeper [19]—along with their online platform RefFinder [20]. Finally, the selected optimal internal reference was used to validate key structural genes involved in the autumn coloration pathway. This study provides a reference framework for qRT-PCR normalization in E. maackii and related species.

2. Materials and Methods

2.1. Plant Materials

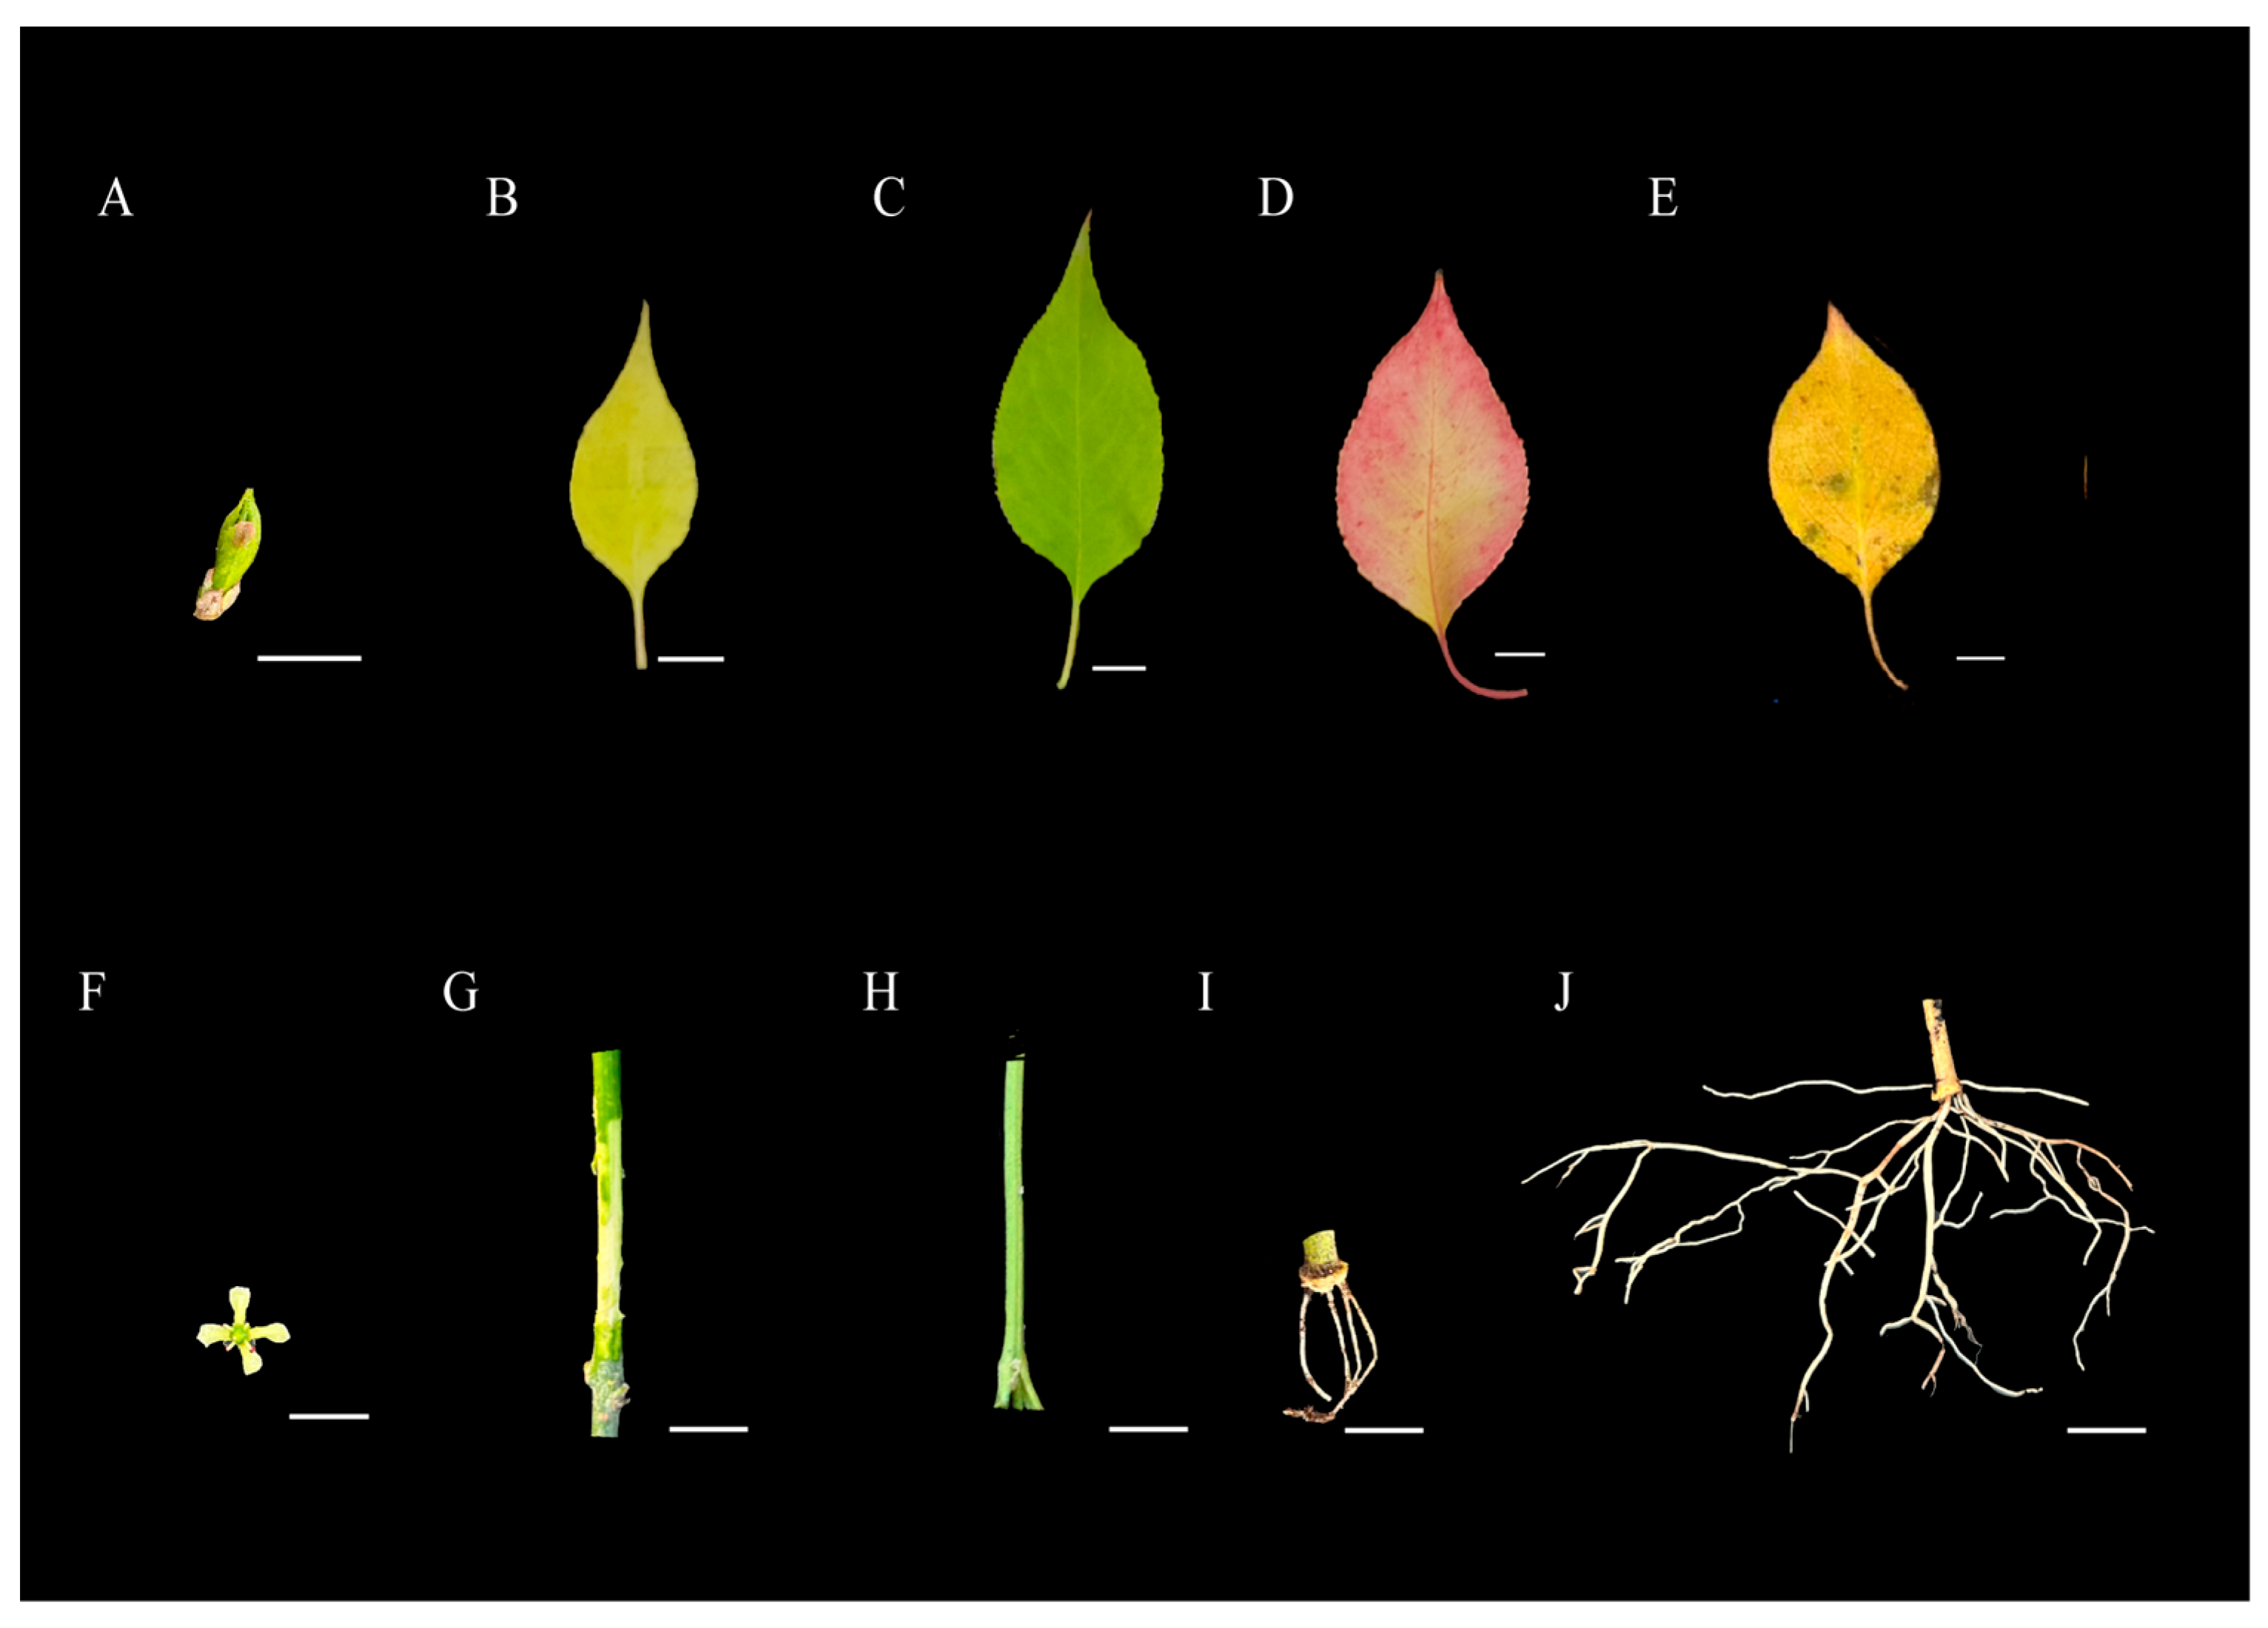
To comprehensively evaluate reference gene stability in E. maackii, ten representative sample types were collected (Figure 1). For spatial and developmental analyses, seven sample types (new and old roots, new stems, lignified stem phloem, flowers, leaf buds, and young leaves) were harvested from healthy clonal cuttings grown under controlled greenhouse conditions at Beijing Forestry University. To investigate natural autumn coloration, mature green leaves were collected prior to the autumn color transition. Subsequently, red and yellow leaves were sampled from two adjacent adult trees in Wenyu River Park, Beijing. All samples were collected on clear mornings in three biological replicates. For the adult trees, these replicates were defined as intra-individual replicates, systematically collected from different canopy positions to account for spatial variance (Figure S1). All tissues were immediately flash-frozen in liquid nitrogen and stored at −80 °C.

2.2. Total RNA Extraction and cDNA Synthesis of Different E. maackii Samples

For each of the 10 different samples, 100 mg of tissue was frozen in liquid nitrogen and ground into a fine powder. Total RNA was extracted using the FastPure Universal Plant Total RNA Isolation Kit (Vazyme, Nanjing, China). RNA concentration and purity were determined, and RNA quality was assessed using 1% agarose gel electrophoresis (Figure S2). One microgram (1 μg) of total RNA was reverse transcribed into cDNA according to the manufacturer’s instructions for the HiScript III 1st Strand cDNA Synthesis Kit (+gDNA wiper) (Vazyme, Nanjing, China). Total RNA was stored at −80 °C, and cDNA was stored at −20 °C for later use.

2.3. Selection of Candidate Reference Genes and Primer Design

Based on the FPKM data from the different autumn leaf coloration type transcriptome of E. maackii and commonly reported reference genes, ten reference genes were selected for validation: ACT7, TUA, TUB, PP2C, TIP41, UBC, EF-1α, GAPDH, CYP, and PGK [8,9,10,11]. Based on the coding sequences (CDS) obtained from the E. maackii transcriptome database, we redesigned the quantitative primers for all candidate reference genes and pigment-related structural genes. Primers were designed using the Primer 3 online tool (https://primer3.ut.ee/ (accessed on 9 March 2026)), with an amplification length set to 180–200 base pairs, GC content to 40–60%, and a melting temperature (Tm) of (55 ± 5) °C. To validate the reliability and accuracy of the reference genes, pigment-related structural genes were chosen from the transcriptome as target genes for verification. Mainly two screening principles were followed, mapping to the flavonoid biosynthesis (ko00941), anthocyanin biosynthesis (ko00942), and carotenoid biosynthesis (ko00906) pathways in KEGG and having highly significantly differentially expressed genes (DEGs) with different autumn leaf color phenotypes (|log2FC| > 1.0 and FDR < 0.05). The primers used are listed in Table 1. All designed primers are fully analyzed before synthesis to detect potential secondary structures to ensure that the formation of primer dimers, secondary structures, homodimers, heterodimers, and hairpin structures is strictly controlled within the standard acceptable range. The E. maackii leaf transcriptome database utilized for candidate reference gene screening and target gene identification was retrieved from an unpublished in-house database previously established by our research group.

2.4. RT-PCR Amplification and Primer Specificity Detection of Candidate Reference Genes

Conventional PCR amplification was performed for the primers of each candidate reference gene. RT-PCR reactions were conducted following the instructions of the 2× Phanta Flash Master Mix (Dye Plus) (Vazyme, Nanjing, China). The PCR amplification products were then analyzed by 2.0% agarose gel electrophoresis (Figure S3).

2.5. RT-qPCR Amplification of Candidate Reference Genes

cDNA templates were serially diluted to five concentrations (1, 5−1, 5−2, 5−3, 5−4). Standard curves were generated using qRT-PCR reactions. Amplification efficiency (E, %) was calculated using the formula E = (5−1/slope − 1) × 100. The standard curve slope and the linear correlation coefficient R2 were also determined [21] to assess the reliability of the standard curve regression equation. qRT-PCR reactions were performed using a Bio-Rad CFX Duet real-time quantitative polymerase chain reaction system (Bio-Rad, Hercules, CA, USA). A 20 μL reaction system was employed, consisting of 10 μL of 2× HQ SYBR qPCR Mix, 2 μL of diluted cDNA, 0.4 μL each of forward and reverse primers (10 μmol·L−1), and ddH2O added to a final volume of 20 μL. The amplification program included an initial denaturation at 95 °C for 30 s, followed by 40 cycles of denaturation at 95 °C for 10 s and annealing at 60 °C for 30 s. Product specificity was confirmed by melting curve analysis, with conditions set at 95 °C for 15 s, 60 °C for 1 min, and 95 °C for 15 s. Three technical replicates were performed for each sample, and the Ct value was calculated as the average of the three results. qRT-PCR reactions were conducted on 10 different samples using the most suitable dilution factor.

2.6. Candidate Reference Gene Stability Analysis

The expression stability of ten candidate reference genes was analyzed using geNorm, NormFinder, and BestKeeper algorithms. A comprehensive evaluation was performed based on the online website RefFinder (http://blooge.cn/RefFinder/ (accessed on 15 April 2026)) to screen for the most ideal reference genes. The screened reference genes were then used to analyze and validate the expression patterns of key structural genes involved in different autumn leaf coloration types, with three technical replicates for each sample, and the Ct value was calculated as the average of the three results. The relative expression levels of target genes were calculated using the 2∆∆CT method [22].

2.7. Data Processing

All statistical analyses and data visualization were performed using GraphPad Prism software (version 11.0.0). The statistical significance of the relative expression differences of the target genes between the red and yellow leaf phenotypes was determined using an unpaired two-tailed Student’s t-test. Prior to the analysis, the data were assessed to ensure they met the underlying assumptions of normality and homogeneity of variances (F-test, p > 0.05). Differences were considered statistically significant at p < 0.05.

3. Results

3.1. Screening of Candidate Reference Genes and Primers Specificity Analysis

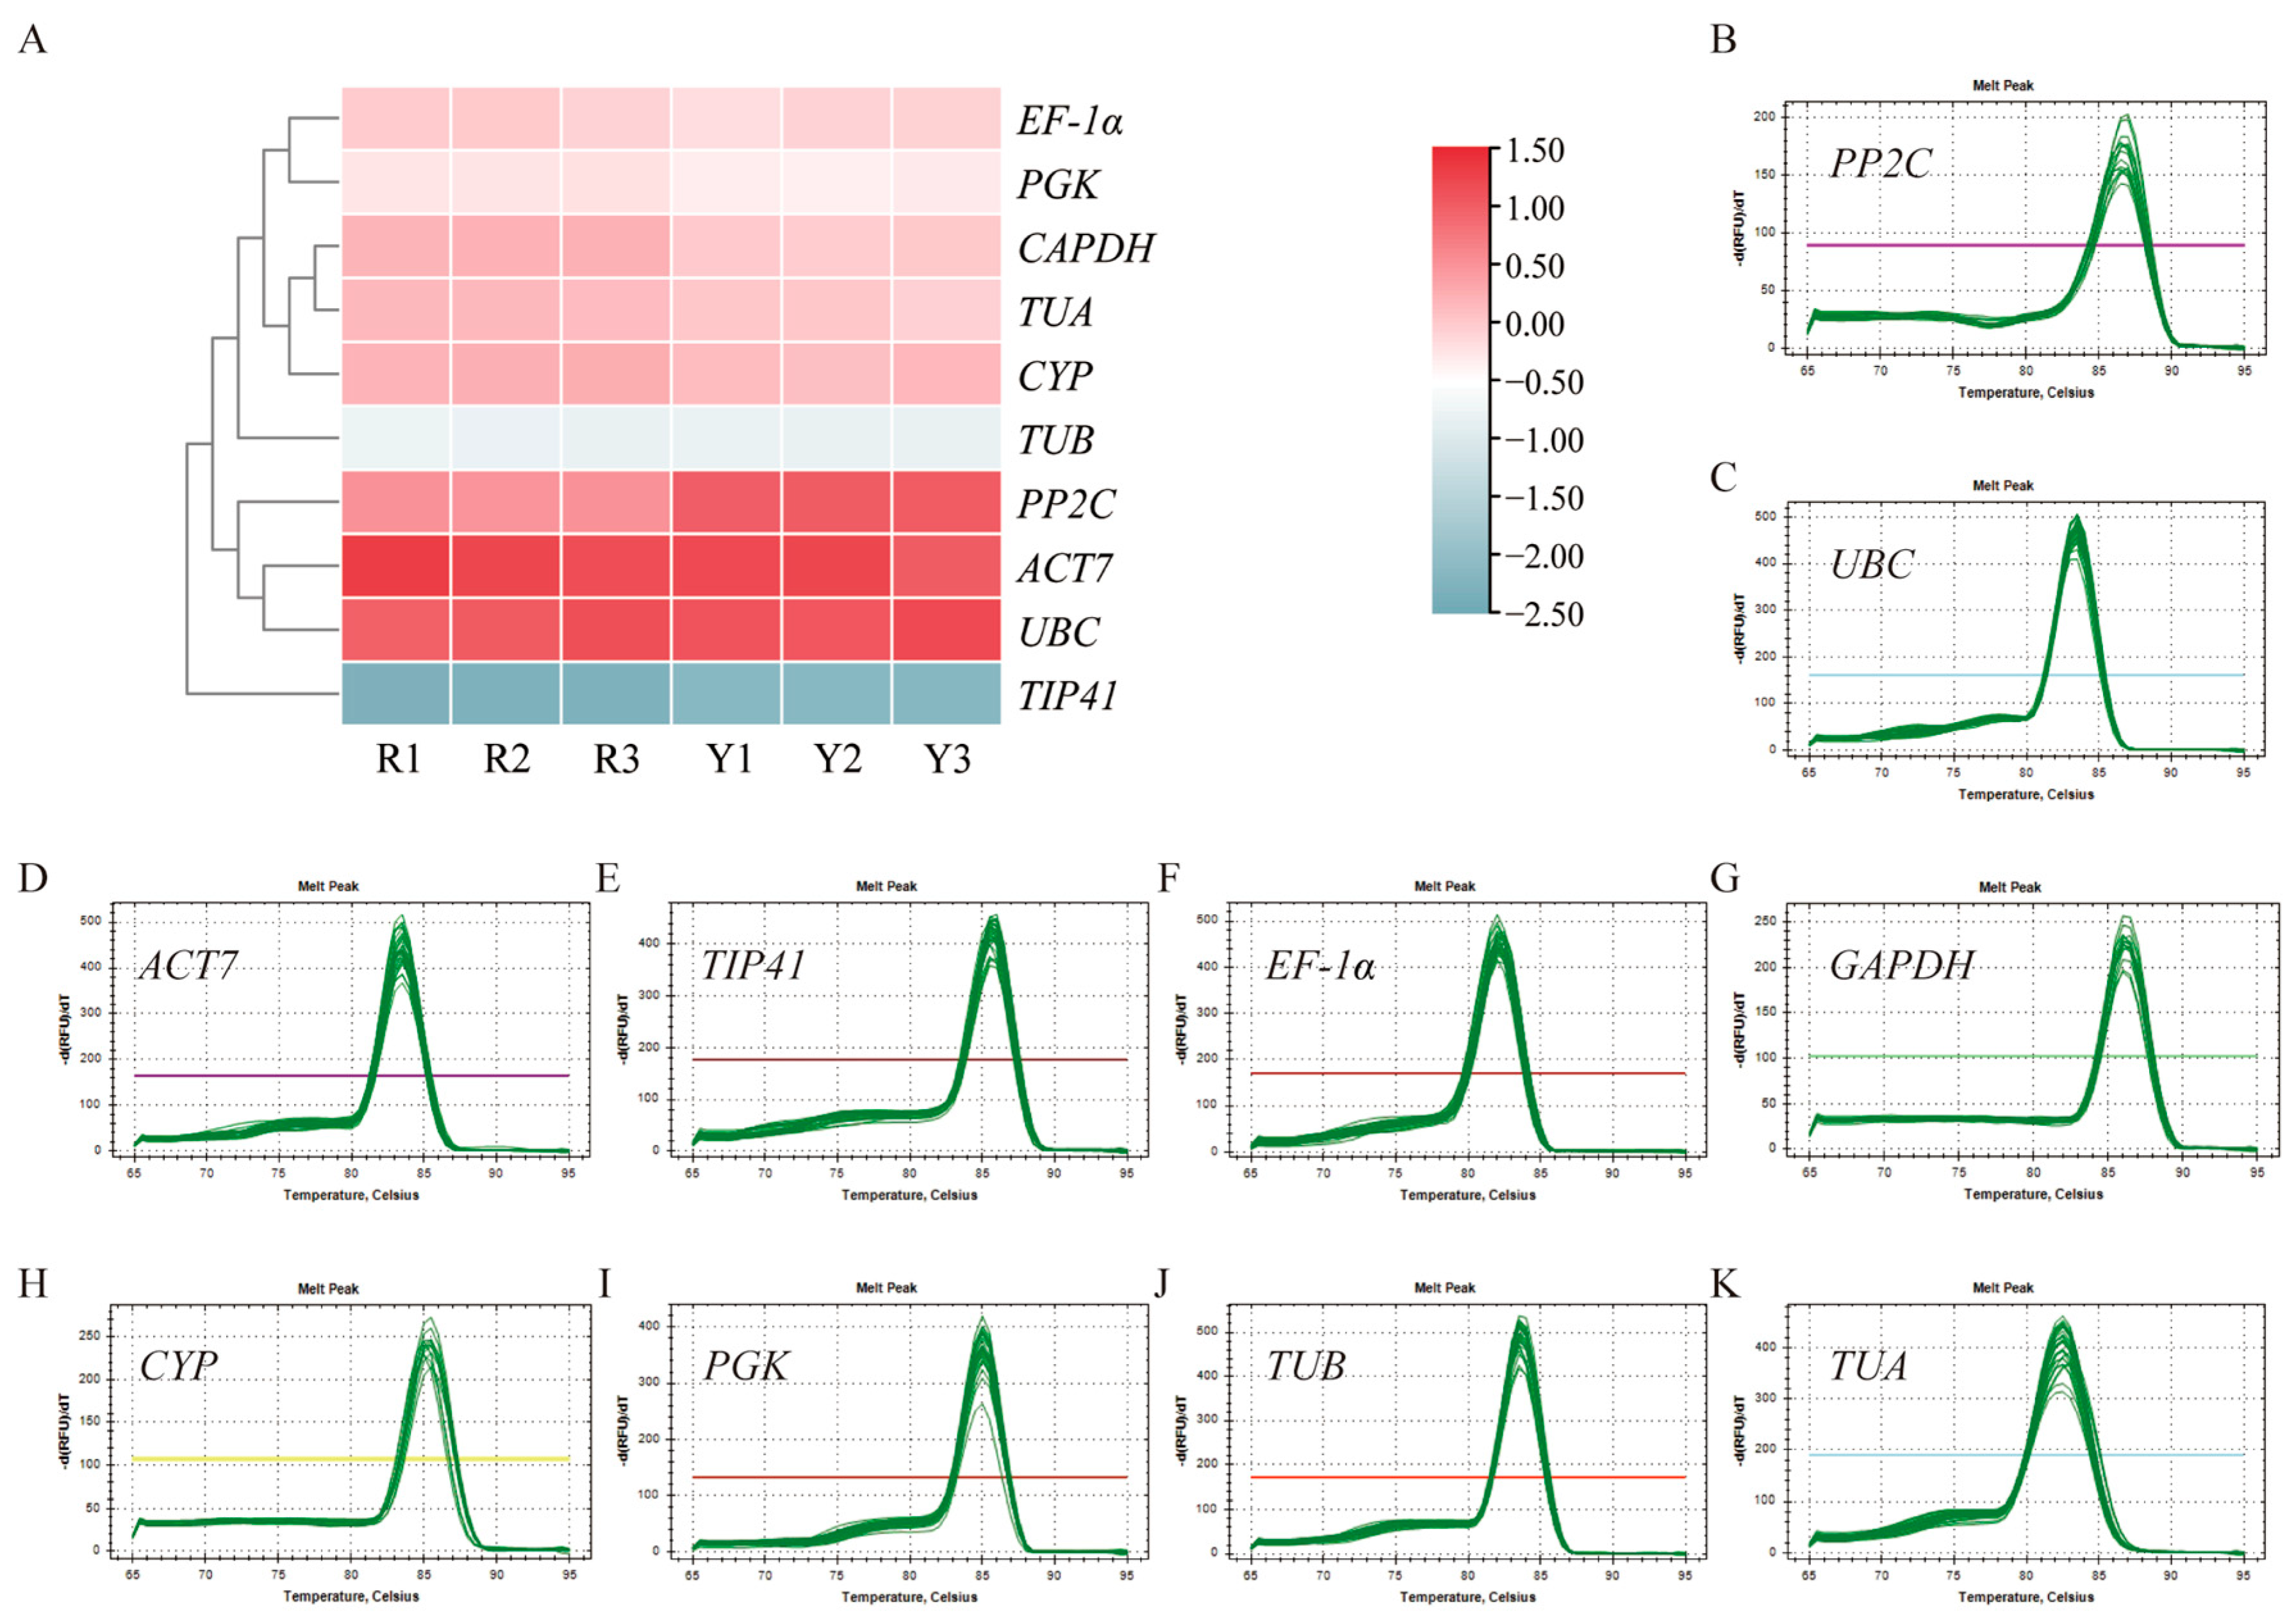
Ten candidate reference genes with FPKM values greater than 10 were identified from the transcriptome, namely EF1-α, ACT7, TUA, TUB, GAPDH, CYP, PGK, UBC, PP2C, and TIP41. Among these 10 candidate reference genes, ACT7 showed the highest FPKM value and expression level, while TIP41 and TUB exhibited lower expression levels. However, the FPKM values of all 10 candidate reference genes were generally stable across different leaf coloration types in autumn (Figure 2A).
Specific primers were designed for the 10 candidate reference genes of E. maackii. qRT-PCR validation was conducted using serially diluted cDNA from the mixed sample as a template. Melting curve analysis revealed that all 10 candidate reference genes exhibited a single signal peak (Figure 2B–K).

3.2. Amplification Efficiency Analysis of Candidate Reference Gene Primers

The amplification efficiency values for all primers ranged from 90.40% (EF1-α) to 115.24% (ACT7), with R2 values consistently ≥ 0.99 (Table 2). This demonstrates that the reference gene primers used were both specific and effective, and the resulting experimental data are suitable for subsequent analysis. Based on these standard curves, a uniform 5-fold dilution of the cDNA templates was confirmed to be perfectly within the optimal linear range for all evaluated genes, yielding highly reliable Ct values ranging from 15 to 30. To maintain strictly consistent initial template inputs across all reactions, this 5-fold dilution factor was adopted for all subsequent qRT-PCR validation experiments.

3.3. Expression Abundance of Candidate Reference Genes

The comparison of average Ct values showed that EF1-α and CYP exhibited higher expression levels, while PGK and TIP41 showed lower expression levels. The comparison of ΔCt values indicated that TIP41 had the smallest fluctuations among different tissues, developmental stages, and all samples. In the autumn leaf coloration type, EF1-α was the most stable, followed by TIP41. In contrast, GAPDH showed the greatest variability across all groups (Table 3).

3.4. Stability Analysis of Candidate Reference Genes

3.4.1. geNorm Analysis

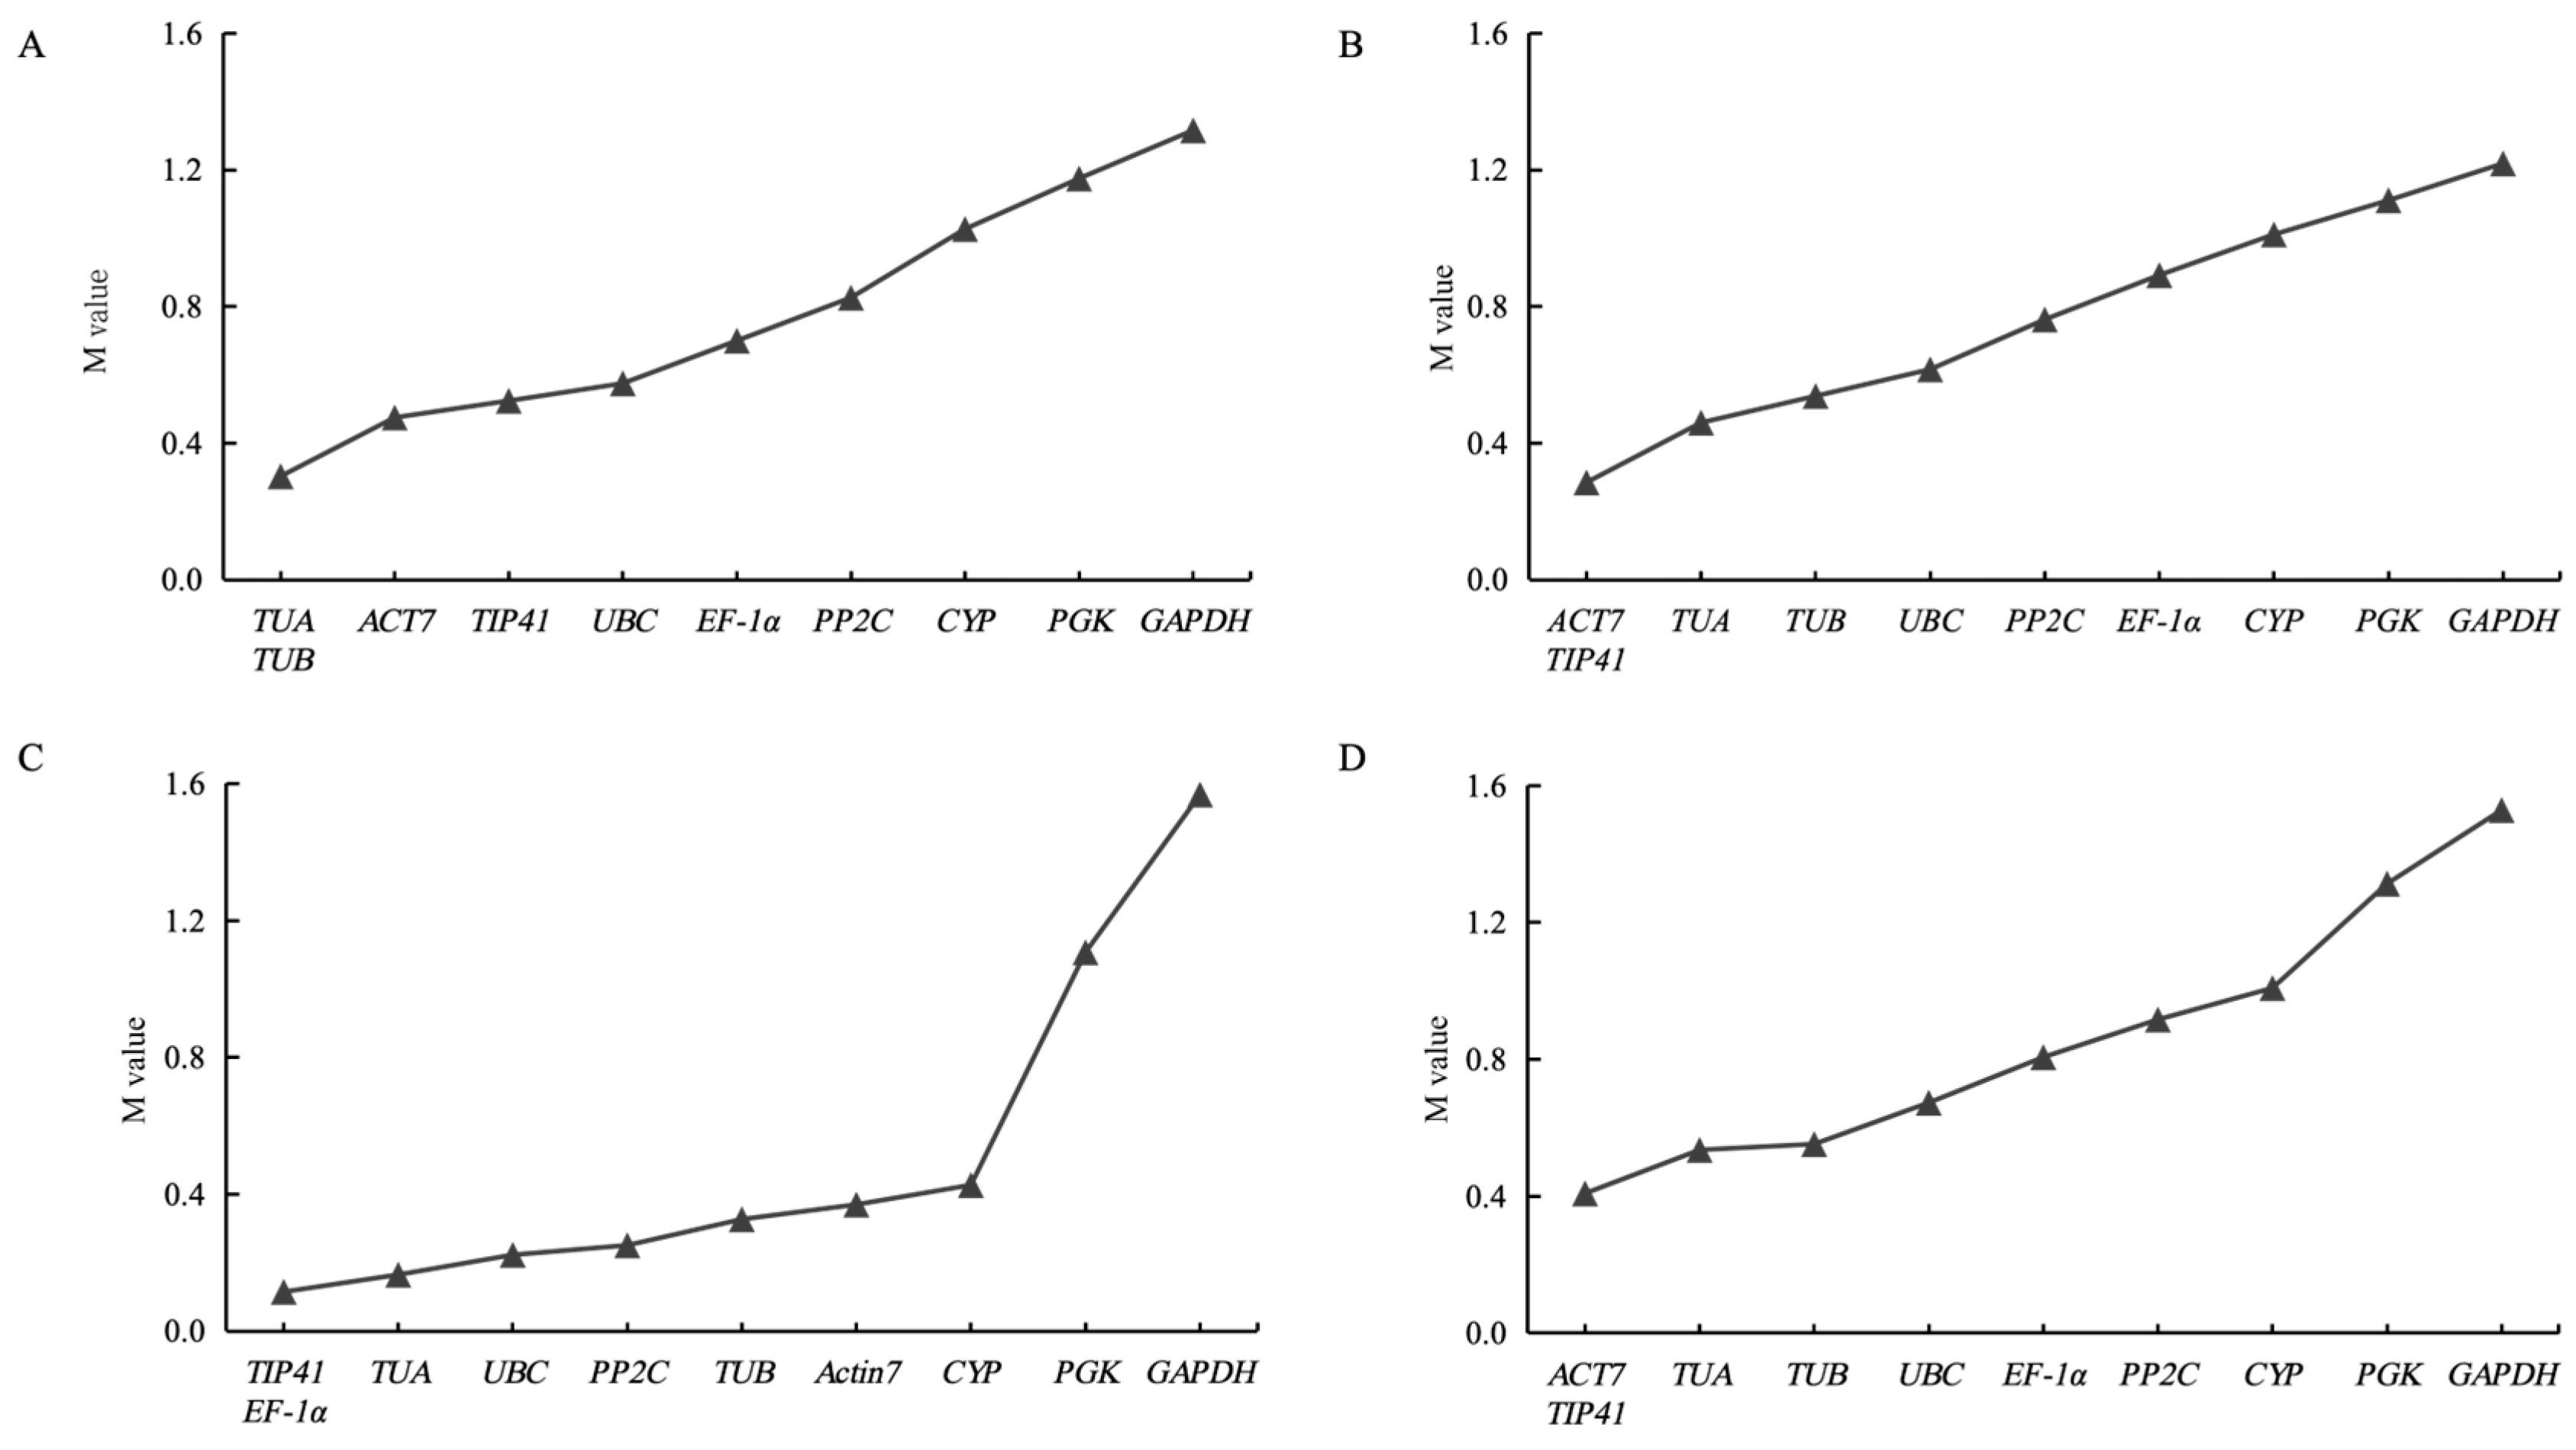
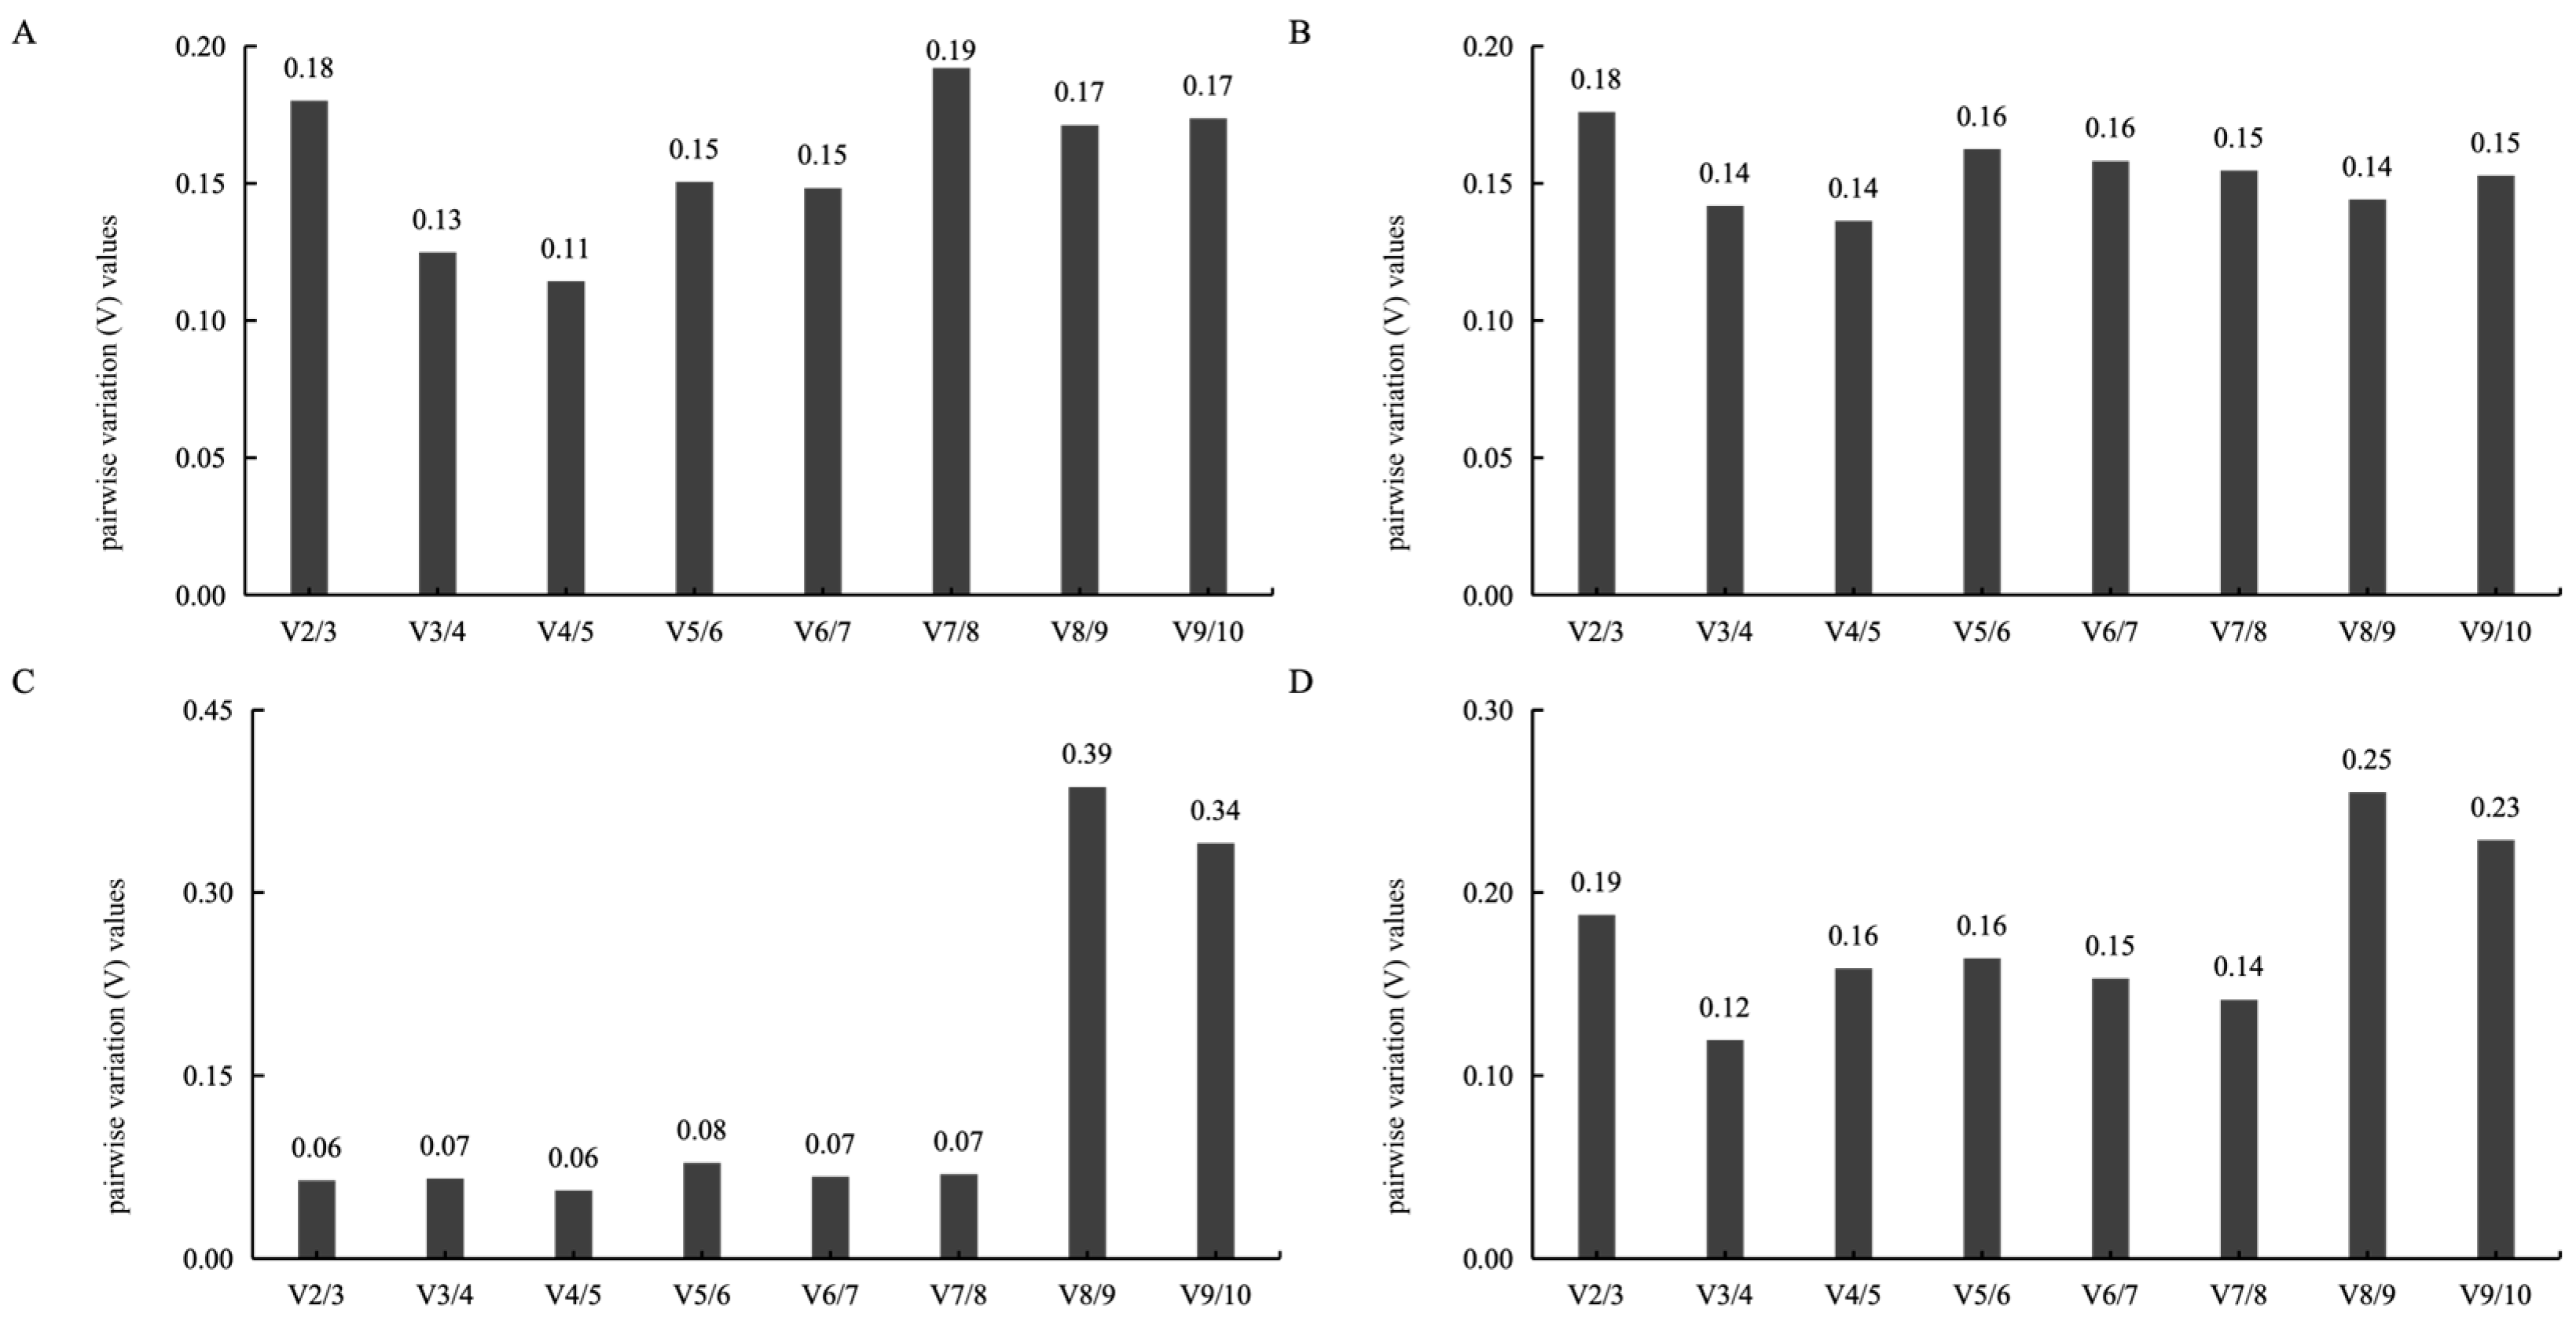
The geNorm software evaluates gene stability based on the expression stability (M value), where a lower M value indicates greater stability of the candidate reference gene (Figure 3). TUA and TUB showed the most stable expression in different tissues; ACT7 and TIP41 were the most stable across different developmental stages; TIP41 and EF-1α exhibited the most stable expression in different leaf coloration types; and ACT7 and TIP41 were the most stable across all samples. GAPDH was the most unstable across all four groups. The combination of three reference genes determined by the geNorm-based pairwise variation analysis (Vn/Vn+1 < 0.15) is optimal for different tissues, developmental stages, and all sample groups, while the combination of two reference genes is optimal for different color variant types (Figure 4).

3.4.2. NormFinder Analysis

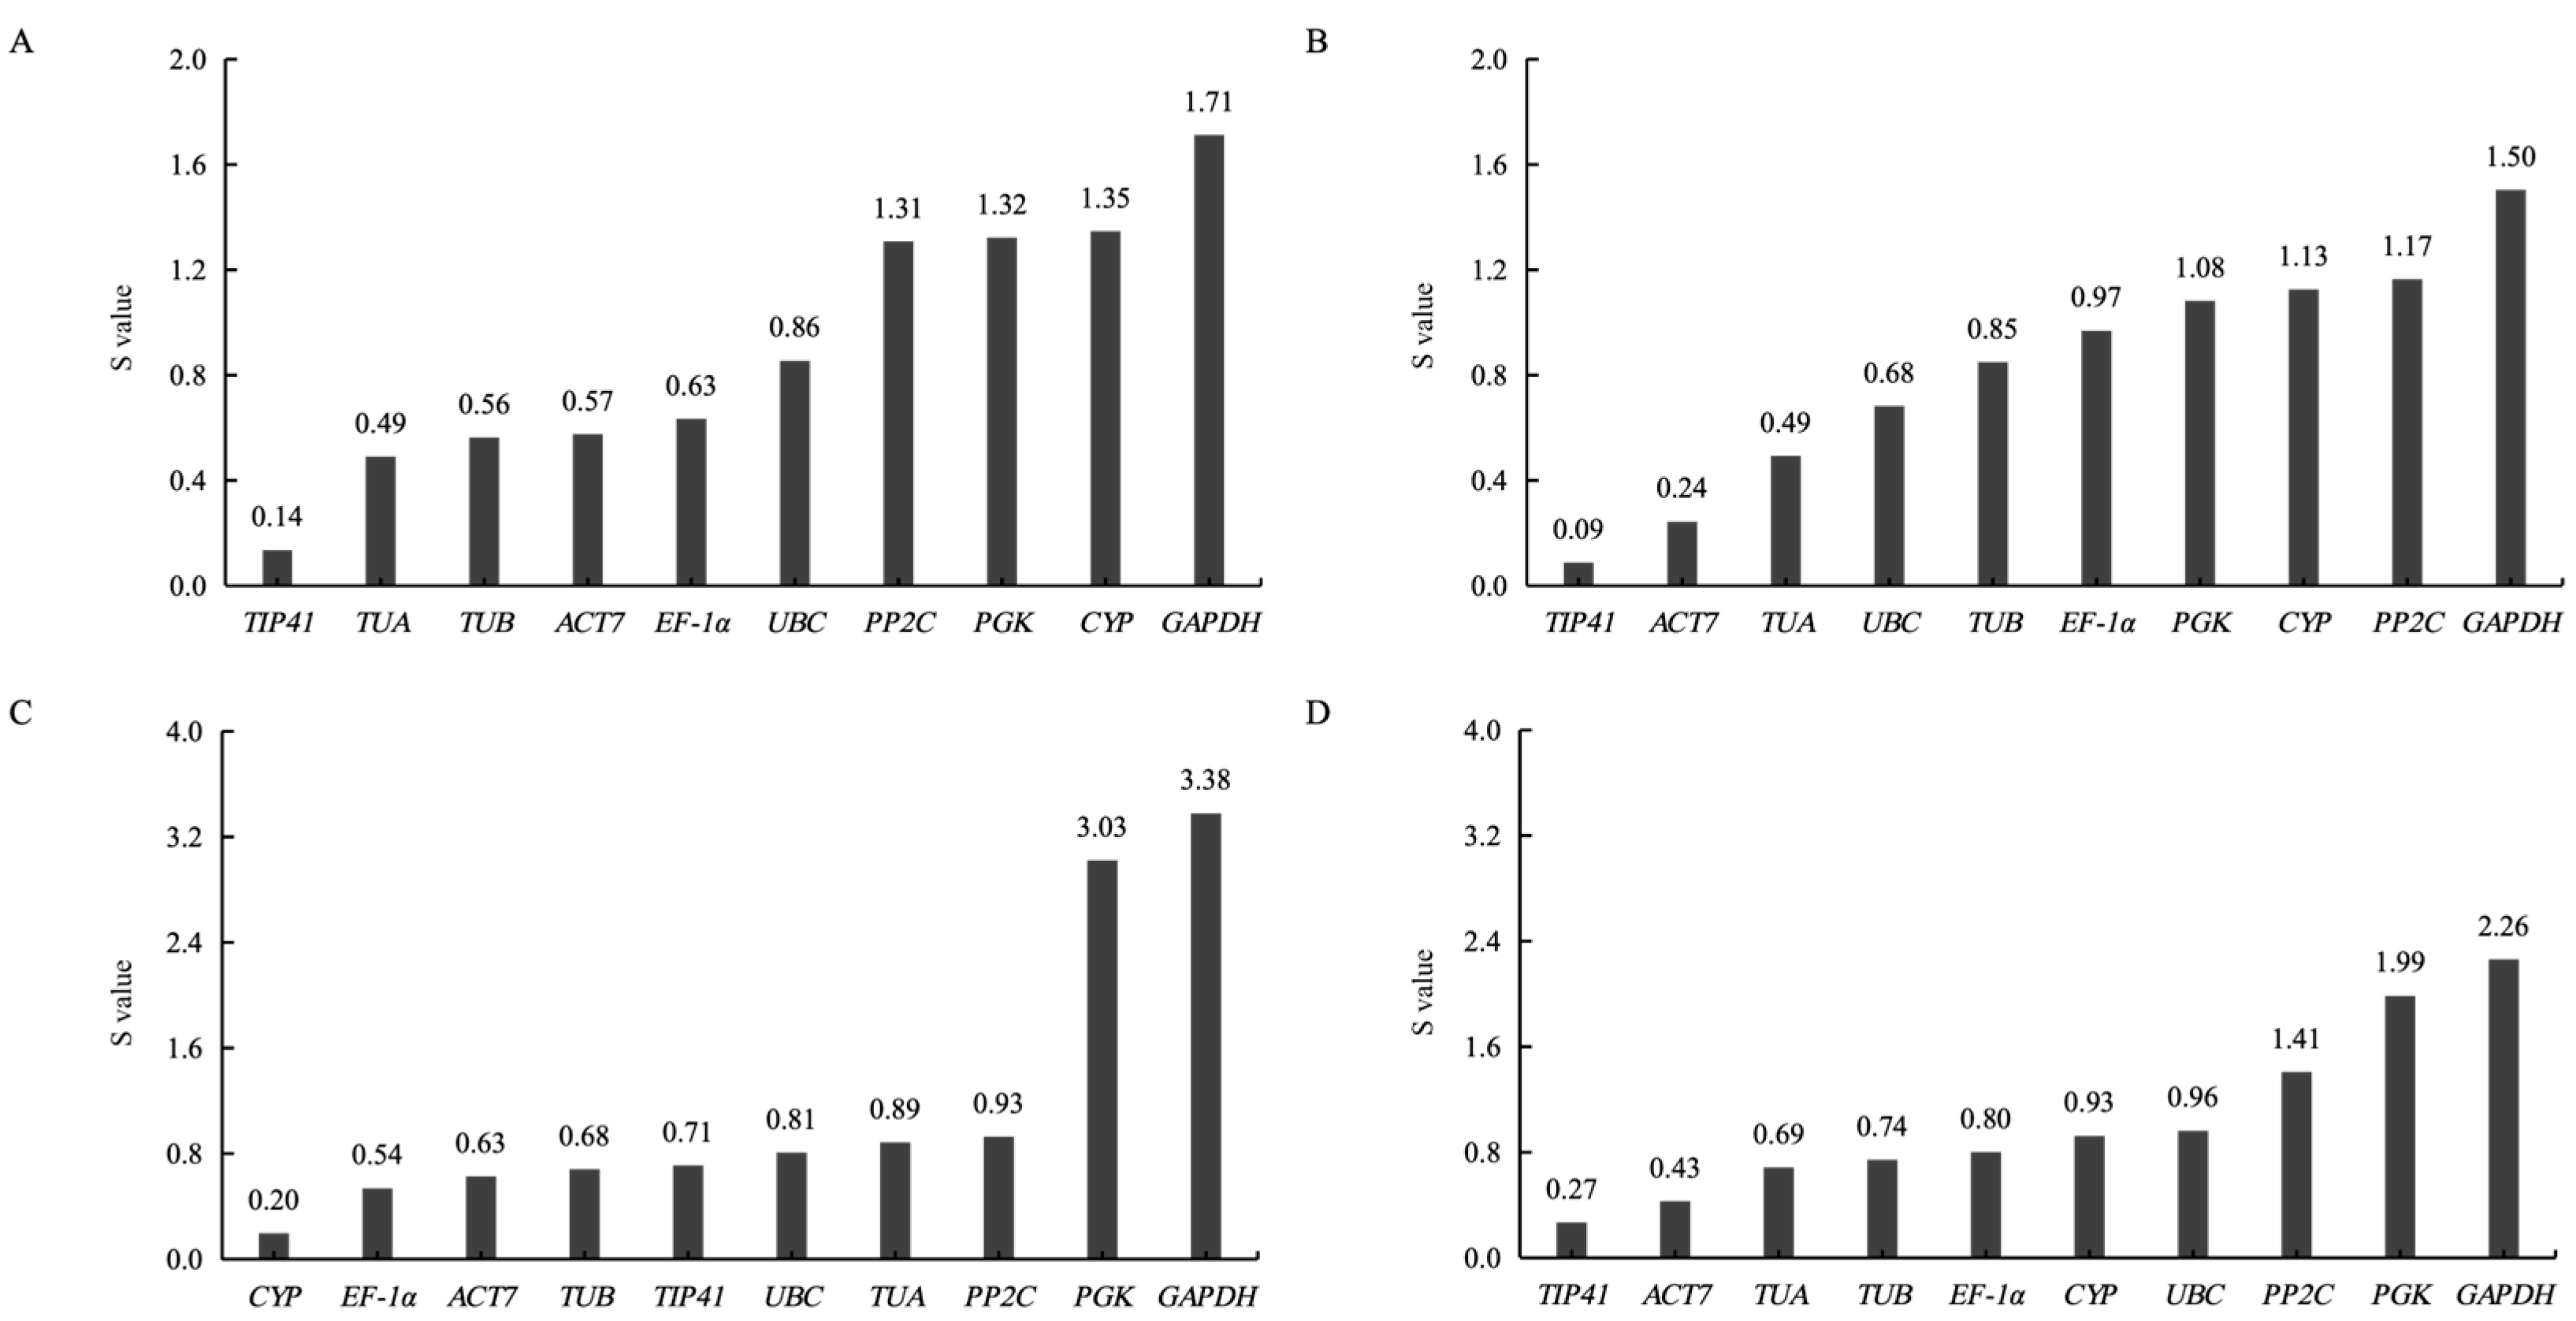
The NormFinder software assesses the expression stability of candidate reference genes based on stability values (S values), where a lower S-value indicates higher stability (Figure 5). TIP41 showed the most stable expression in different tissues, different developmental stages and all samples; CYP exhibited the most stable expression in different leaf coloration types. GAPDH was the most unstable across all four groups.

3.4.3. BestKeeper Analysis

The BestKeeper software determines the expression stability of candidate reference genes by automatically calculating two variables: standard deviation (SD) and coefficient of variation (CV). A smaller SD value indicates higher stability (Table 4). TIP41 was identified as the most stably expressed gene in different tissues, UBC in different developmental stages, and ACT7 in both different leaf coloration types and all samples.

3.4.4. Comprehensive Stability

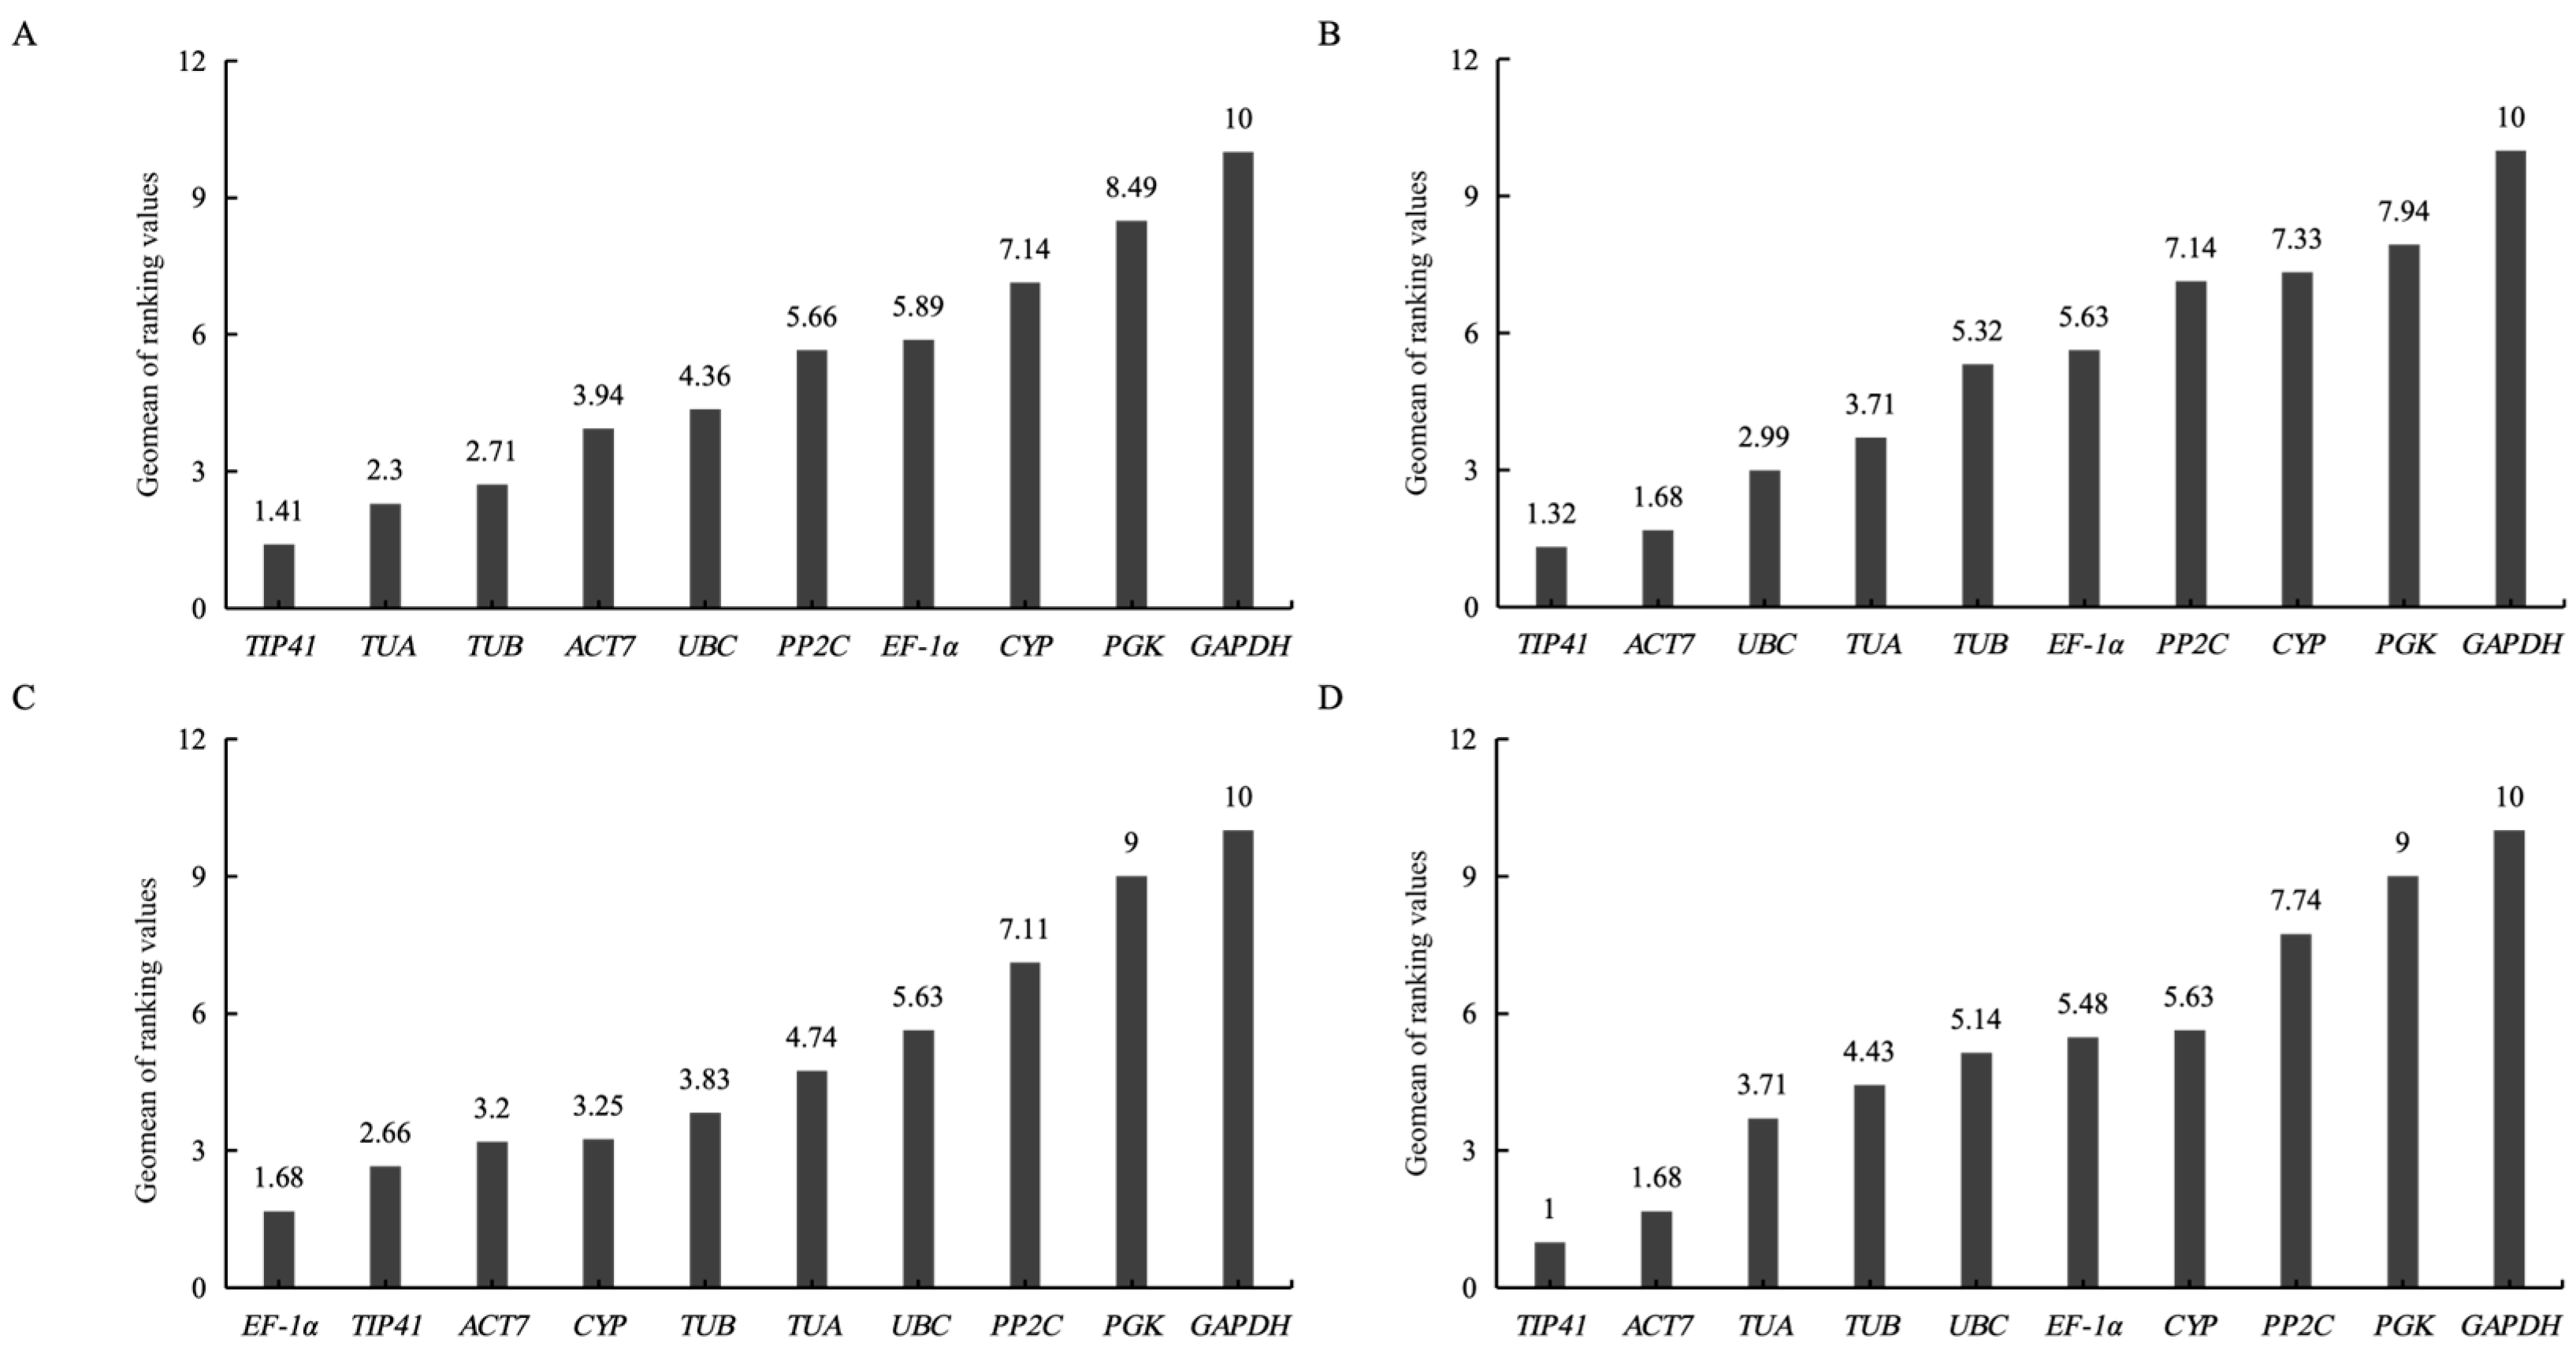
To integrate the analysis results from the geNorm, NormFinder, and BestKeeper algorithms, the Ct values of each candidate reference gene across different samples were imported into the online tool RefFinder for a comprehensive evaluation (Table 4). TIP41 was found to be the most stably expressed gene in different tissues, different developmental stages, and all samples. In contrast, EF-1α was the most stably expressed in different leaf coloration types, followed by TIP41 (Figure 6).

3.5. Validation of Candidate Reference Gene Stability

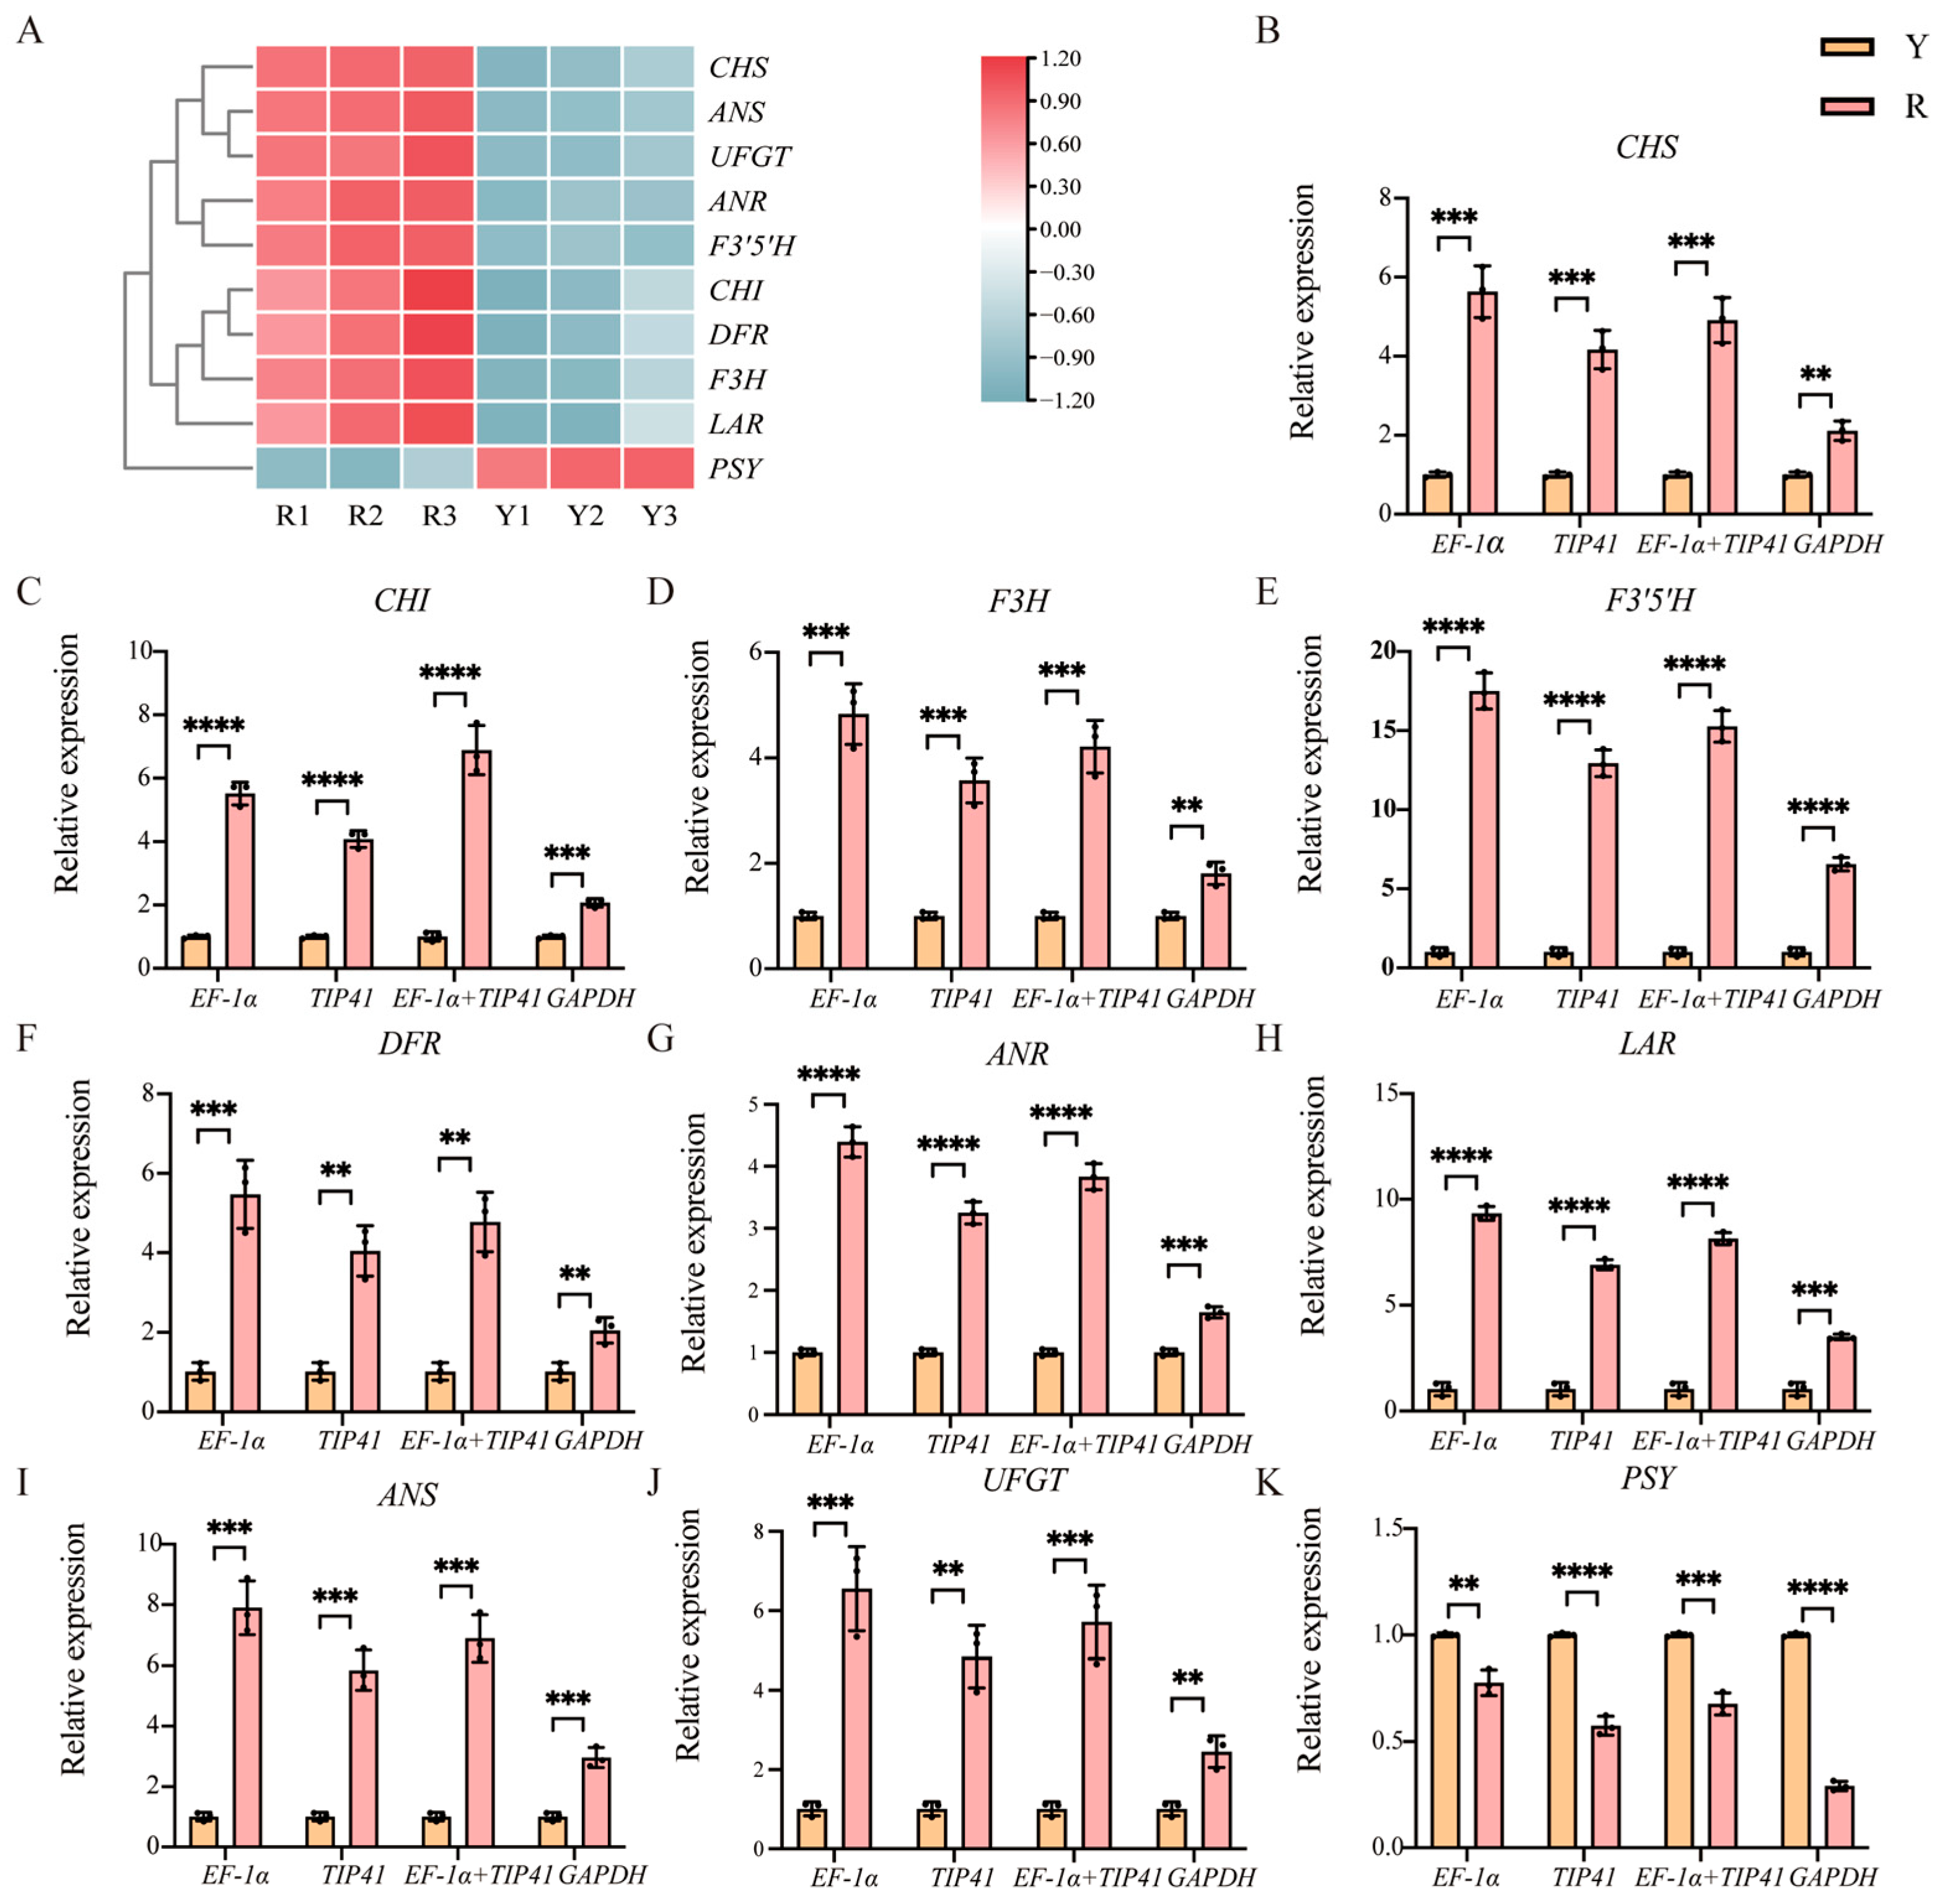
To select the most reliable internal control, we rely on the comprehensive ranking provided by RefFinder and the paired variance analysis by genorm to determine that the combination of EF-1α and TIP41 reference genes is optimal for different color variant types. The expression patterns of 10 structural genes in the pigment synthesis pathway were analyzed in autumn red and yellow leaves, using EF-1α and TIP41 (the most stable), the dual reference gene combination (EF-1α + TIP41), and GAPDH (the least stable) as calibration references, respectively. The results showed that when using EF-1α or TIP41 as single reference genes, or their combined calibration, the expression trends of the target genes were highly consistent. However, when GAPDH, the least stable reference gene, was used for standardization, the relative expression patterns of the target genes significantly deviated, and the results of the differential significance analysis among different leaf color samples also showed substantial changes (Figure 7).

4. Discussion

Selecting appropriate reference genes is a prerequisite for ensuring accurate and reliable qRT-PCR analysis results. However, the expression of reference genes often exhibits strong species, tissue, and developmental stage specificity, with few truly universal reference genes that transcend various physiological conditions [23]. In recent years, the combination of high-throughput sequencing technologies (e.g., RNA-seq) and bioinformatics algorithms has provided strong support for the efficient and standardized screening of reference genes [24]. For instance, candidate reference genes screened using public information databases for Oryza sativa have demonstrated excellent stability [25]. In this study, the stability of 10 candidate reference genes in E. maackii was evaluated using the geNorm, NormFinder, and BestKeeper algorithms, respectively. As detailed in the Results Section, the three statistical algorithms yielded divergent stability evaluations for the candidate genes. Such discrepancies in evaluation, which vary by algorithm, are quite common in plant reference gene screening studies [26], fundamentally originating from the differences in the underlying statistical models of each software. Previous studies on reference gene screening during fruit development in Prunus mume and Prunus salicina ‘Qiangcuili’ observed similar phenomena [12,27], specifically that BestKeeper’s ranking results often showed significant deviations from those of the other two software programs. This is primarily attributed to BestKeeper directly performing correlation and standard deviation analysis based on raw Ct values, whereas geNorm and NormFinder assess stability based on relative expression levels. Recognizing the inherent statistical limitations of single algorithms, this study further incorporated the RefFinder online platform. By calculating the geometric mean across multiple algorithms, this platform avoids the limitations of individual models and identifies highly reliable reference genes for E. maackii.
In addition to the objective differences in the algorithms themselves, the discrepancies in the stability of candidate genes across different analysis scales deeply reflect their underlying biological functional heterogeneity. In evaluations spanning different tissues (spatial scales) and developmental stages (temporal scales), TIP41 have shown excellent stability. TIP41 encodes an intrinsic vacuolar membrane protein involved in regulating fundamental cell signaling and vesicle transport [28]. Maintaining fundamental cell communication and protein translation is essential for survival across all plant organs and developmental stages. Therefore, we hypothesize that genes governing this core homeostasis are better equipped to resist spatial and temporal expression fluctuations, serving as reliable transcriptional landmarks. The extremely high stability of TIP41 in cross-tissue and cross-developmental stage analyses has been reported in multiple species. For example, it has been shown to maintain stable expression amidst metabolic fluctuations during the development of Xanthoceras sorbifolium seeds and the differentiation of various plant organs in the Brassica genus [29,30,31,32].
In contrast, under the specific physiological scale of autumn leaf color change, reference genes face entirely different transcriptional selection pressures. GAPDH encodes a key enzyme involved in glycolysis and the Calvin cycle. When mature green leaves enter the autumn color change stage, photosynthesis rapidly declines, and carbon flow is significantly redistributed to provide precursors for the biosynthesis of secondary metabolites. Therefore, the transcription of primary metabolism genes like GAPDH is highly likely to undergo drastic fluctuations, making them extremely unsuitable as reference genes under the specific physiological scale of autumn leaf color change [33,34]. To achieve phenotypic transformation, cells must synthesize substantial amounts of pigment-related structural enzymes. This requires plant cells to maintain high ribosomal activity and translational efficiency during this metabolic transition. As a translation elongation factor, EF-1α is an indispensable core component of protein synthesis [35]. This underlying physiological logic provides a plausible hypothesis for why EF-1α can still exhibit extremely high stability under the specific physiological scale of autumn leaf color change. Previous studies have widely confirmed the reliability of these genes in plant pigment quantitative analysis, not only in the color changes of reproductive organs such as Nelumbo nucifera and Camellia japonica [10,34,36], but also in the leaf color differentiation processes of woody and herbaceous plants such as Liquidambar formosana, Dendrobium officinale, and Sinobambusa tootsik [37,38,39,40]. This consistency across species and organs further supports the hypothesis that EF-1α can effectively counteract the drastic transcriptional selection pressures during autumn senescence, making it an ideal choice for precise normalization and elucidation of the molecular mechanism of the autumn leaf coloration types.
In traditional qRT-PCR expression analysis, normalization using a single reference gene was once the most common strategy. However, extensive research has confirmed that under extreme developmental transitions or severe environmental fluctuations, even classic housekeeping genes can exhibit significant shifts in expression abundance [41]. Therefore, introducing a multiple reference gene normalization system to eliminate the systematic bias caused by single-gene fluctuations has become a general consensus for improving quantitative accuracy. For example, in complex physiological studies such as the cut flower development of Paeonia ‘Bartzella’ [42] and the abiotic stress response of Salsola ferganica [43], combinations of two reference genes were employed to ensure data reliability. Based on this, the present study introduced a multiple reference gene joint-normalization model for the autumn leaf coloration types of E. maackii. According to the geometric averaging evaluation standard proposed by Vandesompele et al. [7], the core statistical indicator for determining the optimal number of reference genes is the pairwise variation value (Vn/Vn+1). The geNorm analysis revealed that in the comprehensive evaluation of all E. maackii samples, the V2/V3 value was 0.064, which is below the internationally recommended threshold of 0.15. This indicates that in the quantitative study of autumn leaves in E. maackii, introducing the two most stable genes, EF-1α and TIP41, for combined normalization is sufficient to meet the statistical requirements for accurate quantification.
The physiological essence of autumn leaf coloration is the accelerated degradation of chlorophyll, coupled with the massive synthesis and accumulation of secondary metabolites such as anthocyanins and carotenoids. Among these, the key enzyme genes of the anthocyanin biosynthesis pathway and the core genes of carotenoid biosynthesis directly determine the differentiation of red and yellow leaf phenotypes in plants [44,45]. In quantitative studies of autumn-color tree species such as Sapium sebiferum [46] and Liquidambar formosana [38], structural genes of pigment biosynthesis pathways, such as CHS, were utilized for validation. Therefore, selecting these highly active structural genes of pigment biosynthesis pathways as target genes can accurately reflect the normalization efficacy of reference genes under severe metabolic fluctuations. To validate our findings, we quantified ten pigment-related structural genes. Normalization with EF-1α, TIP41, or their combination yielded highly consistent expression profiles across different leaf colors. In contrast, using the unstable GAPDH severely distorted these transcriptional trends. These results confirm that EF-1α and TIP41 represent the optimal reference gene strategy for investigating autumn color transitions in E. maackii.
Although this study has successfully identified the reliable reference gene of E. maackii, there are certain limitations on the sampling of autumn leaf color samples in the experimental design. Representing red and yellow leaf samples were collected from two adjacent adult trees. Although this can minimize environmental impacts, such as soil composition and light, it is indeed impossible to separate the genotype-specific effect from the phenotype-related expression differences by using only one adult tree for each phenotype. Therefore, the differential expression observed in the verification of the target gene may partially reflect the genotype variation between the two individuals. However, EF-1α and TIP41 maintain high stability in samples with different leaf color phenotypes and genetic backgrounds, further highlighting their robust applicability. In order to establish a clearer molecular mechanism for the autumn color of E. maackii, future studies should expand the population-level sampling scale or use different leaf color mutation cloning with the same genetic background to completely eliminate genotype interference.
Looking forward, although this study successfully establishes EF-1α and TIP41 as highly reliable reference genes for studying the autumn leaf color change in E. maackii, their potential as universal internal references still require broader exploration. Future research should aim to evaluate the expression stability of these genes across a wider spectrum of developmental stages, diverse abiotic and biotic stress conditions, and alongside a more comprehensive array of functional genes and metabolic pathways. Such extensive validations will not only solidify the universal applicability of EF-1α and TIP41 for general transcript normalization in E. maackii but also provide robust methodological tools for deeper functional genomic and breeding studies in related woody ornamental species.

Supplementary Materials

The following supporting information can be downloaded at: https://www.mdpi.com/article/10.3390/horticulturae12070773/s1, Figure S1: Environmental consistency and phenotypic divergence of the sampled Euonymus maackii individuals; Figure S2: RNA agarose gel electrophoresis of different samples of E. maackii; Figure S3: Agarose gel electrophoresis image of PCR products of 10 candidate reference genes.

Author Contributions

Y.H. and J.Y. designed the research framework; J.Y. collected and prepared the materials for the experiment, analyzed the data, and wrote the first draft; Y.H. participated in the manuscript revision. All authors have read and agreed to the published version of the manuscript.

Funding

This work was supported by the National Natural Science Foundation of China (Grant No. 32271946).

Data Availability Statement

All data and plant materials from this study can be obtained from the corresponding author.

Acknowledgments

We are truly grateful to the Beijing Wenyu River Park for providing the E. maackii samples of autumn different leaf coloration types. We also extend our sincere thanks to Guanqing LI, Ming LUAN, Chun ZHANG, Lixia LI, and Wenming ZHANG for their assistance in providing and maintaining the plant materials.

Conflicts of Interest

The authors declare no conflicts of interest.

References

  1. Li, S. Application of silk cotton wood in landscaping and gardening. Mod. Hortic. 2015, 10, 114. [Google Scholar] [CrossRef]
  2. Su, P.; Li, Q.; Sun, L.; Li, X.; Yan, S.; Liu, Y.; Zuo, L.; Wen, P. Autumn Leaf Coloration Pattern of Euonymus maackii and Its Relationship with Physiology and Anatomical Structure. Sci. Silvae Sin. 2025, 61, 58–69. [Google Scholar]
  3. Song, P.; Ding, Y.; Xu, Z.; Cai, H.; Li, Q. Stuies on extraction, stability and composition of anthocyanis from leaves of Euonymus maackii. North. Hortic. 2019, 24, 81–87. [Google Scholar]
  4. Lu, F.; Wang, R.; Xu, X. Growth and Development Rules of One-Year-Old Seedlings of Euonymus bungeanus. Jiangsu Agric. Sci. 2017, 45, 141–142+145. [Google Scholar] [CrossRef]
  5. Wang, Y. Color leaf plants and their application in the gardens of northern cities. Mod. Hortic. 2024, 47, 138–140+143. [Google Scholar] [CrossRef]
  6. Nolan, T.; Hands, R.E.; Bustin, S.A. Quantification of mRNA using real-time RT-PCR. Nat. Protoc. 2006, 1, 1559–1582. [Google Scholar] [CrossRef] [Scilit] [PubMed]
  7. Vandesompele, J.; De Preter, K.; Pattyn, F.; Poppe, B.; Van Roy, N.; De Paepe, A.; Speleman, F. Accurate normalization of real-time quantitative RT-PCR data by geometric averaging of multiple internal control genes. Genome Biol. 2002, 3, research0034. [Google Scholar] [CrossRef] [Scilit] [PubMed]
  8. Hou, T.; Yi, S.; Zhang, Z.; Wang, J.; Li, C. Selection and Validation of Reference Genes for RT-qPCR in Phalaenopsis type Dendrobium Hybrid. Acta Hortic. Sin. 2022, 49, 2489–2501. [Google Scholar] [CrossRef]
  9. Jiang, M.; Bai, X.; Wang, W.; Zhao, Y.; Hu, Z.; Su, S.; Leng, P. Screening and verification of qRT-PCR reference genes in different organs and under salt stress of Quercus dentata. J. Cent. South Univ. For. Technol. 2026, 46, 211–220+234. [Google Scholar] [CrossRef]
  10. Nie, R.; Zhao, W.; Chen, S.; Hu, Y.; Chen, S.; Chen, L.; Geng, F. Screening and Stability Evaluation on qPCR Reference Genes of Camellia spp. J. Agric. Biotechnol. 2026, 34, 66–77. [Google Scholar] [CrossRef]
  11. Hong, Y.; Dai, S. Selection of reference genes for real-time quantitative polymerase chain reaction analysis of light-dependent anthocyanin biosynthesis in chrysanthemum. J. Am. Soc. Hortic. Sci. 2015, 140, 68–77. [Google Scholar] [CrossRef] [Scilit]
  12. Ye, Y.; Ingwe, H.L.; Zheng, Z.; Chen, Y.; Zhao, H.; Dong, B. Screening and Validation of Reference Genes for qPCR Analysis of Flower Color Synthesis Genes in Prunus mume. J. Agric. Biotechnol. 2023, 31, 2674–2684. [Google Scholar] [CrossRef]
  13. Jian, H.; Wang, H.; Qiu, X.; Yan, H.; Ma, L. Identification and Validation of Reference Genes for qRT-PCR Analysis of Petal-Color-Related Genes in Rosa praelucens. Genes 2024, 15, 277. [Google Scholar] [CrossRef] [Scilit] [PubMed]
  14. Wang, M.; Liu, Y.; Hu, J.; Lu, N.; Zhang, M.; Wang, N.; Wang, J.; Gao, C.; Ma, W. Identification of Stable Reference Genes in Catalpa bungei under Different Abiotic Stresses and Developmental Stages. For. Res. 2025, 38, 107–118. [Google Scholar]
  15. He, C.; Luo, C.; Yan, J.; Liu, W.; Wang, M.; Xie, D.; Wu, Z.; Jiang, B. Screening and Evaluation of Reference Genes for Real-time Quantitative PCR in Wax Gourd. Acta Hortic. Sin. 2024, 51, 748–760. [Google Scholar] [CrossRef]
  16. Li, Y.; Liang, X.; Zhou, X.; An, Y.; Li, M.; Yuan, L.; Li, Y.; Wang, Y. Spatio-temporal selection of reference genes in the two congeneric species of Glycyrrhiza. Sci. Rep. 2021, 11, 1122. [Google Scholar] [CrossRef] [Scilit] [PubMed]
  17. Lin, Y.; Liu, G.; Rao, Y.; Wang, B.; Tian, R.; Tan, Y.; Peng, T. Identification and validation of reference genes for qRT-PCR analyses under different experimental conditions in Allium wallichii. J. Plant Physiol. 2023, 281, 153925. [Google Scholar] [CrossRef] [Scilit] [PubMed]
  18. Andersen, C.L.; Jensen, J.L.; Ørntoft, T.F. Normalization of real-time quantitative reverse transcription-PCR data: A model-based variance estimation approach to identify genes suited for normalization, applied to bladder and colon cancer data sets. Cancer Res. 2004, 64, 5245–5250. [Google Scholar] [CrossRef] [Scilit] [PubMed]
  19. Pfaffl, M.W.; Tichopad, A.; Prgomet, C.; Neuvians, T.P. Determination of stable housekeeping genes, differentially regulated target genes and sample integrity: BestKeeper-Excel-based tool using pair-wise correlations. Biotechnol. Lett. 2004, 26, 509–515. [Google Scholar] [CrossRef] [Scilit] [PubMed]
  20. Xie, F.; Wang, J.; Zhang, B. RefFinder: A web-based tool for comprehensively analyzing and identifying reference genes. Funct. Integr. Genom. 2023, 23, 125. [Google Scholar] [CrossRef] [Scilit] [PubMed]
  21. Radonić, A.; Thulke, S.; Mackay, I.M.; Landt, O.; Siegert, W.; Nitsche, A. Guideline to reference gene selection for quantitative real-time PCR. Biochem. Biophys. Res. Commun. 2004, 313, 856–862. [Google Scholar] [CrossRef] [Scilit] [PubMed]
  22. Livak, K.J.; Schmittgen, T.D. Analysis of relative gene expression data using real-time quantitative PCR and the 2(-Delta Delta C(T)) Method. Methods 2001, 25, 402–408. [Google Scholar] [CrossRef] [Scilit] [PubMed]
  23. Chen, C.; Wu, J.; Hua, Q.; Tel-Zur, N.; Xie, F.; Zhang, Z.; Chen, J.; Zhang, R.; Hu, G.; Zhao, J.; et al. Identification of reliable reference genes for quantitative real-time PCR normalization in pitaya. Plant Methods 2019, 15, 70. [Google Scholar] [CrossRef] [Scilit] [PubMed]
  24. Xiong, Z.; Fu, C.; Huang, S.; Shi, J. Optimizing reference gene selection for accurate gene expression analysis in plants. Plant Signal. Behav. 2025, 20, 2597054. [Google Scholar] [CrossRef] [Scilit] [PubMed]
  25. Zhao, Z.; Zhang, Z.; Ding, Z.; Meng, H.; Shen, R.; Tang, H.; Liu, Y.G.; Chen, L. Public-transcriptome-database-assisted selection and validation of reliable reference genes for qRT-PCR in rice. Sci. China Life Sci. 2020, 63, 92–101. [Google Scholar] [CrossRef] [Scilit] [PubMed]
  26. Wu, J.; He, B.; Du, Y.; Li, W.; Wei, Y. Analysis Method of Systematically Evaluating Stability of Reference Genes Using geNorm, NormFinder and BestKeeper. Mod. Agric. Technol. 2017, 5, 278–281. [Google Scholar]
  27. Tang, X.; Meng, Y.; Du, Y.; Wang, M.; Pu, J.; Wang, H.; Niu, J.; Deng, Q.; Zhang, H. Screening and Validation of Reference Genes for Real-Time PCR during ‘Qiangcuili’ Fruit Development. J. Sichuan Agric. Univ. 2024, 42, 1220–1225+1231. [Google Scholar] [CrossRef]
  28. Expósito-Rodríguez, M.; Borges, A.A.; Borges-Pérez, A.; Pérez, J.A. Selection of internal control genes for quantitative real-time RT-PCR studies during tomato development process. BMC Plant Biol. 2008, 8, 131. [Google Scholar] [CrossRef] [Scilit] [PubMed]
  29. Li, L.; Liang, C.; Ning, C.; Zhang, W.; Jiang, G.; Zhang, X.; Wang, L. Selection of Reference Genes for Gene Expression Analysis in Seed Development of Xanthoceras sorbifolium Bunge. For. Res. 2024, 37, 79–85. [Google Scholar] [CrossRef]
  30. Li, Y.; Ling, W.; Ming, R.; Tan, Y.; Huang, R.; Huang, D. Screening and Validation of Reference Genes for Quantitative Real-time PCR in Curcuma kwangsiensis. Mol. Plant Breed. 2023. Available online: https://link.cnki.net/urlid/46.1068.S.20230821.1708.021 (accessed on 19 June 2026).
  31. Ren, Y.; Han, R.; Zhao, M. Internal Reference Genes Screening of Turnip by Real-Time Fluorescence Quantiative PCR. Qinghai Agric. For. Technol. 2021, 3, 1–6. [Google Scholar]
  32. Guo, Y.; Sun, S.; Zhao, W.; Wang, X.; Li, X.; Ma, Y.; Ren, Y. Screening and stability verification of kohlrabi reference genes. J. Gansu Agric. Univ. 2024, 59, 144–152. [Google Scholar] [CrossRef]
  33. Gurrieri, L.; Fermani, S.; Zaffagnini, M.; Sparla, F.; Trost, P. Calvin-Benson cycle regulation is getting complex. Trends Plant Sci. 2021, 26, 898–912. [Google Scholar] [CrossRef] [Scilit] [PubMed]
  34. Wang, Y.; Chen, Y.; Xue, Z.; Zhou, H.; Jin, Q.; Xu, Y. Selection and validation of reference genes for RT-qPCR normalization in lotus (Nelumbo nucifera) during petal coloration. J. Nanjing Agric. Univ. 2017, 40, 408–415. [Google Scholar] [CrossRef]
  35. Liu, X.; Wang, S.; Xue, J.; Xue, Y.; Lv, Y.; Zhang, X. Selection of Reference Genes for Quantitative Real-Time PCR in Different Tissue and Organ of Barbadoslily. Acta Hortic. Sin. 2018, 45, 919–930. [Google Scholar] [CrossRef]
  36. Zhang, P.; Chen, S.; Chen, S.; Zhu, Y.; Lin, Y.; Xu, X.; Liu, Z.; Zou, S. Selection and Validation of qRT-PCR Internal Reference Genes to Study Flower Color Formation in Camellia impressinervis. Int. J. Mol. Sci. 2024, 25, 3029. [Google Scholar] [CrossRef] [Scilit] [PubMed]
  37. Cao, H.; Li, H.; Lu, L.; Ji, Y.; Ma, L.; Li, S. Screening and Validation of Internal Reference Genes for Quantitative Real-Time PCR Analysis of Leaf Color Mutants in Dendrobium officinale. Genes 2023, 14, 1112. [Google Scholar] [CrossRef] [Scilit] [PubMed]
  38. Zhou, F.; Xu, L.; Shi, C.; Yang, S.; Chen, Y. Selection and Validation of Reliable Reference Genes for Liquidambar formosana Leaves with Different Leaf Colors. Curr. Issues Mol. Biol. 2024, 46, 9449–9462. [Google Scholar] [CrossRef] [Scilit] [PubMed]
  39. Chen, L.; Xie, D.; Rong, J.; He, T.; Zheng, Y. Screening of qRT-PCR Internal Reference Genes for Four Leaf Color Phenotypes of Sinobambusa tootsik f. luteoloalbostriata. Mol. Plant Breed. 2019, 17, 4592–4599. [Google Scholar] [CrossRef]
  40. Dai, Q.; Lu, M.; Yang, X.; Lei, C.; Huang, F.; Hu, X.; Huang, X.; Nie, X.; Chen, D.; Huang, S.; et al. qRT-PCR Reference Gene Selection for the Discoloration of Tender Leaves in Hawk Tea (Litsea coreana). Curr. Issues Mol. Biol. 2025, 47, 131. [Google Scholar] [CrossRef] [Scilit] [PubMed]
  41. Bustin, S.A.; Benes, V.; Garson, J.A.; Hellemans, J.; Huggett, J.; Kubista, M.; Mueller, R.; Nolan, T.; Pfaffl, M.W.; Shipley, G.L.; et al. The MIQE guidelines: Minimum information for publication of quantitative real-time PCR experiments. Clin. Chem. 2009, 55, 611–622. [Google Scholar] [CrossRef] [Scilit] [PubMed]
  42. Shang, S.; Faan, L.; Zhou, S.; Xu, M.; Gao, S.; Shi, G. Screening of reference genes and expression analysis of petal senescence associated genes in Itoh peony ‘Bartzella’ cut flowers. Plant Physiol. J. 2023, 59, 153–164. [Google Scholar] [CrossRef]
  43. Wang, S.; Zhang, S. Selection of the Reference Gene for Expression Normalization in Salsola ferganica under Abiotic Stress. Genes 2022, 13, 571. [Google Scholar] [CrossRef] [Scilit] [PubMed]
  44. He, J.Q.; Yu, D.C.; Ren, S.Y.; Zhang, X.L.; Li, X.Y.; Huang, M.J.; Huang, H.Q. Integrative Targeted Metabolomics and Transcriptomics Reveal the Mechanism of Leaf Coloration in Impatiens hawkeri ‘Sakimp005’. Int. J. Mol. Sci. 2024, 26, 174. [Google Scholar] [CrossRef] [Scilit] [PubMed]
  45. Gong, Z.H.; Chen, S.H.; Li, X.Y.; Lv, W.W.; Li, M.R.; Jin, X.M.; Gao, Y.F.; Rong, L.P. Anthocyanin metabolites and related regulatory genes analysis in leaves of Acer Pseudosieboldianum mutant during different periods of color change. BMC Genom. 2025, 26, 182. [Google Scholar] [CrossRef] [Scilit] [PubMed]
  46. Chen, X.; Mao, Y.; Huang, S.; Ni, J.; Lu, W.; Hou, J.; Wang, Y.; Zhao, W.; Li, M.; Wang, Q.; et al. Selection of Suitable Reference Genes for Quantitative Real-time PCR in Sapium sebiferum. Front. Plant Sci. 2017, 8, 637. [Google Scholar] [CrossRef] [Scilit] [PubMed]
Figure 1. Different samples of E. maackii, including (A) Leaf buds, (B) Young leaves, (C) Mature green leaves, (D) Red leaves (E) Yellow leaves, (F) Flowers, (G) Phloem, (H) New stems, (I) New roots, (J) Old roots. Scale 1 cm. Grouping includes different tissues: new roots, new stems, flowers, leaf buds, mature green leaves; different developmental stages: new roots, old roots, new stems, phloem of lignified stems, leaf buds, young leaves, mature green leaves; different autumn leaf coloration types: mature green leaves, yellow leaves, red leaves; and all samples.
Horticulturae 12 00773 g001
Figure 2. Expression of candidate reference genes, including (A) Heatmap of expression for 10 candidate endogenous reference genes in E. maackii. R1–R3 and Y1–Y3 display the three intra-individual replicates for the red leaf and yellow leaf samples respectively. The color scale represents the row-scaled Z-scores of log-transformed expression values, where red indicates relatively higher expression levels and blue indicates lower expression levels across the samples. (BK) melting curves of 10 candidate internal reference genes. Abbreviations: elongation factor 1-α (EF-1α), actin 7 (ACT7), α-tubulin (TUA), β-tubulin (TUB), glyceraldehyde-3-phosphate dehydrogenase (GAPDH), cyclophilin (CYP), phosphoglycerate kinase (PGK), ubiquitin-conjugating enzymes (UBC), protein phosphatase 2C (PP2C), and the phosphatase activator TIP41 (TIP41).
Horticulturae 12 00773 g002
Figure 3. geNorm analysis of expression stability values for candidate internal reference genes, including (A) Different tissues, (B) Different developmental stages, (C) Different leaf coloration types, (D) All samples. Abbreviations: elongation factor 1-α (EF-1α), actin 7 (ACT7), α-tubulin (TUA), β-tubulin (TUB), glyceraldehyde-3-phosphate dehydrogenase (GAPDH), cyclophilin (CYP), phosphoglycerate kinase (PGK), ubiquitin-conjugating enzymes (UBC), protein phosphatase 2C (PP2C), and the phosphatase activator TIP41 (TIP41).
Horticulturae 12 00773 g003
Figure 4. Pairwise variation (V) of the 10 candidate reference genes, including (A) Different tissues, (B) Different developmental stages, (C) Different leaf coloration types, (D) All samples.
Horticulturae 12 00773 g004
Figure 5. NormFinder analysis of expression stability values for candidate internal reference genes, including (A) Different tissues, (B) Different developmental stages, (C) Different leaf coloration types, (D) All samples. Abbreviations: elongation factor 1-α (EF-1α), actin 7 (ACT7), α-tubulin (TUA), β-tubulin (TUB), glyceraldehyde-3-phosphate dehydrogenase (GAPDH), cyclophilin (CYP), phosphoglycerate kinase (PGK), ubiquitin-conjugating enzymes (UBC), protein phosphatase 2C (PP2C), and the phosphatase activator TIP41 (TIP41).
Horticulturae 12 00773 g005
Figure 6. RefFinder analyses the stability of 10 candidate internal reference genes, including (A) Different tissues, (B) Different developmental stages, (C) Different leaf coloration types, (D) All samples. Abbreviations: elongation factor 1-α (EF-1α), actin 7 (ACT7), α-tubulin (TUA), β-tubulin (TUB), glyceraldehyde-3-phosphate dehydrogenase (GAPDH), cyclophilin (CYP), phosphoglycerate kinase (PGK), ubiquitin-conjugating enzymes (UBC), protein phosphatase 2C (PP2C), and the phosphatase activator TIP41 (TIP41).
Horticulturae 12 00773 g006
Figure 7. Transcriptomic profiles and qRT-PCR validation of candidate genes. (A) Expression profiles of 10 structural genes of the pigment synthesis pathway in red and yellow leaves. R1–R3 and Y1–Y3 display the three intra-individual replicates for the red leaf and yellow leaf samples respectively. The color scale represents the row-scaled Z-scores of log-transformed expression values, where red indicates relatively higher expression levels and blue indicates lower expression levels across the samples. (BK) Relative expression levels of structural genes of the pigment synthesis pathway when EF-1α, TIP41, EF-1α + TIP41 and GAPDH were used as internal reference genes. R and Y denote the red leaf and yellow leaf samples, respectively. Statistical significance between the red and yellow leaves was determined using an unpaired two-tailed Student’s t-test (** p < 0.01, *** p < 0.001, **** p < 0.0001). Abbreviations: elongation factor 1-α (EF-1α), glyceraldehyde-3-phosphate dehydrogenase (GAPDH), the phosphatase activator TIP41 (TIP41), chalcone synthase (CHS), flavanone 3-hydroxylase (F3H), flavonoid 3′, 5′-hydroxylase (F3′5′H), dihydroflavonol 4-reductase (DFR), anthocyanidin reductase (ANR), leucoanthocyanidin reductase (LAR), anthocyanidin synthase (ANS), UDP-Glucose Flavonoid Glucosyltransferase (UFGT), and phytoene synthase (PSY).
Horticulturae 12 00773 g007
Table 1. Information on primers for structural genes of pigment biosynthesis pathways.
GeneFull NamePrimer Sequence (5′-3′)
CHSChalcone synthaseF: CAAACAGCGAGCACAAGACC
R: TTTGGGACCTCAACGACCAC
CHIChalcone isomeraseF: ACCTGGAAACGAACTCGCAA
R: AGGCTTCCTCTTCCTCTTCCT
F3HFlavanone 3-hydroxylaseF: CGTCTCCAGTCATCTCCAGG
R: ATTGCCTCTGACAGCACCTC
F3′5′HFlavonoid 3′,5′-hydroxylaseF: CCAGAGAGATTCATGAGTGGCA
R: TGGTCAACCCCATTAGGCAG
DFRDihydroflavonol 4-reductaseF: TGTTTGAGAATCCACACGCC
R: TGAACCGAAACCCCATGTCC
ANRAnthocyanidin reductaseF: GTTTTCCATGTCGCAACCCC
R: CAACAACCAAACCTGTGCCA
LARLeucoanthocyanidin reductaseF: TCCGAGGTTATTCCACCGTTG
R: TTTCTTTCCCACAAAGCGGC
ANSAnthocyanidin synthaseF: ATTGACGCCGAGGACAAAGT
R: TCCCTGAAGCCTGGTCATTG
UFGTUDP-Glucose Flavonoid GlucosyltransferaseF: TTAGCTTCGGGACTGTGGTG
R: CAAAACCTGTGTTTGGGGCG
PSYPhytoene synthaseF: AACTGGTTGCGGAAATCCCA
R: CTTCGCCACACCCTCTGTAG
Table 2. Information on primers for candidate housekeeping genes.
GenePrimer Sequence (5′-3′)Product Length/bpSlopeAmplification Efficiency (E)%Linear Correlation Coefficient R2
ACT7F: AAGATTCCGTGCCCAGAGG
R: CCTTGCTCATACGGTCTGC
188−2.1951115.23870.9901
TUAF: CGAGTGAGGAAGTTGGCTGA
R: ACTGCTGTTGAGACCTGTGG
182−2.1205113.61320.99384
TUBF: CATGATGTGTGCTGCTGACC
R: GCCATCCTCAAGCCCTTAGG
198−2.1146114.06570.9971
PP2CF: GATTCGAACGCTGTTGAGGC
R: CAACGTGGCCATCGAAAAC
182−2.1940108.24610.9982
TIP41F: AGGTGGACGACAAGGACTA
R: ACAACTGTCCCCAAACACC
189−2.2345105.49660.9869
UBCF: CCCAAACATCAACACAATGGT
R: CTCGTACTTGCTCCGGTCAG
181−2.2431104.93360.9989
EF-1αF: TGTTGAGATGCACCACGAGG
R: AGCCATTTCCAATCTGCCCA
197−2.499490.39560.9936
GAPDHF: ATGCCTTACCTGCTGTCACC
R: TCCTTCCGTGTTCCAACTGT
183−2.2103107.12230.9956
CYPF: CGCCGATGAGAACTTCCAGA
R: ATCCCGATCCGACCTTCTCA
197−2.2002107.81810.9973
PGKF: AACTGGTTGCGGAAATCCCA
R: CTTCGCCACACCCTCTGTAG
182−2.2265106.02830.9964
Table 3. Ten candidate reference gene ΔCT value ranking.
GroupsMethodRanking
12345678910
Different tissuesMean CtEF1-αCYPACT7UBCGAPDHTUATUBPP2CPGKTIP41
ΔCtTIP41TUATUBACT7EF1-αUBCPP2CPGKCYPGAPDH
Different stages of developmentMean CtCYPEF1-αACT7UBCTUAGAPDHTUBPP2CPGKTIP41
ΔCtTIP41ACT7TUAUBCTUBEF1-αPGKPP2CCYPGAPDH
Different types of leaf colorationMean CtCYPUBCEF1-αACT7PP2CTUATUBGAPDHTIP41PGK
ΔCtEF1-αTIP41TUBTUAACT7UBCCYPPP2CPGKGAPDH
All samplesMean CtCYPEF1-αUBCACT7TUAGAPDHTUBPP2CPGKTIP41
ΔCtTIP41ACT7TUATUBUBCEF1-αCYPPP2CPGKGAPDH
Table 4. Expression stability analysis of candidate reference genes by BestKeeper.
GeneDifferent TissuesDifferent Stages of DevelopmentDifferent Types of Leaf ColorationAll Samples
SDCV/%SDCV/%SDCV/%SDCV/%
ACT71.15675.00980.81393.58220.14370.63590.86153.7607
TUA1.39995.66351.19324.88800.47552.01911.23315.0625
TUB1.24944.95851.31135.24130.21220.85761.17584.6810
PP2C1.08264.19841.11064.33870.62272.64631.23834.9262
TIP410.87933.17740.81842.98580.36931.35890.79202.8873
UBC0.94164.05860.57222.49540.56562.63260.91234.0125
EF-1α1.43386.39081.06534.87470.35041.61970.98944.5198
GAPDH2.02038.17941.56436.37152.42299.14951.94127.7474
CYP1.14955.25211.07974.96180.20010.93730.87394.0291
PGK1.47385.55901.36045.12452.24137.93651.66326.1903
Disclaimer/Publisher’s Note: The statements, opinions and data contained in all publications are solely those of the individual author(s) and contributor(s) and not of MDPI and/or the editor(s). MDPI and/or the editor(s) disclaim responsibility for any injury to people or property resulting from any ideas, methods, instructions or products referred to in the content.