Article

Application of SilicoDArT Markers for the Analysis of Genetic Diversity and Population Structure in Moringa oleifera Lam. Cultivated in Mexico

by
Rafael Ruiz-Hernández
1,
Martha Hernández-Rodríguez
2,*,
Arturo Pérez-Vázquez
1,
Emmanuel de Jesús Ramírez-Rivera
3,
Gustavo López-Romero
1,
José Roberto Bautista-Aguilar
4,
Mario Alejandro Hernández-Chontal
4 and
Oliver Salas-Valdez
3
1
Colegio de Postgraduados, Campus Veracruz, Predio Tepetates, Manlio F. Altamirano C.P. 91700, Veracruz, Mexico
2
Posgrado en Recursos Genéticos y Productividad-Genética, Colegio de Postgraduados, Campus Montecillo, Carretera México-Texcoco Km. 36.5, Montecillo, Texcoco C.P. 56264, Estado de Mexico, Mexico
3
Tecnológico Nacional de México, Instituto Tecnológico Superior de Zongolica, Zongolica C.P. 95005, Veracruz, Mexico
4
Facultad de Ciencias Agrícolas, Universidad Veracruzana, Circuito Gonzalo Aguirre Beltrán s/n, Zona Universitaria, Xalapa C.P. 91000, Veracruz, Mexico
*
Author to whom correspondence should be addressed.
Horticulturae 2026, 12(6), 729; https://doi.org/10.3390/horticulturae12060729
Submission received: 29 April 2026 / Revised: 8 June 2026 / Accepted: 8 June 2026 / Published: 15 June 2026

Abstract

The objective of this study was to determine the diversity and genetic structure of M. oleifera populations cultivated in Mexico through SilicoDArT markers. Seeds were collected from 14 populations in various states of the country. The seeds were germinated in greenhouse conditions. DNA was extracted from young leaves using a CTAB-based protocol. The extracted DNA was used to genotype each population with DArtseqTM technology. A total of 11,156 SilicoDArT markers were obtained, all of which were polymorphic. On average, the expected heterozygosity of the populations was 0.46, the number of effective alleles was 1.84 and the rareness was 280.53. Principal coordinate analysis and cluster analysis identified three clusters, with no clear association according to cultivation site. Genetic structure analysis determined three original populations (K = 3). Seven populations were assigned to the same ancestral group, six populations exhibited shared ancestries and one population displayed a distinct genetic background, suggesting anthropogenic management and exchange plant material among leaf producers. The identified genetic diversity and population structure constitute a basis for the conservation and management of Mexican moringa germplasm.

1. Introduction

Moringa oleifera Lam., commonly known as “moringa”, is a plant species native to India that exhibits high agroecological plasticity. This plasticity enables it to tolerate high temperatures, drought, UV radiation, and soils with low nutrient and moisture availability [1]. The plasticity observed in moringa has been partially associated with its genetic diversity, which generates combinations that maintain favorable photosynthetic rates. This diversity confers a high capacity for acclimatization and allows the species to achieve satisfactory yields, highlighting its economic importance [2]. Its leaves, flowers, and seeds possess nutritional and medicinal properties due to their content of vitamins, proteins, lipids, minerals, and secondary metabolites [3]. Several studies have reported that these chemical compounds may be associated with beneficial effects on human health, including antimicrobial, anti-inflammatory, antioxidant, anticancer, hepatoprotective, antiulcer, analgesic, antidiabetic, and antidiuretic activities [4]. The uses of moringa are diverse, ranging from food and forage to industrial and medicinal applications. Its high-quality protein content, along with vitamins, minerals, and phytochemicals, enables it to help prevent various types of diseases in humans. Secondary metabolites identified in some moringa populations also contribute to increasing tolerance to high temperatures and drought, preventing stress and oxidative damage [5]. For this reason, organizations such as the FAO promote the cultivation and consumption of moringa in several countries [6]. However, cultivated materials may differ in their genetic diversity and assessing genetic diversity is necessary to understand its potential relationship with nutritional quality, biochemical composition, and acclimatization processes [7].
In Mexico, moringa was introduced during the voyages of the Manila Galleon [8], and is currently cultivated in several tropical and subtropical regions of the country. In 2024, moringa production in Mexico covered 46.25 ha, with Michoacán (36 ha) and Puebla (16.25 ha) being the main producing states [9]. Currently, morphological and phenological differences have been identified among the materials cultivated in Mexico [10]. Based on this information, the existence of unexplored genetic diversity can be inferred. Genetic diversity should be assessed using neutral genetic parameters that are highly informative and not influenced by environmental variation. DNA-based molecular markers provide an appropriate basis for estimating genetic differentiation among plant populations, because they primarily reflect selectively neutral variation and are largely unaffected by environmental conditions that modulate phenotypic traits [11].
Molecular markers are DNA sequences located in known regions of the genome and are used to assess genetic variation within a species [12]. DArT is one of the systems used to generate such markers. This technology uses a combination of restriction enzymes that reduce genome complexity [12]. These fragments originate from gene-rich regions with a low copy number [13]. A variant of DArTseq technology is the silicoDArT markers, which are based on differences in enzymatic restriction sites to resolve population genetic structure, determine parental origin, and estimate the genetic contribution of parental lineages [14]. SilicoDArT markers exhibit dominant inheritance (presence/absence) and represent an tool for studying genetic evolution, diversity, and divergence [15]. Their application includes research aimed at quantifying diversity in genetic resources [16], and they offer a significant advantage over simple sequence repeats (SSR) and amplified fragment length polymorphism (AFLP) markers because they cover the entire genome [12]. SilicoDArT markers can be used to detect genomic variation associated with phenotypic diversity [17]. For example, in plant species, it has been possible to determine shared genomic regions among inbred lines, accessions, or subspecies [18]. Previous studies have demonstrated that SilicoDArT markers are associated with genes involved in responses to different types of stress [19], which allows the identification of genetic gain, alleles associated with productivity, and resistance to diseases [20]. This type of marker has been used in species such as macadamia (Macadamia integrifolia) [21], maize (Zea mays) [22], cassava (Manihot esculenta) [23], and melon (Cucumis melo var. flexuosus) [24]. In M. oleifera, studies using SSR [25], AFLP [26], and Inter-Simple Sequence Repeat (ISSR) markers [27] have been conducted; however, in Mexican moringa populations, information regarding genome-wide genetic diversity and population structure remains limited. Therefore, the objective of this study was to evaluate the genetic diversity and structure of M. oleifera Lam. populations cultivated in Mexico using SilicoDArT markers.

2. Materials and Methods

2.1. Study Area

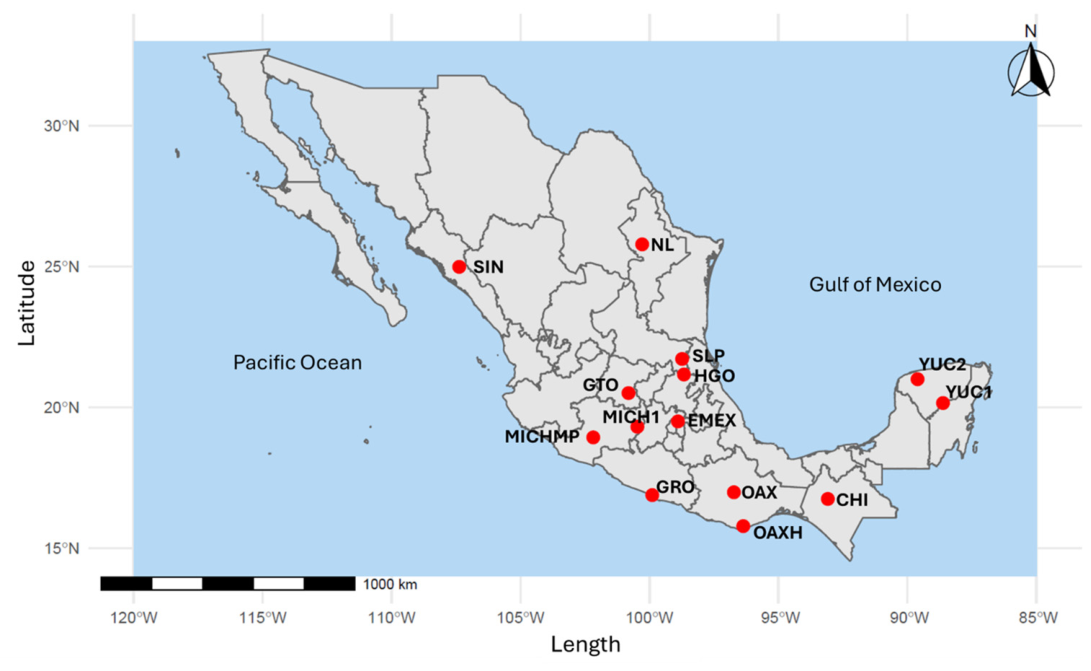
Seeds (2 kg) of moringa were collected from commercially cultivated plantations located in the states of Chiapas, Estado de Mexico, Guanajuato, Guerrero, Michoacán, Oaxaca, Sinaloa, San Luis Potosí, Hidalgo, Veracruz, and Yucatán, during summer of 2021. Figure 1 show the geographical location of each sampled population.

2.2. Plant Material

The collected seeds were surface-sterilized with a 10% (v/v) sodium hypochlorite solution for 5 min, rinsed with abundant sterile water, and sown in nursery bags. Several days after germination, samples of young leaves and stems were collected from 10 seedlings per population. The samples were stored in plastic tubes containing 5 mL of distilled water and transported under cold conditions in order to preserve their integrity and prevent DNA degradation.

2.3. DNA Extraction

For each population, young leaf tissue was collected from 10 individuals. From each individual, 30 ± 1 mg of tissue was weighed and pooled to form a 300 mg composite sample. Samples were stored at −80 °C until DNA extraction. Genomic DNA was extracted following the CTAB-based protocol described by [28], with minor modifications. Tissue was homogenized in liquid nitrogen using a polypropylene pestle (SP Bel-Art, Warminster, PA, USA), avoiding tissue thawing during the process, instead of lyophilized tissue. DNA purification was performed using chloroform/isoamyl alcohol (24:1) instead of chloroform/octanol, and the final DNA pellet was rehydrated in 70 µL of sterile HPLC-grade water after drying for 2 h at room temperature. DNA concentration and purity were evaluated using a Nanodrop 2000 spectrophotometer (Thermo Scientific, Waltham, MA, USA), and DNA integrity was verified by electrophoresis on 1% agarose gels and visualized under UV light using a transilluminator (DNR Bio-Imaging Systems®, Modi’in-Maccabim-Re’ut, Israel).

2.4. Genotyping Moringa Populations Using SilicoDArT

Genotyping was performed by the Genotyping Service for Agriculture at CIMMYT using the protocol patented by DArT (https://www.diversityarrays.com/). For this purpose, 3 µg of genomic DNA from each sample was sent for analysis. The genotyping method was based on DNA fragmentation using the restriction enzymes PstI (CTGCAG) and AseI (ATTAAT), followed by the ligation of adapter sequences, library enrichment through PCR using the c-Bot system (Illumina, San Diego, CA, USA), and second-generation sequencing using a NovaSeq™ 6000 platform (Illumina, San Diego, CA, USA), as described by [29]. The resulting sequences, based on differences in enzymatic restriction sites, were called using DArT analytical software (Diversity Arrays Technology Pty Ltd., Canberra, Australia). The resulting SilicoDArT marker dataset consisted of binary presence/absence (1/0) scores, where 1 indicated fragment presence and 0 indicated fragment absence, and were provided in an Excel worksheet.

2.5. Data Analysis

The SilicoDArT marker dataset was filtered to retain markers with complete binary presence/absence information across all populations (%NA = 0), polymorphism values between 0.05 and 0.95, call rate of 1.0, and reproducibility ≥ 0.96. The filtered dataset was subsequently used to estimate expected gene diversity (He), number of effective alleles (Ae), rareness or average specificity of the alleles contained per accession, percentage of polymorphic loci (P), and AMOVA using BIO-R (Biodiversity Analysis with R) version 3.0 [30]. Principal coordinates analysis (PCoA) was performed to determine the grouping of populations and was carried out using the PAST software version 3.0. The dendrogram was constructed using the Ward method with Euclidean distance to determine group formation (this method allows fewer groups with greater homogeneity) using JMP® version 17.2.0. The genetic structure analysis was conducted using the Admixture model implemented in the STRUCTURE software version 2.3.4. A Bayesian individual assignment analysis was performed using 250,000 MCMC (Monte Carlo Markov Chain) iterations with 50,000 burn-in iterations for K values ranging from 1 to 10, with 10 replicates for each K [31]. The Delta K value was obtained using Structure Harvester version 0.6.94 [32].

3. Results

3.1. Genetic Diversity

A total of 11,156 SilicoDArT markers were obtained. After filtering, 8652 markers were retained for subsequent analyses at the locus and population levels. At the locus level, the average values of the diversity indices for the filtered markers are presented in Table 1, where the value of p = 1.0 indicates that the loci were 100% polymorphic. At the population level, the He ranged from 0.42 (HGO population) to 0.50 (NL population), indicating moderate to high diversity according to the scale proposed by [33]. The number of effective alleles ranged from 1.72 to 1.98 for the HGO and NL populations, respectively. Rareness was low in the MICHMP population, with a value of 133.30, whereas the OAXH population showed the highest value (1074.57) (Table 2).

3.2. Genetic Relationships

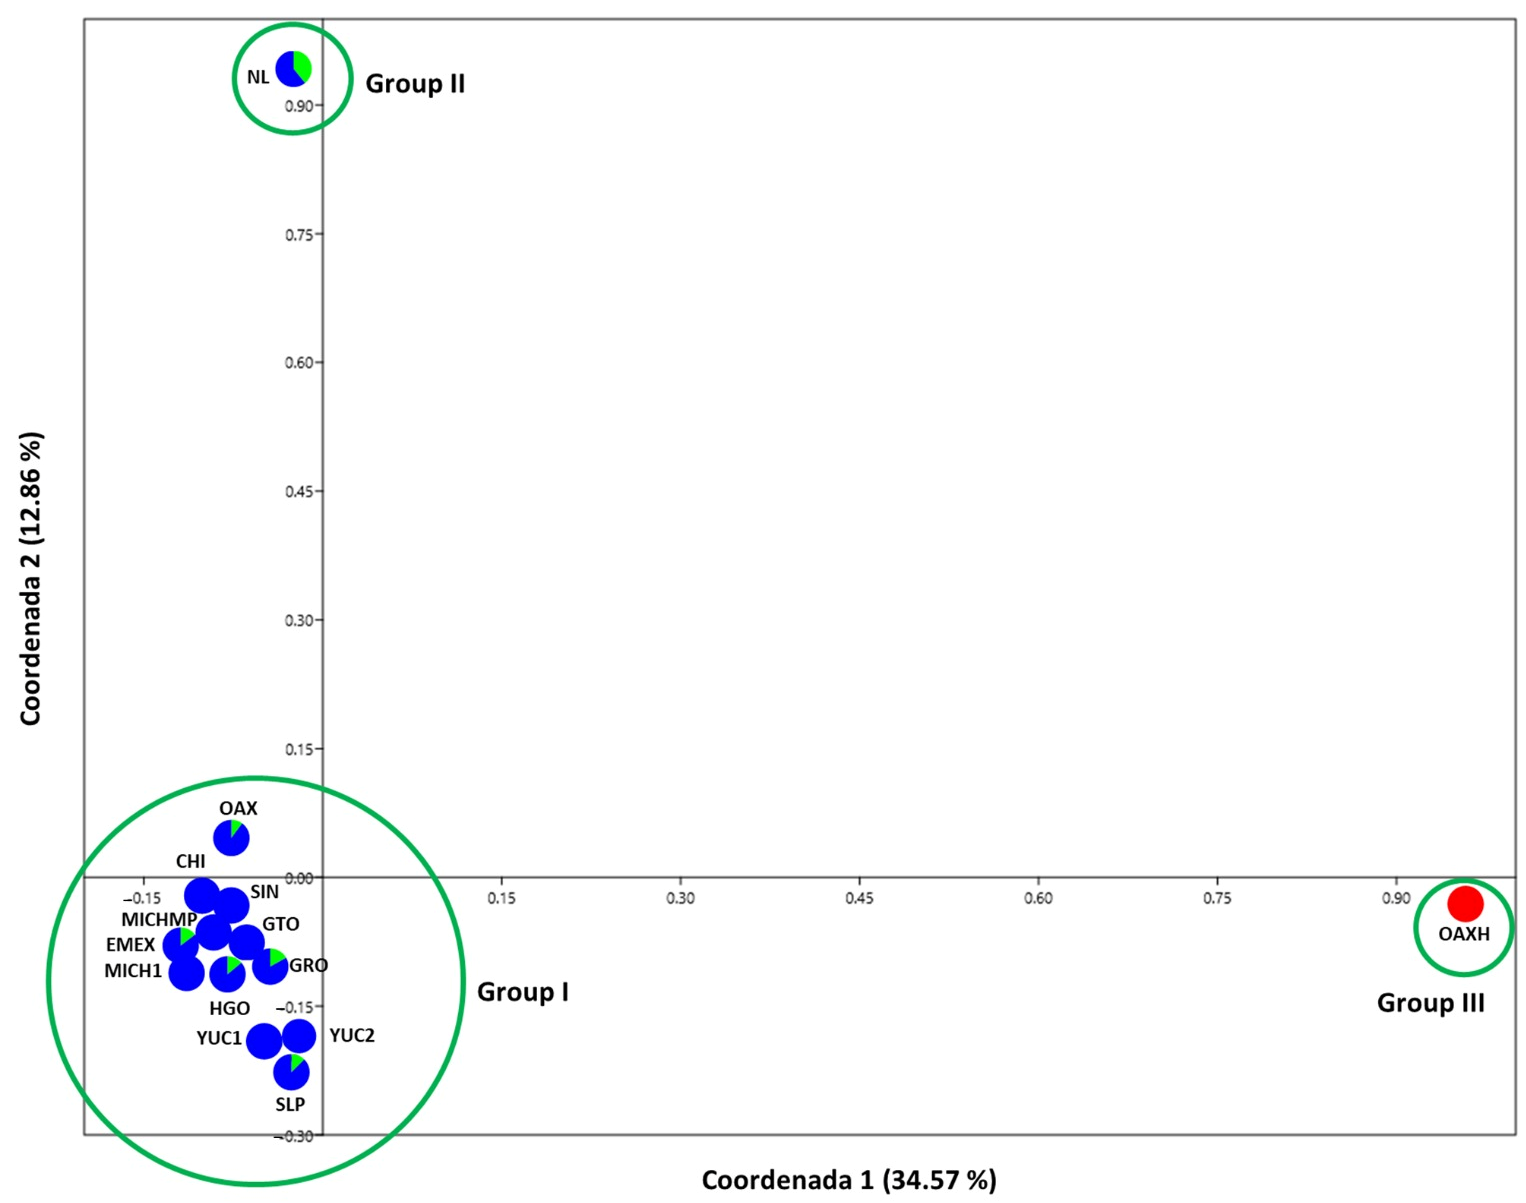
Principal coordinates analysis (PCoA) explained 47.43% of the total variation. The populations were distributed across three quadrants. The NL and OAX populations were located in quadrant II. In quadrant III, 11 populations were distributed into two subgroups. One subgroup consisted of YUC1, YUC2, and SLP, whereas the other one included HGO, GRO, GTO, MICHMP, MICH1, CHI, SIN, and EMEX. Finally, the OAXH population was located in quadrant IV (Figure 2).
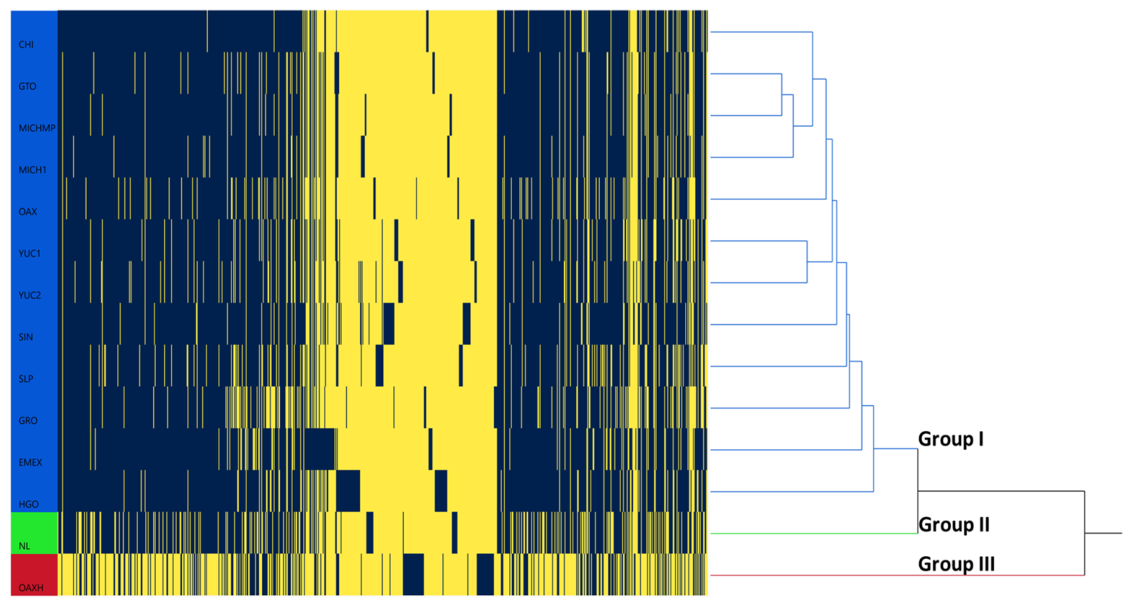
Cluster analysis using the Ward method identified three groups and confirmed PCoA analysis distribution. The first group included the CHI, GTO, MICHMP, MICH1, OAX, YUC1, YUC2, SIN, SLP, GRO, EMEX, and HGO populations. Group II consisted only of the NL population, while the OAXH population was grouped in Group III (Figure 3).

3.3. AMOVA and Genetic Structure

Molecular variance analysis identified that 57.17% of the genetic variation was attributable to differences within populations, while between populations it was 42.83% (Table 3).
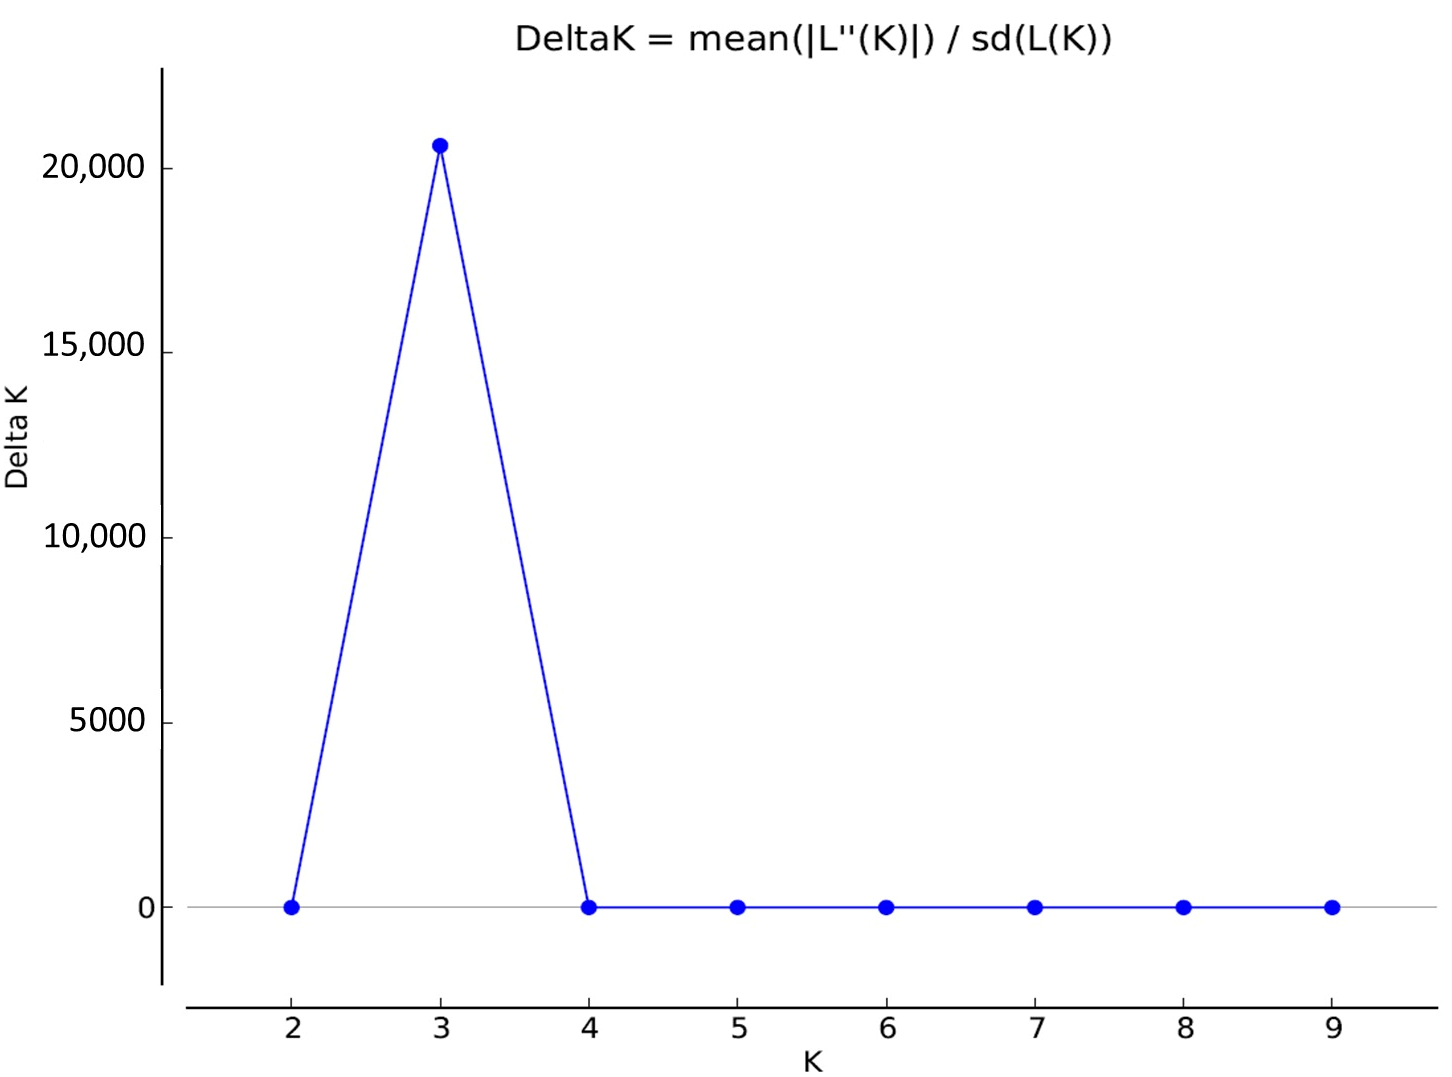
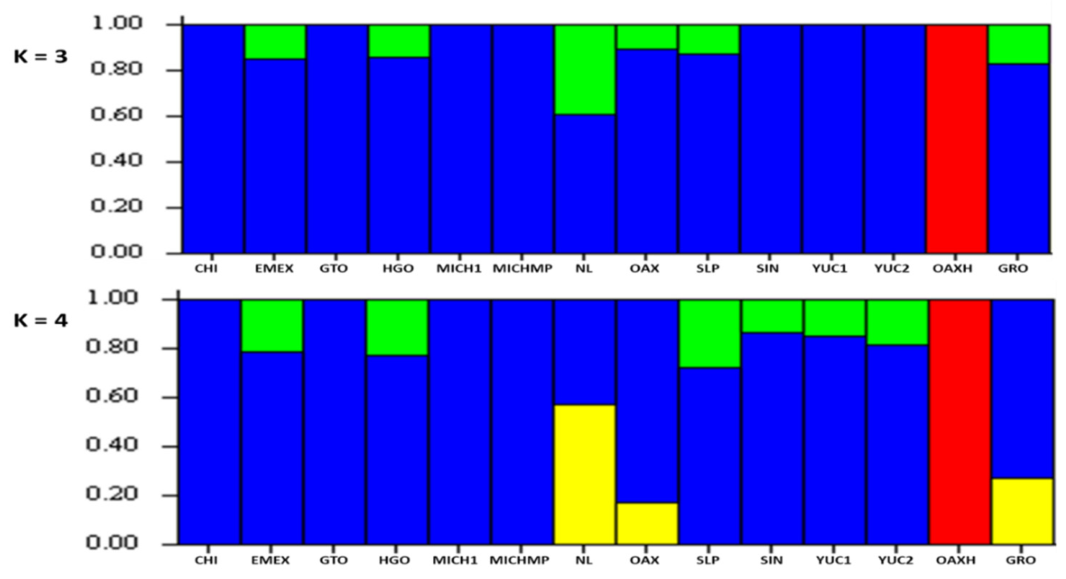
The Bayesian individual assignment analysis identified that the most likely number of original genetic groups was K = 3. In Figure 4, the highest value of the rate of change in the likelihood function with respect to K (Delta K) is observed, where K = 3 represents the highest value, followed by K = 4, which represents the subpopulations. Therefore, each population was assigned to one of the three original genetic groups. Figure 4 shows the Delta K values calculated according to [34] and analyzed using Structure Harvester.
With this analysis, each population was assigned to one of the three original genetic groups, revealing patterns of shared ancestry among the 14 moringa populations. Figure 5 shows the percentage of genetic contribution shared among the 14 moringa populations based on the values K = 3 and K = 4.
The STRUCTURE ancestry analysis revealed the proportion of shared ancestry among M. oleifera populations cultivated in Mexico. The CHI, GTO, MICH1, MICHMP, SIN, YUC1 and YUC2 populations exhibited ancestry coefficients of 1.0 and were therefore considered genetically homogeneous, showing complete assignment to genetic group III. In contrast, OAX, HGO, SLP, EMEX, and GRO showed ancestry coefficients higher than 0.80 for genetic group III, indicating shared ancestry with some degree of admixture. The NL population exhibited an ancestry coefficient of 0.61 for genetic group III, suggesting a more balanced ancestry pattern between genetic groups II and III. Finally, OAXH displayed a predominant ancestry component corresponding to genetic group I, indicating a genetically differentiated profile relative to other populations (Table 4).

4. Discussion

4.1. Genetic Diversity

The genetic diversity of moringa populations cultivated in Mexico was assessed at both the locus and population levels. At the locus level, loci identified in the 14 moringa populations showed an average He = 0.178. This value is consistent for dominant markers such as SilicoDArT for which the maximum value is 0.5 when both alleles occur at equal frequencies (p = q). However, although this value may appear low compared with codominant markers (e.g., SSR or SNP), the high number of loci detected and the broad genome representation generated through DArTseq platform partially compensate for its analytical resolution for genetic diversity studies [35] as previously reported in banana populations (Musa paradisiaca) [21] and macadamia (Macadamia integrifolia) [22].
Likewise, the average Ae value observed across loci (1.237) indicated that one allele was being predominant. For dominant markers, the theoretical maximum value of Ae is 2, whereas a value of 1 indicates absence of genetic variability at a given locus. Therefore, the observed Ae value suggests the presence of variation among restriction sites, which is also reflected by the Shannon index value (0.454).
On the other hand, at the population level, the genetic diversity estimators indicated moderate to high diversity values among populations, with HGO showing the lowest He value (0.42) and NL showing the highest gene diversity value (0.50). These values are comparable to those reported in 22 maize populations selected for adaptation in Mexico ([36], in press), where He ranged from 0.388 to 0.477, with an average of 0.418. In contrast, a considerably lower He value was reported in a study conducted on 80 macadamia cultivars (He = 0.16) using the same type of markers [22]. Differences in He values may be associated with their reproductive systems. Whereas moringa and maize are predominantly allogamous species [26,35], macadamia is considered mainly self-pollinating [37].
With respect to Ae values, the populations presented an average of 1.84, ranging from 1.72 (HGO) to 1.98 (NL). Since Ae estimates effective allelic diversity, the observed values indicate high genetic variability within the evaluated populations. The value close to the theoretical maximum observed in NL suggests a relatively balanced distribution of allelic frequencies. However, considering the type of marker, the use of composite samples and the limited number of evaluated genotypes (14), these results should be interpreted as an approximation of the existing genetic diversity and further analysis using a larger number of individuals or another marker system is required.
An average rareness value of 280.53 was identified among populations. This parameter reflects the specificity of the alleles present in each population and provides information on the occurrence of uncommon genetic variants within the evaluated germplasm. Populations with higher rareness values may contain distinctive genetic variation that is less widely distributed among the studied populations. Together with the levels of gene diversity detected, the observed rareness could contribute to the morphological and phenological variation previously reported in cultivated moringa materials from Mexico [10]. Therefore, future efforts focused on the conservation and utilization of moringa genetic resources cultivated in Mexico are required.

4.2. Genetic Relationships

PCoA revealed a lack of correspondence between cultivation sites and the genetic relationships of Mexican moringa populations. Most of the evaluated populations were grouped into a single group (11 populations), whereas the remaining three populations formed two independent groups. Within the predominant cluster, populations from Yucatan (YUC1 and YUC2) were closely associated with the population from San Luis Potosi (SLP), indicating genetic similarity despite the considerable geographic distance between these regions, with Yucatán and San Luis Potosi being located in southeastern and central Mexico, respectively.
PCoA also revealed that the populations collected in the state of Oaxaca (OAX and OAXH) were grouped into different clusters, indicating contrasting genetic compositions. Furthermore, one of the Oaxaca populations (OAXH) and the NL population were located in distinct groups, far from main cluster cultivated populations (Figure 2).
This pattern may reflect independent introduction events and human-mediated germplasm exchange among cultivation regions in Mexico. Similar observations were reported by [38] among 164 moringa genotypes introduced in the coastal and oriental region of Kenia evaluated with SNP and SilicoDArt markers.
In the case of moringa, its distribution has been largely anthropogenic, influenced by its growing food, medicinal, and economic importance. In Mexico, a large number of reintroductions of different moringa genetic materials from other countries have been observed in recent years. This dynamic has influenced the movement of similar materials between different geographic locations; as a consequence, materials sharing a similar genetic background clustered in proximity, as previously reported by other authors in several horticultural [39] and ornamental species [40].

4.3. AMOVA and Genetic Structure

Genetic variation was distributed mainly within populations (57.17%) rather than among populations (42.83%), as revealed by the AMOVA analysis (Table 3). In turn, the genetic structure analysis identified three genetic groups and four subpopulations. Genetic structure may provide insights into the historical relationships among populations regardless of their cultivation sites.
Seven populations (CHI, GTO, MICH1, MICHMP, OAX, YUC1, and YUC2) exhibited a shared genetic pattern and tended to be genetically homogeneous despite their broad geographic separation, suggesting that these materials may represent reintroductions from a common germplasm source. Similarly, six populations (OAX, SLP, EMEX, HGO, GRO, and NL) exhibited an admixed ancestry composed of two distinct genetic patterns. One of these patterns was predominant and corresponded to the genetic background underlying the seven populations previously mentioned. In this case, only the NL population exhibited a more balanced ancestry composition between both genetic patterns.
The genetic composition observed in the NL population may indicate a broader germplasm origin or greater gene flow associated with seed movement among cultivation regions. Recurrent seed exchange occurring across multiple directions may promote complex diversity patterns. Similar dynamics have been reported in Four Corners potato (Solanum jamesii), where genetic diversity was favored by extensive seed movement and human-mediated dispersal [41].
The OAXH population predominantly exhibited a single ancestry composition and a unique genetic profile distinct from the other two genetic patterns identified, suggesting a possible founding effect in this population. This pattern may have resulted from the introduction of a limited number of seeds or from a single introduction event. In isolated populations, mutations may accumulate gradually over time, increasing both genetic and phenotypic divergence. Several studies have addressed the impact of founder effects in plants. In China, ref. [42] reported that the founder effect in Geranium carolinianum was mitigated through multiple reintroductions from different germplasm sources, which promoted gene flow during population expansion.

Research Limitations

This research aimed to determine the degree of genetic diversity and structure in commercial populations of M. oleifera cultivated in Mexico. This diversity represents the genetic pool of this multipurpose species introduced into the country on multiple occasions. Populations with higher levels of genetic diversity will allow the identification and selection of individuals with better field performance.
The lack of knowledge about the total number of moringa populations present in Mexico limits the understanding of the overall diversity. There are regions where the species occurs in wild conditions, while in others it is present as cultivated plants, living fences, or backyard crops. In this study, we focused on commercial populations in order to comprehensively characterize these materials.
Therefore, diversity estimates derived from dominant markers utilized should be interpreted with caution because the genetic nature of these markers limits the inference of parameters dependent on allelic frequency assumptions. Nevertheless, dominant markers remain valuable tools for exploratory analyses of genetic diversity and germplasm relationships.

5. Conclusions

SilicoDArT markers allowed the identification of genetic diversity and structure in moringa populations cultivated in Mexico. The populations exhibited high genetic diversity despite not being native to the country. The dominant markers used were informative and represent a useful tool for studies focused on the genetic characterization of introduced germplasm. The gene diversity identified in this study provides a framework for future research related to the conservation and utilization of moringa germplasm in Mexico.

Author Contributions

R.R.-H.: Conceptualization, methodology, writing—original draft preparation, formal analysis. M.H.-R.: Methodology, investigation, software, validation, formal analysis. A.P.-V.: Conceptualization, methodology, investigation, validation. E.d.J.R.-R.: Conceptualization, methodology, writing—original draft preparation. G.L.-R.: Conceptualization, methodology. J.R.B.-A.: methodology, validation. M.A.H.-C.: methodology, validation. O.S.-V.: Conceptualization, writing—review and editing. All authors have read and agreed to the published version of the manuscript.

Funding

This research received no external funding.

Data Availability Statement

The original contributions presented in this study are included in the article. Further inquiries can be directed to the corresponding author.

Acknowledgments

The authors thank Colegio de Postgraduados, Campus Montecillo.

Conflicts of Interest

The authors declare no conflicts of interest.

References

  1. Ojeda-López, J.; Marczuk-Rojas, J.P.; Polushkina, O.A.; Purucker, D.; Salinas, M.; Carretero-Paulet, L. Evolutionary Analysis of the Moringa oleifera Genome Reveals a Recent Burst of Plastid to Nucleus Gene Duplications. Sci. Rep. 2020, 10, 17646. [Google Scholar] [CrossRef]
  2. Brunetti, C.; Loreto, F.; Ferrini, F.; Gori, A.; Guidi, L.; Remorini, D.; Centritto, M.; Fini, A.; Tattini, M. Metabolic Plasticity in the Hygrophyte Moringa oleifera Exposed to Water Stress. Tree Physiol. 2018, 38, 1640–1654. [Google Scholar] [CrossRef]
  3. Peñalver, R.; Martínez-Zamora, L.; Lorenzo, J.M.; Ros, G.; Nieto, G. Nutritional and Antioxidant Properties of Moringa oleifera Leaves in Functional Foods. Foods 2022, 11, 1107. [Google Scholar] [CrossRef] [PubMed]
  4. Tamilselvi, N.A.; Arumugam, T. Health Benefits, Therapeutic and Pharmacological Properties of Moringa—A Review. J. Pharm. Res. Int. 2018, 25, 1–11. [Google Scholar] [CrossRef]
  5. Vanzo, E.; Jud, W.; Li, Z.; Albert, A.; Domagalska, M.A.; Ghirardo, A.; Niederbacher, B.; Frenzel, J.; Beemster, G.T.S.; Asard, H.; et al. Facing the Future: Effects of Short-Term Climate Extremes on Isoprene-Emitting and Nonemitting Poplar. Plant Physiol. 2015, 169, 560–575. [Google Scholar] [CrossRef]
  6. Abdelwanis, F.M.; Abdelaty, H.S.; Saleh, S.A. Exploring the Multifaceted Uses of Moringa oleifera: Nutritional, Industrial and Agricultural Innovations in Egypt. Discov. Food 2024, 4, 146. [Google Scholar] [CrossRef]
  7. Kleden, M.M.; Soetanto, H.; Kusmartono, K.; Kuswanto, K. Genetic Diversity Evaluation of Moringa oleifera, Lam from East Flores Regency Using Marker Random Amplified Polymorphic DNA (RAPD) and Its Relationship to Chemical Composition and In Vitro Gas Production. AGRIVITA J. Agric. Sci. 2017, 39, 219–231. [Google Scholar] [CrossRef][Green Version]
  8. Olson, M.E.O.; Fahey, J.W. Moringa oleifera: Un árbol multiusos para las zonas tropicales seca. Rev. Mex. Biodivers. 2011, 82, 1071–1082. [Google Scholar] [CrossRef]
  9. SIAP. Anuario Estadístico de La Producción Agrícola: Moringa oleifera 2024; SIAP: Ciudad de Mexico, Mexico, 2024. [Google Scholar]
  10. Ruiz Hernández, R.; Pérez Vázquez, A.; García Pérez, E.; Landeros Sánchez, C.; Morales Trejo, F.; Soto Hernández, R.M. Caracterización morfológica de accesiones de Moringa oleifera provenientes del sur-sureste de México. Rev. Mex. Cienc. Agrícolas 2021, 12, 1209–1222. [Google Scholar] [CrossRef]
  11. Meena, B.; Singh, N.; Mahar, K.S.; Sharma, Y.K.; Rana, T.S. Molecular Analysis of Genetic Diversity and Population Genetic Structure in Ephedra foliata: An Endemic and Threatened Plant Species of Arid and Semi-Arid Regions of India. Physiol. Mol. Biol. Plants 2019, 25, 753–764. [Google Scholar] [CrossRef] [PubMed]
  12. Petroli, C.D.; Sansaloni, C.P.; Carling, J.; Steane, D.A.; Vaillancourt, R.E.; Myburg, A.A.; da Silva, O.B., Jr.; Pappas, G.J., Jr.; Kilian, A.; Grattapaglia, D. Genomic Characterization of DArT Markers Based on High-Density Linkage Analysis and Physical Mapping to the Eucalyptus Genome. PLoS ONE 2012, 7, e44684. [Google Scholar] [CrossRef]
  13. Barilli, E.; Cobos, M.J.; Carrillo, E.; Kilian, A.; Carling, J.; Rubiales, D. A High-Density Integrated DArTseq SNP-Based Genetic Map of Pisum fulvum and Identification of QTLs Controlling Rust Resistance. Front. Plant Sci. 2018, 9, 167. [Google Scholar] [CrossRef]
  14. Risterucci, A.-M.; Hippolyte, I.; Perrier, X.; Xia, L.; Caig, V.; Evers, M.; Huttner, E.; Kilian, A.; Glaszmann, J.-C. Development and Assessment of Diversity Arrays Technology for High-Throughput DNA Analyses in Musa. Theor. Appl. Genet. 2009, 119, 1093–1103. [Google Scholar] [CrossRef] [PubMed]
  15. Gao, Q.; Yue, G.; Li, W.; Wang, J.; Xu, J.; Yin, Y. Recent Progress Using High-Throughput Sequencing Technologies in Plant Molecular Breeding. J. Integr. Plant Biol. 2012, 54, 215–227. [Google Scholar] [CrossRef]
  16. Wang, Y.; Lu, J.; Chen, S.; Shu, L.; Palmer, R.G.; Xing, G.; Li, Y.; Yang, S.; Yu, D.; Zhao, T.; et al. Exploration of Presence/Absence Variation and Corresponding Polymorphic Markers in Soybean Genome. J. Integr. Plant Biol. 2014, 56, 1009–1019. [Google Scholar] [CrossRef]
  17. Marroni, F.; Pinosio, S.; Morgante, M. Structural Variation and Genome Complexity: Is Dispensable Really Dispensable? Curr. Opin. Plant Biol. 2014, 18, 31–36. [Google Scholar] [CrossRef]
  18. Morgante, M.; Brunner, S.; Pea, G.; Fengler, K.; Zuccolo, A.; Rafalski, A. Gene Duplication and Exon Shuffling by Helitron-like Transposons Generate Intraspecies Diversity in Maize. Nat. Genet. 2005, 37, 997–1002. [Google Scholar] [CrossRef] [PubMed]
  19. Shen, X.; Liu, Z.-Q.; Mocoeur, A.; Xia, Y.; Jing, H.-C. PAV Markers in Sorghum bicolour: Genome Pattern, Affected Genes and Pathways, and Genetic Linkage Map Construction. Theor. Appl. Genet. 2015, 128, 623–637. [Google Scholar] [CrossRef]
  20. Amorim, E.P.; Vilarinhos, A.D.; Cohen, K.O.; Amorim, V.B.O.; dos Santos-Serejo, J.A.; e Silva, S.O.; Pestana, K.N.; dos Santos, V.J.; Paes, N.S.; Monte, D.C.; et al. Genetic Diversity of Carotenoid-Rich Bananas Evaluated by Diversity Arrays Technology (DArT). Genet. Mol. Biol. 2009, 32, 96–103. [Google Scholar] [CrossRef]
  21. Alam, M.; Neal, J.; O’Connor, K.; Kilian, A.; Topp, B. Ultra-High-Throughput DArTseq-Based silicoDArT and SNP Markers for Genomic Studies in Macadamia. PLoS ONE 2018, 13, e0203465. [Google Scholar] [CrossRef] [PubMed]
  22. Tomkowiak, A.; Bocianowski, J.; Spychała, J.; Grynia, J.; Sobiech, A.; Kowalczewski, P.Ł. DArTseq-Based High-Throughput SilicoDArT and SNP Markers Applied for Association Mapping of Genes Related to Maize Morphology. Int. J. Mol. Sci. 2021, 22, 5840. [Google Scholar] [CrossRef]
  23. Adu, B.G.; Akromah, R.; Amoah, S.; Nyadanu, D.; Yeboah, A.; Aboagye, L.M.; Amoah, R.A.; Owusu, E.G. High-Density DArT-Based SilicoDArT and SNP Markers for Genetic Diversity and Population Structure Studies in Cassava (Manihot esculenta Crantz). PLoS ONE 2021, 16, e0255290. [Google Scholar] [CrossRef]
  24. Abu Zaitoun, S.Y.; Jamous, R.M.; Shtaya, M.J.; Mallah, O.B.; Eid, I.S.; Ali-Shtayeh, M.S. Characterizing Palestinian Snake Melon (Cucumis melo Var. flexuosus) Germplasm Diversity and Structure Using SNP and DArTseq Markers. BMC Plant Biol. 2018, 18, 246. [Google Scholar] [CrossRef]
  25. Ruiz-Hernández, R.; Vazquez, A.P.; Hernández-Rodríguez, M.; García-Pérez, E.; Morales-Trejo, F.; Soto-Hernández, R.M. Genetic Diversity of Moringa oleifera Lam. in Southeastern Mexico. Agrociencia 2024, 1–17. [Google Scholar] [CrossRef]
  26. Muluvi, G.M.; Sprent, J.I.; Odee, D.; Powell, W. Estimates of Outcrossing Rates in Moringa oleifera Using Amplified Fragment Length Polymorphism (AFLP). Afr. J. Biotechnol. 2004, 3, 145–151. [Google Scholar] [CrossRef]
  27. Hassanein, A.; Al-Soqeer, A. Morphological and Genetic Diversity of Moringa oleifera and Moringa peregrina Genotypes. Hortic. Environ. Biotechnol. 2018, 59, 251–261. [Google Scholar] [CrossRef]
  28. CIMMYT. Protocolos de Laboratorio: Laboratorio de Genética Molecular Aplicada Del CIMMYT, 3rd ed.; CIMMYT: Texcoco, Mexico, 2006. [Google Scholar]
  29. Sansaloni, C.; Petroli, C.; Jaccoud, D.; Carling, J.; Detering, F.; Grattapaglia, D.; Kilian, A. Diversity Arrays Technology (DArT) and next-Generation Sequencing Combined: Genome-Wide, High Throughput, Highly Informative Genotyping for Molecular Breeding of Eucalyptus. BMC Proc. 2011, 5, P54. [Google Scholar] [CrossRef]
  30. Pacheco-Gil, R.Á.; Alvarado, G.; Rodríguez, F.; Burgueño, J. BIO-R (Biodiversity Analysis with R for Windows) Version 3.3. CIMMYT Research Data & Software Repository Network 2016, V14. Available online: https://data.moa.gov.et/dataset/hdl-11529-10820 (accessed on 28 April 2026).
  31. Pritchard, J.K.; Stephens, M.; Donnelly, P. Inference of Population Structure Using Multilocus Genotype Data. Genetics 2000, 155, 945–959. [Google Scholar] [CrossRef] [PubMed]
  32. Earl, D.A.; vonHoldt, B.M. Structure harvester: A Website and Program for Visualizing STRUCTURE Output and Implementing the Evanno Method. Conserv. Genet. Resour. 2012, 4, 359–361. [Google Scholar] [CrossRef]
  33. Botstein, D.; White, R.L.; Skolnick, M.; Davis, R.W. Construction of a Genetic Linkage Map in Man Using Restriction Fragment Length Polymorphisms. Am. J. Hum. Genet. 1980, 32, 314–331. [Google Scholar]
  34. Evanno, G.; Regnaut, S.; Goudet, J. Detecting the Number of Clusters of Individuals Using the Software Structure: A Simulation Study. Mol. Ecol. 2005, 14, 2611–2620. [Google Scholar] [CrossRef]
  35. Nannas, N.J.; Dawe, R.K. Genetic and Genomic Toolbox of Zea mays. Genetics 2015, 199, 655–669. [Google Scholar] [CrossRef] [PubMed]
  36. Reyes-Correa, A.P.; Hernández-Rodríguez, M.; García-Zavala, J.J.; Benítez-Riquelme, I.; Trejo-Pastor, V.; Lobato-Ortiz, R.; López-Martínez, M.I. Diversidad de Poblaciones de Maíz Adaptadas a Valles Altos de México Analizadas Mediante Marcadores silicoDArT. Rev. Fitotec. Mex. 2026, 49. [Google Scholar]
  37. Blanche, K.R.; Ludwig, J.A.; Cunningham, S.A. Proximity to Rainforest Enhances Pollination and Fruit Set in Orchards. J. Appl. Ecol. 2006, 43, 1182–1187. [Google Scholar] [CrossRef]
  38. Ondieki, S.K.; Hunja, C.W.; Muluvi, G.M.; Korir, J.C.; Mutiso, F.; Kitheka, J.U.; Kioko, D.; Kimatu, J.; Ndufa, J.K.; Mutati, K. Genetic Diversity of Selected Moringa oleifera Lam. Provenances from the Coastal Region of Kenya. Magna Sci. Adv. Res. Rev. 2023, 8, 118–128. [Google Scholar] [CrossRef]
  39. Hu, Y.; Hu, Q.; Ma, X.; Zhang, X.; Zheng, J. Population Genetics and Origin of Horticultural Germplasm in Clematis via Genotyping-by-Sequencing. Hortic. Res. 2025, 12, uhae336. [Google Scholar] [CrossRef]
  40. Giuberti, G.; Rocchetti, G.; Montesano, D.; Lucini, L. The Potential of Moringa oleifera in Food Formulation: A Promising Source of Functional Compounds with Health-Promoting Properties. Curr. Opin. Food Sci. 2021, 42, 257–269. [Google Scholar] [CrossRef]
  41. Pavlik, B.M.; del Rio, A.; Bamberg, J.; Louderback, L.A. Evidence for Human-Caused Founder Effect in Populations of Solanum Jamesii at Archaeological Sites: II. Genetic Sequencing Establishes Ancient Transport across the Southwest USA. Am. J. Bot. 2024, 111, e16365. [Google Scholar] [CrossRef]
  42. Shirk, R.Y.; Hamrick, J.L.; Zhang, C.; Qiang, S. Patterns of Genetic Diversity Reveal Multiple Introductions and Recurrent Founder Effects during Range Expansion in Invasive Populations of Geranium carolinianum (Geraniaceae). Heredity 2014, 112, 497–507. [Google Scholar] [CrossRef]
Figure 1. Geographical location of M. oleifera populations cultivated in Mexico. CHI: Chiapas; EMEX: Estado de Mexico; GTO: Guanajuato; HGO: Hidalgo; MICH1: Michoacán; MICHMP: Michoacán; NL: Nuevo León; OAX: Oaxaca; SLP: San Luis Potosí; SIN: Sinaloa; YUC1: Yucatán; YUC2: Yucatán; OAXH: Oaxaca; GRO: Guerrero.
Horticulturae 12 00729 g001
Figure 2. Principal coordinates analysis based on 14 M. oleifera populations analyzed using SilicoDArT markers. Colors indicate the proportion shared among the original genetic groups (I: red, II: green, and III: blue) obtained from the STRUCTURE program. CHI: Chiapas; EMEX: Estado de Mexico; GTO: Guanajuato; HGO: Hidalgo; MICH1: Michoacán; MICHMP: Michoacán; NL: Nuevo León; OAX: Oaxaca; SLP: San Luis Potosí; SIN: Sinaloa; YUC1: Yucatán; YUC2: Yucatán; OAXH: Oaxaca; GRO: Guerrero.
Horticulturae 12 00729 g002
Figure 3. Dendrogram of M. oleifera populations cultivated in Mexico based on SilicoDArT markers. The dendrogram includes a heat map composed of presence/absence markers. Yellow color: Absence of the sequence; dark blue: presence of the sequence. CHI: Chiapas; EMEX: Estado de México; GTO: Guanajuato; HGO: Hidalgo; MICH1: Michoacán; MICHMP: Michoacán; NL: Nuevo León; OAX: Oaxaca; SLP: San Luis Potosí; SIN: Sinaloa; YUC1: Yucatán; YUC2: Yucatán; OAXH: Oaxaca; GRO: Guerrero.
Horticulturae 12 00729 g003
Figure 4. Delta K values obtained from the STRUCTURE analysis of M. oleifera populations cultivated in Mexico and evaluated using SilicoDArT markers.
Horticulturae 12 00729 g004
Figure 5. Genetic structure of the populations inferred using STRUCTURE of the 14 M. oleifera populations cultivated in Mexico evaluated with 8652 SilicoDArT markers. The graph shows the distribution of three original populations (K = 3) and four subpopulations (K = 4). The numbers on the axis indicate the ancestry coefficient of the populations. CHI: Chiapas; EMEX: Estado de México; GTO: Guanajuato; HGO: Hidalgo; MICH1: Michoacán; MICHMP: Michoacán; NL: Nuevo León; OAX: Oaxaca; SLP: San Luis Potosí; SIN: Sinaloa; YUC1: Yucatán; YUC2: Yucatán; OAXH: Oaxaca; GRO: Guerrero.
Horticulturae 12 00729 g005
Table 1. Summary of genetic diversity statistics for 14 M. oleifera populations using SilicoDArT markers.
ParameterValueStandard Deviation
% Polymorphic loci1.000
He0.1780.001
Number of effective alleles1.2370.002
Shannon diversity index0.4540.002
Table 2. Genetic diversity in M. oleifera populations cultivated in Mexico using SilicoDArT markers.
PopulationHeAeRareness
CHI0.441.78174.75
EMEX0.451.81259.98
GTO0.461.84152.83
HGO0.421.72282.84
MICH10.451.83159.87
MICHMP0.451.82133.30
NL0.501.98406.75
OAX0.481.91202.66
SLP0.481.91242.45
SIN0.431.76217.40
YUC10.461.86183.46
YUC20.471.87193.83
OAXH0.431.761074.57
GRO0.481.94242.74
Average0.461.84280.53
He: Expected gene diversity; Ae: number of effective alleles. CHI: Chiapas; EMEX: Estado de Mexico; GTO: Guanajuato; HGO: Hidalgo; MICH1: Michoacán; MICHMP: Michoacán; NL: Nuevo León; OAX: Oaxaca; SLP: San Luis Potosí; SIN: Sinaloa; YUC1: Yucatán; YUC2: Yucatán; OAXH: Oaxaca; GRO: Guerrero.
Table 3. The analysis of molecular variance (AMOVA) of Moringa oleifera populations using SilicoDArT markers.
SourceDFSSPercVarPhi
Between Groups10.4342.830.43
Within Groups120.8257.17
Total131.24100
DF: Degrees of freedom; SS: sum of squares; PercVar: percentage of variation.
Table 4. Ancestry proportion of the 14 M. oleifera Lam. populations characterized using SilicoDArT markers.
No.PopulationGenetic Group
IIIIII
1CHI0.000.001.00
2EMEX0.000.150.85
3GTO0.000.001.00
4HGO0.000.140.86
5MICH10.000.001.00
6MICHMP0.000.001.00
7NL0.000.390.61
8OAX0.000.100.90
9SLP0.000.130.88
10SIN0.000.001.00
11YUC10.000.001.00
12YUC20.000.001.00
13OAXH1.000.000.00
14GRO0.000.170.83
CHI: Chiapas; EMEX: Estado de Mexico; GTO: Guanajuato; HGO: Hidalgo; MICH1: Michoacán; MICHMP: Michoacán; NL: Nuevo León; OAX: Oaxaca; SLP: San Luis Potosí; SIN: Sinaloa; YUC1: Yucatán; YUC2: Yucatán; OAXH: Oaxaca; GRO: Guerrero.
Disclaimer/Publisher’s Note: The statements, opinions and data contained in all publications are solely those of the individual author(s) and contributor(s) and not of MDPI and/or the editor(s). MDPI and/or the editor(s) disclaim responsibility for any injury to people or property resulting from any ideas, methods, instructions or products referred to in the content.