Article

Ecological and Transcriptomic Insights into Lonicera caerulea Distribution Pattern and the Role of Its SWEET Gene Family


1
College of Forestry, Beijing Forestry University, Beijing 100083, China
2
State Key Laboratory of Plant Diversity and Specialty Crops, Institute of Botany, Chinese Academy of Sciences, Beijing 100093, China
3
College of Agriculture & Biotechnology, Zhejiang University, Hangzhou 310058, China
4
Beijing Institute of Nutritional Resources Co., Ltd., Beijing 100069, China
5
Institute of Forestry and Pomology, Beijing Academy of Agriculture and Forestry Sciences, Beijing 100093, China
*
Author to whom correspondence should be addressed.
These authors contributed equally to this work.
Horticulturae 2026, 12(6), 685; https://doi.org/10.3390/horticulturae12060685
Submission received: 6 April 2026 / Revised: 28 May 2026 / Accepted: 29 May 2026 / Published: 1 June 2026
(This article belongs to the Section Genetics, Genomics, Breeding, and Biotechnology (G2B2))

Abstract

Rapid climate shifts in high-latitude regions profoundly impact the geographical distribution boundaries and molecular adaptive strategies of cold-tolerant plants. Lonicera caerulea, known for its excellent cold tolerance, provides an ideal model for exploring the molecular mechanisms of climate adaptation and trait formation. To elucidate the ecological and molecular mechanisms of climate adaptation in L. caerulea, we integrated species distribution modeling with multi-tissue transcriptome profiling. Distribution modeling identified temperature and precipitation as primary constraints on its current range, with projections suggesting a significant poleward expansion under future warming scenarios. At the molecular level, we identified 19 LcSWEET genes exhibiting functional differentiation. Rather than listing specific candidates, our findings highlight that certain LcSWEET members are transcriptionally activated during fruit maturation, while others are significantly upregulated in response to cold stress, underscoring their dual roles in plant reproduction and ecological adaptation. This study revealed that the LcSWEET gene family exhibits functional diversification in tissue-specific expression and low-temperature stress response. It provides molecular candidates that may inform future studies on plant adaptive response under climate change and lays a theoretical foundation for germplasm conservation and high-quality breeding of L. caerulea.

1. Introduction

The rapid reshaping of plant geographical distribution patterns highlights the critical need to understand cold adaptation and species distribution dynamics, particularly in high-latitude regions [1,2]. These climatic changes directly impact plant distribution boundaries, population dynamics, and interspecies interactions, potentially leading to biodiversity loss and the scarcity of genetic resources [1,3]. Understanding how plants respond to these transitions is therefore essential for predicting future distribution patterns and conserving adaptive germplasm. Lonicera caerulea, a temperate to subarctic berry plant native to the Northern Hemisphere, is renowned for its strong ecological adaptability and exceptional cold tolerance [4,5], providing an ideal model for investigating the mechanisms underlying climate adaptation. A key adaptive trait of L. caerulea is its short dormancy period, which enables rapid growth initiation upon brief warming. However, this opportunistic strategy can be hazardous if followed by sudden extreme cold snaps, necessitating robust downstream frost-tolerance mechanisms to mitigate deacclimation injury. Under global warming scenarios characterized by volatile temperature fluctuations, this physiological plasticity confers a distinct competitive advantage, allowing L. caerulea to readily colonize previously unsuitable colder regions at higher latitudes or altitudes where its cold tolerance exceeds that of potential competitors. Yet, despite this pronounced adaptability, the specific environmental factors constraining its growth and the precise molecular mechanisms underlying its responses remain poorly understood. Elucidating these factors is critical for predicting future distribution dynamics and understanding adaptive responses.
To understand these adaptive responses at the molecular level, investigating primary carbon allocation is essential. Sugars act as primary energy carriers and signaling molecules that precisely regulate plant growth, development, and stress responses [6,7,8]. Carbohydrate transporters serve as crucial executors in this process, facilitating efficient long-distance translocation from source to sink organs. Among these, the SWEET (Sugars Will Eventually be Exported Transporters) family has attracted significant attention due to its distinctive transport mechanism, mediating sugar flux across cellular membranes via concentration gradients across typically seven transmembrane domains [9,10]. Phylogenetically, SWEETs are categorized into four clades (I, II, III, and IV), with distinct substrate preferences. These transporters are vital for basal development, as their disruptions severely inhibit normal plant growth across multiple species [11,12,13]. Furthermore, accumulating evidence demonstrates that specific SWEET genes also play crucial roles in cold stress responses and freezing tolerance [14,15]. Despite these advances, a critical scientific gap remains: the systematic identification and functional differentiation of the SWEET gene family in the cold-adapted species L. caerulea have never been characterized. Specifically, how these genes coordinate the allocation of carbohydrates to balance fruit maturation with localized cold acclimation under shifting climatic boundaries is completely unknown.
To bridge this macro-to-micro conceptual gap, an integrated research approach holds significant theoretical and applied value [16]. While macro-scale ecological models predict where and why distributions may shift, they cannot reveal the underlying molecular mechanisms; conversely, transcriptomics identifies stress-responsive genes but cannot predict how these molecular shifts translate into geographical outcomes. Integrating both approaches allows us to establish a robust link between macro-scale ecological patterns and micro-scale molecular mechanisms, providing a comprehensive understanding of adaptive responses. Therefore, this study combines MaxEnt modeling with multi-tissue transcriptome sequencing to comprehensively investigate LcSWEET expression patterns, clarifying their precise roles in cold stress response and fruit sugar accumulation, and exploring how these molecular traits might theoretically underpin the species’ broader geographical range.

2. Materials and Methods

2.1. Data Sources for Wild Distribution in Eurasia

Occurrence data for L. caerulea were downloaded from the Global Biodiversity Information Facility (GBIF [17]). We used the clean_coordinates function to screen the data, removing duplicate and unsuitable records. To minimize spatial autocorrelation and sampling bias, we utilized ENMTools v1.1.5 [18] to ensure that only one distribution record was retained per grid cell. Initially, 1669 occurrence records were collected; after filtering, 1326 valid and representative points were selected for modeling.

2.2. Environmental Variable Acquisition and Selection

Nineteen bioclimatic variables and two topographic variables were selected as potential environmental drivers (Supplementary Table S1) at a spatial resolution of 2.5 arc-minutes. Bioclimatic variables were obtained from the WorldClim database (http://worldclim.org), and topographic variables from the ENVIREM database (https://envirem.github.io/#downloads, accessed on 2 January 2026) across four distinct periods: the Last Glacial Maximum (LGM), Mid-Holocene, current (1970–2000), and future (2050s–2070s). Future projections utilized the BCC-CSM2-MR climate model under two Shared Socioeconomic Pathways (SSPs): SSP 1–2.6 and SSP 5–8.5 [19,20,21]. To optimize variable selection and mitigate multicollinearity, all 21 variables were first evaluated in a preliminary MaxEnt run [22], from which the top 8 variables with the highest contribution rates were retained. Subsequently, Pearson correlation coefficients (|r|) were calculated using ENMTools v1.1.5; for highly correlated pairs (|r| > 0.8), the variable with lower contribution or lower biological relevance was excluded (Supplementary Figure S1). This sequential filtering yielded five core predictors for final model construction: Annual Mean Temperature (Bio1), Mean Diurnal Range (Bio2), Precipitation of Driest Month (Bio14), Precipitation of Warmest Quarter (Bio18), and SAGA-GIS Topographic Wetness Index (TWI). To verify the robustness of this selection protocol against the sequence of collinearity treatment, a sensitivity analysis was performed by reversing the order: highly correlated variables (|r| > 0.8) were pre-filtered from the full 21-variable pool prior to any MaxEnt runs, retaining only one representative variable per cluster. This pre-filtered model yielded a highly comparable average test AUC of 0.866 (±0.007 SD) versus 0.870 (±0.007 SD) in the primary model, with no statistically significant differences in spatial projections under current or future scenarios.

2.3. Model Establishment

Potential suitable habitats were predicted using MaxEnt v3.4.3, calibrating the background extent across the entire Eurasian continent to align with the core native range of L. caerulea. Occurrence records were randomly partitioned into 70% for model training and 30% for testing, with the maximum number of iterations set to 5000. Default auto-features and a regularization multiplier of 1.0 were applied to optimize response function complexity for large datasets (n > 1000) [23,24,25]. To ensure projection stability, 10 replicate subsample runs were executed, and the outputs were averaged. Model performance was evaluated using threshold-independent Receiver Operating Characteristic (ROC) curves and Area Under the Curve (AUC) analysis [21,26].

2.4. Suitable Habitat Binarization and Evaluation

The maximized sensitivity and specificity threshold (MaxSSS) was used to delineate the presence–absence boundary for the species distribution model (SDM) [27]. Based on the MaxSSS threshold, the predicted results for the current, paleoclimate, and future periods were binarized into “presence–absence” maps. “Presence” indicates a higher probability of climatic suitability for the species within a specific grid cell, while “absence” signifies that the grid cell represents a lower likelihood of satisfying these environmental requirements.

2.5. L. caerulea Cultivation and Transcriptome Sequencing

Three-year-old L. caerulea plants grown under uniform field conditions were used for tissue collection. Roots, stems, leaves, immature fruits, and mature fruits were collected in three biological replicates. Total RNA was extracted using the Eastep® Super Plant RNA Kit (Promega, Beijing, China). RNA degradation, concentration, and integrity were comprehensively monitored using 1% agarose gels, a Qubit® 2.0 Fluorometer (Life Technologies, South San Francisco, CA, USA), and an Agilent 2100 Bioanalyzer (Agilent Technologies, Santa Clara, CA, USA), respectively. Standard cDNA libraries were subsequently constructed and sequenced on an Illumina platform with paired-end 150 bp (PE150) reads. Quality control of raw reads was performed using Trimmomatic v0.39 [28]. Clean reads were aligned against the reference genome via HISAT2 v2.2.1 [29], and gene expression levels were quantified using the FPKM method. Differentially expressed genes (DEGs) were identified using the DESeq2 R package (v1.40.0, adjusted p-value < 0.05 and fold change ≥ 2). GO and KEGG enrichment analyses were executed via eggNOG-mapper and TBtools-II v2.475. For cold stress treatments, 2-month-old seedlings were exposed to an acute frost simulation at −4 °C, with samples harvested at 0, 12, and 24 h.

2.6. LcSWEET Gene Family Identification and Phylogenetic Analysis

Using the L. caerulea chromosome-level genome data (BioProject ID PRJCA053367) obtained in our laboratory, SWEET domain sequences (PF03083) were retrieved from the Pfam database to screen for genes containing this conserved domain. Gene chromosomal location maps were generated using TBtools-II. Multiple sequence alignment of 19 LcSWEET sequences and 17 AtSWEET sequences was performed using ClustalW v2.1. A neighbor-joining (NJ) phylogenetic tree was constructed using MEGA12 with a standard bootstrap value of 1000. The phylogenetic tree was visualized and annotated using the iTOL online tool (https://itol.embl.de/, accessed on 15 January 2026).

2.7. Sequence Characteristics, Gene Structure, and Conserved Motif Analysis

After converting gene sequences using TBtools-II, the theoretical isoelectric points and molecular weights of proteins were calculated using ExPASy (http://web.expasy.org/compute_pi/, accessed on 10 January 2026). Conserved protein motifs were predicted using the MEME website (https://meme-suite.org/meme/, accessed on 10 January 2026), with the maximum number of motifs set to 10. The motifs and gene structures of LcSWEETs were visualized using TBtools-II v2.475.

2.8. Promoter Cis-Element Analysis

The 2000 bp upstream regions of LcSWEET genes were extracted from the L. caerulea reference genome and used as promoter regions. These sequences were uploaded to the PlantCARE website (https://bioinformatics.psb.ugent.be/webtools/plantcare/html/, accessed on 10 January 2026) to predict cis-acting regulatory elements, which were then visualized using TBtools-II.

2.9. RNA Extraction and qRT-PCR Analysis

Total plant RNA was isolated using the Eastep® Super Plant RNA Kit (Promega, China). The PrimeScript RT reagent kit with gDNA Eraser (Toyobo, Osaka, Japan) was used for RNA reverse transcription. Gene transcription levels were quantified using the iCycler iQ5 System (Bio-Rad, Hercules, CA, USA). Each plant sample included three biological replicates. β-actin was used as an internal reference gene, and relative expression levels were calculated using the 2−ΔΔCt method. Primer sequences for qRT-PCR are listed in the Supplementary Table S2.

2.10. Construction of Overexpression Vector and Transient Transformation System

Overexpression vectors were constructed using pROK2. These vectors were then transformed into Agrobacterium tumefaciens EHA105 competent cells via electroporation. The Agrobacterium was cultured overnight (28 °C, 180 rpm) in LB liquid medium containing 25 mg/L rifampicin and 50 mg/L kanamycin. After harvesting, bacteria were resuspended in MS liquid medium (pH 5.8) to an OD600 of 0.8. Plants were submerged in the bacterial suspension and treated under −50 kPa vacuum for 5 min. Subsequently, residual bacteria were rinsed off with distilled water, and plants were transferred to sterile potting mix for subsequent analysis.

2.11. Statistical Analysis

Graphs and statistical analyses were performed using GraphPad Prism 10 and R v4.2.1. Quantitative data, based on three biological replicates, are presented as mean ± standard deviation (SD). For comparisons involving only two groups, a two-tailed Student’s t-test was used to assess significance. For multi-group comparisons, one-way analysis of variance (ANOVA) was performed followed by Tukey’s Honestly Significant Difference (HSD) post hoc test. Before these parametric tests, the assumptions of normality and homogeneity of variances were confirmed using Shapiro–Wilk and Levene’s tests, respectively. For transcriptomic data, p-values were adjusted using the Benjamini–Hochberg method to control the false discovery rate (FDR).

2.12. Dual-Luciferase Reporter Assay

The promoter regions of LcSWEET14a and LcSWEET15b (2000 bp upstream) were cloned into the pGreenII 0800-LUC vector as reporters. The CDS sequences of LcbHLH48 and LcMYB3 were inserted into the pGreenII 62-SK vector. The effector and reporter vectors were transformed into the Agrobacterium tumefaciens strain GV3101. Agrobacterium strains containing transcription factors were mixed with those carrying promoters in a ratio of 10:1 and subsequently infiltrated into N. benthamiana leaves. After luciferin was sprayed evenly onto the surface of the leaves, LUC activity was measured five minutes later using the Tanon 5200 Series Fully Automated Chemiluminescent Image Analysis System (Tanon, Shanghai, China).

3. Results

3.1. Habitat Suitability Patterns and Environmental Thresholds of L. caerulea

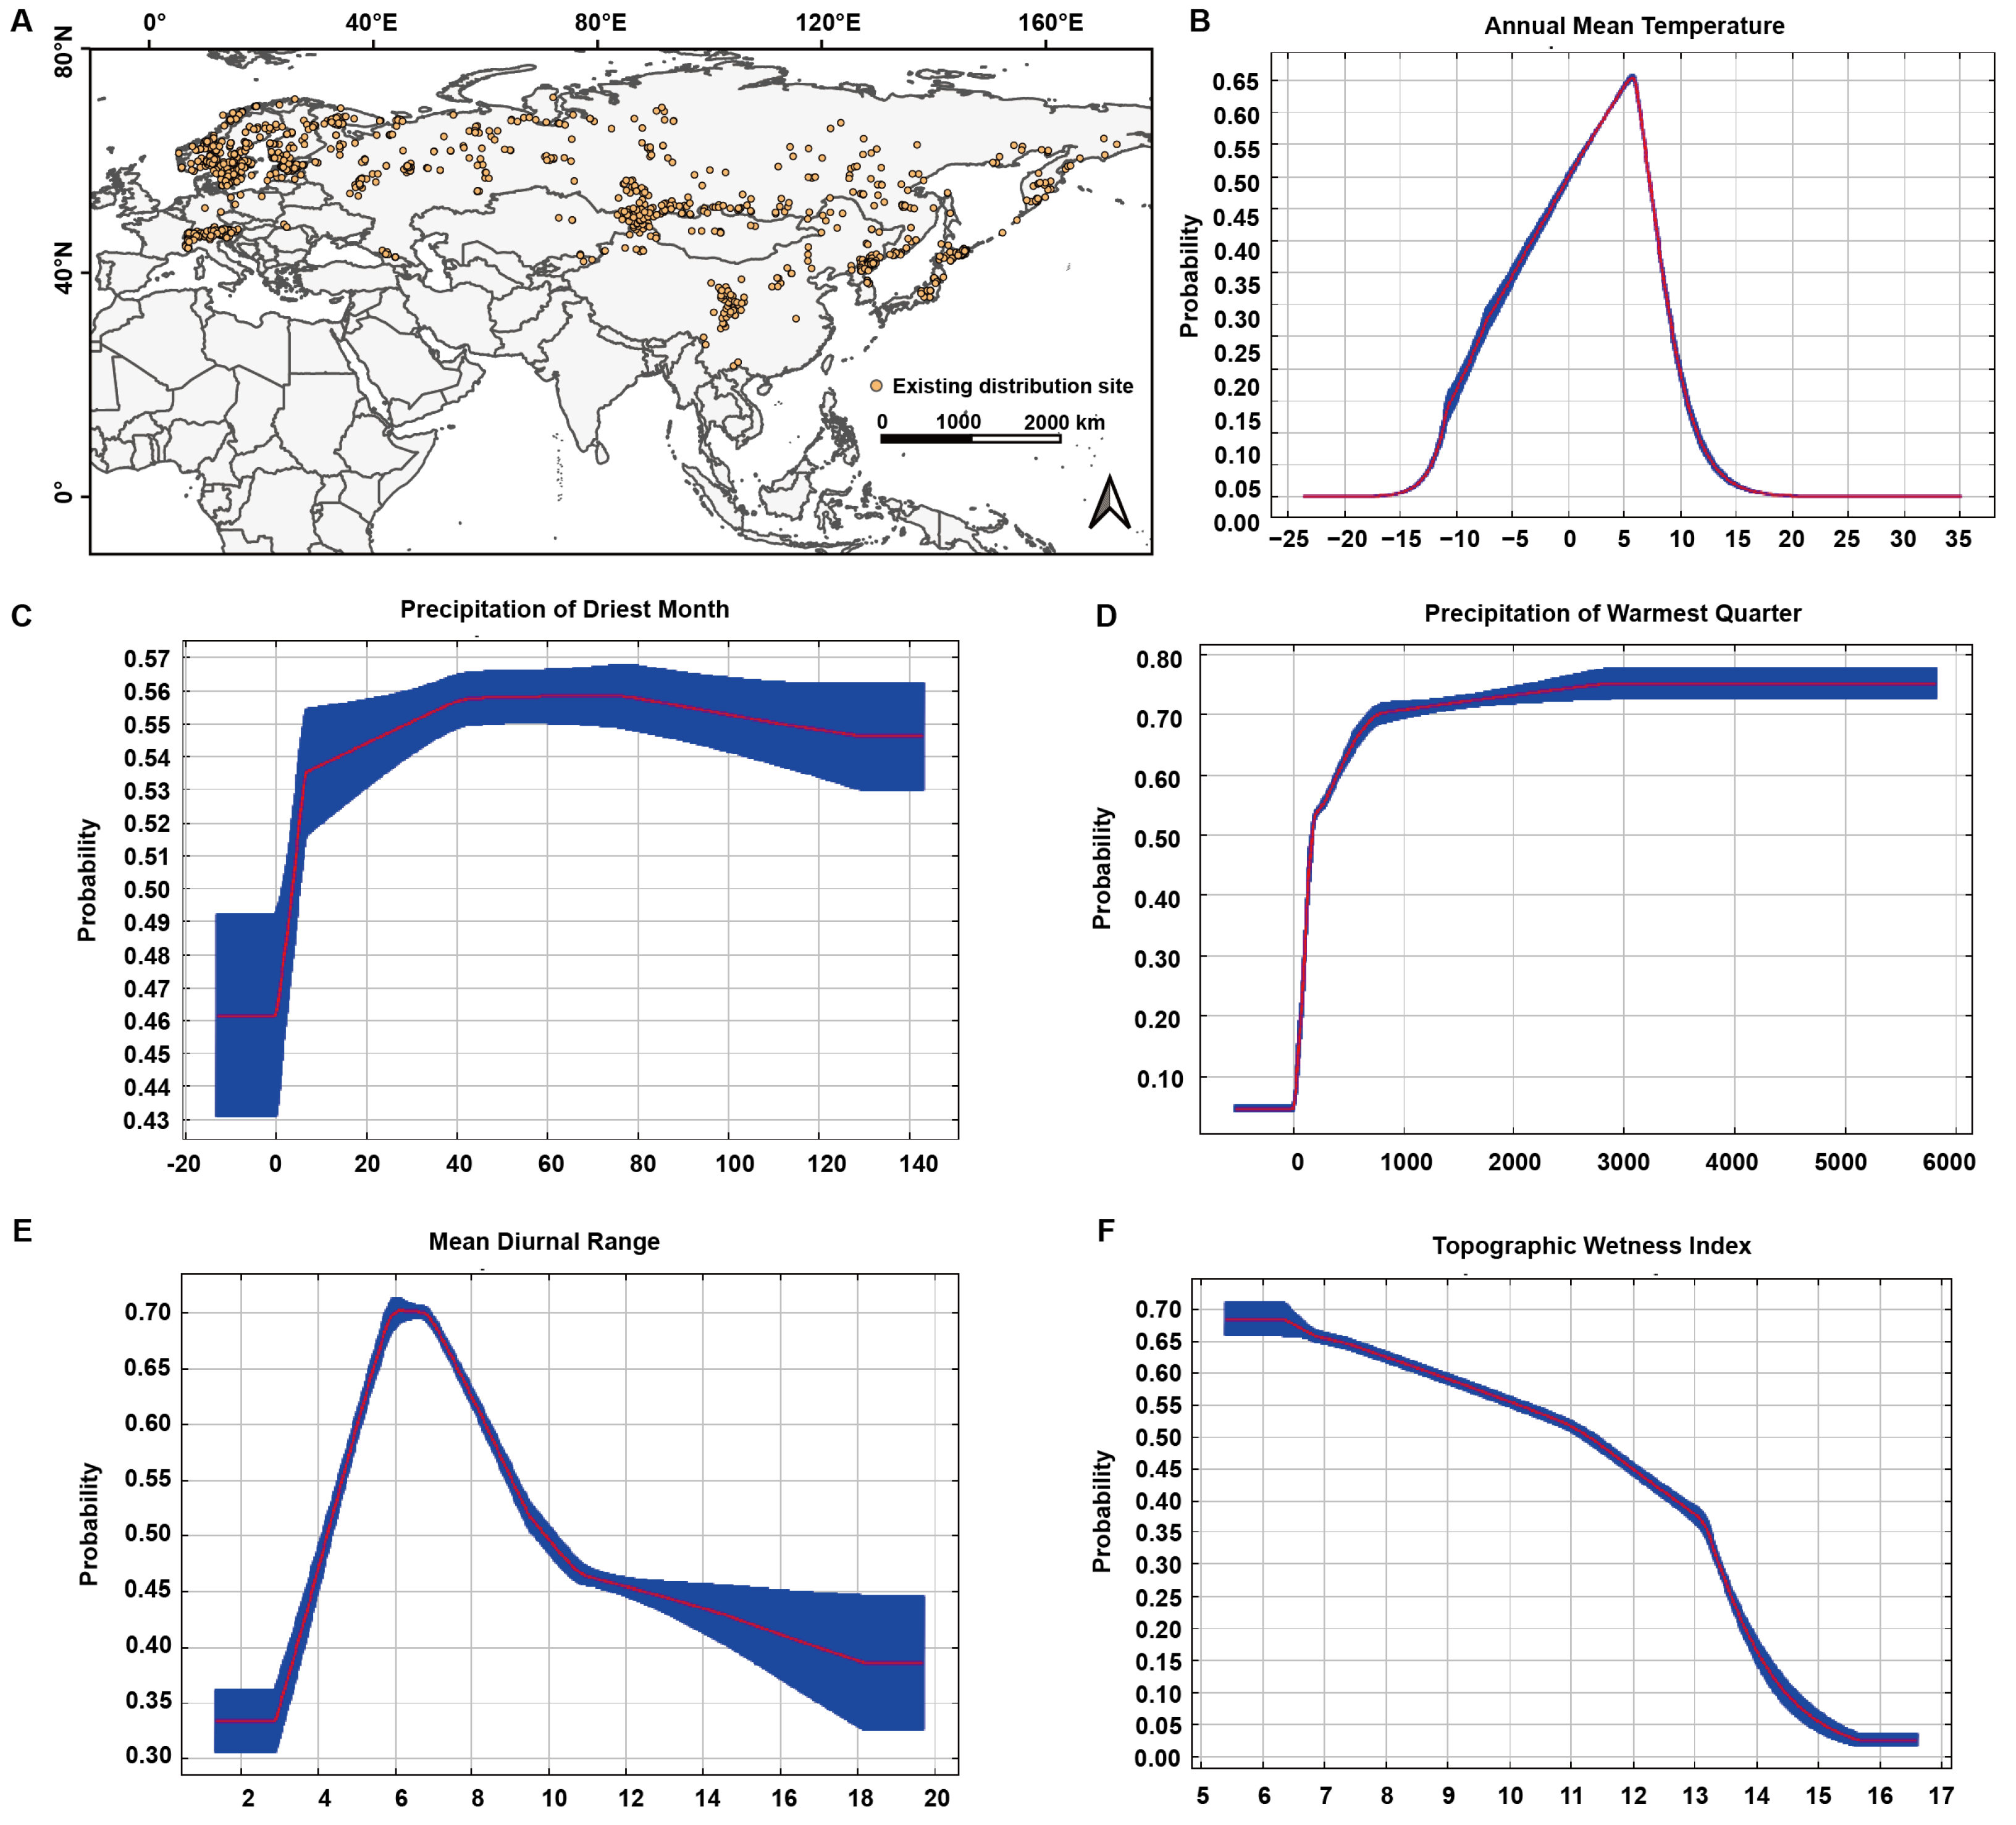
Following a rigorous screening process based on variable contribution and correlation, four bioclimatic variables and one topographic variable were selected for model construction (Supplementary Table S3). The predictive distribution patterns across Eurasia were simulated using the MaxEnt model based on 1326 occurrence records and the five selected predictors (Figure 1A). The MaxEnt model demonstrated robust performance and high predictive accuracy. The average test Area Under the Curve (AUC) across the 10 replicate runs was 0.870, with a very low standard deviation of 0.007. This high AUC value confirms the model’s excellent ability to discriminate between suitable and unsuitable habitats. Furthermore, the minimal standard deviation across replicates indicates the strong stability and reliability of our modeling approach. When employing the maximized sensitivity and specificity (MaxSSS) threshold for binarization, the model achieved a test omission rate of 0.170 and a test sensitivity of 0.830, strongly supporting the robustness of our species distribution model results (Supplementary Table S5).
The relative importance of environmental stressors was evaluated using percentage contribution and Jackknife tests. Under current climate scenarios, the dominant factors shaping the distribution of L. caerulea are Annual Mean Temperature (Bio1), Precipitation of Warmest Quarter (Bio18), Precipitation of Driest Month (Bio14), SAGA-GIS Topographic Wetness Index (TWI), and Mean Diurnal Range (Bio2). Collectively, these variables account for a cumulative contribution of 75.2%. Notably, Bio1 (26.1%), Bio18 (22.2%), and Bio14 (17.0%) emerged as the top three contributors, indicating their substantial contribution to defining the ecological niche of L. caerulea.
Response curves were generated to visualize the dependence of habitat suitability on these key variables (Figure 1B–F). For thermal conditions, L. caerulea exhibited a distinct unimodal response to Bio1 (Figure 1B). The probability of presence was negligible below −15 °C, rose sharply to a peak at approximately 5–6 °C (probability ≈ 0.65), and declined rapidly beyond 15 °C. This pattern is highly consistent with L. caerulea being a typically cold-adapted species, with optimal habitats restricted to regions with annual mean temperatures between 0 °C and 10 °C. Similarly, Bio2 showed a unimodal distribution (Figure 1E), where suitability peaked at a diurnal range of ~6 °C (probability > 0.70) and gradually decreased as temperature fluctuations exceeded 12 °C.
Regarding hydrological factors, habitat suitability exhibited a strong association with moisture availability. For Bio14, suitability increased sharply from a moderate baseline (0.46 at ~0 mm) to approximately 0.54 with minimal precipitation increments, stabilizing at a high plateau between 40 and 100 mm (Figure 1C). In contrast, the response to Bio18 revealed a strong threshold effect (Figure 1D). Suitability was minimal (<0.05) when precipitation was below 100 mm, surged to nearly 0.70 between 100 and 500 mm, and plateaued at high levels (0.75–0.78) beyond 500 mm. This suggests a high physiological demand for moisture during the growing season.
Conversely, TWI displayed an inverse relationship with habitat suitability (Figure 1F). The highest probability of presence (0.65–0.70) occurred at low TWI values (5–7). Notably, a precipitous drop in suitability was observed at TWI values of 13–14, falling to a minimum (~0.05) when TWI exceeded 15. The findings suggest a strong preference for well-drained slopes, identifying potential waterlogging or excessive soil moisture as a significant ecological constraint.

3.2. Evolution of Suitable Habitats for L. caerulea Under Different Climate Scenarios

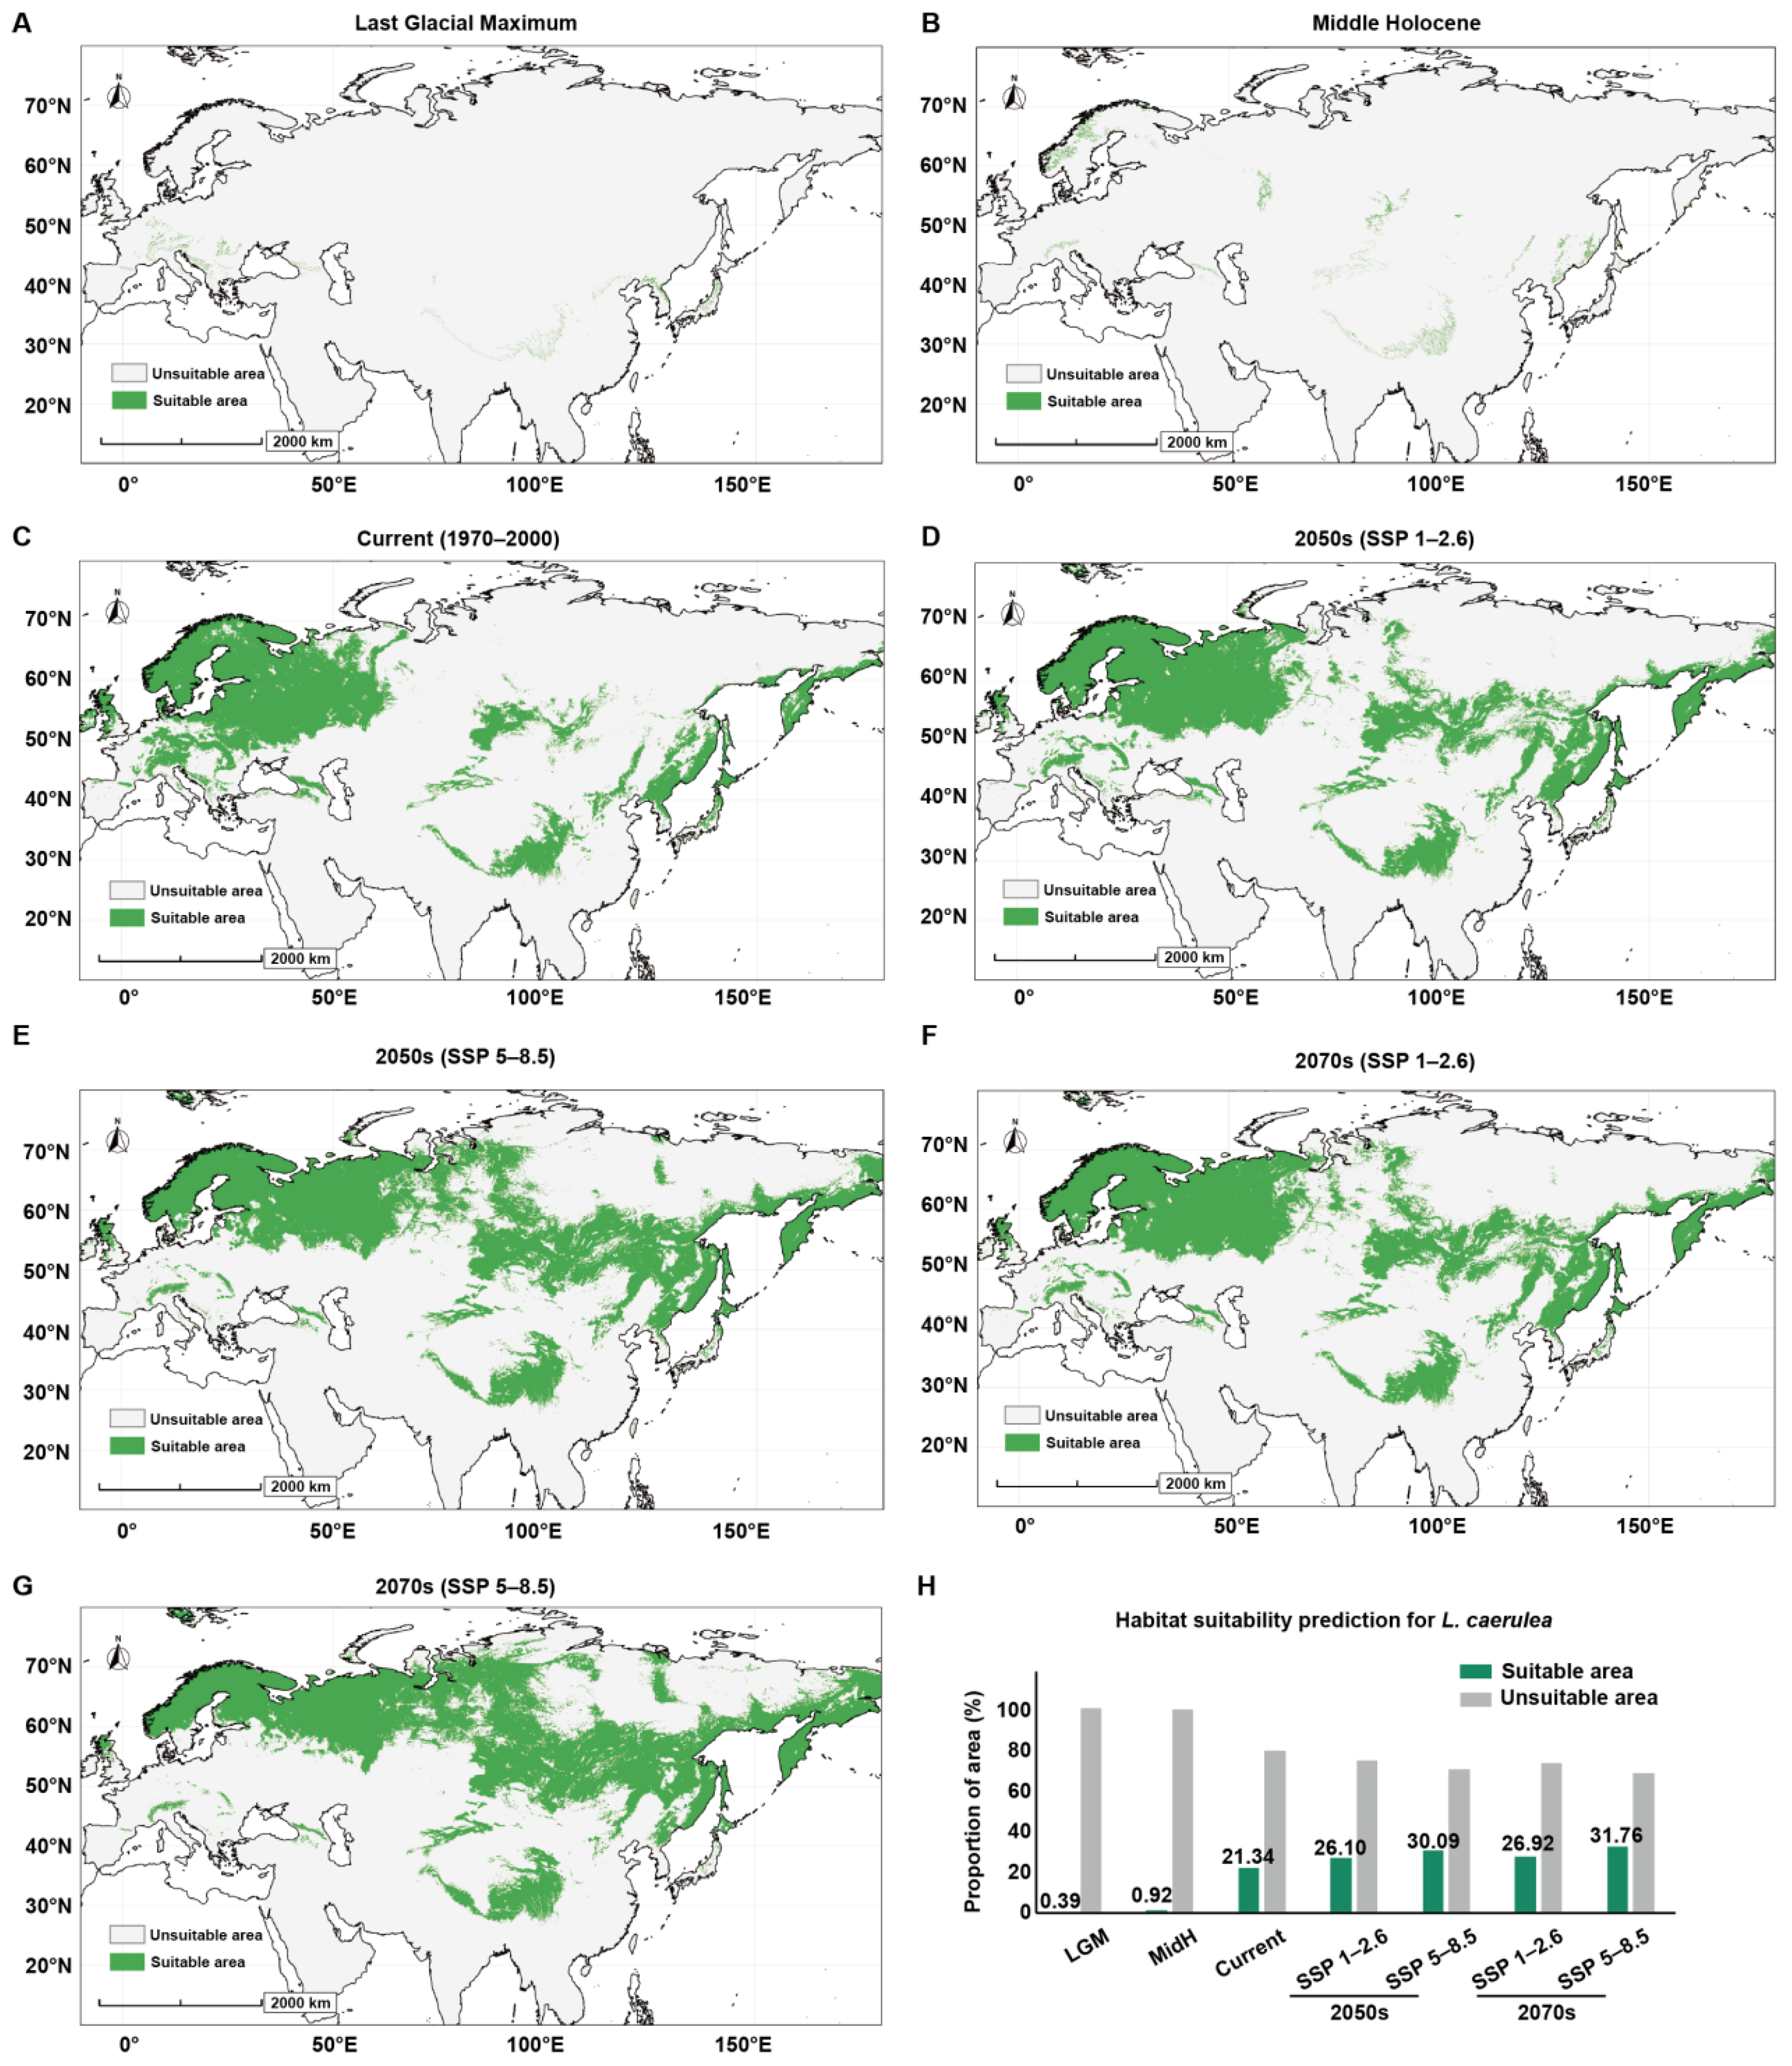
MaxEnt model projections revealed that the potential suitable habitat of L. caerulea exhibited a continuous distribution pattern, with suitability indices displaying a continuous gradient (Supplementary Figure S2). These continuous habitat projections were then binarized to clearly assess changes in L. caerulea suitable habitat under various climatic conditions. The results indicated that, under different climate scenarios, the potential distribution of L. caerulea shows significant fluctuations in response to climate change (Figure 2). During the Last Glacial Maximum (LGM), strongly associated with extreme cold, the suitable habitat for L. caerulea underwent a drastic contraction, covering only 0.39% of the total area (Figure 2A,H). Some refugia during this period were primarily confined to the peripheries of the Alps in Southern Europe, the Caucasus region, and parts of the coastal areas in East Asia. By the Mid-Holocene (MidH), coinciding with post-glacial warming, the suitable habitat area experienced a slight recovery to 0.92% (Figure 2B,H). But in the Scandinavian Peninsula and vast areas of Siberia, there was still no continuous distribution of L. caerulea. The spread of the species might have been strongly restricted by the environmental conditions at that time.
Under current climatic conditions (1970–2000), the suitable habitat for L. caerulea has expanded substantially. The proportion of suitable area is 21.34% (Figure 2C,H). The distribution center has shifted significantly toward higher latitudes, forming a continuous belt of suitability across northern Eurasia. Highly suitable habitats are concentrated in Northern Europe (including Sweden, Finland, and Norway), the Baltic states, the vast plains of Western Russia, the mountainous regions of Southern Siberia, and East Asia (including Northeast China, Hokkaido in Japan, and the northern Korean Peninsula).
About the impact of future climate change, MaxEnt predictions indicate a further expansion of suitable habitats under two SSP scenarios (Figure 2D–G). Under the low greenhouse gas (GHG) emissions (SSP 1–2.6), the proportion of suitable habitat is projected to increase to 26.10% by the 2050s and 26.92% by the 2070s (Figure 2D,F,H). Under the high GHG emissions (SSP 5–8.5), this expansion trend is more aggressive. The proportion of suitable area is predicted to reach 30.09% by the 2050s and 31.76% by the 2070s (Figure 2E,G,H).
The comparative analysis of spatial patterns indicates that future habitat expansion will occur predominantly in high-latitude regions of the Northern Hemisphere, that is, a northward migration. Notably, regions such as the Taymyr Peninsula, Yakutia, and the Chukotka Peninsula in Northern Russia, previously unsuitable due to permafrost or extreme cold, are projected to become suitable.

3.3. Transcriptome Sequencing and Gene Expression Characteristics of Different L. caerulea Tissues

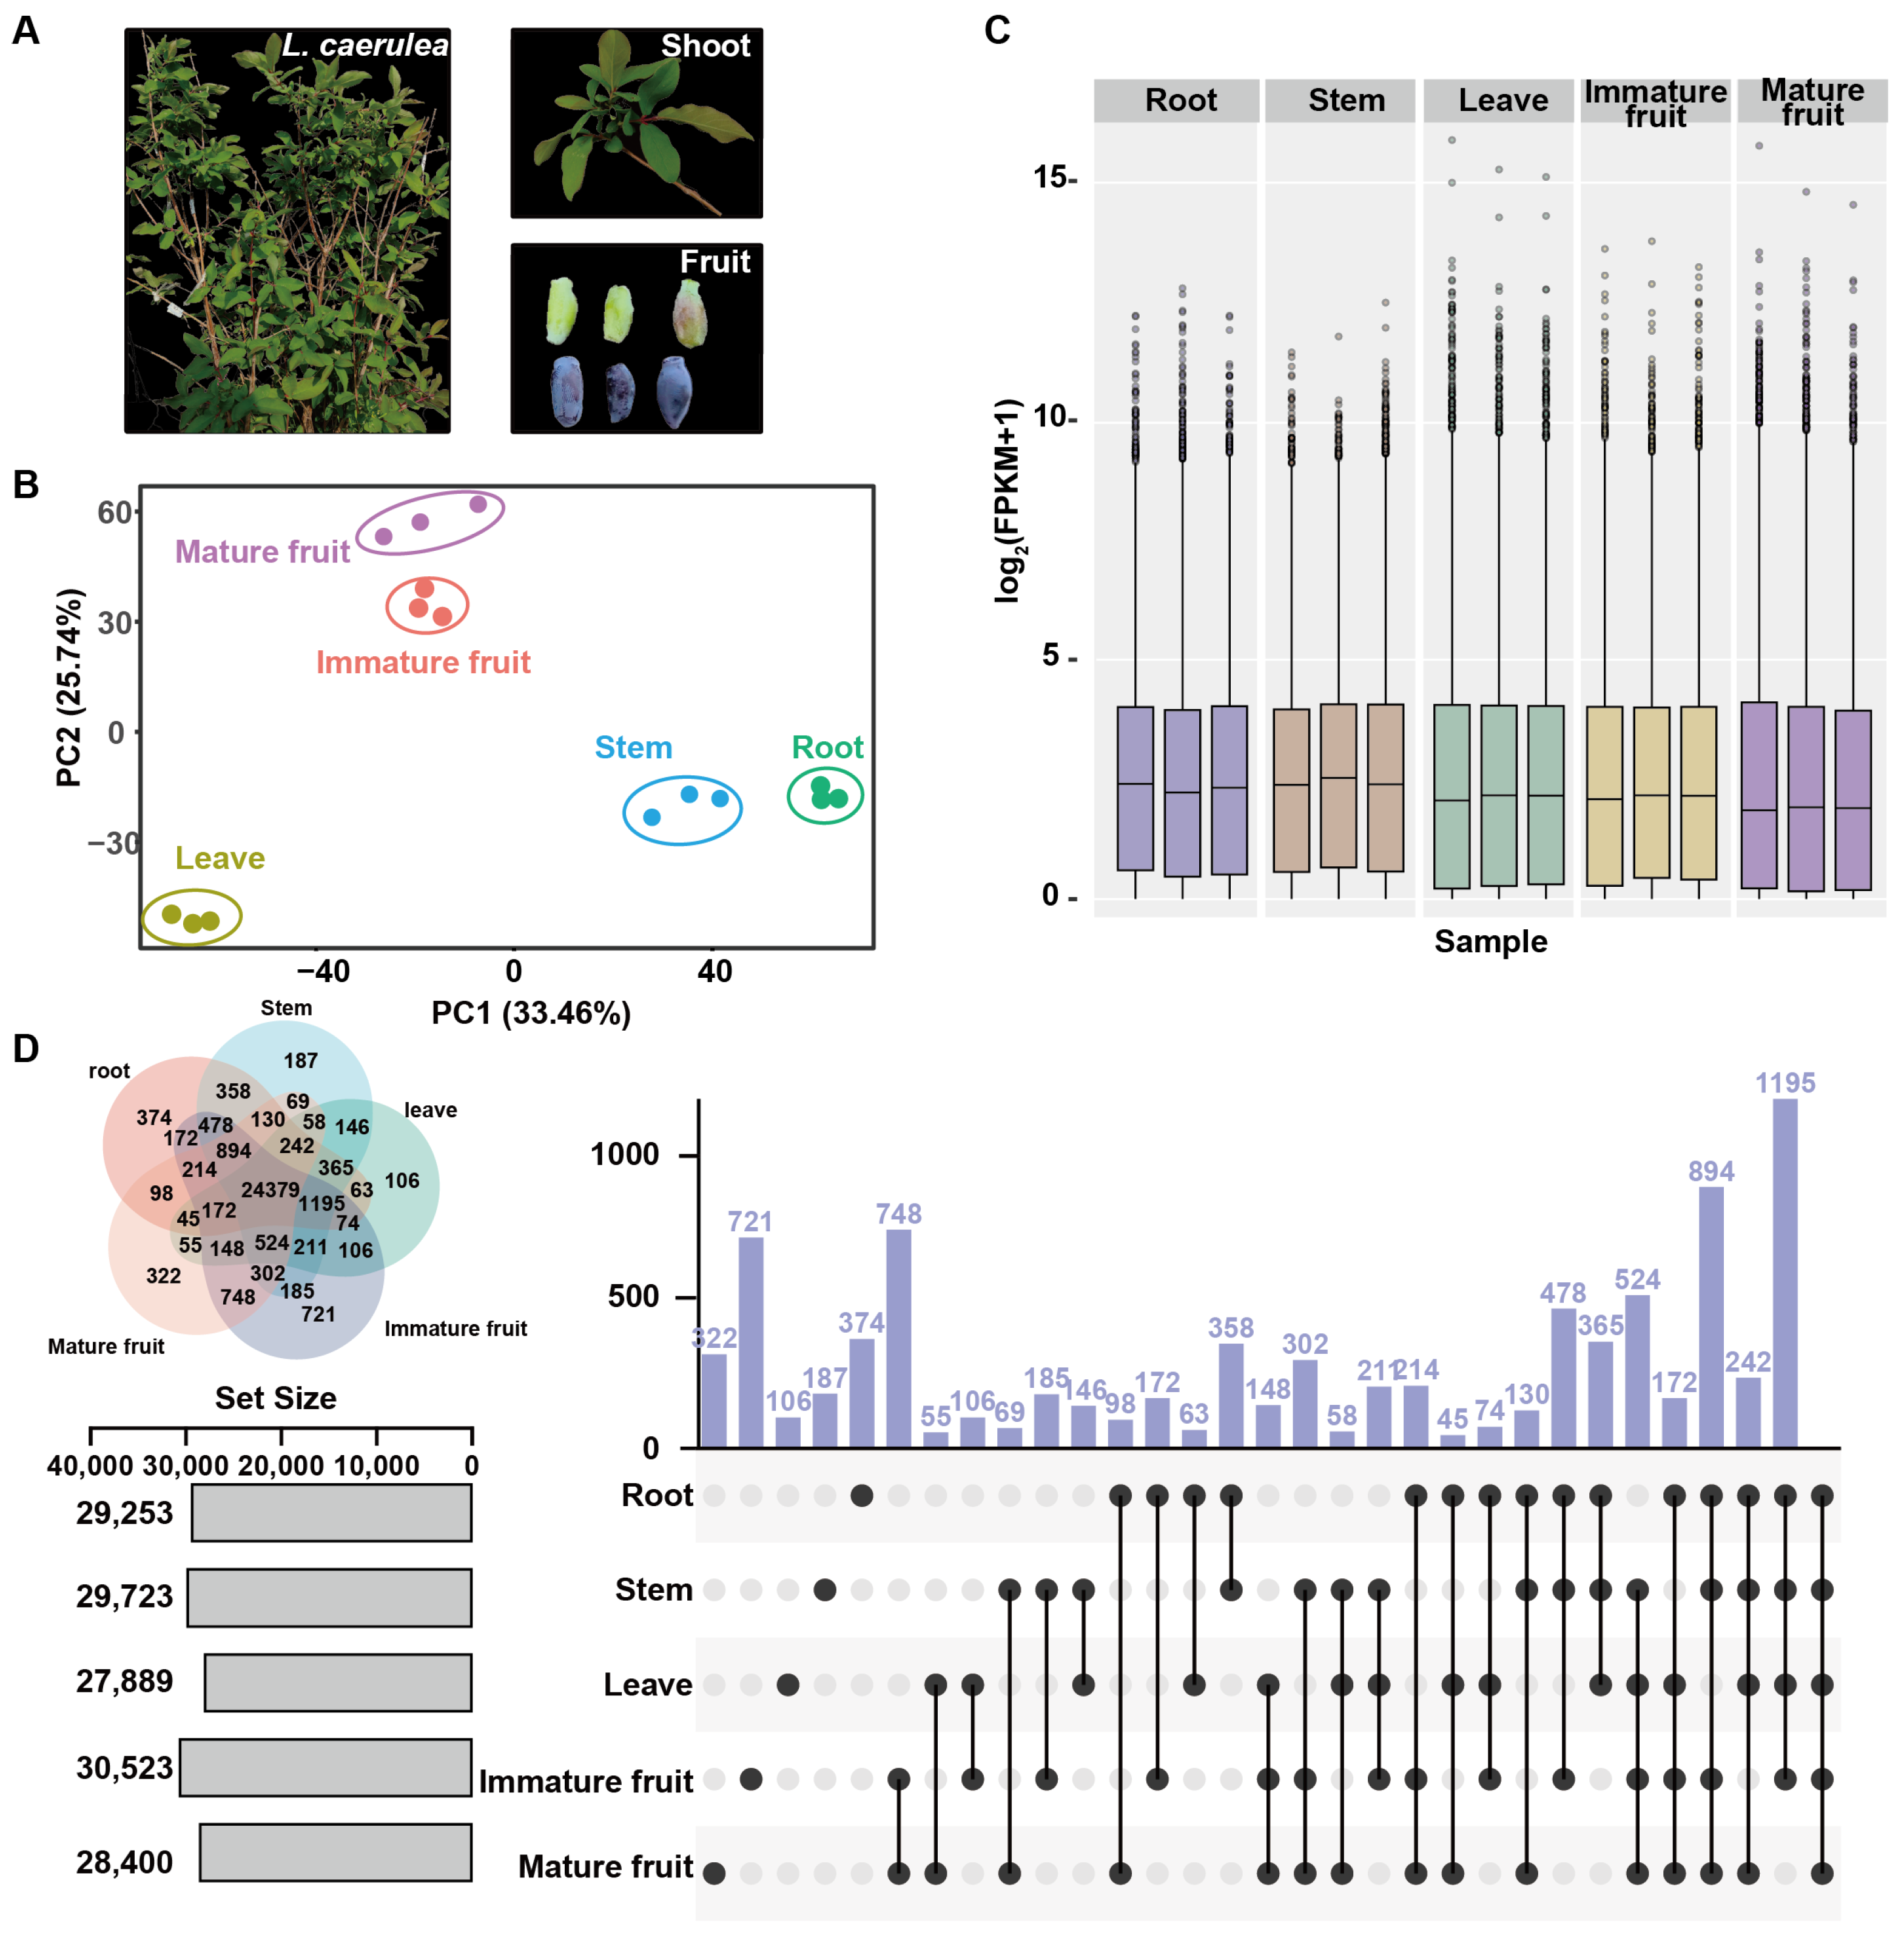
Temperature and precipitation restrict the distribution and growth of L. caerulea. As a typical environmentally sensitive species, the gene expression patterns across its distinct tissues provide correlative insight into the molecular basis for its environmental adaptation. We constructed a phylogenetic tree based on 30 single-copy orthologous genes. The bootstrap values strongly supported the clustering of L. caerulea and the same genus L. japonica (Supplementary Figure S3). On this basis, we performed transcriptome sequencing on roots, stems, leaves, and two fruit developmental stages to elucidate the gene regulatory networks underlying growth and development (Figure 3A). Principal Component Analysis (PCA) visually revealed distinct gene expression patterns among the different tissues (Figure 3B). The first two principal components (PC1 and PC2) collectively explained 59.2% of the variance. PC1, accounting for 33.46% of the variance, clearly separated reproductive organs (immature and mature fruits) from vegetative organs (roots, stems, and leaves). PC2, accounting for 25.74% of the variance, further distinguished underground parts (roots) from above-ground parts (stems and leaves). The three biological replicates within the same tissue clustered tightly in the PCA plot, indicating high sample repeatability.
The distribution of gene expression levels indicated that the median gene expression abundance was largely consistent across samples, suggesting high sequencing data quality and strong comparability between different tissues (Figure 3C). Among the five tissues, the immature fruit exhibited the highest number of detected genes (30,523), which may be attributed to active metabolic activities and cell division during the rapid fruit expansion period. This was followed by stems (29,723) and roots (29,253), while leaves showed the lowest number of expressed genes (27,889). Regarding tissue specificity, a core set of 24,379 genes was shared among all five tissues, likely maintaining basal survival activities in L. caerulea. Additionally, each tissue had specifically expressed genes. Notably, the immature fruit contained the highest number of tissue-specific genes (721), significantly exceeding that of other tissues. This result implies that numerous specific genes are activated during fruit maturation to participate in complex secondary metabolic processes, such as pigment synthesis, sugar and acid accumulation, and flavor quality formation.

3.4. Tissue-Specific Gene Enrichment Analysis of L. caerulea

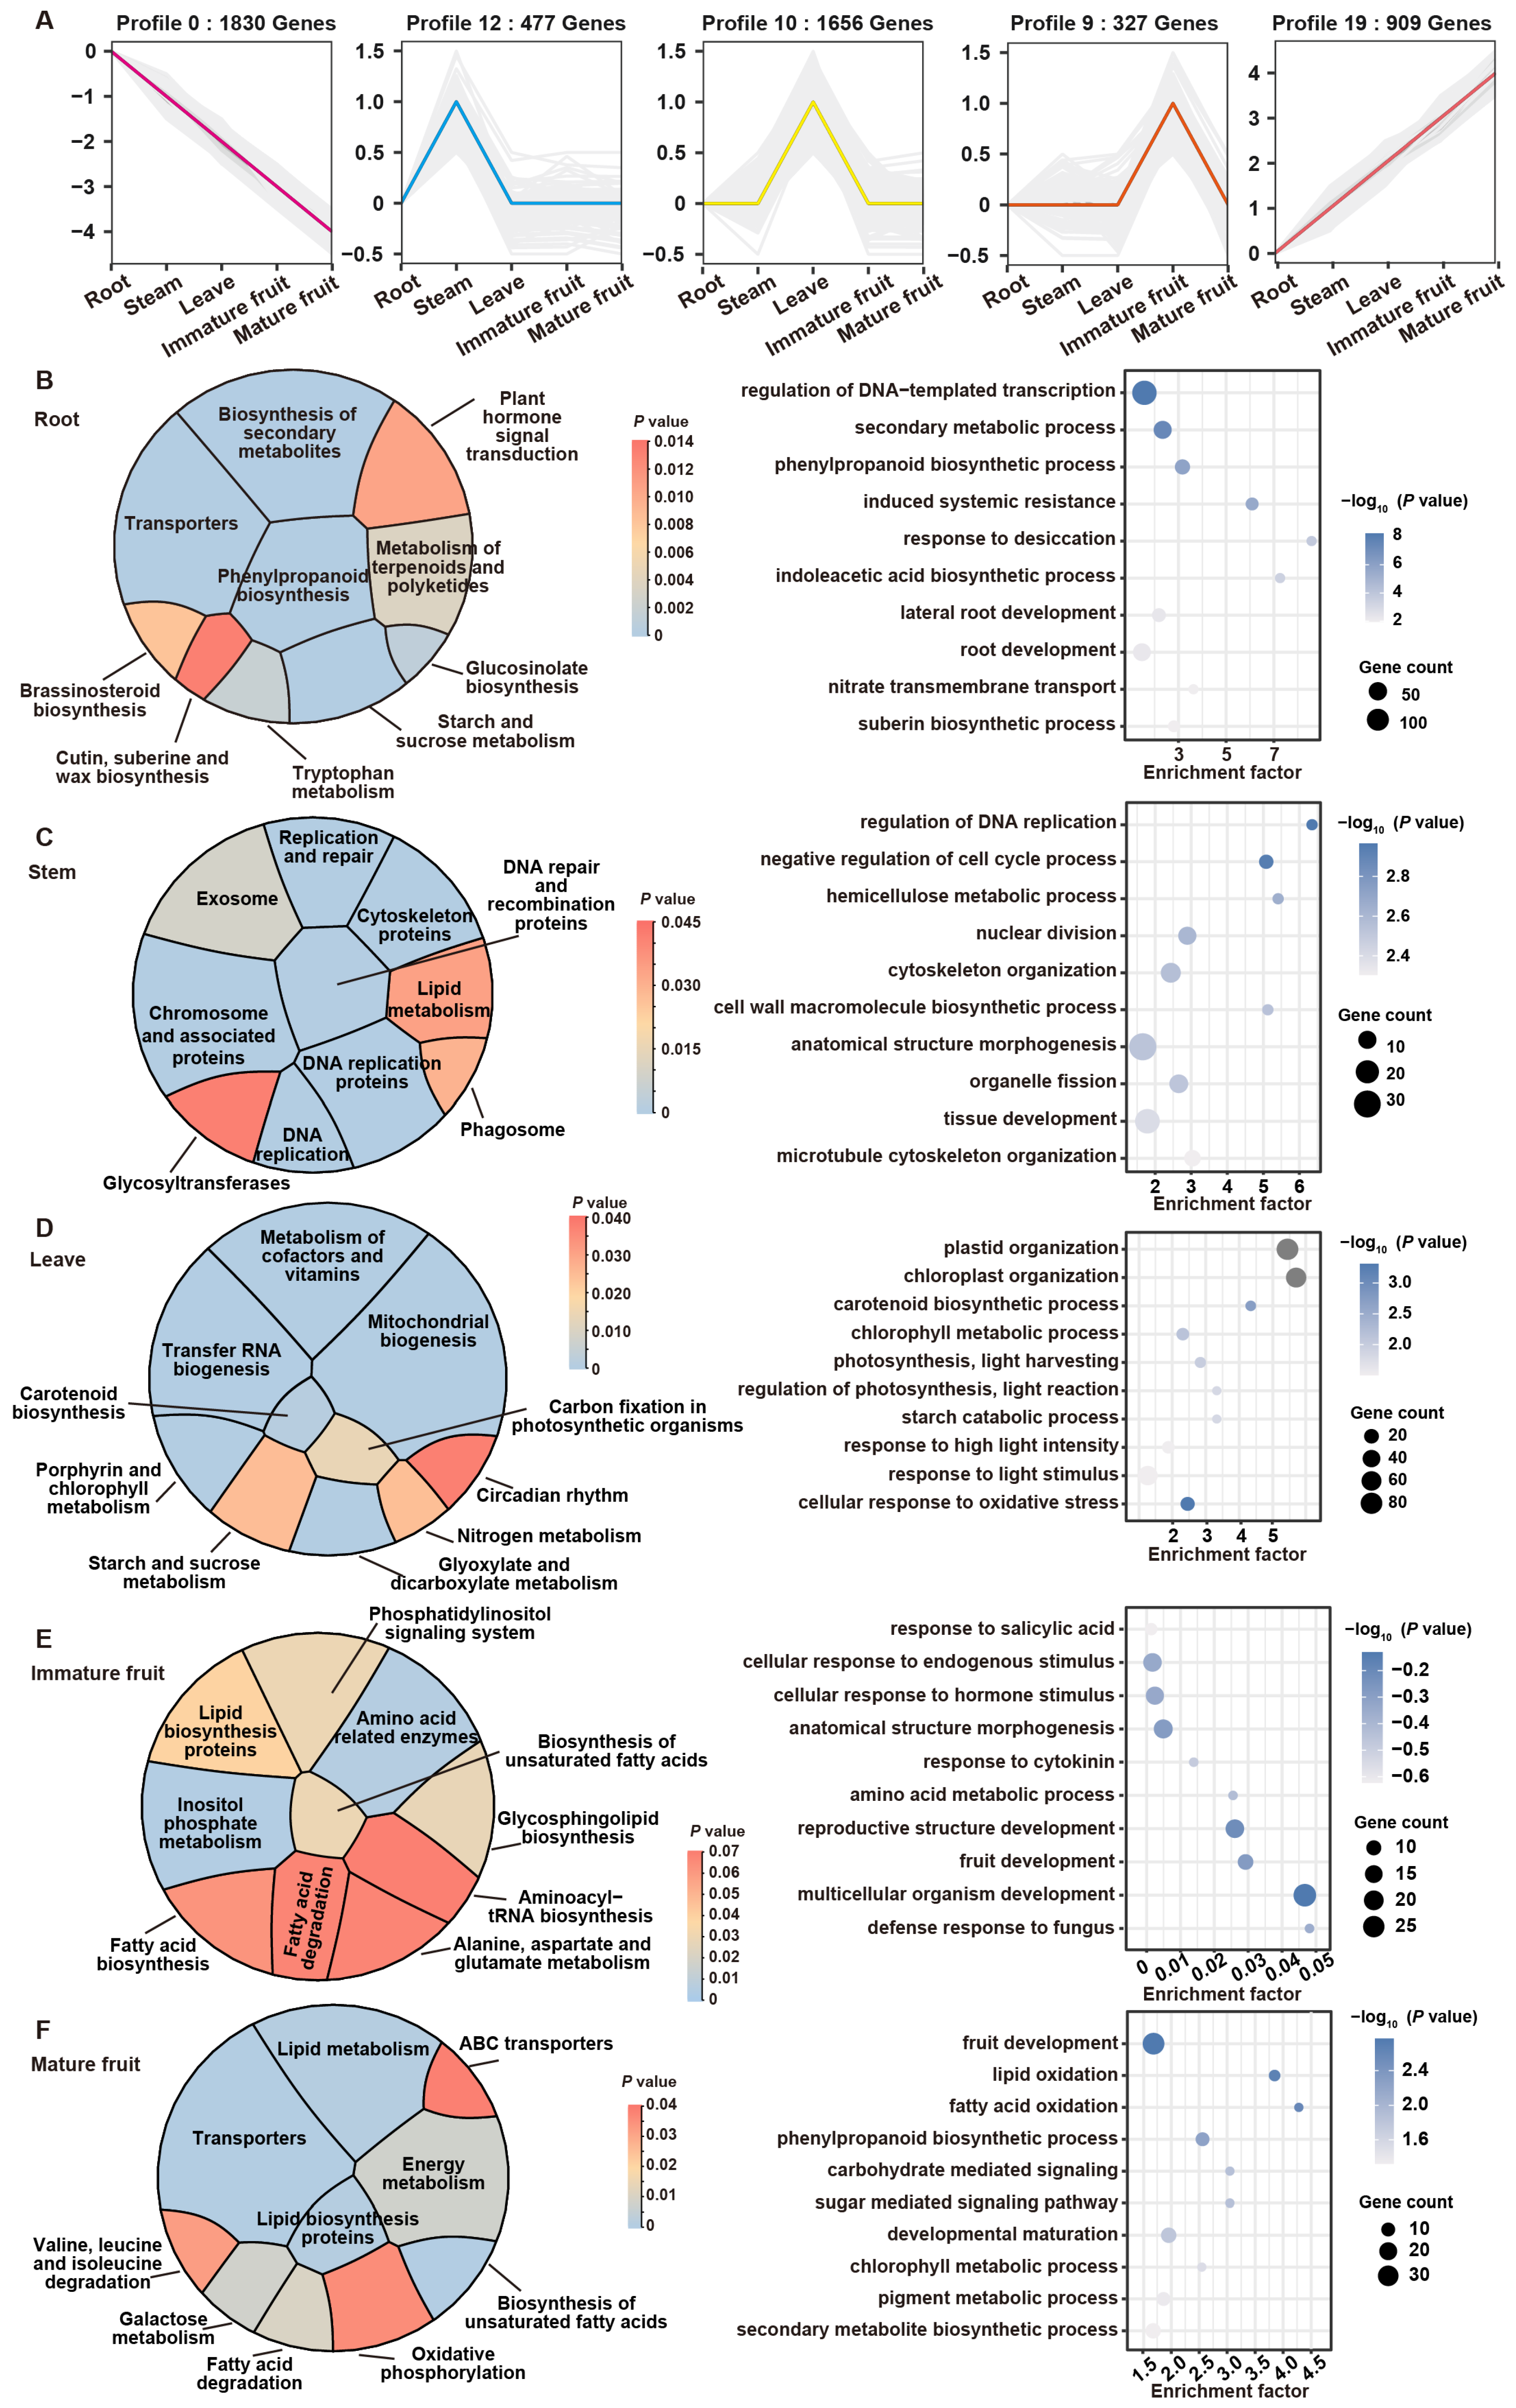
To elucidate the distinct functional characteristics of various tissues in L. caerulea, we performed a trend clustering analysis based on gene expression levels, classifying all differentially expressed genes into 20 trends (Supplementary Figure S4). Subsequently, five gene sets exhibiting high expression in specific tissues were selected (Figure 4A), and KEGG pathway and GO functional enrichment analyses were conducted for each gene set (Figure 4B–F).
The root-specific high expression gene set (Profile 0) comprised 1830 genes (Figure 4A). Functional analysis showed that these genes were primarily enriched in KEGG pathways including biosynthesis of other secondary metabolites, transporters, phenylpropanoid biosynthesis, and glucosinolate biosynthesis, as well as GO biological processes such as secondary metabolic process, phenylpropanoid biosynthetic process, root development, and nitrate transmembrane transport (Figure 4B). Notably, stress-related processes such as induced systemic resistance and response to desiccation were significantly enriched. The suberin biosynthetic process plays a key role in synthesizing protective barriers. It was also significantly enriched, suggesting that the root is a critical site for material transport and coping with underground stresses.
The stem-specific high expression gene set (Profile 12) contained 477 genes. Enrichment analysis highlighted terms related to DNA replication, DNA replication proteins, chromosome and associated proteins, and DNA repair and recombination proteins in KEGG, alongside regulation of DNA replication, nuclear division, and cell wall macromolecule metabolic process in GO (Figure 4C). These results indicate that the stem is heavily involved in maintaining vigorous cell division, vascular bundle development, and providing mechanical support.
The leaf-specific high expression gene set (Profile 10) consisted of 1656 genes. KEGG and GO analysis demonstrated significant enrichment in photosynthesis-related pathways, including carbon fixation in photosynthetic organisms, porphyrin and chlorophyll metabolism, carotenoid biosynthesis, starch and sucrose metabolism, plastid organization, and responses to high light intensity and oxidative stress (Figure 4D). These functional enrichment results are highly consistent with the biological function of leaves as the primary organs for photosynthesis.
The immature fruit-specific high expression gene set (Profile 9) included 327 genes. These genes were predominantly enriched in lipid biosynthesis proteins, biosynthesis of unsaturated fatty acids, and inositol phosphate metabolism in KEGG, and fruit development, anatomical structure morphogenesis, and cellular response to hormone stimulus in GO (Figure 4E). These are critical processes during the morphological establishment phase of immature fruits, laying the material foundation for rapid fruit growth. In the subsequent mature fruit stage, there were 909 specific high-expression genes (Profile 19). KEGG and GO analysis revealed significant enrichment in pathways closely related to fruit quality and transport, such as transporters, lipid metabolism, energy metabolism, pigment metabolic process, phenylpropanoid biosynthetic process, and the sugar-mediated signaling pathway (Figure 4F). These pathways ensure the accumulation of flavor substances and pigments during the fruit maturation stage of L. caerulea, thereby guaranteeing fruit quality.

3.5. Identification and Functional Analysis of the LcSWEET Gene Family in L. caerulea

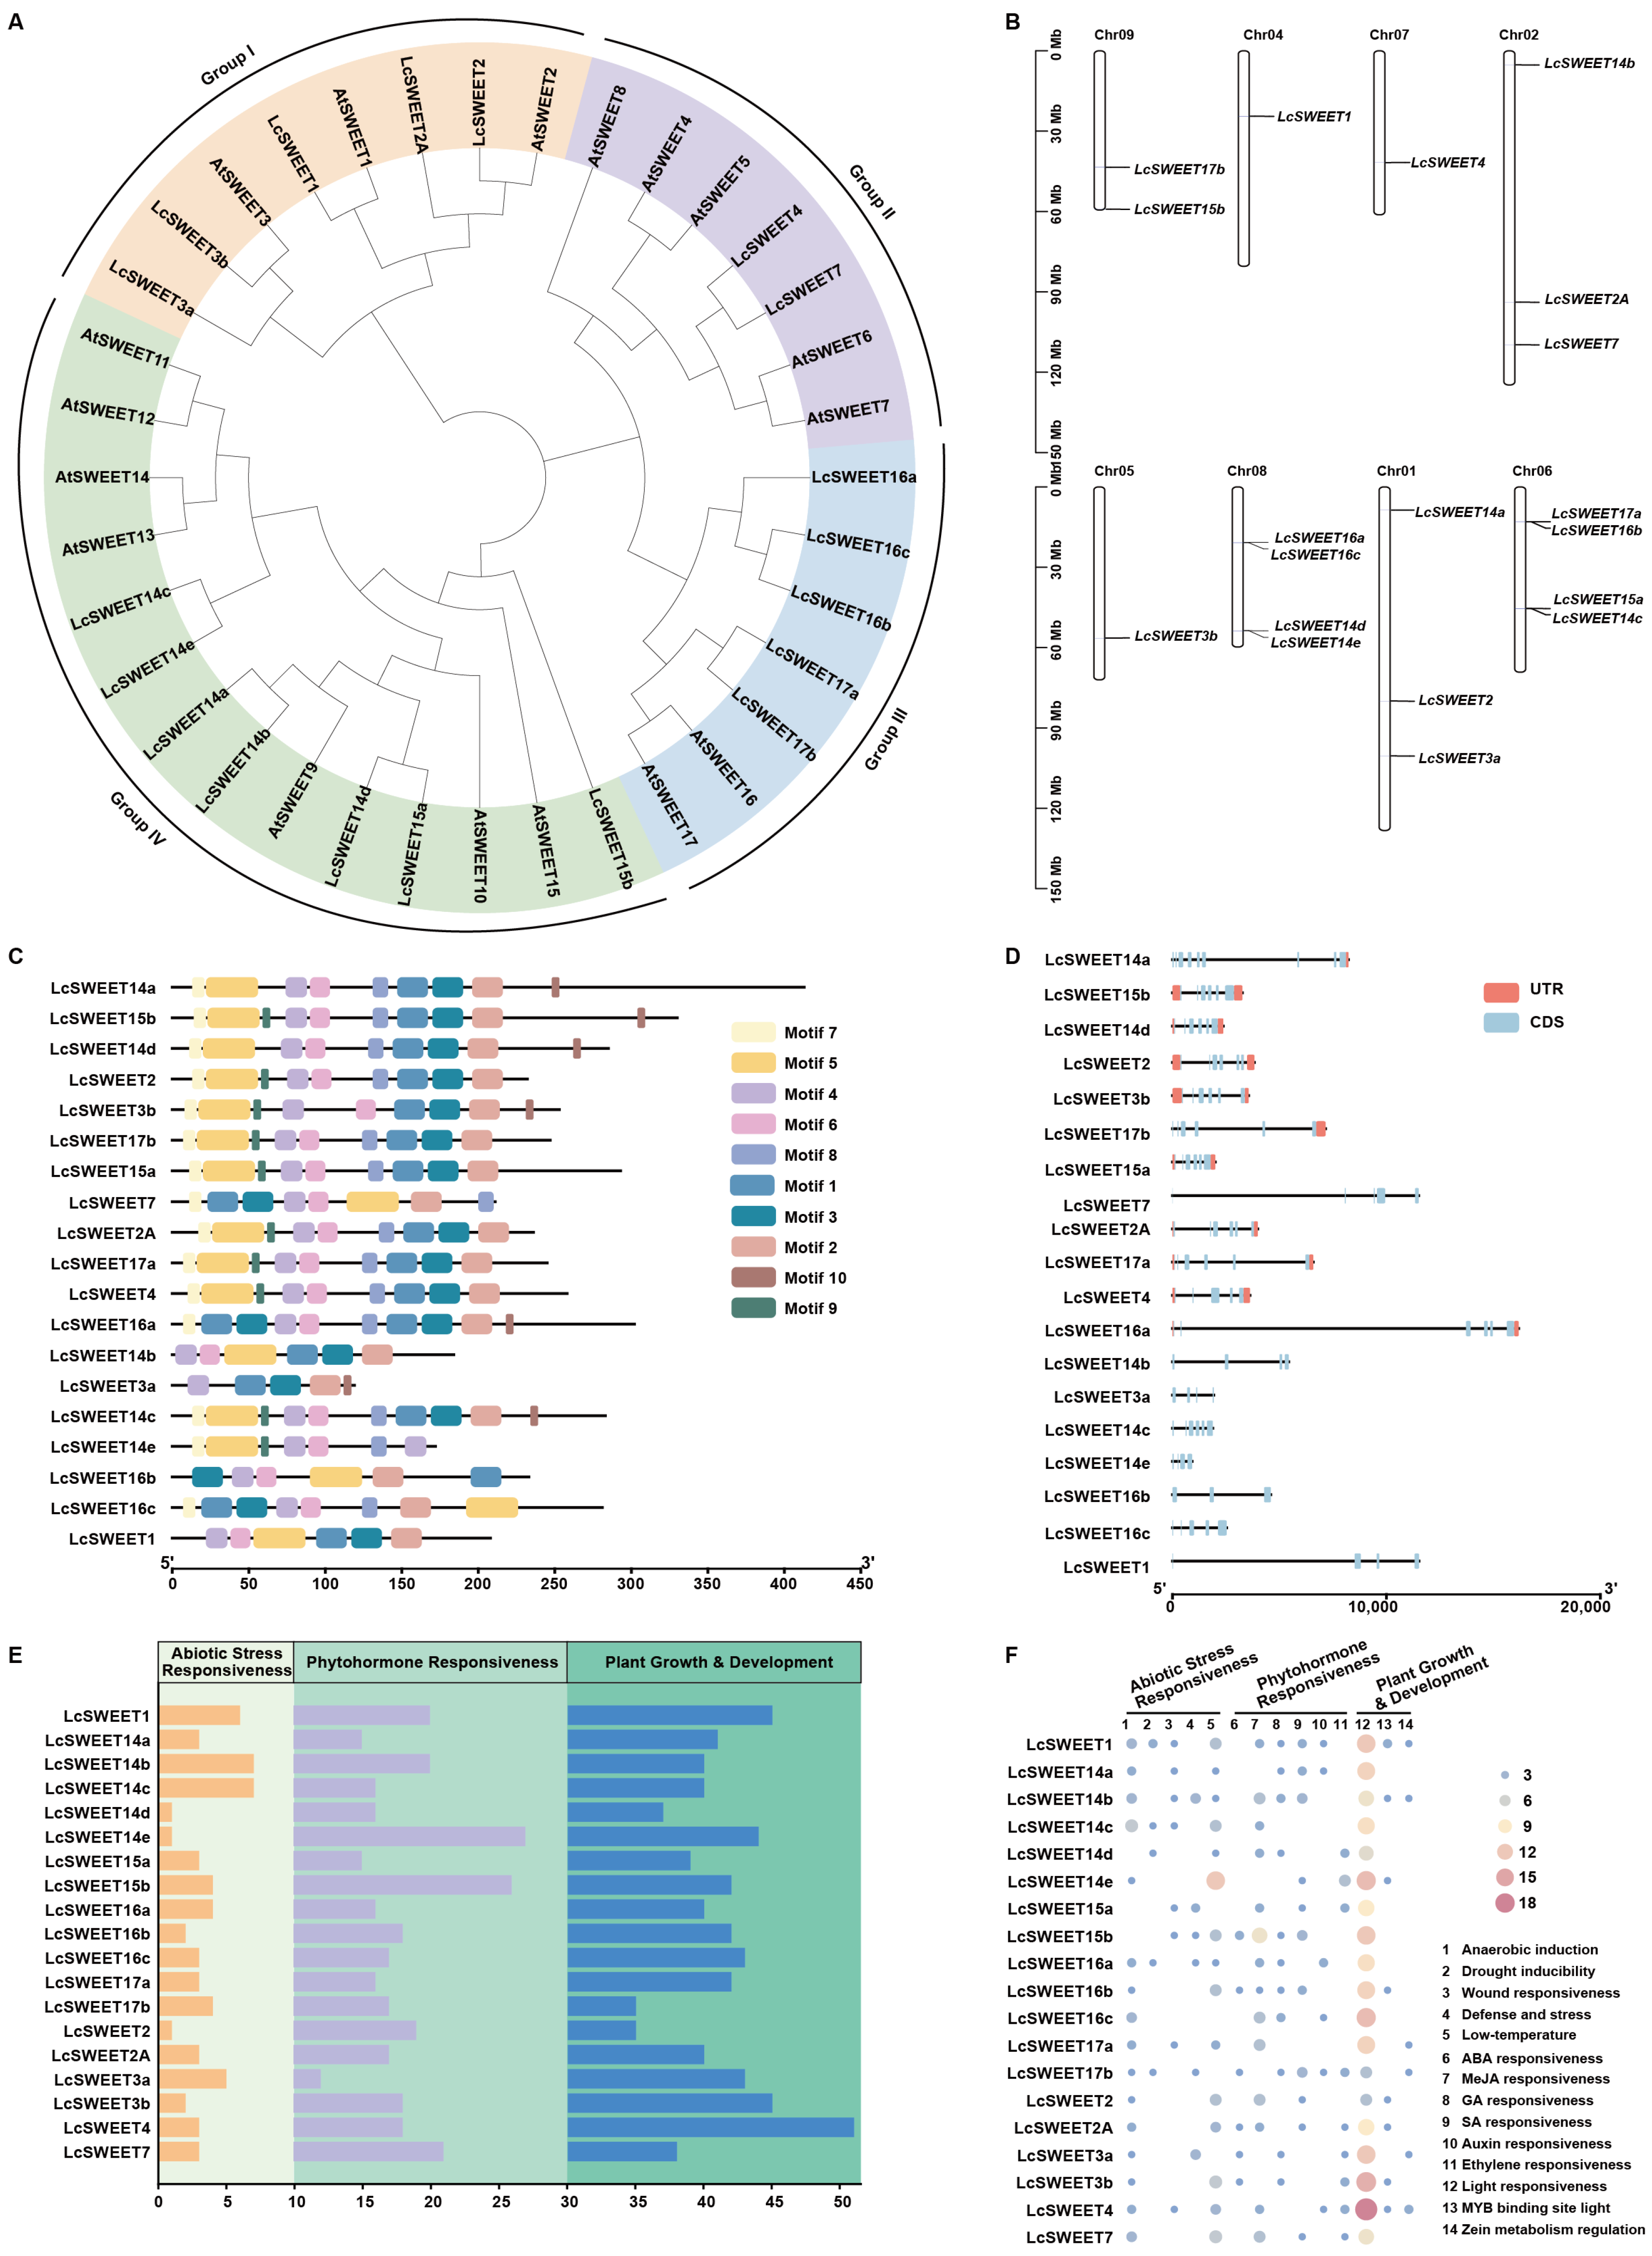
A total of 19 SWEET genes were identified from the L. caerulea genome. We aligned these 19 LcSWEET genes with 17 AtSWEET genes from Arabidopsis thaliana to construct a phylogenetic tree. The analysis revealed that all 36 SWEET genes clustered into four distinct clades (Groups I–IV) (Figure 5A). Specifically, the 19 LcSWEET genes were distributed across these clades, with 5 members in Group I, 2 in Group II, 5 in Group III, and 7 in Group IV. The LcSWEETs clustered well with their AtSWEET homologs. The 19 LcSWEETs were unevenly distributed across eight chromosomes: Chr6 and Chr8 each hosted four genes; Chr2 and Chr1 each carried three; Chr9 contained two; and Chr4, Chr5, and Chr7 each possessed one gene (Figure 5B).
To explore the structural basis underlying their functional specialization, we analyzed their conserved motifs and gene structures. MEME analysis predicted ten conserved motifs (Motifs 1–10). Specifically, motif 4 was universally present in all genes, whereas motifs 1 and 3 were duplicated in LcSWEET16a, and motif 6 was absent only in LcSWEET3a (Figure 5C). Analysis of the intron-exon structure revealed that the number of exons ranged from 3 to 9, with LcSWEET14a containing the highest number (Figure 5D). We further analyzed the physicochemical properties of the LcSWEETs (Supplementary Table S4). The 19 proteins ranged in length from 119 aa (LcSWEET3a) to 413 aa (LcSWEET14a), with molecular weights ranging from 13,023.61 to 46,947.86 Da. The isoelectric points (pI) varied between 5.19 (LcSWEET15b, LcSWEET17b) and 9.56 (LcSWEET4, LcSWEET7).
To predict potential regulatory mechanisms, cis-acting elements within the 2000 bp promoter regions were classified into three categories: abiotic stress responsiveness, phytohormone responsiveness, and plant growth and development (Figure 5E). Elements related to growth and development were the most abundant, highlighting the extensive involvement of LcSWEETs in developmental processes. This was followed by phytohormone-responsive elements, including those responsive to gibberellin, auxin, abscisic acid, and methyl jasmonate (Figure 5F). Notably, light-responsive elements and abiotic stress-responsive elements were also widely distributed across the promoter regions (Figure 5F). In particular, the frequent occurrence of low-temperature responsiveness (LTR) elements and drought-inducibility MYB binding sites (MBS) suggests that LcSWEETs play a critical role in the response of L. caerulea to environmental stress.

3.6. Expression Pattern Analysis and Cold Stress Response of LcSWEETs

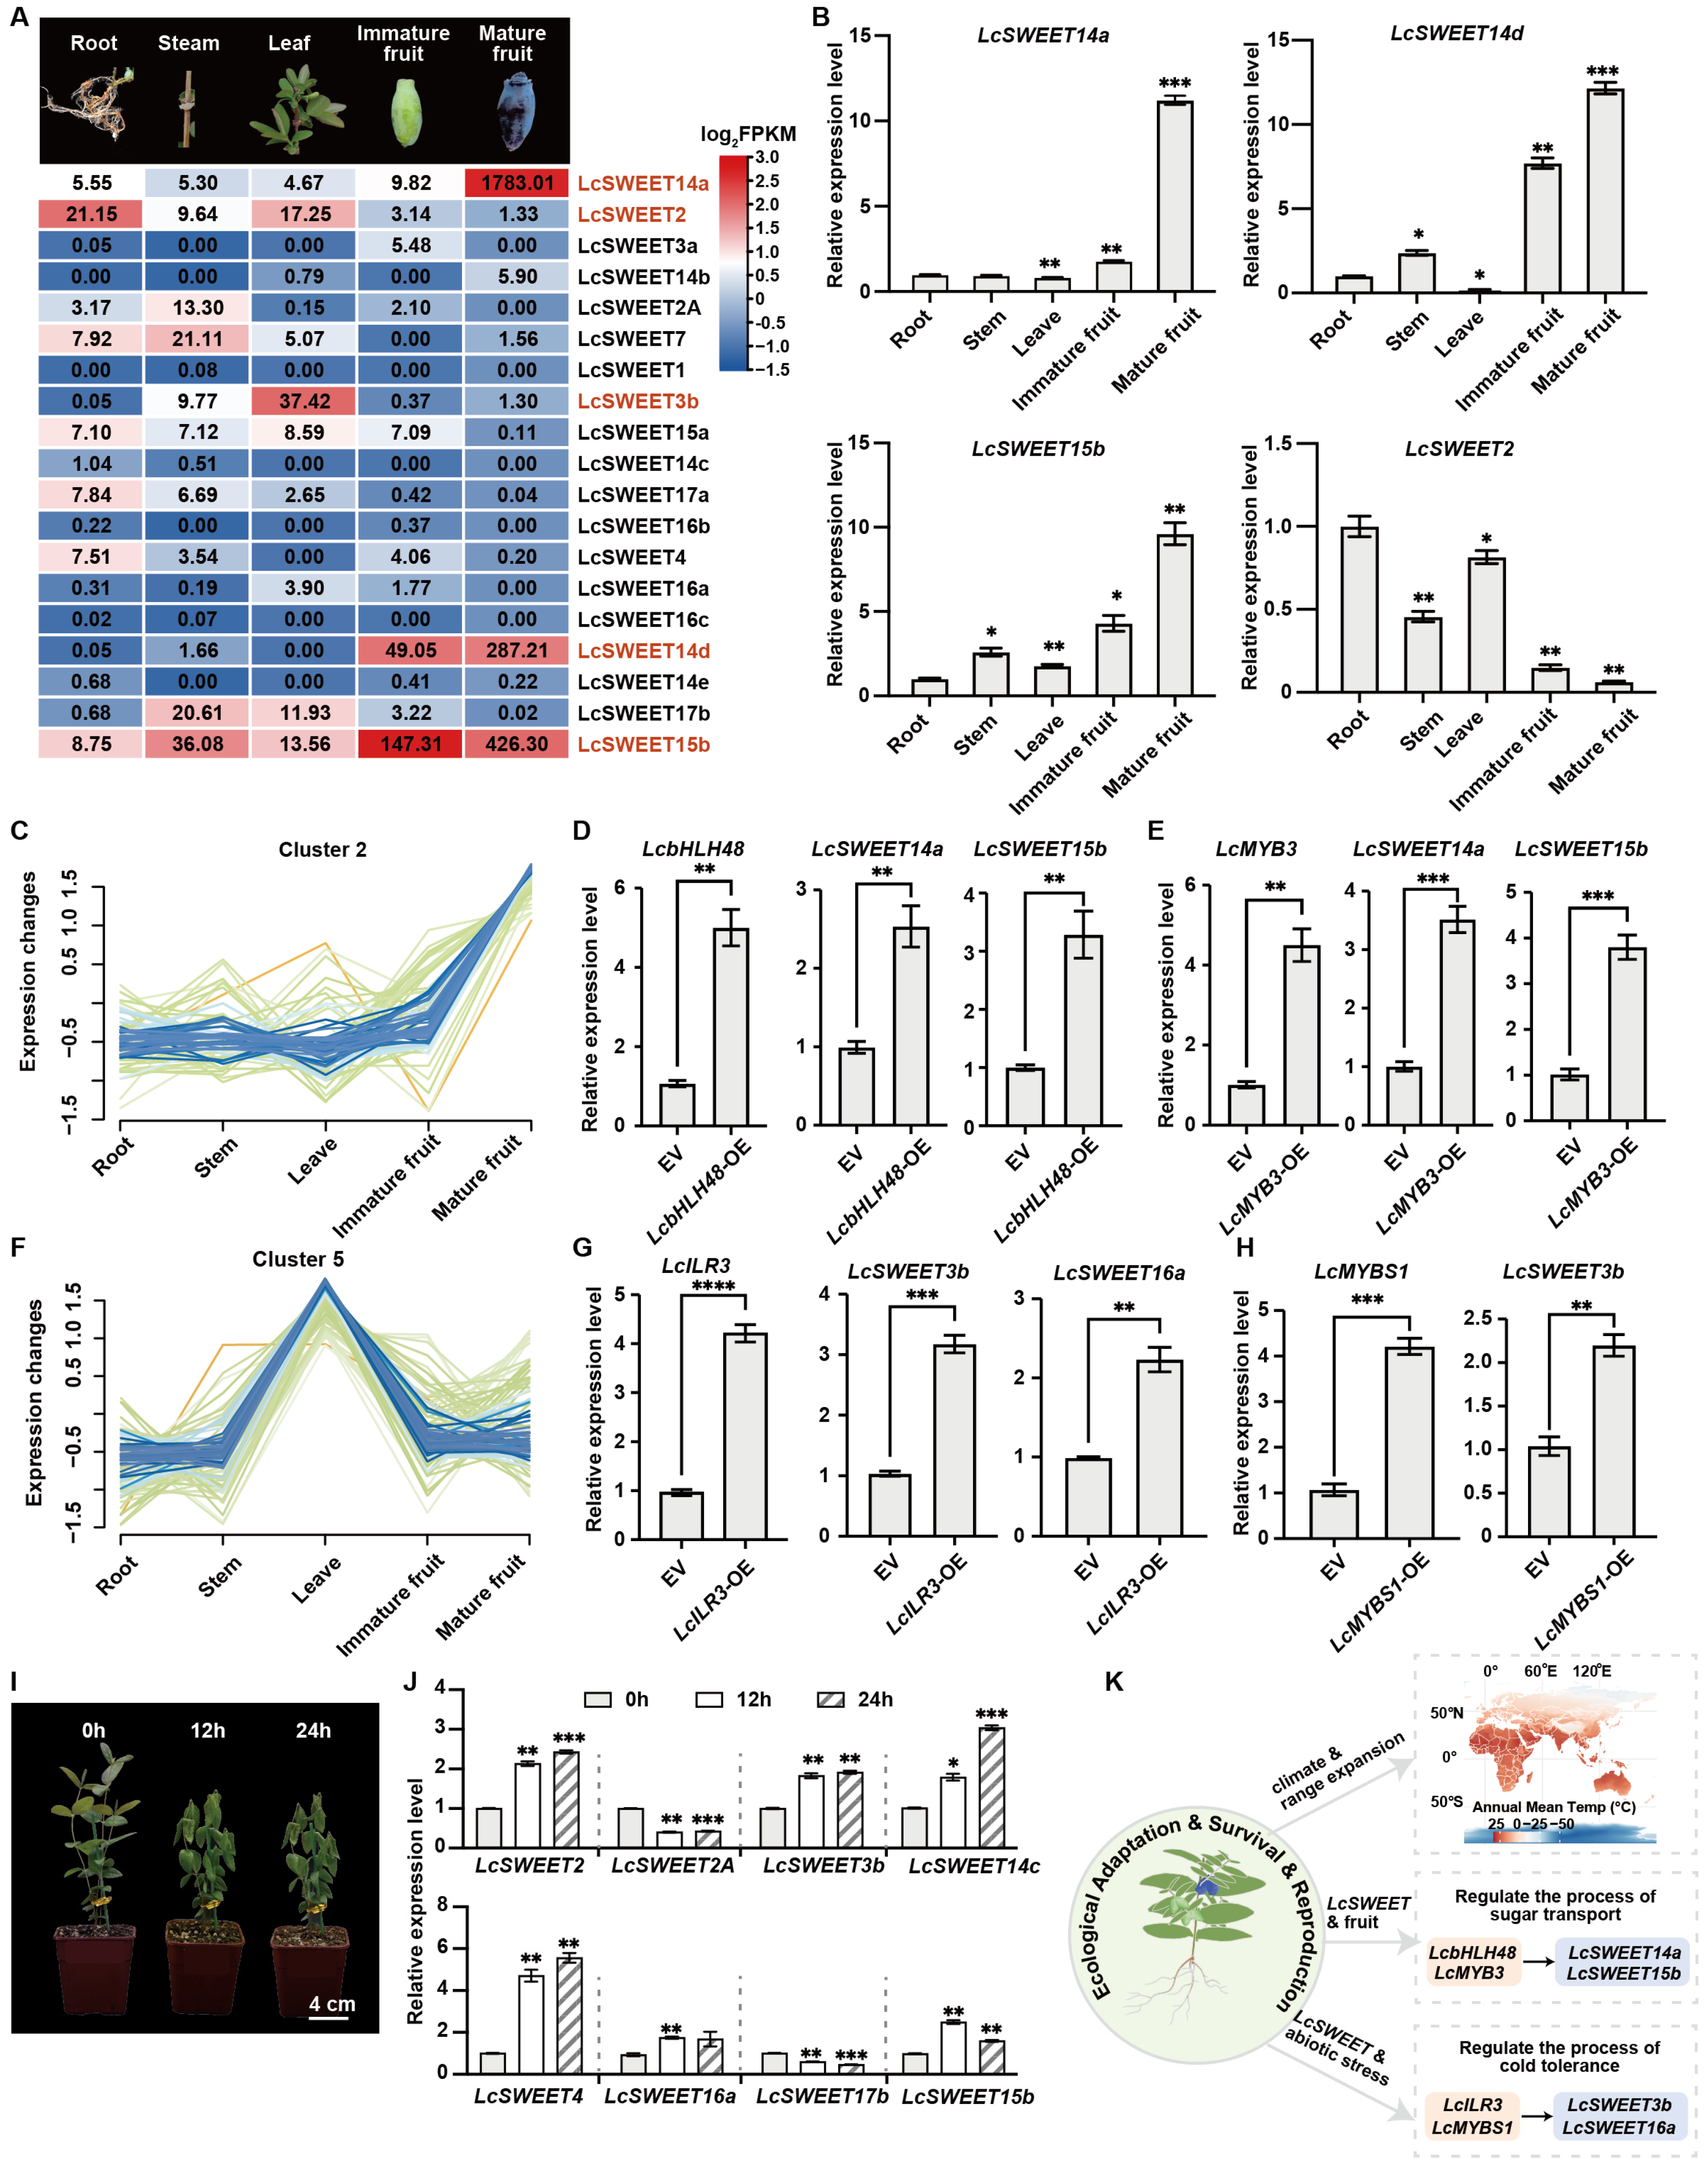
The LcSWEETs exhibited complex and tissue-specific expression patterns across different tissues (Figure 6A). Specifically, LcSWEET14a, LcSWEET14d, and LcSWEET15b were specifically and highly expressed in mature fruits (FPKM > 100). LcSWEET2 showed the highest expression in roots, while LcSWEET3b was predominantly expressed in leaves. In contrast, LcSWEET14b, LcSWEET14c, LcSWEET16b, LcSWEET16c, and LcSWEET14e were barely expressed in any tissue. The qRT-PCR results were highly consistent with the transcriptome data (Figure 6B). The high expression patterns of LcSWEET14a, LcSWEET14d, and LcSWEET15b suggest they play a key role during fruit maturation, confirming significant functional differentiation among these genes. Using the Mfuzz (R package) to cluster genes with similar expression patterns (Supplementary Figure S5), we identified a co-expression module (Cluster 2) highly correlated with the fruit maturation process, where gene expression levels rose sharply in the late stages of fruit development (Figure 6C). Given that the promoter regions of LcSWEETs are enriched with MYB and bHLH binding sites, we selected two transcription factors, LcbHLH48 and LcMYB3, from this module, which showed high expression levels and trends consistent with LcSWEETs. Transient overexpression assays demonstrated that both LcbHLH48 and LcMYB3 significantly upregulated the expression of LcSWEET14a and LcSWEET15b (Figure 6D,E), suggesting that LcbHLH48 and LcMYB3 likely function as positive regulators. Similarly, Cluster 5 represents genes highly expressed in leaves (Figure 6F). LcILR3 was found to positively regulate both LcSWEET3b and LcSWEET16a, while LcMYBS1 positively regulated LcSWEET3b (Figure 6G,H). To determine whether LcbHLH48 and LcMYB3 directly regulate LcSWEET14a and LcSWEET15b, we conducted dual luciferase reporter gene assays on N. benthamiana leaves. The results indicated that LcbHLH48 could activate the expression of LcSWEET15b (Supplementary Figure S6).
Considering the widespread presence of LTR elements in the promoters of LcSWEETs, we further investigated the expression patterns of this gene family under cold stress (Figure 6I). The qRT-PCR results revealed that 8 LcSWEETs responded significantly to low temperature (Figure 6J). Notably, LcSWEET2, LcSWEET4, LcSWEET3b, and LcSWEET14c were significantly upregulated after cold treatment, indicating that they may assist the plant in resisting cold stress by participating in cellular osmotic adjustment. Interestingly, the fruit-specific gene LcSWEET15b was also significantly upregulated after cold treatment.

4. Discussion

4.1. Spatiotemporal Dynamics of the Distribution Pattern of L. caerulea Under Climate Change

The geographical distribution patterns of species are strictly constrained by climatic factors [30,31,32]. Based on variable correlation, the contribution rates of the MaxEnt model, and Jackknife tests, we identified Annual Mean Temperature (Bio1), Precipitation of Warmest Quarter (Bio18), and Precipitation of Driest Month (Bio14) as the primary factors limiting the distribution of L. caerulea (Supplementary Table S3). The growth of L. caerulea is closely related to photosynthetic efficiency, water use, and physiological adaptation to temperature extremes; notably, extremely small or large diurnal temperature ranges appear detrimental (Figure 1). Driven by a combination of temperature, precipitation, and topographic wetness, L. caerulea exhibits unique ecological niche requirements. It is a typical psychrophilic and hygrophilous species, preferring an annual mean temperature of approximately 5–6 °C, while demanding high precipitation during the growing season and showing sensitivity to drought. Furthermore, moderate diurnal temperature ranges and well-drained soil conditions are critical for its survival. These environmental preferences collectively shape the current distribution pattern of L. caerulea, which is concentrated in north temperate and cold temperate zones, particularly in regions with sufficient water availability but without excessive soil moisture.
Regarding spatiotemporal dynamics, L. caerulea exhibits significant distributional shifts. There is a hypothesis that the dispersal and diversification of the genus Lonicera were driven by the uplift of the Qinghai–Tibet Plateau [33]. Although the species is thought to have originated on the Qinghai–Tibet Plateau, our study found that during the LGM, its distribution was concentrated not only on the Qinghai–Tibet Plateau but also around the European Alps, suggesting complex distributional dynamics during glacial periods. More importantly, projections from the optimized MaxEnt model consistently indicate a significant poleward expansion of suitable habitats for L. caerulea in the future, particularly into regions such as the Taymyr Peninsula, Yakutia, and the Chukotka Peninsula in northern Russia. This suggests that rising temperatures under global warming may drive the continuous northward migration of the species’ distribution boundary toward the Arctic Circle, a trend consistent with the poleward migration observed in many other plants [34,35]. Our future projections are based on a single global climate model (BCC-CSM2-MR), which represents a limitation in capturing the full range of climate-model uncertainty. Furthermore, like most macro-ecological niche models, our projections do not explicitly incorporate dispersal limitations, potential biotic interactions, and non-climatic constraints that could further refine actual range boundaries. BCC-CSM2-MR was selected because it has been widely validated in the Northern Hemisphere. Therefore, while our results provide valuable insights into potential distribution trends, the exact extent of these spatial shifts should be interpreted with caution.

4.2. Established Transcriptional Regulatory Module of LcSWEETs in Fruit Maturation

SWEETs are a vital class of sugar transporters that play important roles in plant growth and development, abiotic stress responses, and pathogen resistance [36]. SWEET genes in plants exhibit a degree of consistency and conservation during evolution [36,37]. We identified 19 LcSWEET genes, which clustered into four clades (Clusters I–IV), consistent with findings in Arabidopsis, foxtail millet, and rice [38]. Tissue-specific expression profiles of SWEET genes can provide meaningful insights into their functional divergence during plant development. For instance, OsSWEET1a and OsSWEET4 are highly expressed in rice panicles and are key genes affecting reproductive organ development [39]. In Arabidopsis, AtSWEET16 and AtSWEET17 are specifically expressed in leaves and roots, localized to the vacuolar membrane, where they regulate growth and cold tolerance [9,40,41]. In L. caerulea, LcSWEET14a and LcSWEET15b were specifically and highly expressed in fruits and were positively regulated by LcbHLH48 and LcMYB3. Our results, particularly the dual-luciferase validation, demonstrate that LcbHLH48 activates LcSWEET15b. This evidence points toward a putative regulatory module controlling sugar accumulation during fruit maturation, thereby playing a significant role in determining fruit quality and flavor.

4.3. Potential Involvement of LcSWEETs in Cold Stress Response

Sugars serve not only as energy sources but also as crucial cryoprotectants and signaling molecules [42]. Increased expression of SWEET transporters under cold stress may facilitate controlled sugar transport to maintain cellular osmotic balance, provide metabolic energy for repair, and promote cold acclimation [36,43,44]. In winter Brassica rapa, BraSWEET10 localizes to the plasma membrane, and transgenic plants overexpressing this gene exhibit significantly greater root length under low-temperature conditions compared to the wild type, actively responding to cold stress [12]. Similarly, CsLHY positively regulates cold tolerance in Camellia sinensis via a CsSWEET17 and CBF-dependent pathway [11]. We found that the promoter regions of LcSWEET genes are enriched with elements related to hormone, light, stress response, and growth and development (Figure 5), suggesting a potential capacity to respond to complex environmental signals. Several LcSWEET genes (LcSWEET2, LcSWEET4, LcSWEET3b, and LcSWEET14c) were significantly upregulated under −4 °C treatment. This transcriptional responsiveness to moderate frost suggests that LcSWEETs contribute significantly to seedling survival during unpredictable cold spells in the field. Such physiological robustness in the early growth stages likely serves as a functional prerequisite for the species’ ability to expand into and colonize the extreme environments of Northern Russia and the Arctic Circle, as projected in our distribution models. While these expression patterns and the presence of LTR elements are indicative of a possible role in cold tolerance, this functional connection remains to be confirmed by direct regulatory or functional assays in future studies.
The role of LcSWEETs in cold tolerance and fruit development may reflect a broader principle observed in stress biology: the interplay between primary metabolism and stress defense pathways is essential for maintaining cellular homeostasis under adverse conditions [45]. Similarly, in L. caerulea, cold stress may trigger a coordinated response wherein LcSWEETs not only facilitate sugar transport for osmotic adjustment but also provide carbon skeletons and energy for the biosynthesis of antioxidant compounds, thereby mitigating oxidative damage. Such functional integration is consistent with the emerging view that sugars act not only as energy sources and osmolytes but also as signaling molecules that coordinate stress responses with growth and development.
The role of the LcSWEET gene family in cold tolerance and fruit maturation represents a significant finding that generates testable hypotheses for future research. While our data demonstrate that specific LcSWEETs respond to cold stress and are regulated by transcription factors, we clarify that these molecular observations cannot be directly extrapolated to explain species-level distribution patterns. Future studies should investigate whether natural variation in LcSWEET expression correlates with climatic gradients across the L. caerulea range, and whether functional differences among alleles contribute to local adaptation. Such population-genomic and ecological genetic approaches would provide the direct evidence needed to link molecular function with distribution dynamics. Nonetheless, our findings offer valuable molecular targets for breeding programs aimed at improving both fruit quality and stress tolerance. This targeted breeding framework can be further expanded by drawing parallels with adaptive performance paradigms in other high-value economic or asexually propagated crops [46,47]. For instance, multi-site evaluations and multivariate performance analyses in Crocus sativus have demonstrated that despite limited genetic variability, significant phenotypic plasticity and ecotypic variations govern both vegetative growth and reproductive productivity across contrasting environments, particularly in coastal fields [46,47]. It underscores that leveraging such multi-level genetic-environmental networks represents a potential framework closely associated with plant ecological plasticity and optimizing sustainable cultivation under global climate change.
Despite these intriguing findings, we acknowledge that the molecular validation in this study has certain limitations. While our transient overexpression and dual-luciferase assays provide preliminary evidence for regulatory relationships (e.g., LcbHLH48 regulating LcSWEET15b), stronger mechanistic support is required. Future studies should incorporate direct binding assays, such as Electrophoretic Mobility Shift Assays (EMSA) or Yeast One-Hybrid (Y1H) systems, to confirm direct transcriptional regulation. Furthermore, to fully elucidate the physiological roles of LcSWEETs in ecological adaptation and fruit development, subsequent research must include in vivo transporter function assays, stable genetic transformation studies, and direct correlations of gene expression dynamics with precise sugar content measurements. These integrated approaches will be critical for transitioning our current putative models into validated mechanistic pathways.

5. Conclusions

This study integrated ecological and transcriptomic approaches to predict the distribution patterns of L. caerulea across different periods, identify the LcSWEET gene family, and reveal its roles in fruit maturation and cold tolerance. The results indicate that the geographical distribution of L. caerulea is primarily constrained by low temperature and precipitation environmental factors. Under future global warming scenarios, its suitable habitats are predicted by the BCC-CSM2-MR model to expand significantly towards higher latitudes. We acknowledge that relying on a single climate model is a limitation of this study, and these predictions should be viewed as potential trajectories rather than absolute certainties. We identified 19 LcSWEETs that exhibit distinct functional divergence. The LcSWEET gene family exhibits functional diversification, with different members specialized either in fruit development or in cold stress response. LcSWEET14a and LcSWEET15b are positively regulated by transcription factors LcbHLH48 and LcMYB3, controlling fruit maturation, while several LcSWEETs (LcSWEET2, LcSWEET4, LcSWEET3b, and LcSWEET14c) are significantly upregulated under cold conditions, suggesting a potential role in surviving growing-season frost events. By facilitating rapid osmotic adjustment in seedlings, these molecular responses provide a mechanistic basis for the species’ high ecological plasticity. However, whether this transcriptional response contributes to its broad distribution in cold environments remains to be tested through population-level studies linking genetic variation or expression differences to climatic gradients.

Supplementary Materials

The following supporting information can be downloaded at: https://www.mdpi.com/article/10.3390/horticulturae12060685/s1; Supplementary Figure S1: Heatmap of correlations among 21 environmental variables; Supplementary Figure S2: MaxEnt distribution prediction maps showing continuous habitat suitability indices under different climate scenarios (paleoclimate, current, and future); Supplementary Figure S3: Phylogenetic tree of 30 species; Supplementary Figure S4: Cluster analysis of gene expression patterns across different tissues; Supplementary Figure S5: Co-expression trends of LcSWEET genes and transcription factors across various L. caerulea tissues; Supplementary Figure S6: Representative image of enhanced LUC activity in N. benthamiana leaves as a result of LcbHLH48 binding to the LcSWEET5b promoter; Supplementary Table S1: Environmental variables used in this study; Supplementary Table S2: The primers used in this study; Supplementary Table S3: Contribution percentages and permutation importance values for each environmental variable; Supplementary Table S4: Contribution percentages and permutation importance values for each environmental variable; Supplementary Table S5: The relevant statistics from MaxEnt replicate runs.

Author Contributions

Conceptualization, D.M., X.L., Q.Y. and T.W.; methodology, T.W., H.C. and T.D.; investigation, T.W. and C.Q.; data curation, F.X., C.Q. and Y.C.; writing—original draft preparation, T.W. and F.X.; writing—review and editing, D.M., X.L. and Q.Y.; visualization, T.W.; funding acquisition, D.M., X.L. and Q.Y. All authors have read and agreed to the published version of the manuscript.

Funding

This work was supported by the National Key R&D Program of China (2022YFD2200603), National Natural Science Foundation of China (32271831 and 32401533), Engineering Research & Innovation Team Project of Beijing Forestry University (BLRC2023C01) and Science and Technology Innovation Programs of Beijing Forestry University (2025ZLXD02).

Data Availability Statement

The original contributions presented in this study are included in the article/Supplementary Materials. The transcriptome sequences have been submitted to the National Genomics Data Center (BioProject ID PRJCA042036). Further inquiries can be directed to the corresponding author.

Conflicts of Interest

Author Yajuan Cui was employed by the company Beijing Institute of Nutritional Resources Co., Ltd. The remaining authors declare that the research was conducted in the absence of any commercial or financial relationships that could be construed as a potential conflict of interest.

References

  1. Parmesan, C. Ecological and evolutionary responses to recent climate change. Annu. Rev. Ecol. Evol. Syst. 2006, 37, 637–669. [Google Scholar] [CrossRef]
  2. Adamo, N.; Al-Ansari, N.; Sissakian, V. Review of climate change impacts on human environment: Past, present and future projections. Engineering 2021, 13, 605–630. [Google Scholar] [CrossRef]
  3. Wiesner, S.; Bechtel, B.; Fischereit, J.; Gruetzun, V.; Hoffmann, P.; Leitl, B.; Rechid, D.; Schlünzen, K.H.; Thomsen, S. Is it possible to distinguish global and regional climate change from urban land cover induced signals? A mid-latitude city example. Urban Sci. 2018, 2, 12. [Google Scholar] [CrossRef]
  4. Cheng, Z.; Bao, Y.; Li, Z.; Wang, J.; Wang, M.; Wang, S.; Wang, Y.; Wang, Y.; Li, B. Lonicera caerulea (Haskap berries): A review of development traceability, functional value, product development status, future opportunities, and challenges. Crit. Rev. Food Sci. Nutr. 2023, 63, 8992–9016. [Google Scholar] [CrossRef] [PubMed]
  5. Yang, H.; Zhang, X.; Yu, C.; Wang, Z.; Hao, R.; Wang, C.; Zhang, B.; Shi, J.; Li, J.; Qin, D. Diversity of Phenological Characteristics and Fruit Quality of the Chinese Honeyberry (Lonicera caerulea L.) Collection. Agriculture 2026, 16, 291. [Google Scholar] [CrossRef]
  6. Breia, R.; Conde, A.; Badim, H.; Fortes, A.M.; Gerós, H.; Granell, A. Plant SWEETs: From sugar transport to plant–pathogen interaction and more unexpected physiological roles. Plant Physiol. 2021, 186, 836–852. [Google Scholar] [CrossRef] [PubMed]
  7. Chardon, F.; Bedu, M.; Calenge, F.; Klemens, P.A.; Spinner, L.; Clement, G.; Chietera, G.; Léran, S.; Ferrand, M.; Lacombe, B. Leaf fructose content is controlled by the vacuolar transporter SWEET17 in Arabidopsis. Curr. Biol. 2013, 23, 697–702. [Google Scholar] [CrossRef]
  8. Chen, L.-Q.; Hou, B.-H.; Lalonde, S.; Takanaga, H.; Hartung, M.L.; Qu, X.-Q.; Guo, W.-J.; Kim, J.-G.; Underwood, W.; Chaudhuri, B. Sugar transporters for intercellular exchange and nutrition of pathogens. Nature 2010, 468, 527–532. [Google Scholar] [CrossRef]
  9. Eom, J.-S.; Chen, L.-Q.; Sosso, D.; Julius, B.T.; Lin, I.; Qu, X.-Q.; Braun, D.M.; Frommer, W.B. SWEETs, transporters for intracellular and intercellular sugar translocation. Curr. Opin. Plant Biol. 2015, 25, 53–62. [Google Scholar] [CrossRef]
  10. Anjali, A.; Fatima, U.; Manu, M.; Ramasamy, S.; Senthil-Kumar, M. Structure and regulation of SWEET transporters in plants: An update. Plant Physiol. Biochem. 2020, 156, 1–6. [Google Scholar] [CrossRef]
  11. Zhang, C.; Li, Y.; Wang, J.; Xue, X.; Beuchat, G.; Chen, L.Q. Two evolutionarily duplicated domains individually and post-transcriptionally control SWEET expression for phloem transport. New Phytol. 2021, 232, 1793–1807. [Google Scholar] [CrossRef]
  12. Xue, X.; Beuchat, G.; Wang, J.; Yu, Y.-C.; Moose, S.; Chen, J.; Chen, L.-Q. Sugar accumulation enhancement in sorghum stem is associated with reduced reproductive sink strength and increased phloem unloading activity. Front. Plant Sci. 2023, 14, 1233813. [Google Scholar] [CrossRef]
  13. Wang, S.; Liu, S.; Wang, J.; Yokosho, K.; Zhou, B.; Yu, Y.-C.; Liu, Z.; Frommer, W.B.; Ma, J.F.; Chen, L.-Q. Simultaneous changes in seed size, oil content and protein content driven by selection of SWEET homologues during soybean domestication. Natl. Sci. Rev. 2020, 7, 1776–1786. [Google Scholar] [CrossRef]
  14. Wu, Y.; Di, T.; Wu, Z.; Peng, J.; Wang, J.; Zhang, K.; He, M.; Li, N.; Hao, X.; Fang, W. CsLHY positively regulates cold tolerance by activating CsSWEET17 in tea plants. Plant Physiol. Biochem. 2024, 207, 108341. [Google Scholar] [CrossRef] [PubMed]
  15. Yue, J.; Yuan, S.; Liu, L.; Niu, Z.; Ma, L.; Pu, Y.; Wu, J.; Fang, Y.; Sun, W. Genome-wide identification of the SWEET gene family and functional analysis of BraSWEET10 in winter B. Rapa (Brassica rapa L.) under low-temperature stress. Int. J. Mol. Sci. 2025, 26, 2398. [Google Scholar] [CrossRef]
  16. Holubec, V.; Smekalova, T.; Leisova-Svobodova, L. Morphological and molecular evaluation of the Far East fruit genetic resources of Lonicera caerulea L.—Vegetation, ethnobotany, use and conservation. Genet. Resour. Crop Evol. 2019, 66, 121–141. [Google Scholar] [CrossRef]
  17. GBIF Backbone Taxonomy. Available online: https://doi.org/10.15468/39omei (accessed on 10 January 2026). [CrossRef]
  18. Warren, D.L.; Glor, R.E.; Turelli, M. ENMTools: A toolbox for comparative studies of environmental niche models. Ecography 2010, 33, 607–611. [Google Scholar] [CrossRef]
  19. O’Neill, B.C.; Tebaldi, C.; van Vuuren, D.P.; Eyring, V.; Friedlingstein, P.; Hurtt, G.; Knutti, R.; Kriegler, E.; Lamarque, J.-F.; Lowe, J. The Scenario Model Intercomparison Project (ScenarioMIP) for CMIP6. Geosci. Model Dev. 2016, 9, 3461–3482. [Google Scholar] [CrossRef]
  20. Riahi, K.; Van Vuuren, D.P.; Kriegler, E.; Edmonds, J.; O’neill, B.C.; Fujimori, S.; Bauer, N.; Calvin, K.; Dellink, R.; Fricko, O. The Shared Socioeconomic Pathways and their energy, land use, and greenhouse gas emissions implications: An overview. Glob. Environ. Change 2017, 42, 153–168. [Google Scholar] [CrossRef]
  21. Zhang, K.; Yao, L.; Meng, J.; Tao, J. Maxent modeling for predicting the potential geographical distribution of two peony species under climate change. Sci. Total Environ. 2018, 634, 1326–1334. [Google Scholar] [CrossRef]
  22. Zheng, Y.; Yuan, C.; Matsushita, N.; Lian, C.; Geng, Q. Analysis of the distribution pattern of the ectomycorrhizal fungus Cenococcum geophilum under climate change using the optimized M ax E nt model. Ecol. Evol. 2023, 13, e10565. [Google Scholar] [CrossRef]
  23. Gibicsár, S.; Somfalvi-Tóth, K.; Keszthelyi, S. Future projection of habitat suitability and potential distribution of main European cereal bugs using MaxEnt modelling. Agric. For. Entomol. 2026, 1–15. [Google Scholar] [CrossRef]
  24. Zhao, Y.; Zhang, L.; Wang, C. Predicting possible distribution of rice leaf roller (Cnaphalocrocis medinalis) under climate change scenarios using MaxEnt model in China. Sci. Rep. 2024, 14, 21245. [Google Scholar] [CrossRef]
  25. Merow, C.; Smith, M.J.; Silander, J.A., Jr. A practical guide to MaxEnt for modeling species’ distributions: What it does, and why inputs and settings matter. Ecography 2013, 36, 1058–1069. [Google Scholar] [CrossRef]
  26. Adhikari, P.; Shin, M.-S.; Jeon, J.-Y.; Kim, H.W.; Hong, S.; Seo, C. Potential impact of climate change on the species richness of subalpine plant species in the mountain national parks of South Korea. J. Ecol. Environ. 2018, 42, 36. [Google Scholar] [CrossRef]
  27. Liu, C.; White, M.; Newell, G. Selecting thresholds for the prediction of species occurrence with presence-only data. J. Biogeogr. 2013, 40, 778–789. [Google Scholar] [CrossRef]
  28. Bolger, A.M.; Lohse, M.; Usadel, B. Trimmomatic: A flexible trimmer for Illumina sequence data. Bioinformatics 2014, 30, 2114–2120. [Google Scholar] [CrossRef] [PubMed]
  29. Pertea, M.; Kim, D.; Pertea, G.M.; Leek, J.T.; Salzberg, S.L. Transcript-level expression analysis of RNA-seq experiments with HISAT, StringTie and Ballgown. Nat. Protoc. 2016, 11, 1650–1667. [Google Scholar] [CrossRef] [PubMed]
  30. Thuiller, W.; Lavorel, S.; Araújo, M.B. Niche properties and geographical extent as predictors of species sensitivity to climate change. Glob. Ecol. Biogeogr. 2005, 14, 347–357. [Google Scholar] [CrossRef]
  31. Kleidon, A.; Mooney, H.A. A global distribution of biodiversity inferred from climatic constraints: Results from a process-based modelling study. Glob. Change Biol. 2000, 6, 507–523. [Google Scholar] [CrossRef]
  32. Huang, E.; Chen, Y.; Fang, M.; Zheng, Y.; Yu, S. Environmental drivers of plant distributions at global and regional scales. Glob. Ecol. Biogeogr. 2021, 30, 697–709. [Google Scholar] [CrossRef]
  33. Yang, X.L.; Sun, Q.H.; Morales-Briones, D.F.; Landis, J.B.; Chen, D.J.; Wang, H.X.; Wen, J.; Wang, H.F. New insights into infrageneric relationships of Lonicera (Caprifoliaceae) as revealed by nuclear ribosomal DNA cistron data and plastid phylogenomics. J. Syst. Evol. 2024, 62, 333–357. [Google Scholar] [CrossRef]
  34. Chang, X.; Yu, L.; Yan, Z.; Bao, L.; Li, X. Global warming enhances soybean suitability and yield potential in the mid-high latitude amur river basin. Clim. Smart Agric. 2026, 3, 100099. [Google Scholar] [CrossRef]
  35. Wu, Z.; Fu, Y.H.; Crowther, T.W.; Wang, S.; Gong, Y.; Zhang, J.; Zhao, Y.P.; Janssens, I.; Penuelas, J.; Zohner, C.M. Poleward shifts in the maximum of spring phenological responsiveness of Ginkgo biloba to temperature in China. New Phytol. 2023, 240, 1421–1432. [Google Scholar] [CrossRef]
  36. Singh, J.; Das, S.; Jagadis Gupta, K.; Ranjan, A.; Foyer, C.H.; Thakur, J.K. Physiological implications of SWEETs in plants and their potential applications in improving source–sink relationships for enhanced yield. Plant Biotechnol. J. 2023, 21, 1528–1541. [Google Scholar] [CrossRef]
  37. Li, X.; Ren, Z.; Zhang, Z.; Liu, Y.; He, K.; Zhang, F.; Guo, J.; Wei, S.; Yang, D.; Li, W. Evolutionary trajectory and functional diversity of SWEET sugar transporters in plants. Plant J. 2025, 123, e70334. [Google Scholar] [CrossRef]
  38. Sun, M.; Chen, Y.; Chen, D.-Y.; Yang, Y.; Zhao, M.; Li, Y.; Yang, Y.; Guo, M.; Zhang, L.; Dong, S. Genome-wide identification and expression analysis of the SiSWEET gene family in Setaria italica and functional characterization of the SiSWEET13a in Arabidopsis. Plant Physiol. Biochem. 2025, 227, 110172. [Google Scholar] [CrossRef]
  39. Hu, Z.; Tang, Z.; Zhang, Y.; Niu, L.; Yang, F.; Zhang, D.; Hu, Y. Rice SUT and SWEET transporters. Int. J. Mol. Sci. 2021, 22, 11198. [Google Scholar] [CrossRef]
  40. Guo, W.-J.; Nagy, R.; Chen, H.-Y.; Pfrunder, S.; Yu, Y.-C.; Santelia, D.; Frommer, W.B.; Martinoia, E. SWEET17, a facilitative transporter, mediates fructose transport across the tonoplast of Arabidopsis roots and leaves. Plant Physiol. 2014, 164, 777–789. [Google Scholar] [CrossRef]
  41. Klemens, P.A.; Patzke, K.; Deitmer, J.; Spinner, L.; Le Hir, R.; Bellini, C.; Bedu, M.; Chardon, F.; Krapp, A.; Neuhaus, H.E. Overexpression of the vacuolar sugar carrier AtSWEET16 modifies germination, growth, and stress tolerance in Arabidopsis. Plant Physiol. 2013, 163, 1338–1352. [Google Scholar] [CrossRef]
  42. Wang, T.; Miao, M.; Zhao, J.; Kumar, A.; Li, X. Sugars Integrate External and Internal Signals in Regulating Shoot Branching. Plant Cell Environ. 2025, 48, 8688–8701. [Google Scholar] [CrossRef] [PubMed]
  43. Liu, J.; Du, C.; Zhao, P.; Yang, S.; Zhong, H.; Zang, S.; Wu, B.; Zhang, Z.; Luo, J.; Que, Y. The interplay between ScSWEET11 promoters and Paracidovorax avenae effectors regulate resistance in sugarcane. Plant J. 2025, 122, e70255. [Google Scholar] [CrossRef] [PubMed]
  44. Xue, X.; Wang, J.; Shukla, D.; Cheung, L.S.; Chen, L.-Q. When SWEETs turn tweens: Updates and perspectives. Annu. Rev. Plant Biol. 2022, 73, 379–403. [Google Scholar] [CrossRef]
  45. Ying, D.; Chen, X.; Hou, J.; Zhao, F.; Li, P. Soil properties and microbial functional attributes drive the response of soil multifunctionality to long-term fertilization management. Appl. Soil Ecol. 2023, 192, 105095. [Google Scholar] [CrossRef]
  46. El Caid, M.B.; Lachheb, M.; Lagram, K.; Wang, X.; Serghini, M.A. Ecotypic variation and environmental influence on saffron (Crocus sativus L.) vegetative growth: A multivariate performance analysis. J. Appl. Res. Med. Aromat. Plants 2024, 43, 100601. [Google Scholar] [CrossRef]
  47. El Caid, M.B.; Salaka, L.; El Merzougui, S.; Lachguer, K.; Lagram, K.; El Mousadik, A.; Serghini, M.A. Multi-site evaluation of the productivity among saffron (Crocus sativus L.) for clonal selection purposes. J. Appl. Res. Med. Aromat. Plants 2020, 17, 100248. [Google Scholar] [CrossRef]
Figure 1. Environmental factors influencing the distribution patterns of L. caerulea and their response curves. The final MaxEnt model was constructed using the five environmental variables retained after filtering: Bio1, Bio2, Bio14, Bio18, and TWI. (A) Distribution patterns of L. caerulea natural populations across Eurasia. Occurrence points were obtained from GBIF [17]. (BF) The response curves of the main environmental factors to the potential existence probability of L. caerulea. The Y-axis represents the probability of presence, and the X-axis represents the environmental factor gradient. (B) Annual Mean Temperature (Bio1); (C) Precipitation of Driest Month (Bio14); (D) Precipitation of Warmest Quarter (Bio18); (E) Mean Diurnal Range (Bio2); (F) SAGA-GIS Topographic Wetness Index (TWI).
Horticulturae 12 00685 g001
Figure 2. Potential suitable habitats of L. caerulea under different climate scenarios. (A,B) Potential suitable areas under paleoclimate scenarios ((A), Last Glacial Maximum; (B), Mid-Holocene). (C) Potential suitable areas under current climate conditions. (DG) Potential suitable areas under future climate scenarios ((D), 2050 SSP 1–2.6; (E), 2050 SSP 5–8.5; (F), 2070 SSP 1–2.6; (G), 2070 SSP 5–8.5). (H) Relative area of L. caerulea suitable habitat as a proportion of the total study area across different climate scenarios. Green indicates suitable areas, while gray indicates unsuitable areas.
Horticulturae 12 00685 g002
Figure 3. Transcriptome sequencing and gene expression profiles of key tissues in L. caerulea. (A) Schematic diagram of L. caerulea and its various tissues, including root, stem, leaf, immature fruit, and mature fruit. (B) PCA of five tissue samples based on transcriptome data. (C) Box plot illustrating gene expression levels in each tissue sample. (D) UpSet plot showing the number of tissue-specific expressed genes across the five L. caerulea tissues. Horizontal bars represent the total number of expressed genes in each tissue, while vertical bars and connecting lines indicate the number of genes shared among or specific to different tissues.
Horticulturae 12 00685 g003
Figure 4. Functional enrichment analysis of tissue-specific highly expressed genes in L. caerulea. (A) Mfuzz clustering analysis identified expression profiles of tissue-specific highly expressed genes across the five tissues. Specifically, gene sets highly expressed in roots (Profile 0), stems (Profile 12), leaves (Profile 10), immature fruits (Profile 9), and mature fruits (Profile 19) are shown. (BF) KEGG pathway enrichment analysis (left) and GO functional enrichment analysis (right) for gene sets from different tissues.
Horticulturae 12 00685 g004
Figure 5. Identification and basic characterization of LcSWEETs. (A) Phylogenetic tree of LcSWEETs and AtSWEETs. The tree was constructed using the Neighbor-Joining method with 1000 bootstrap replicates. (B) Chromosomal distribution map of LcSWEETs. (C) Conserved motifs of LcSWEETs. (D) Intron-exon structure diagram. (E) Count statistics of cis-acting elements in the promoter regions of LcSWEETs. (F) Bubble chart illustrating the major cis-acting elements in the promoter regions of LcSWEETs.
Horticulturae 12 00685 g005
Figure 6. Expression patterns and regulatory mechanisms of LcSWEETs during fruit development and cold stress response. (A) Expression profiles of the LcSWEETs in different tissues. (B) Validation of relative expression levels of four representative LcSWEETs (LcSWEET14a, LcSWEET14d, LcSWEET15b, LcSWEET2) in different tissues by qRT-PCR. (C,F) Co-expression network analysis identified gene co-expression modules specifically expressed in fruits (Cluster 2) and leaves (Cluster 5). The different colored lines represent the membership values of the gene expression profiles, with blue lines indicating core genes with higher cluster conformity. (D,E) Effect of overexpression of LcbHLH48 and LcMYB3 on the expression levels of LcSWEET14a and LcSWEET15b, respectively. (G,H) Effect of overexpression of LcILR3 and LcMYBS1 on the expression levels of LcSWEET3b and LcSWEET16a, respectively. Asterisks indicate statistical significance compared to the control group (* p < 0.05). (I) Phenotypic changes in plants after treatment at −4 °C for 0 h, 12 h, and 24 h. Scale bar = 4 cm. (J) Expression of LcSWEETs in response to cold stress. Asterisks indicate statistical significance compared to 0 h (* p < 0.05, ** p < 0.01, *** p < 0.001, and **** p < 0.0001). (K) Potential working model of LcSWEET gene family in stress response and reproduction. (B,J) Statistical significance was determined by one-way ANOVA followed by Tukey’s HSD post hoc test. (D,E,G,H) Differences between groups (EV vs. OE) were analyzed using a two-tailed Student’s t-test.
Horticulturae 12 00685 g006
Disclaimer/Publisher’s Note: The statements, opinions and data contained in all publications are solely those of the individual author(s) and contributor(s) and not of MDPI and/or the editor(s). MDPI and/or the editor(s) disclaim responsibility for any injury to people or property resulting from any ideas, methods, instructions or products referred to in the content.