1. Introduction
Quality in agricultural products can no longer be understood as a unidimensional concept, but rather as a complex system where biological, technological, and sociocultural factors interact [
1]. This conceptual evolution responds to the changing demands of contemporary consumers, who increasingly value aspects such as nutritional value and sensory experience, in addition to external appearance [
2]. In the specific case of carrots (
Daucus carota L.), a globally important crop with annual production exceeding 42 million tons, this species represents an excellent model for implementing a holistic quality concept, given its relevance not only for fresh consumption but also for food, nutritional, and animal-sector applications [
3]. Particularly, carrots exhibit remarkable phenotypic variability, and their expression is strongly influenced by environmental conditions, resulting in highly dynamic responses in quality-related traits [
4]. In this sense, it is necessary to understand the dynamics of quality-related traits across different genotypes and under postharvest conditions, whether during storage or at ambient conditions.
Multidimensional food quality refers to the integrated assessment of a product through physicochemical, sensory, nutritional, and functional attributes rather than a single trait [
3,
5]. This perspective is important because food quality emerges from the interaction among these dimensions and strongly influences both consumer acceptance and product value [
3,
5]. Objective measurements, combined with sensory evaluation, provide a more complete basis for defining quality than isolated indicators alone [
6]. In this context, evaluating quality across different genotypes is especially relevant, since plant genetic resources contain wide trait diversity that must be documented through standardized characterization and evaluation systems to support their effective use [
7]. Therefore, multidimensional quality assessment represents a valuable strategy to improve the characterization, valuation, and utilization of genetic resources, helping identify genotypes with desirable attributes for breeding, production, postharvest management, and diversified market applications.
Consumer preferences and multidimensional food quality perception vary significantly across regions, showing marked differences in the evaluation of attributes such as color, texture, and flavor. The dynamics of postharvest quality in carrots pose significant challenges as they show notable differences depending on the genotype. Recent studies have shown that purple genotype can lose up to 50% of their anthocyanins in just four weeks of storage, while orange carrots show a 30% reduction in β-carotene after eight weeks [
8]. These biochemical changes are closely related to organoleptic alterations that directly affect consumer acceptance, particularly in terms of texture and flavor [
6]. However, conventional methods for evaluating these parameters, such as HPLC and spectrophotometry for pigments or trained sensory panels, have significant limitations as they are destructive, costly, time-consuming, and do not allow for continuous monitoring of the same individuals [
9]. This problem is exacerbated by the fact that up to 40% of global agricultural production is lost during storage [
3], largely due to the inability to adequately predict shelf life based on the specific preferences of each market.
In this context, indirect and non-destructive approaches have emerged as robust alternatives to traditional methods for assessing quality attributes in plant products [
10,
11]. Spectral techniques, in particular, enable rapid and objective and repeatable estimation of biochemical compounds by capturing the interaction between light and plant tissues, overcoming limitations associated with destructive, time-consuming, and labor-intensive conventional analyses [
11,
12]. These methods have demonstrated strong potential for quantifying key pigments such as carotenoids and anthocyanins, which are directly associated with nutritional value, physiological status, and visual quality [
13].
Beyond individual trait estimation, there is a growing recognition of the need to assess quality as a multidimensional construct [
3]. This approach integrates physical, biochemical, and sensory-related attributes, providing a more comprehensive understanding of product quality and its evolution over time [
3,
5]. Such multidimensional characterization is particularly relevant for the evaluation and valorization of genetic resources, as it allows for a more accurate identification of genotypes with desirable traits for breeding, storage performance, and market acceptance [
5,
6]. Despite these advances, important knowledge gaps persist regarding the capacity of spectral indices to capture the temporal dynamics of quality during postharvest storage, especially in root vegetables [
14]. In particular, the integration and comparative evaluation of indices targeting different pigments groups, such as carotenoids and anthocyanins, remains largely unexplored [
14,
15]. Addressing these gaps is essential to advance the application of non-destructive sensing technologies in postharvest physiology.
The commercial application of these techniques faces considerable challenges, as most studies have been conducted under controlled laboratory conditions, with limited validation in real-world storage environments [
16]. Furthermore, there is scarce information on the correlations between spectral indices and key sensory parameters for consumers, such as the development of bitter flavors or perceived texture changes [
17]. These limitations become more relevant when considering regional variations in consumption preferences, where Asian markets show growing interest in pigmented genotype with high bioactive compound content [
16], while traditional European markets maintain their preference for specific visual and textural characteristics [
18].
Regardless of the growing diversity of carrot germplasm including pigmented genotypes with contrasting carotenoid and anthocyanin profiles systematic comparative evidence on the temporal dynamics of physicochemical, biofunctional, and consumer-perceived quality attributes across genotypes and storage conditions remains scarce. Most published studies address individual quality dimensions in isolation, focus on a single genotype, or evaluate quality at a single time point, and the potential of non-destructive Vis/NIR spectral indices as pattern detection tools across biochemically diverse carrot material has not been systematically evaluated in parallel with conventional measurements. This study therefore aimed to characterize the postharvest quality dynamics of five carrot genotypes (14BER, 6KUR, white, yellow, and purple) under refrigeration (4 °C) and ambient temperature (15 °C) over 30 days, based on the central hypothesis that quality deterioration is genotype and storage condition-dependent, detectable through multiples direct and indirect analysis, and reflected in identifiable shifts in spontaneous consumer perception over time.
To address this, an exploratory multimodal approach was implemented integrating: direct physicochemical and biofunctional measurements including firmness, color, fresh weight loss, respiration rate, titratable acidity, total soluble solids, and β-carotene quantification by spectrophotometry; a deterministic logarithmic decay model to describe and predict the temporal dynamics of β-carotene degradation as a function of genotype and storage condition; non-destructive Vis/NIR reflectance spectroscopy (350–1900 nm) applied as a pattern detection tool using indices sensitive to anthocyanin content (CRI1, CRI2, mARI) and tissue structural integrity (NDVI); and consumer perception assessment through NLP-based analysis of free-text responses and structured Likert-scale attribute importance rating. This integrative exploratory framework provides a structured evidence base linking instrumental quality dynamics, spectral optical patterns, and consumer perceptual responses, constituting a necessary precursor to validated non-destructive quality monitoring systems for genotypically diverse carrot germplasm.
2. Material and Methods
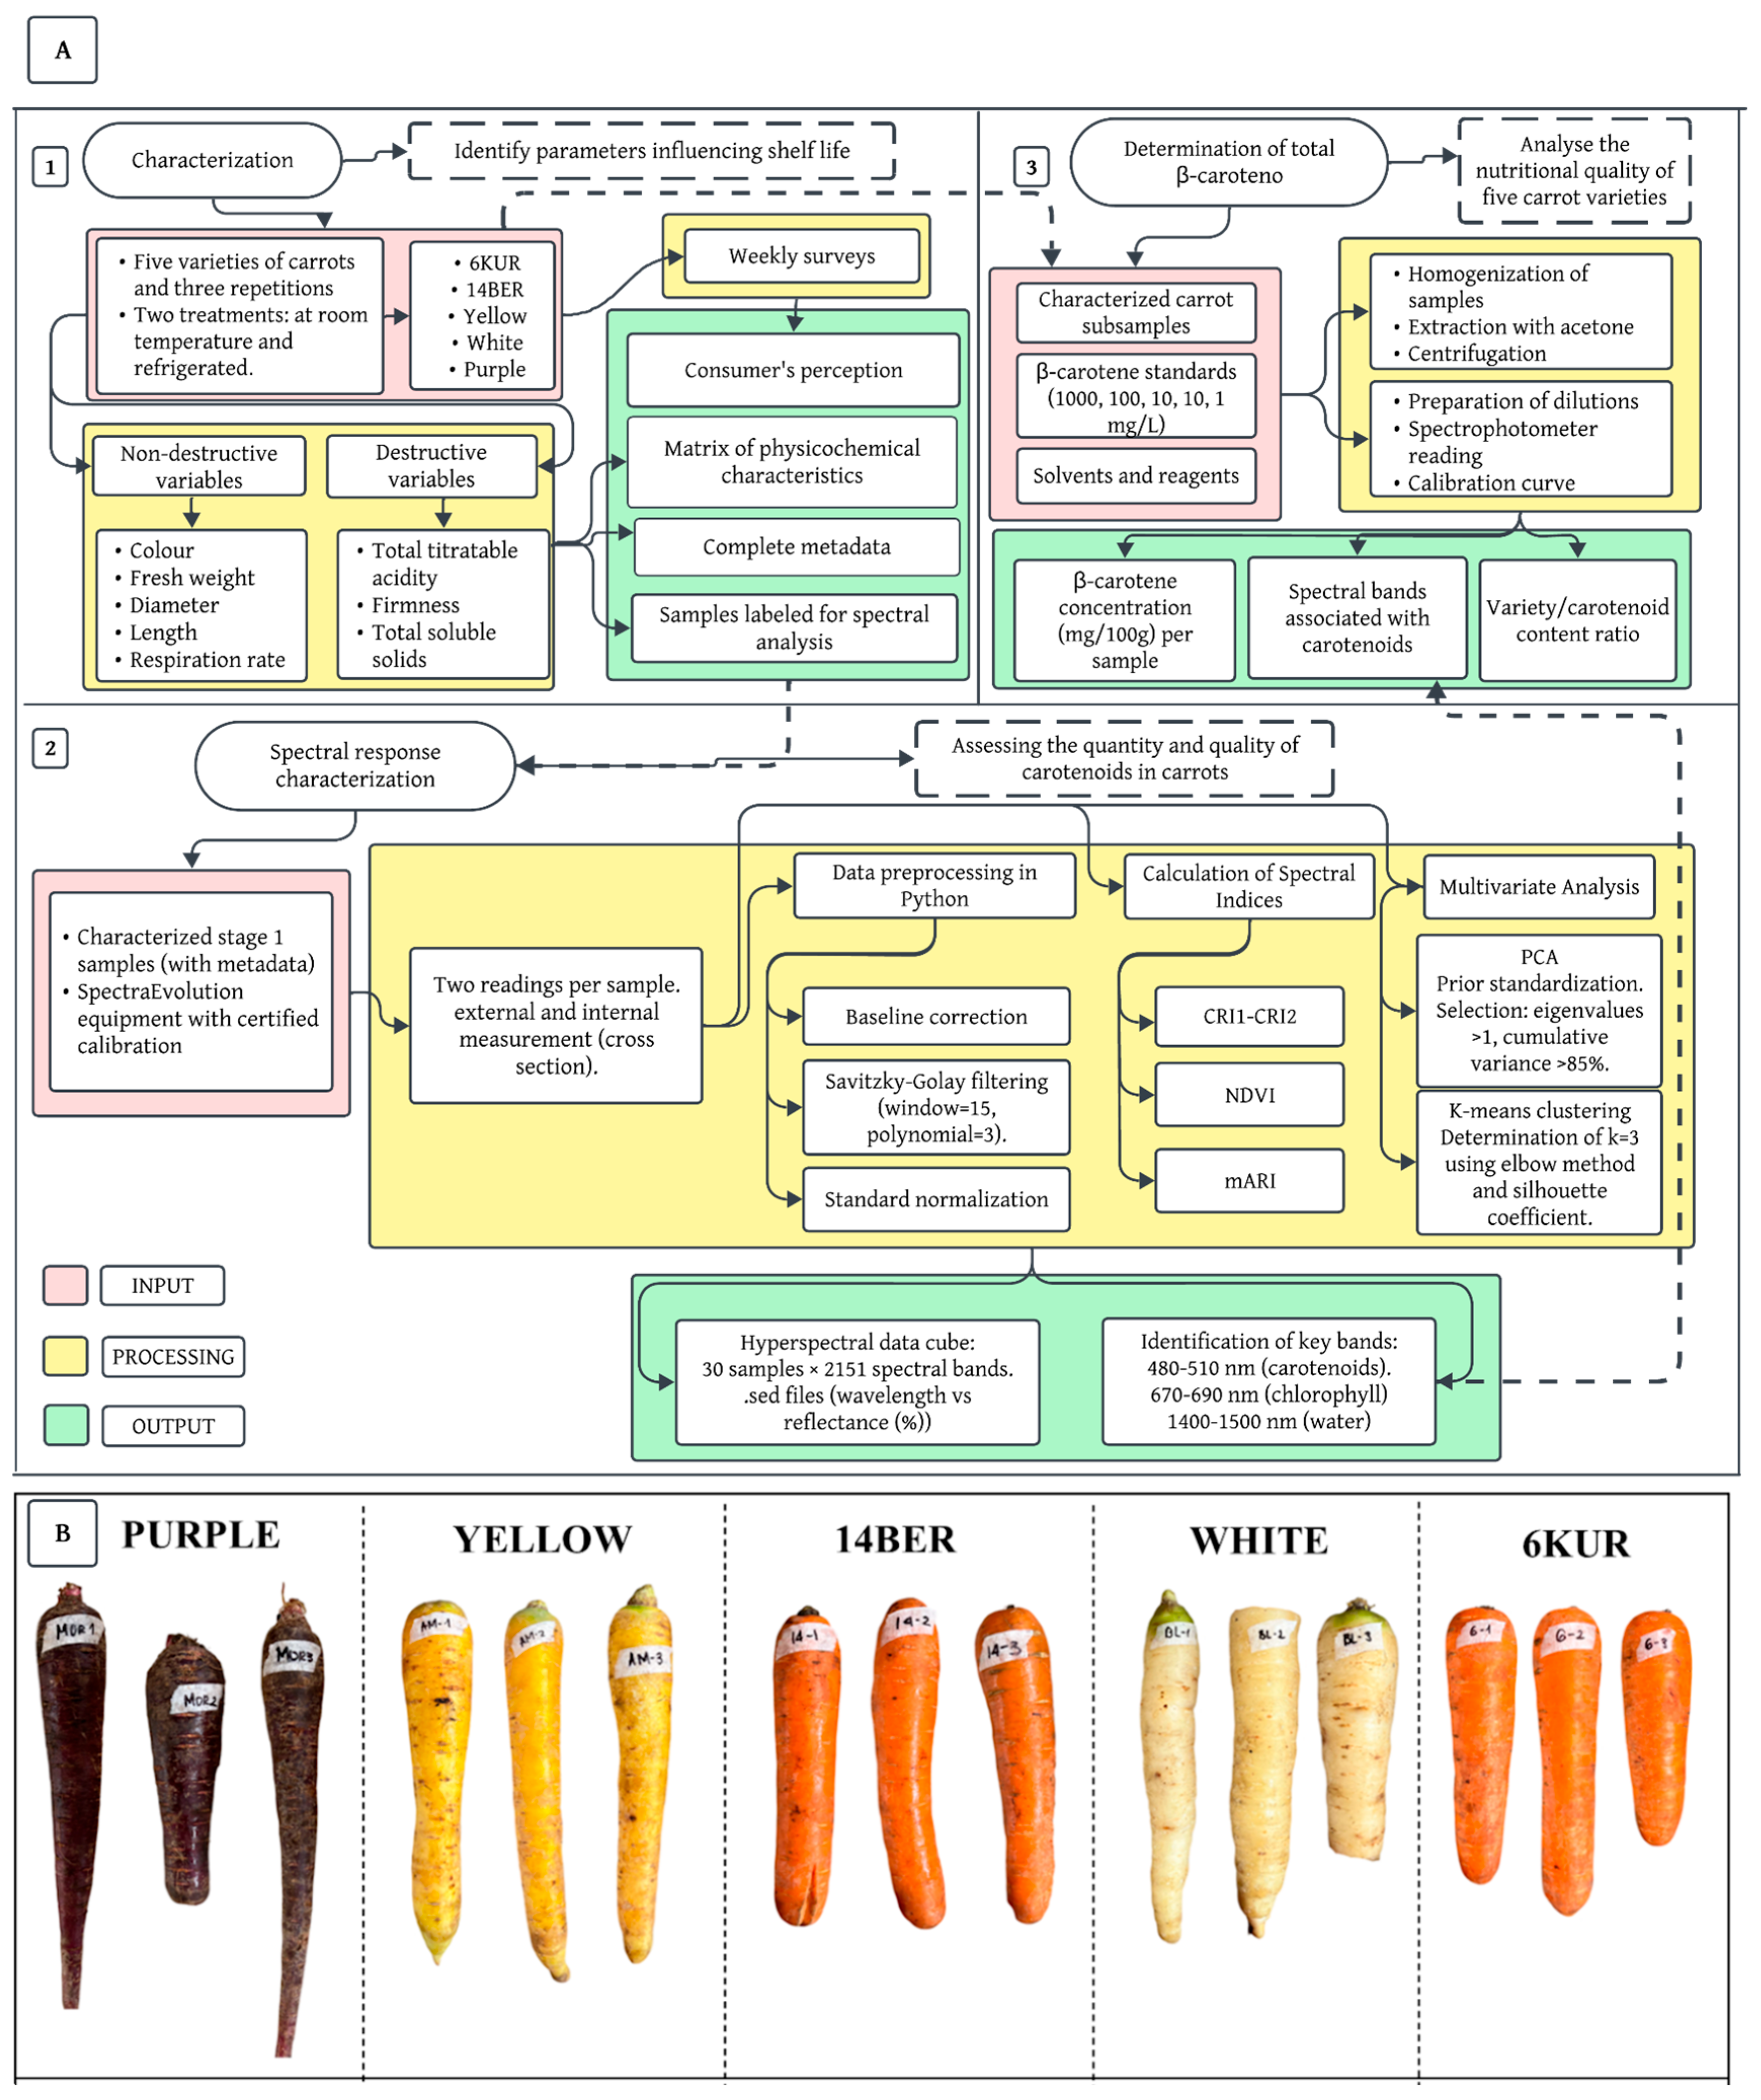
This study followed a comprehensive three-phase methodological framework to evaluate the postharvest quality of five carrot genotype under two contrasting storage conditions (
Figure 1A). In general terms, the first phase comprised the physicochemical and sensory characterization of quality traits over time, the second phase focused on hyperspectral analysis and the estimation of spectral indices associated with pigments, and the third phase quantified β-carotene content to validate the non-destructive indicators. Together, these phases provided an integrated understanding of how genotype and storage conditions influence postharvest quality. The step-by-step procedure of this framework is illustrated in
Figure 1, and each phase is described in detail in the following sections.
2.1. Characterization of Plant Material, Cultivation Conditions and Experimental Design
This study employed carrots (
D. carota) from five commercially available genotypes commonly cultivated in the department of Antioquia, identified as 14BER, 6KUR, white, purple, and yellow (
Figure 1B). The plants were grown in open-field conditions following standardized agronomic management practices, including fertilization, irrigation, and pest control protocols, in accordance with the technical recommendations of the project’s agronomic team. Cultivation beds (1.20 m × 5.00 m × 0.30 m) were established at the La Selva Research Center of AGROSAVIA (6°08′06″ N, 75°25′03″ W; 2120 m.a.s.l.), located within the lower montane moist forest (bh-MB) life zone (Holdridge Life Zones, 2021), with an average annual temperature of 17 °C and a relative humidity of 78%. Manual sowing was conducted at a spacing of 10 cm between plants and 15 cm between rows, with seeds placed at a depth of 0.5 cm. Harvesting was carried out manually from an internal 2 m
2 plot per bed, avoiding the edges to minimize border effects and inter-plant competition.
Once the carrots reached physiological maturity, they were harvested, washed, and transported fresh to Bogotá for analysis at the Quality and Postharvest Laboratory of the Faculty of Agricultural Sciences, and Plant Physiology and Biochemistry, Universidad Nacional de Colombia, Bogotá campus. The samples were divided into two storage groups following a completely randomized design (CRD): for each genotype, half of the samples were randomly assigned to ambient temperature storage (15 ± 2 °C), and the other half to refrigerated storage (4 ± 1 °C). Here, we used three independent biological replicates, where each replicate consisted of a single carrot per treatment combination. The replicates used in the present postharvest study were selected to represent the full phenotypic variability of each genotype based on established morphological and quality descriptors validated across prior regional trials. Each replicate therefore represents a biologically informed sample of the genotype population, not a convenience subsample. The experiment was monitored over a four-week storage period. All analytical measurements, including spectral, physicochemical, and destructive biochemical assays, were performed exclusively on the edible, storage root (i.e., the fleshy taproot).
The experiment was conducted under a completely randomized design (CRD) with a 5 × 2 × 4 factorial arrangement, corresponding to five carrot genotypes (14BER, 6KUR, white, purple, and yellow), two postharvest storage temperatures (ambient temperature and refrigeration), and four postharvest evaluation times (7, 14, 21, and 30 days). Each treatment combination was evaluated with three independent replications. Destructive and non-destructive quality variables were measured at each evaluation time using independent experimental units per sampling point, as the destructive nature of several measurements precluded repeated sampling from the same unit. This sampling strategy ensured the independence of observations across time points, avoiding pseudoreplication and the need to account for within-subject correlation structures [
19].
2.2. Physicochemical Characterization of Carrot Genotypes Under Different Storage Conditions over Time
Sample monitoring was conducted following a standardized weekly analysis protocol [
20], evaluating three sample units per genotype at 7, 14, 21, and 30 days postharvest (dph). For non-destructive measurements, the following technical procedures were applied: the respiration rate was measured according to the methodology adapted from [
20]. Samples were placed at room temperature in an airtight 0.25 L chamber equipped with an infrared CO
2 sensor (model High Accuracy NDIR CO2 Sensor CM1106H-NS, Wuhan, China) connected to a LabQuest data logger (model LabQuest 3, Vernier Science Education, Beaverton, OR, USA). CO
2 concentrations were recorded every 4 s over a 5 min interval, and the respiration rate (expressed as mg CO
2 kg
−1 h
−1) was calculated from the slope of CO
2 accumulation, adjusted for root weight and chamber headspace volume. Color was assessed at three equidistant points per sample using a Konica Minolta CR-400 colorimeter (illuminant D65, 10° viewing angle. Konica Minolta, Inc., Ramsey, NJ, USA), with results expressed in CIELab color space (L*, a*, b*), the instrument was calibrated before each measurement session using a white reference tile supplied by the manufacturer. Measurements were taken at three equidistant points along the root surface, and mean values were calculated. Fresh weight was recorded using an analytical balance Mettler Toledo XS205, 0.0001 g precision (Mettler-Toledo AG, Greifensee, Switzerland) after blotting excess moisture with absorbent paper.
For destructive measurements, firmness was assessed using an LS1 texture analyzer (Lloyd Instruments, Fareham, UK) equipped with a 3 mm stainless steel cylindrical probe, applying a compression force of 5 N at a constant speed of 2 mm/s on 10 mm-thick cross-sections. Total soluble solids (TSS) were measured from homogenized pulp using a digital refractometer (HI96821, Hanna Instruments, Inc., Woonsocket, RI, USA) calibrated with distilled water before each measurement. Titratable acidity (TA) was quantified through potentiometric titration using a Metrohm 916 Food Ti-Touch (Riverview, FL, USA), with titration endpoint at pH 8.1 using 0.1 N NaOH, results were expressed as percentage of malic acid equivalent. All destructive measurements were performed in triplicate, avoiding adjacent cut surfaces to prevent mechanical damage from affecting subsequent measurements. Data were recorded in traceable spreadsheets that included sample code, operator, and timestamp.
Prior to each measurement session, all instruments were calibrated according to manufacturer specifications and institutional standard operating procedures. Calibration was performed using certified reference standards appropriate to each measurement type, and instrument error was recorded and reported alongside the corresponding data to ensure full transparency in measurement uncertainty estimation. All equipment used in this study is shared teaching and research infrastructure operated under a formal calibration and validation program maintained by the institution.
2.3. Spectral Response Characterization of Carrot Genotypes Under Different Storage Conditions over Time
Spectral data were collected from a total of 30 carrot samples, corresponding to three biological replicates per combination of the five genotypes and two storage treatments. To account for local heterogeneity and ensure measurement robustness [
21], three technical replicate readings were taken on each individual carrot, one reading per root at three distinct positions, for both the external surface and internal cross-sectional measurements. At each measurement point, the spectroradiometer automatically acquired 30 consecutive scans, which were internally averaged to generate a single reflectance spectrum. The following protocol details the instrumentation and conditions under which these spectral data were acquired.
Spectral data acquisition was performed using a portable spectroradiometer (model SM-1900, Spectral Evolution, Haverhill, Boston, MA, USA) under controlled lighting and positioning conditions. Measurements were taken inside a 33 cm-wide × 26 cm-deep measurement box, internally coated with matte black material to minimize lateral reflections [
22]. The instrument operated with its integrated halogen light source (20 W lamp, 2856 K color temperature), maintaining a fixed distance of 15 cm between the spectrophotometer lens and the sample surface, with a 90° incidence angle and a 25° field of view. The device offers differentiated spectral resolution: 3.5 nm for the visible and near-infrared range (350–1000 nm) and 10 nm for the short-wave infrared range (1000–1900 nm), enabling detailed characterization of optical properties. Prior to each measurement session, the device was calibrated using a certified white reflectance standard to ensure accuracy and repeatability.
Spectra were stored in .sed format, containing structured wavelength data (in nanometers) and corresponding reflectance values (%). The spectral files were processed through an automated Python 3.13 workflow, utilizing libraries such as Pandas for data handling, Seaborn and Matplotlib for visualization, and Scikit-learn for multivariate analysis. Rigorous preprocessing was applied, including baseline correction, noise reduction via Savitzky–Golay filtering (window = 15, polynomial = 3), and standard normalization (Standard Normal Variate (SNV) transformation) to ensure comparability between samples. A window size of 15 and a third-order polynomial were selected to balance noise reduction and feature preservation. This configuration effectively smooths high-frequency noise in Vis/NIR spectra while maintaining key absorption features associated with carotenoids (450–500 nm) and anthocyanins (550–600 nm) [
23]. The third-order polynomial captures spectral curvature without overfitting local noise. In addition, SNV was selected over Min–Max scaling because it is sample-independent it does not require knowledge of the global spectral range across the dataset and is therefore more appropriate for spectra acquired across multiple sessions and surface types [
23].
In addition, a suite of vegetation indices (VIs) was calculated to non-destructively estimate pigment content and physiological status. The selection of the specific indices used in this study, the modified Anthocyanin Reflectance Index (mARI), the Carotenoid Reflectance Indices (CRI1, CRI2), and the Normalized Difference Vegetation Index (NDVI), is strongly supported by recent literature. Firstly, indices from the CRI family have been successfully used to discriminate between cultivated and weed species based on their spectral signatures, demonstrating their utility for carotenoid characterization in agronomic contexts [
14]. Secondly, and most relevant for our pigmented genotypes, the mARI has been validated as an accurate, non-destructive predictor of anthocyanin concentrations in plant tissues, showing high correlation (R
2 > 0.80) with measured values [
14]. Anthocyanins are the primary pigments responsible for the red, purple, and blue coloration in many plant species and constitute a key quality and biofunctional marker in pigmented carrot genotypes [
24]. Their elevated stability attributed to acylation makes pigmented carrots a particularly relevant source for postharvest quality monitoring and nutritional characterization over time [
24]. Finally, the broader applicability of VIs, including those sensitive to chlorophyll and biomass like NDVI, for monitoring physiological status in carrot crops has been confirmed in studies using multispectral imagery [
15].
These indices, based on mathematical relationships between reflectance values at specific wavelengths, allow for the indirect quantification of key biochemical parameters. In this study, the mARI was used to assess anthocyanin content in purple genotypes, the CRI indices were used to track carotenoid dynamics (of paramount importance in carrot), and the NDVI provided a general indicator of plant vigor. This multi-index approach is designed to capture the complex biochemical changes occurring during the storage of different carrot genotypes.
The equation for the Carotenoid Reflectance Index 1 (CRI1) [
25], is calculated as follows:
Designed to estimate carotenoid content, this index uses reflectance values at 510 nm (carotenoid absorption peak) and 550 nm (reference region).
The equation for the Carotenoid Reflectance Index 2 (CRI2) [
25], is calculated as follows:
This is similar to CRI1 but using 700 nm as the reference to reduce interference from chlorophyll.
The equation for the modified Anthocyanin Reflectance Index (mARI), as proposed by [
25] is calculated as follows:
The equation for the Normalized Difference Vegetation Index (NDVI) [
25] is calculated as follows:
This index is sensitive to photosynthetic activity and foliar biomass.
The implementation of these calculations was carried out using custom Python scripts designed to ensure traceability and reproducibility of the analyses. The algorithms incorporated automatic quality control checks to detect potential input data errors, as well as visualization routines that facilitated the interpretation of results. This systematic approach enabled the coherent integration of different analytical levels, from basic spectral processing to advanced feature extraction, laying the groundwork for a comprehensive characterization of the samples under study.
2.4. Biofunctional Characterization of Carrot Genotypes Under Different Storage Conditions over Time
The quantification of β-carotene (total carotenoid content expressed as β-Carotene) content was performed following a protocol facilitated by the Natural Product Chemical Laboratory of AGROSAVIA–La Selva Research Center. Initially, standard solutions were prepared from a certified reference material (Merck, Darmstadt, Germany). A precise amount of 5.0 mg (±0.1 mg) of β-carotene was weighed into a 5 mL volumetric flask, which was then filled to volume with HPLC-grade acetone and homogenized using a vortex mixer for 10 min. To prevent photodegradation, the process was carried out under light-protected conditions. From this stock solution, working standards of 100 mg L−1, 10 mg/L, and 1 mg L−1 were prepared through successive dilutions. Aliquots were taken with a micropipette, transferred to 10 mL volumetric flasks, and brought to volume with HPLC-grade acetone, followed by an additional 10 min vortex homogenization.
A calibration curve was constructed using defined aliquots of each standard, transferred into 1 mL volumetric flasks, and diluted with a methanol/acetone mixture (50:50). The solutions were vortexed for 1 min and stored in 2 mL amber vials to minimize light exposure before spectrophotometric analysis.
Plant-based samples were stored under refrigerated conditions at 4 °C ± 4 °C in sealed containers to preserve their integrity. On the day of analysis, 0.25 g of each sample was weighed and placed in 15 mL Falcon tubes wrapped in aluminum foil to prevent light-induced degradation. Each tube received 5 mL of HPLC-grade acetone and was left to stand for 15 min, with brief vortex mixing every 5 min. After extraction, the samples were centrifuged at 4000 rpm for 10 min, and the supernatant was collected. The extraction process was repeated three times to ensure maximum carotenoid recovery. The combined supernatants were stored in amber vials until further analysis, following the standardized procedures provided by AGROSAVIA’s Natural Products Chemical Laboratory. Quantitative analysis of β-carotene was carried out using a Genesys
® 10S UV-VIS (Thermo Scientific, Waltham, MA, USA) spectrophotometer set to 450 nm, the optimal wavelength for this carotenoid as reported in the literature [
10].
2.5. Statistical Analysis and Deterministic Modeling of Quality Loss as a Function of Carotenoid Dynamics over Time
The physicochemical quality variables and spectral indices associated with carotenoid and anthocyanin content were analyzed using a fully crossed 5 × 2 × 4 factorial arrangement (five genotypes × two storage conditions × four postharvest evaluation times) with three independent biological replicates per treatment combination, yielding 120 independent experimental units. Prior to inferential analysis, all response variables were assessed for compliance with the assumptions underlying parametric tests. Normality was evaluated using the Shapiro–Wilk test, and homogeneity of variances was examined using Levene’s test, both applied at a significance level of α = 0.05. Residual diagnostic plots (Q-Q plots and residuals vs. fitted values) were also inspected to corroborate distributional assumptions. Since most quality variables violated the normality assumption a non-parametric factorial approach was employed.
Specifically, the Aligned Rank Transform (ART) procedure was applied, which allows the full factorial structure of the design, including main effects and all two-way and three-way interactions (genotype × temperature × postharvest time), to be analyzed without assuming normality or homoscedasticity [
26]. The ART procedure aligns each response variable for a given effect by removing all other effects before ranking, thereby enabling the use of standard F-statistics on the ranked data while preserving the factorial structure of the model [
27]. When significant effects or interactions were detected (
p < 0.05), Post hoc pairwise comparisons following the ART procedure were performed using estimated marginal means (EMMs) applied to ART linear models. Given the large number of simultaneous comparisons inherent to the factorial design (5 genotypes × 2 storage temperatures × 4 postharvest times),
p-values were adjusted using the Benjamini–Hochberg false discovery rate (FDR) correction [
27] which provides a favorable balance between statistical power and error control under multiple testing conditions. The magnitude of statistically significant effects was quantified using partial eta-squared (η
2p) as a measure of effect size [
28].
Unsupervised pattern recognition was applied to the preprocessed spectral matrix of mean reflectance values per genotype across all acquired bands. The optimal number of clusters was determined using the elbow method, evaluating the within-cluster sum of squares for k = 2 to 5, and confirmed using the silhouette coefficient, which quantifies intra-cluster cohesion and inter-cluster separation to ensure statistically robust and biologically interpretable groupings [
29]. K-means clustering was implemented with controlled random initialization (random_state = 310,523) and a maximum of 500 iterations to ensure convergence, using Euclidean distance as the dissimilarity metric given its established sensitivity to spectral curve shape differences [
29].
Principal Component Analysis (PCA) was applied to the standardized spectral data matrix to reduce dimensionality and identify the spectral bands contributing most to variance among genotypes. Standardization prior to PCA was performed to prevent bands with larger magnitude from dominating the solution [
27]. Component retention followed two complementary criteria: Kaiser’s rule (eigenvalues > 1) and a cumulative explained variance threshold of ≥85% [
28]. Informative spectral bands were identified from component loadings using an absolute threshold of |loading| > 0.03, focusing the analysis on wavelength regions with high discriminative power, including those associated with photosynthetic pigments and cellular structural properties [
30].
In addition, Linear Discriminant Analysis (LDA) was applied independently to the physicochemical and spectral datasets for the multivariate characterization of genotypes across the complete postharvest period. In both cases, observations were pooled across all evaluation times (7, 14, 21, and 30 days) and both storage conditions, yielding a total of 120 observations (n = 24 per genotype), which satisfies the minimum sample size requirements for stable estimation of discriminant functions. This pooling approach was adopted deliberately to increase statistical power and model robustness, as applying LDA to individual time points would result in critically small group sizes (n = 3) that preclude reliable multivariate estimation [
31]. All quantitative variables (respiration rate, color coordinates, fresh weight loss, firmness, total soluble solids, and titratable acidity) were standardized prior to analysis (mean = 0, SD = 1) to ensure comparability across variables measured on different scales and units [
31,
32].
The suitability of LDA for discriminating carrot genotypes based on their physicochemical quality profile was supported by its widespread application in food quality and postharvest studies [
31]. Homogeneity of covariance matrices was assessed with Box’s M test, and the overall significance of group separation was evaluated using Wilks’ lambda (Λ) with its associated F-approximation. To address potential overfitting and provide honest estimates of classification accuracy, internal validation was performed using leave-one-out cross-validation (LOOCV), and the resulting confusion matrix and overall correct classification rate are reported. Results were visualized using the first two discriminant functions (LD1 and LD2) with 95% confidence ellipses drawn for each genotype to illustrate within-group variability and between-group separation in the discriminant space [
31].
To quantify postharvest β-carotene degradation kinetics across genotypes and storage conditions, a deterministic logarithmic decay model was fitted to the total carotenoid concentration data collected at each evaluation time point (7, 14, 21, and 30 days) under both refrigeration (4 °C) and ambient temperature (15 °C). The model followed the general form reported in Equation (5):
where a represents the intercept and b the rate coefficient, both estimated independently for each genotype × storage condition combination.
Model fitting was performed by least squares regression, and goodness-of-fit was assessed using the coefficient of determination (R
2), root mean square error (RMSE), and mean absolute error (MAE) to ensure that the fitted curves provided a statistically adequate and biologically interpretable description of the observed degradation trajectory. The logarithmic functional form was selected on the basis of empirical fit comparison across candidate models, as it best described the observed concentration–time relationship characterized by an initial rapid decline followed by progressive deceleration which is consistent with first-order degradation kinetics reported for carotenoids under postharvest storage conditions [
33]. This modeling approach provides a quantitative, genotype-specific framework for predicting β-carotene losses as a function of storage time and temperature, constituting a reproducible basis for postharvest quality prediction anchored to the most nutritionally and commercially relevant quality parameter of carrot [
33].
2.6. Evaluation of Consumer Perception and Preferences of Carrot Genotypes Under Different Storage Conditions over Time
To assess consumer perception and preferences regarding the different carrot genotypes, weekly surveys were conducted over three consecutive weeks (7, 14, and 21 days postharvest), involving 60 consumers per week via a digital questionnaire distributed through Google Forms. The study focused exclusively on four carrot genotypes: purple, white, 14BER, and yellow. The genotype, 6KUR, was not included in the evaluation due to its unavailability at the time of the study. The survey was designed to capture sensory and emotional impressions through open-ended responses, where participants freely described their experiences with the carrots, including aspects such as visual appearance, aroma, tactile texture, and flavor during consumption. This qualitative approach allowed the capture of organic perceptions without constraints imposed by predefined categories or numerical scales. The sensory component was not designed as a trained expert panel. Its objective was explicitly to capture spontaneous consumer perception, for which the absence of panelist training is a methodological requirement, not a limitation, as training modifies perceptual responses and undermines consumer representativeness [
34,
35].
The evaluation period was limited to three weeks because, by the fourth week, the carrots’ physical and sensory quality had deteriorated significantly, making them unsuitable for consumer testing. Responses were processed using tools such as Google Colab. Consumer perception was assessed through two complementary approaches: a Natural Language Processing (NLP) pipeline applied to open-ended free-text responses to characterize spontaneous sensory perception and sentiment, and a structured Likert-scale questionnaire (1–5) to quantify the relative importance of key quality attributes across storage time [
34,
35].
First, a comprehensive preprocessing pipeline was applied, including conversion to lowercase, removal of irrelevant words using the NLTK (Natural Language Toolkit) stopword dictionary [
36], basic spelling correction, and lemmatization of verbs and nouns to standardize terminology. Word clouds were generated to visualize the most frequently mentioned terms, aiding in the identification of prominent sensory characteristics perceived by consumers. Free-text descriptors were analyzed using a NLTK pipeline previously developed (in accordance with ethical standards, data usage guidelines, and best practices for the use of algorithms), validated, and published by our research group for the analysis of consumer responses in food quality and postharvest research contexts [
34,
35]. The polarity-based sentiment analysis, implemented through the TextBlob library, is a widely used method for evaluating textual sentiment in consumer and social media research [
34,
35]. This approach quantifies sentiment on a scale from −1 (negative) to +1 (positive), enabling automated classification into positive, neutral, and negative categories. Its applications include brand perception analysis, product feedback assessment, and market trend monitoring, offering a scalable alternative to manual sentiment coding [
34]. However, its accuracy depends on contextual language interpretation and may require domain-specific adjustments.
In addition to the NLP-based analysis, a structured Likert-scale questionnaire (1 = not important to 5 = extremely important) was administered to the same participants to quantify the perceived importance of ten carrot quality attributes relevant to purchase and consumption decisions: appearance and absence of physical damage, price, firmness, point of sale, color, size, shape, odor, product origin, and producer type [
3]. The questionnaire was applied at each postharvest evaluation time point (7, 14, 21, and 30 days) to capture temporal shifts in consumer attribute weighting as quality declined over the storage period. Data were analyzed using a purely descriptive approach, examining score distributions per attribute and time point. The relative importance of each attribute and its temporal variation were visualized using a heat map, in which rows represent quality attributes, columns represent evaluation time points, and cell color intensity reflects the mean importance score, providing an integrated view of how consumer quality priorities evolve throughout postharvest storage.
3. Results
3.1. Characterization of Physicochemical Parameters of Carrot Genotypes Under Different Storage Conditions over Time
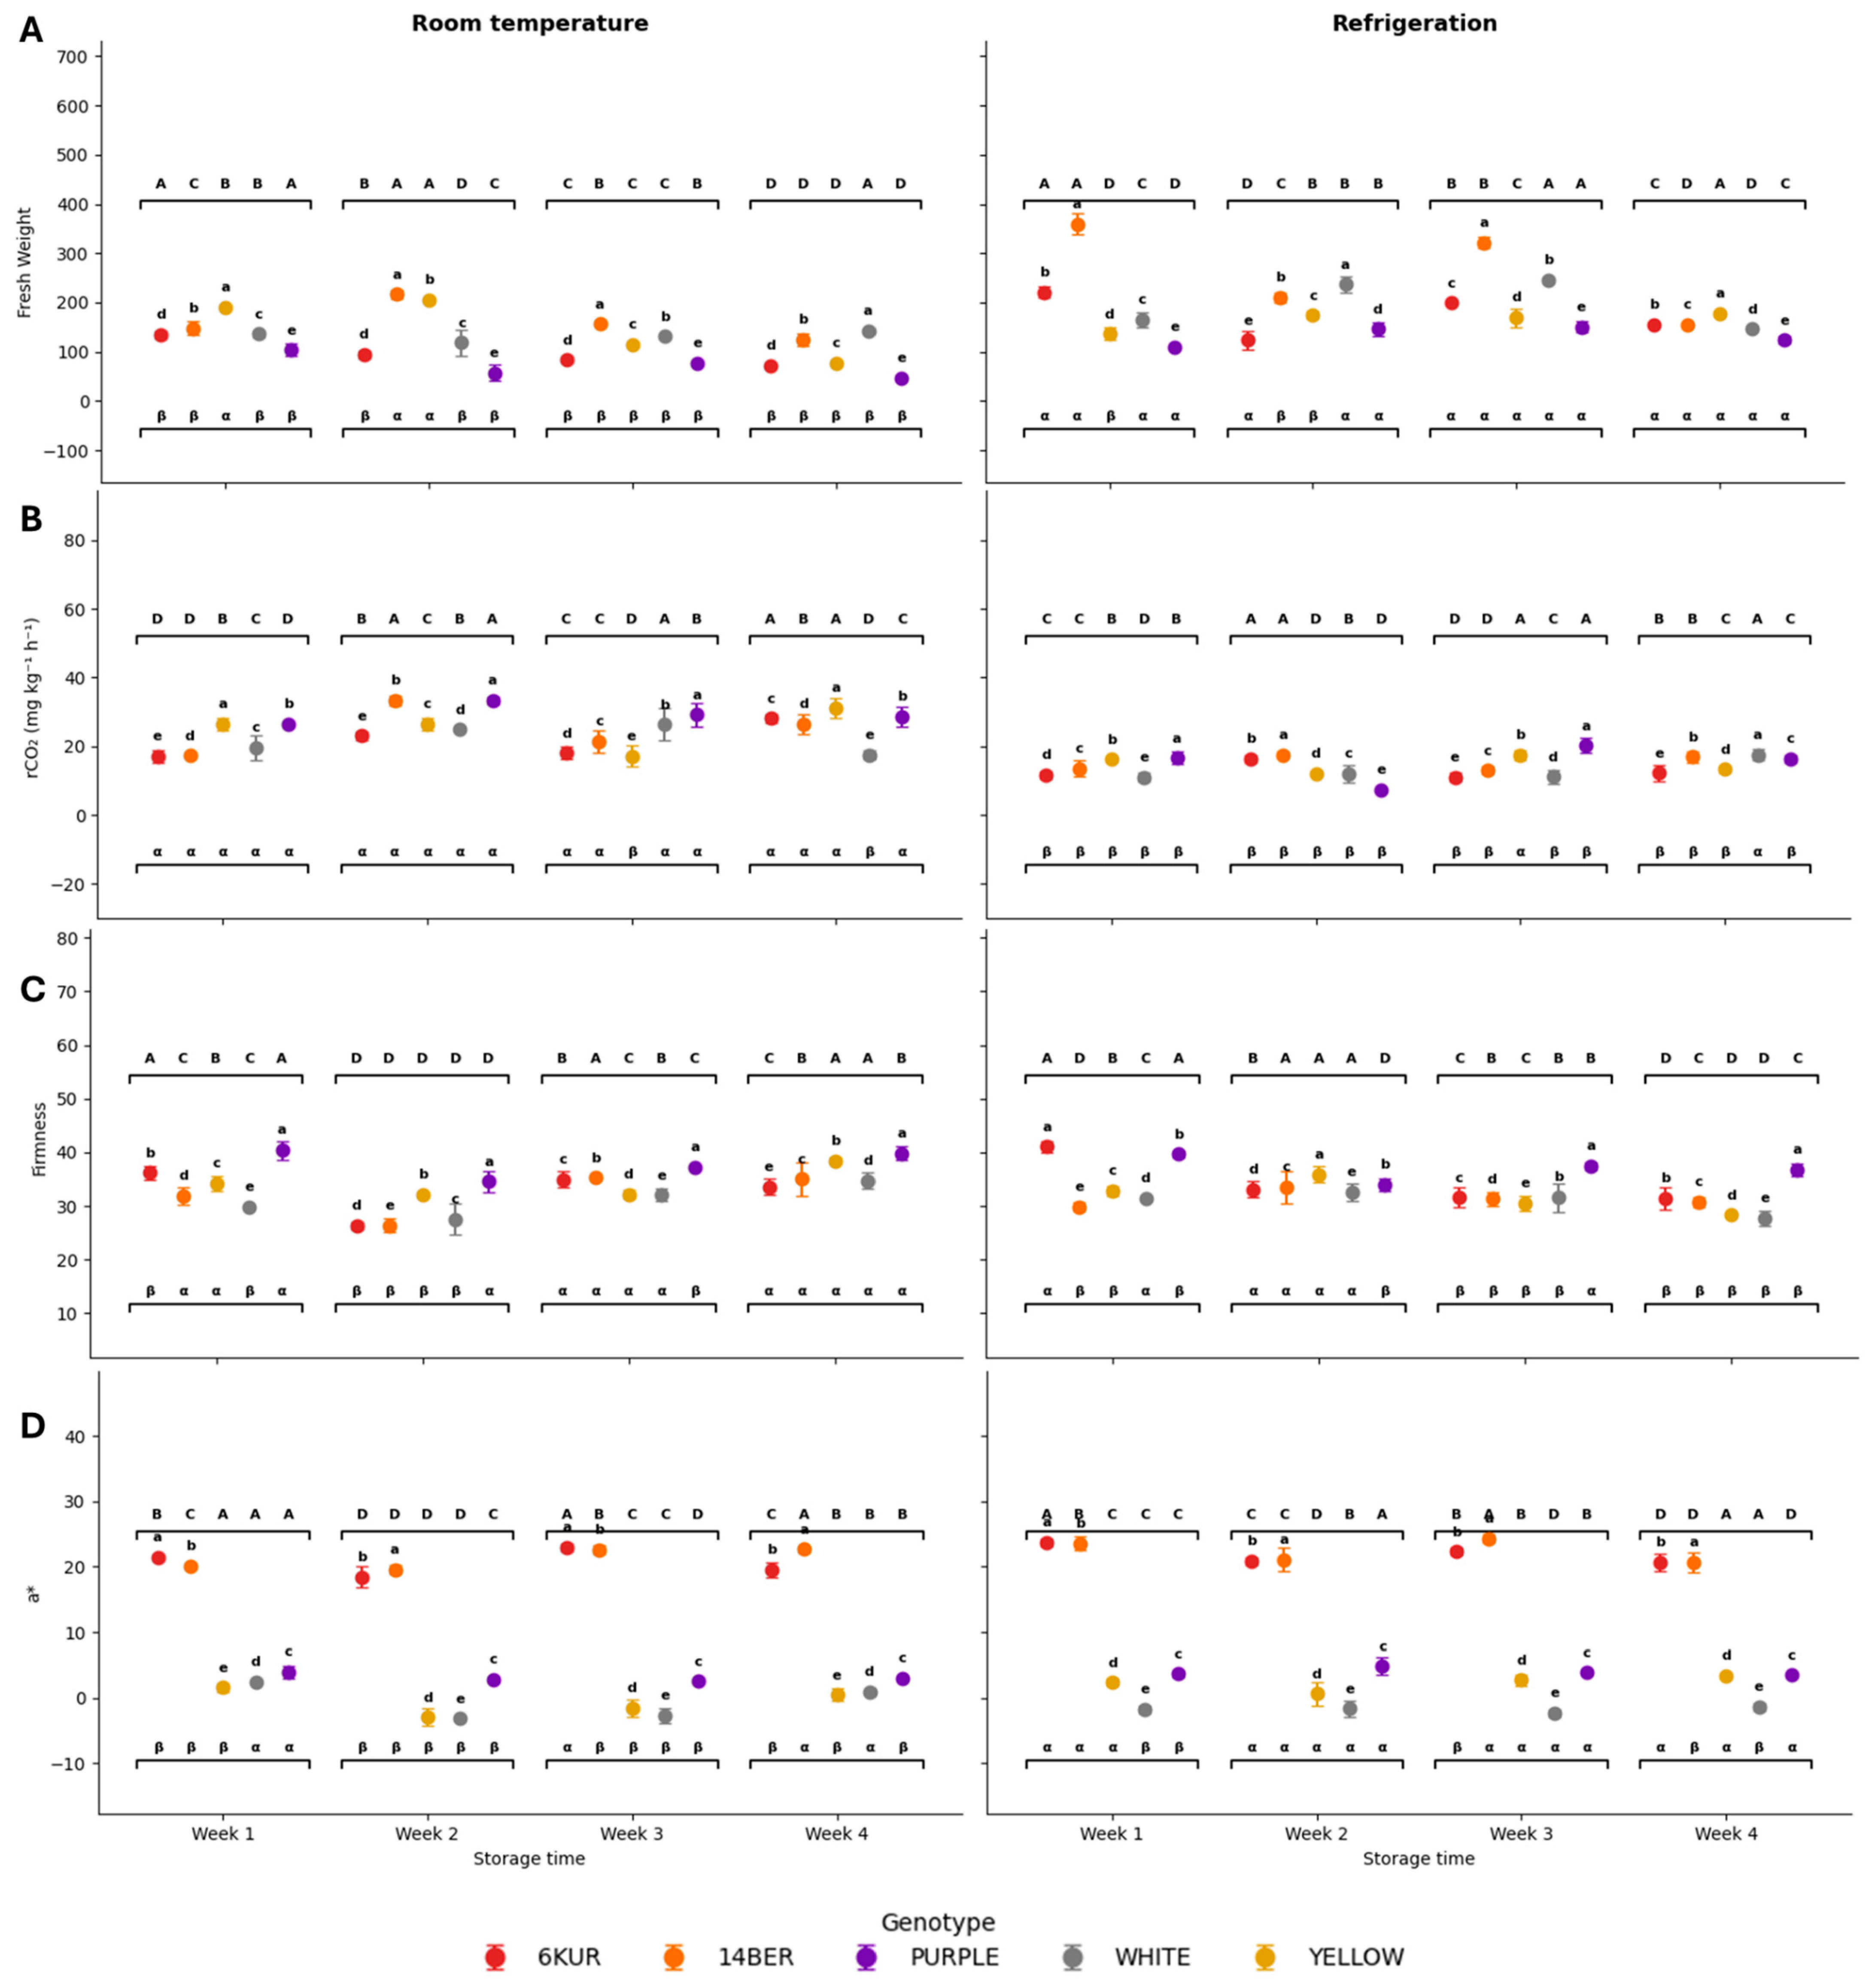
A comprehensive analysis of non-destructive parameters and postharvest quality parameters (
Figure 2 and
Table S1) revealed that color variation was mainly explained by genotype, particularly for L*, a* and b*. For L*, the ART analysis showed a genotype effect (
p < 0.001, η
2 = 0.865), while storage treatment and week were not significant as main effects. However, the genotype × treatment interaction was significant (
p = 0.001, η
2 = 0.195), indicating that lightness responses to storage conditions depended on the carrot material. White and yellow carrots exhibited the highest L* values, whereas purple carrots showed consistently lower lightness. Orange materials, particularly 14BER and 6KUR, showed intermediate responses.
For the a* parameter (red-green), genotype had the largest effect (p < 0.001, η2 = 0.884), followed by significant effects of treatment, week, genotype × treatment, genotype × week, and the three-way interaction genotype × treatment × week (p = 0.015, η2 = 0.254). The 14BER and 6KUR showed the highest values, indicating their characteristic red-orange pigmentation. In contrast, purple and white genotypes exhibited lower values. Similarly, b* was strongly affected by genotype (p < 0.001, η2 = 0.839), treatment, week, genotype × treatment, genotype × week, and the three-way interaction (p = 0.009, η2 = 0.269)., Yellow and orange genotypes displayed the highest values, confirming their yellowish hue. These results indicate that color differences were primarily genotype-driven, although storage conditions modulated the stability of chromatic attributes over time.
In terms of fresh weight, ART analysis showed significant effects of genotype, treatment, week, and all interaction terms, including the three-way interaction genotype × treatment × week (p < 0.001, η2 = 0.771). This indicates that weight loss depended simultaneously on the material, storage condition, and storage time. In general, samples stored at room temperature exhibited greater fresh weight reduction than refrigerated samples. Among materials, purple carrots showed greater susceptibility to weight loss, whereas 14BER tended to retain higher fresh weight under refrigeration.
The respiratory rate also showed a clear factorial response. Genotype, treatment, week, genotype × treatment, genotype × week, treatment × week, and the three-way interaction were all significant, with treatment showing a large effect (p < 0.001, η2 = 0.737). Respiration rates were higher under room temperature than under refrigeration, The significant genotype × treatment × week interaction (p < 0.001, η2 = 0.414) indicates that respiratory behavior differed among materials depending on both storage condition and time.
Firmness showed significant effects of genotype, week, genotype × week, and treatment × week, while the main effect of treatment and the three-way interaction were not significant. This suggests that texture changes were mainly associated with genotype-specific temporal dynamics rather than a uniform treatment effect. Some materials maintained relatively stable firmness across storage, whereas others showed progressive softening or treatment-dependent variation. In contrast, TSS showed significant effects for all main factors and interactions, including genotype × treatment × week (p < 0.001, η2 = 0.497), indicating that soluble solid accumulation or concentration effects varied strongly among materials and storage conditions.
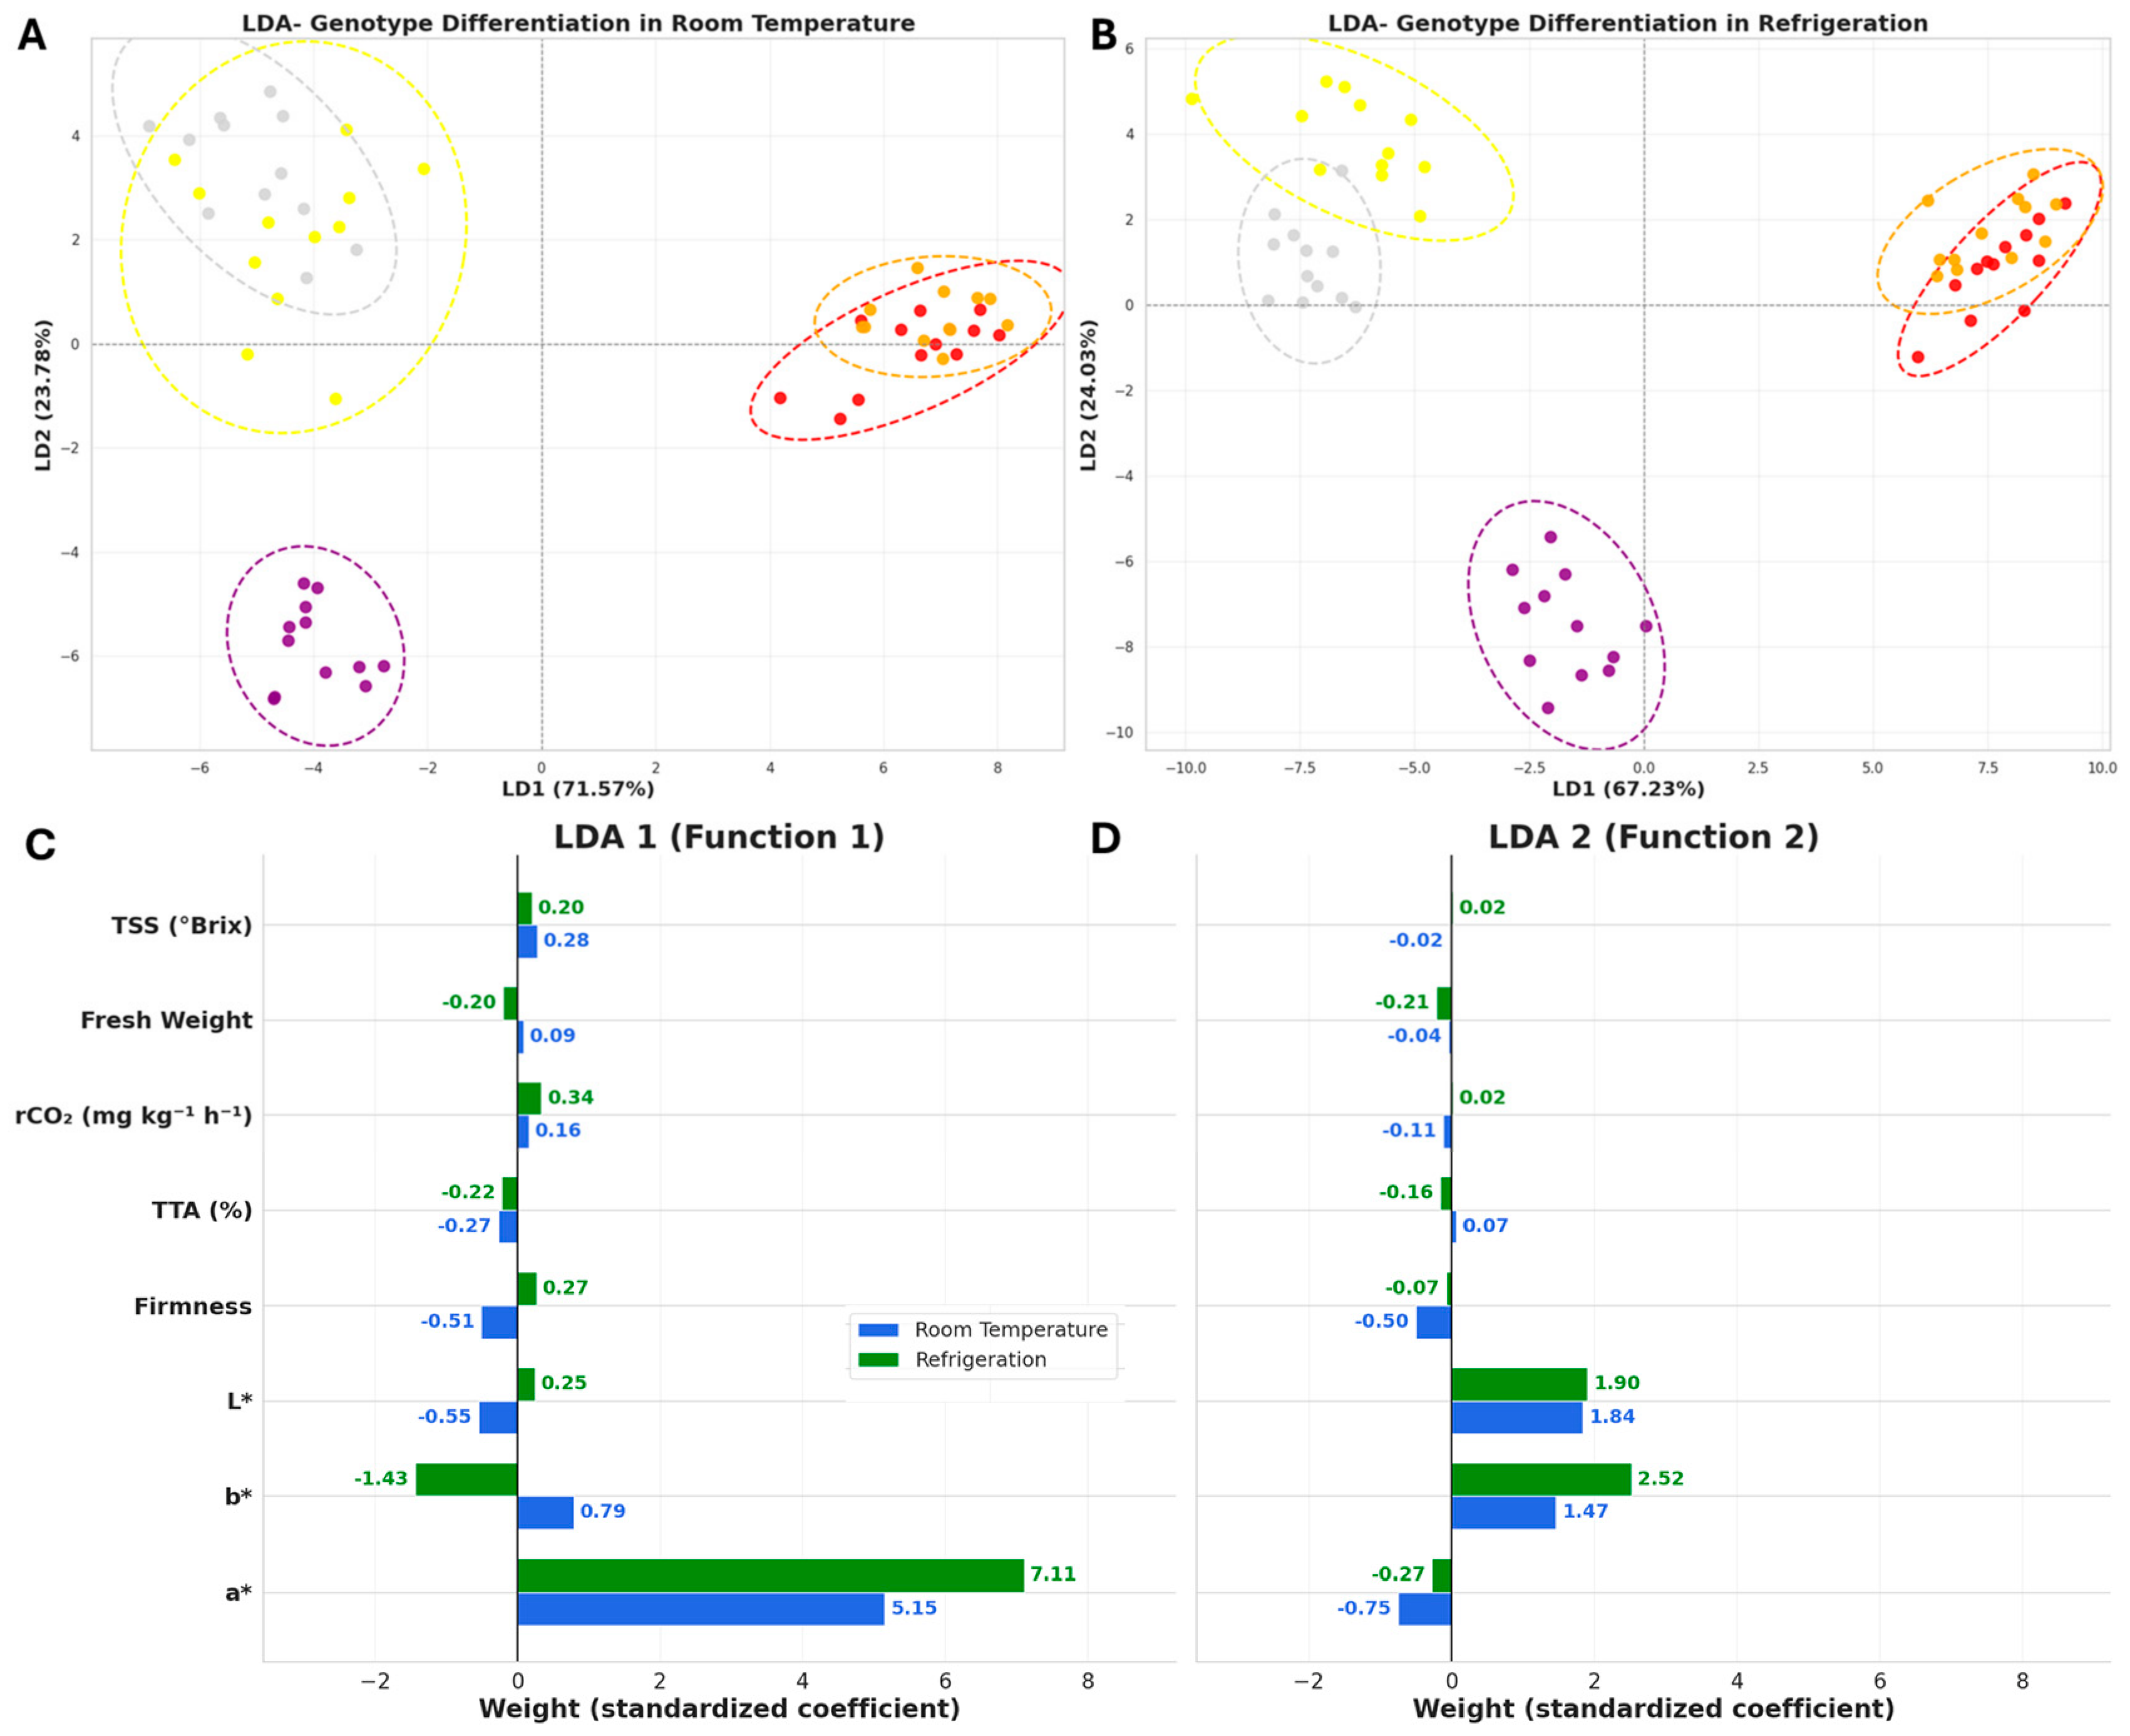
Linear Discriminant Analysis (LDA) revealed (
Figure 3A–D) that the clustering patterns of carrot genotypes were influenced by storage temperature. While the overall structure showed a consistent separation of the three main pigment-based groups (purple, orange [14BER and 6KUR], and the combined yellow/white cluster) under both conditions, an interesting trend was observed regarding the latter. Under room temperature storage, the yellow and white genotypes exhibited very similar phenotypic responses and clustered together. However, under refrigeration, a visual separation between these two genotypes emerged in the LDA space. Given the limited number of genotypes evaluated in this study (5), this observed separation should be interpreted as a preliminary trend rather than a conclusive finding. A study including a broader range of yellow and white genotypes would be necessary to confirm if this phenotypic divergence under cold storage is a generalizable pattern. The purple genotype maintained a distinct and well-separated profile from all other groups under both storage treatments.
3.2. Characterization of Spectral Responses of Carrot Genotypes Under Different Storage Conditions over Time
Spectral analysis revealed clear genotype and storage-dependent differences in carrot reflectance patterns (
Figure S1). Purple carrots showed high reflectance in the 550–600 nm region and maintained greater stability under refrigeration, whereas under ambient conditions they exhibited a marked decline over time, especially on the external surface. In contrast, the yellow, 14BER, and 6KUR genotypes presented pronounced responses in the 450–500 nm range, consistent with carotenoid-associated signatures, and showed stronger degradation under ambient storage than under refrigeration. White carrots displayed a more uniform spectral profile across the visible range, with comparatively smaller spectral changes during storage. In general, refrigeration was more effective in preserving spectral integrity, while ambient conditions accelerated degradation, particularly in external tissues. The full dynamics over time, as well as the differences among genotypes, tissues, and storage conditions, can be clearly observed in
Figure S1.
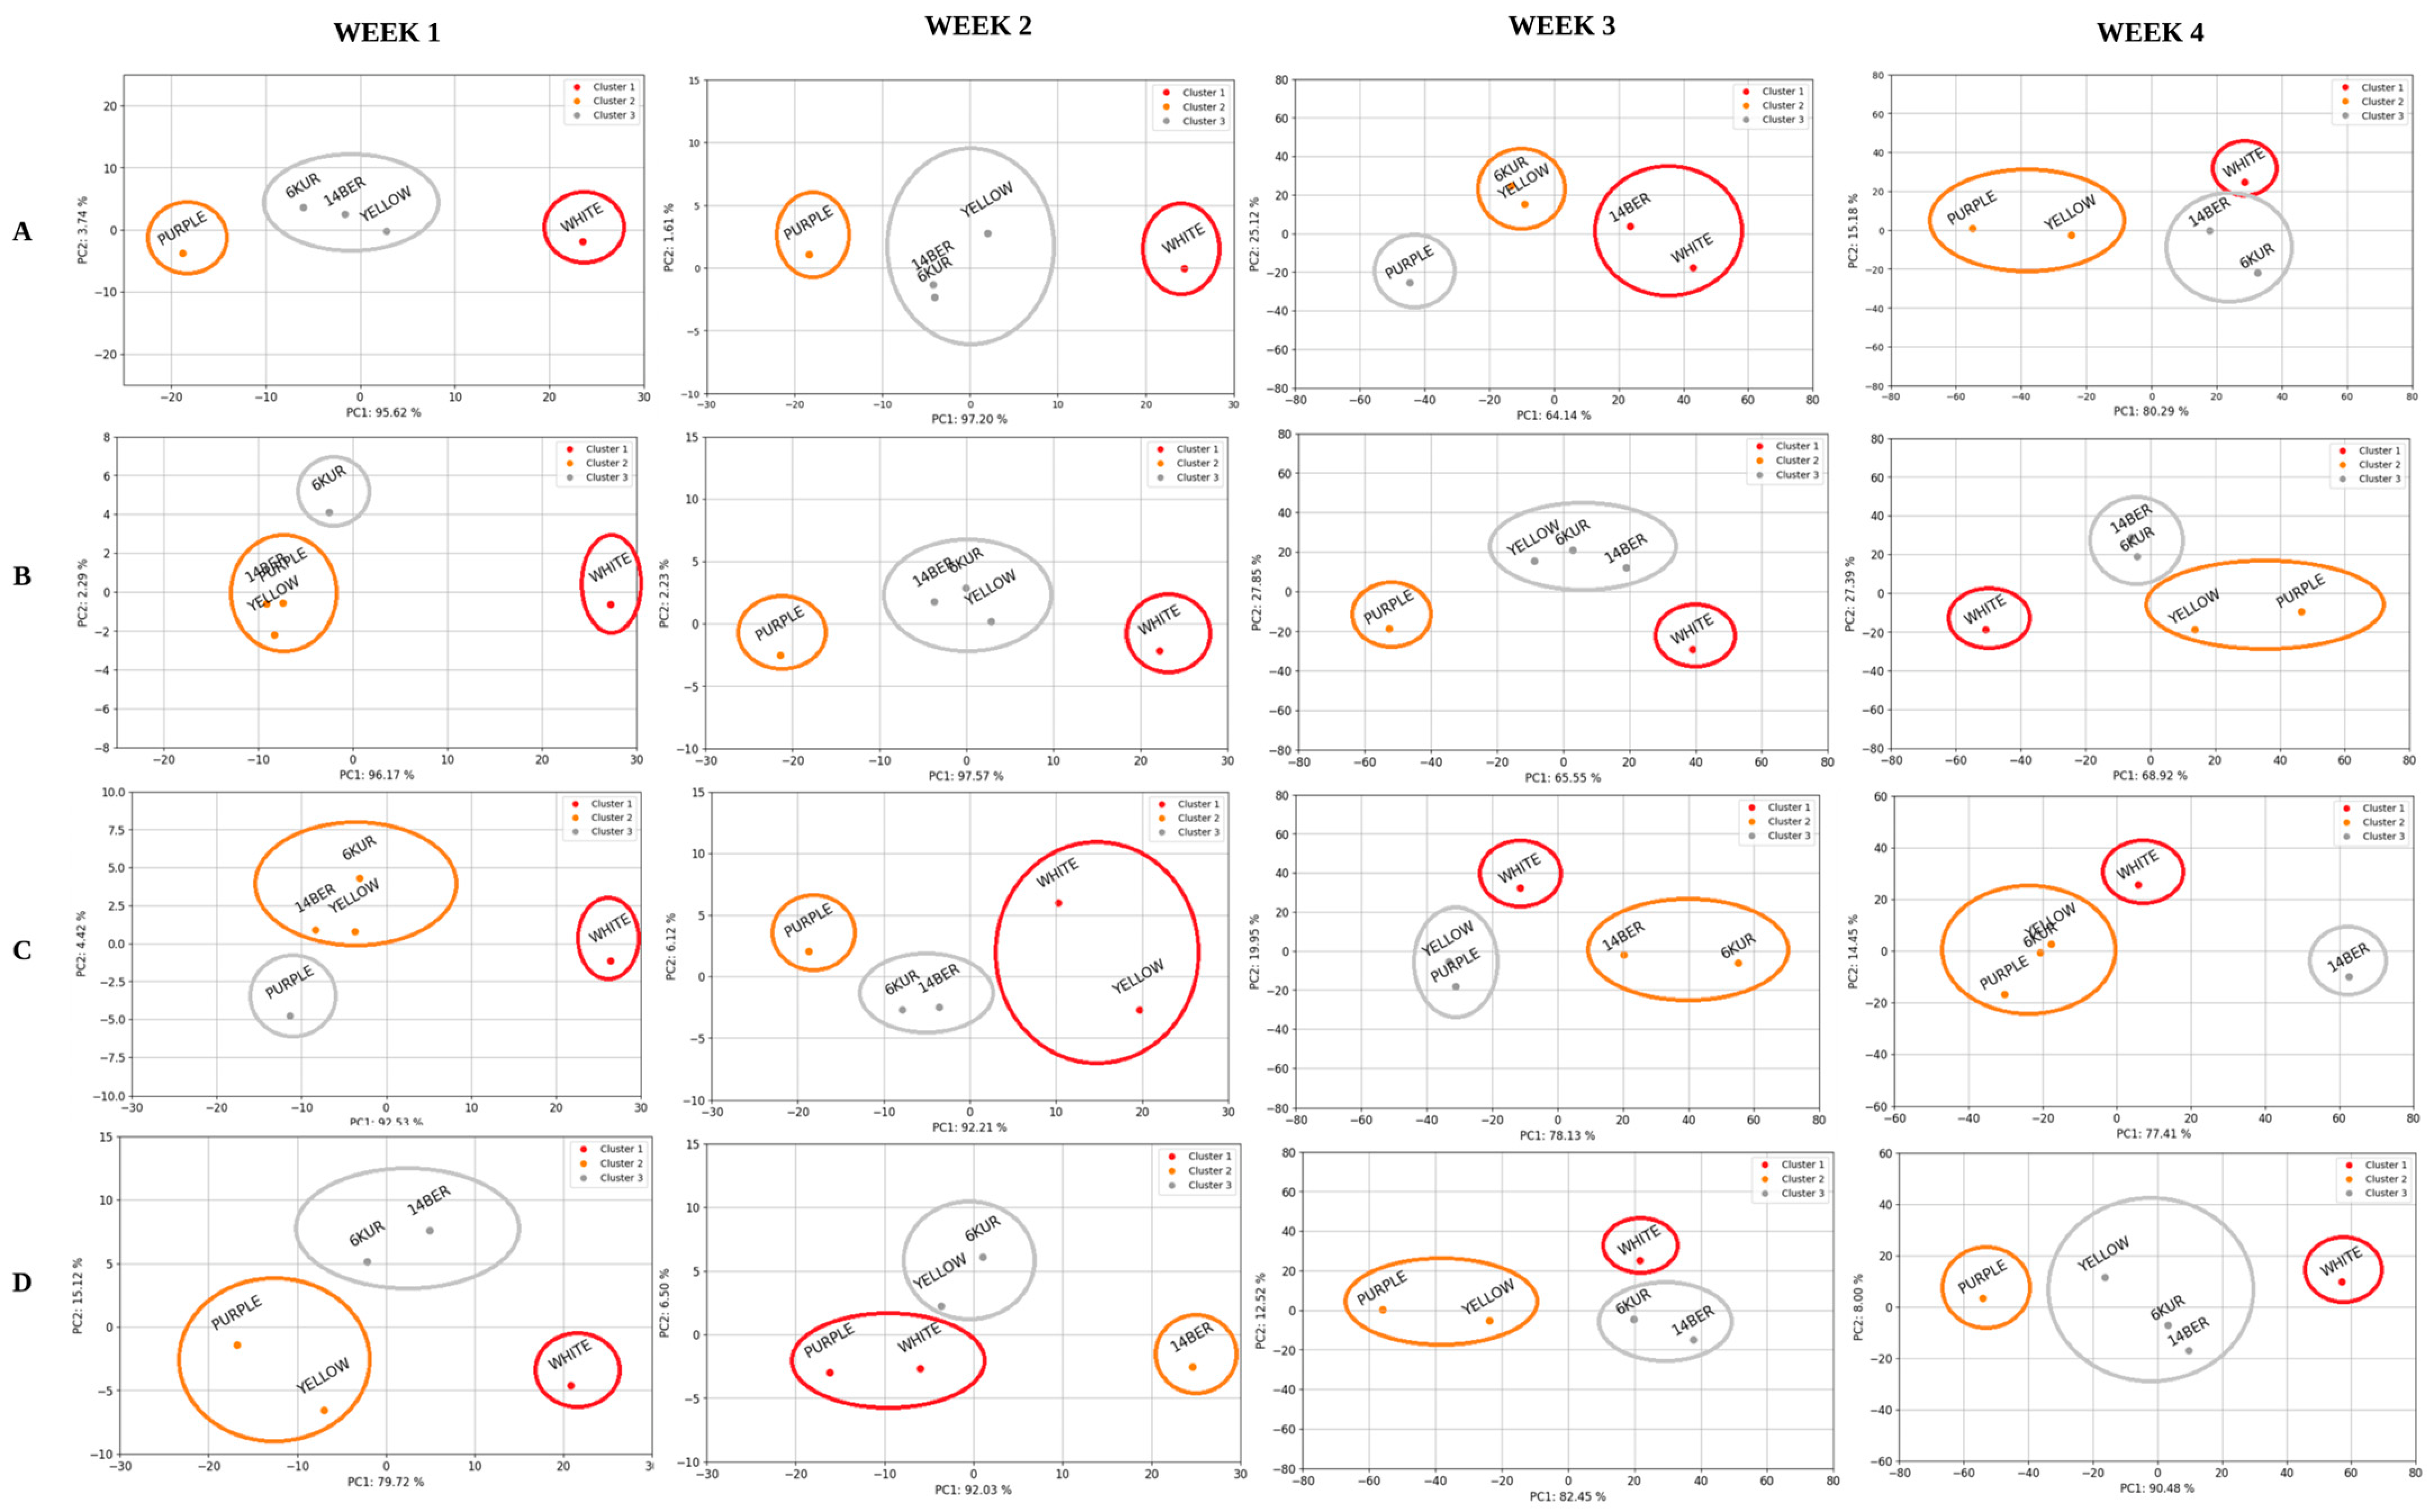
Spectral clustering analysis (
Figure 4) revealed genotype- and treatment-dependent deterioration patterns. Ambient storage induced progressive cluster migration in principal component space from week 3 onward, most markedly in 6KUR and 14BER, whose spectral dispersion coincided temporally with negative consumer descriptors (“soft”, “flavorless”). Purple exhibited the most critical behavior under ambient conditions, showing anomalous clustering with the white genotype by week 4 reflecting accelerated pigment loss in the 550–600 nm range and aligning with concurrent negative sensory notes (“bitter”, “low aroma”) in both genotypes. Yellow demonstrated the greatest spectral stability, maintaining its principal component position through week 3 under ambient storage.
Refrigerated samples retained more than 75% of their initial explained variance throughout the study period, whereas ambient-stored samples declined below 50% by week 4. The largest deviation from the initial spectral profile was recorded for ambient-stored purple (2.3 units in PC1–PC2 space), followed by white (1.8 units), and refrigerated yellow showed minimal variation (0.4 units), establishing a quantifiable relationship between spectral stability, storage condition, and postharvest quality deterioration.
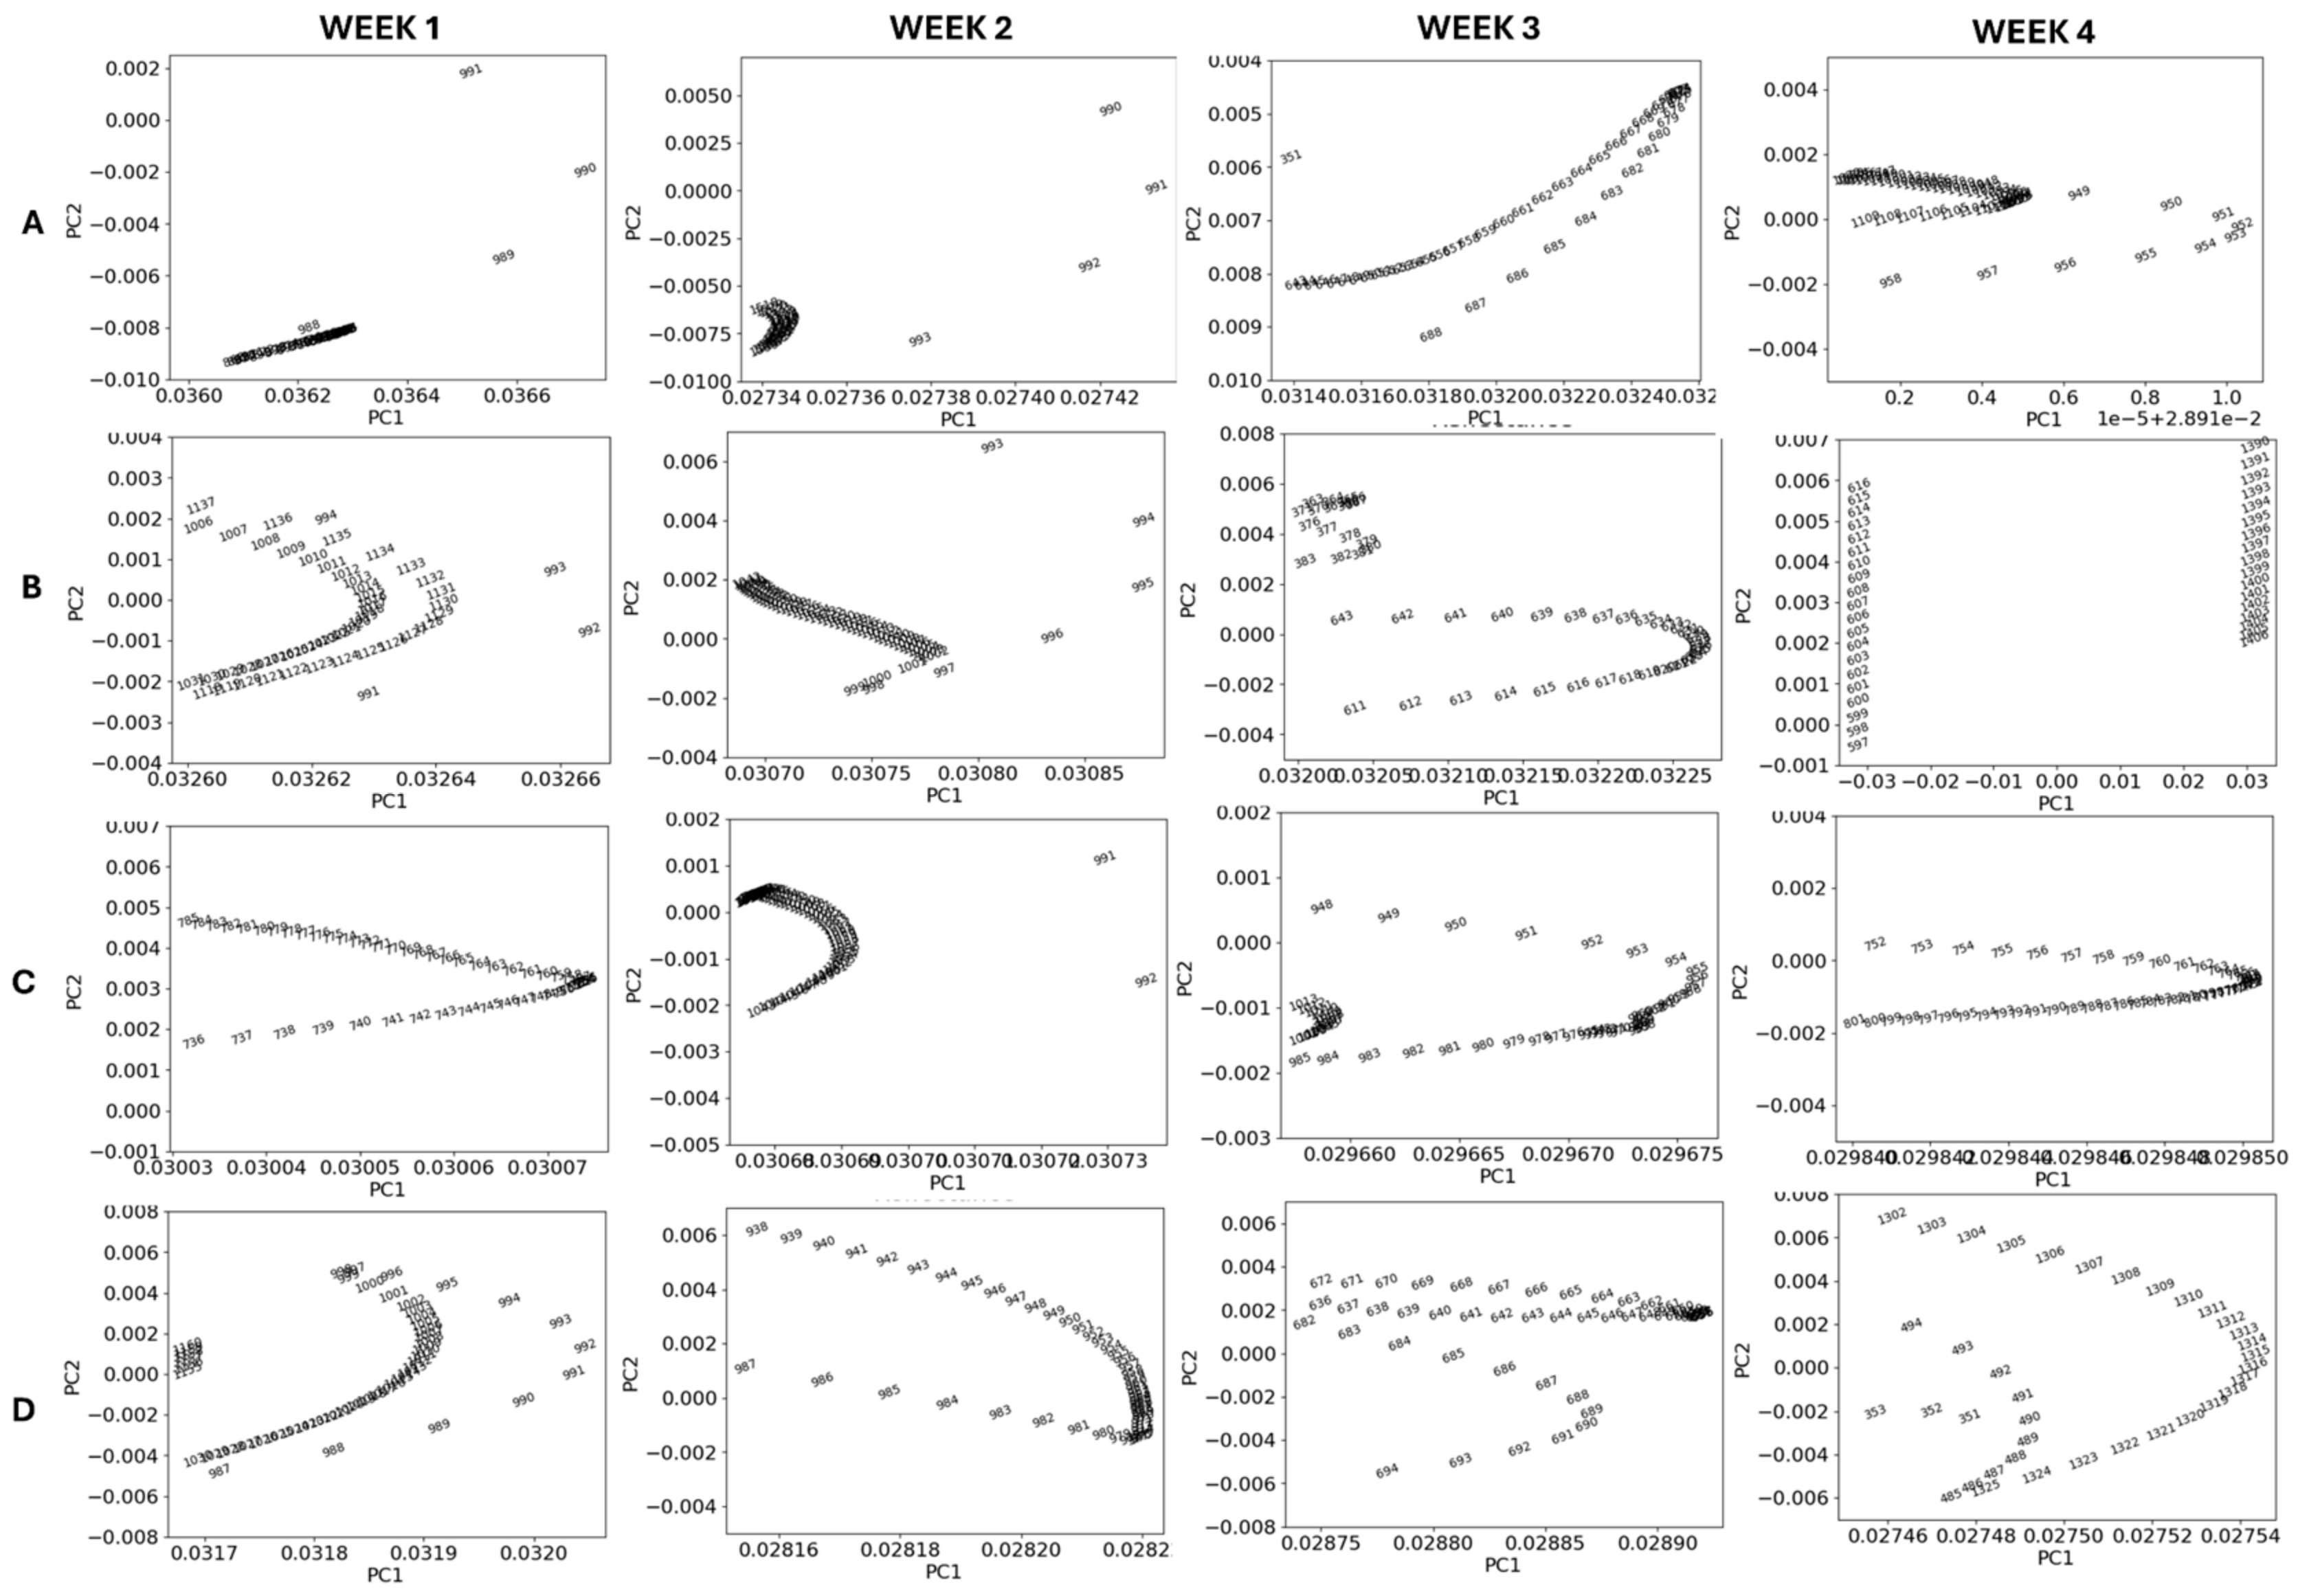
Vis/NIR spectral profiles (
Figure 5) showed progressive, treatment-dependent divergence throughout storage. In week 1, refrigerated external samples (A) showed pronounced reflectance at 1000–1200 nm; ambient external (B) and cross-section (D) samples presented similar but attenuated patterns; refrigerated cross-section samples (C) exhibited a distinct dominant band at 700–800 nm. By week 2, all treatments shifted toward longer wavelengths, with A, B, and C developing activity at 800–1000 nm and D showing intensified reflectance at 1000–1200 nm, indicating accelerated compositional changes under ambient conditions.
From week 3, treatment-specific signatures became clearly differentiated: A retained activity at 350–700 nm; B and C developed characteristic bands at 950–1100 nm; and D showed an emerging reflectance increase at 650–700 nm (
Figure 5). By week 4, divergence was maximal a retained narrow activity at 350–610 nm; B developed a broad band spanning 600–1400 nm; C showed a narrow band at 750–800 nm; and D presented the most extensive pattern (350–1300 nm), consistent with advanced pigment degradation and loss of tissue structural integrity.
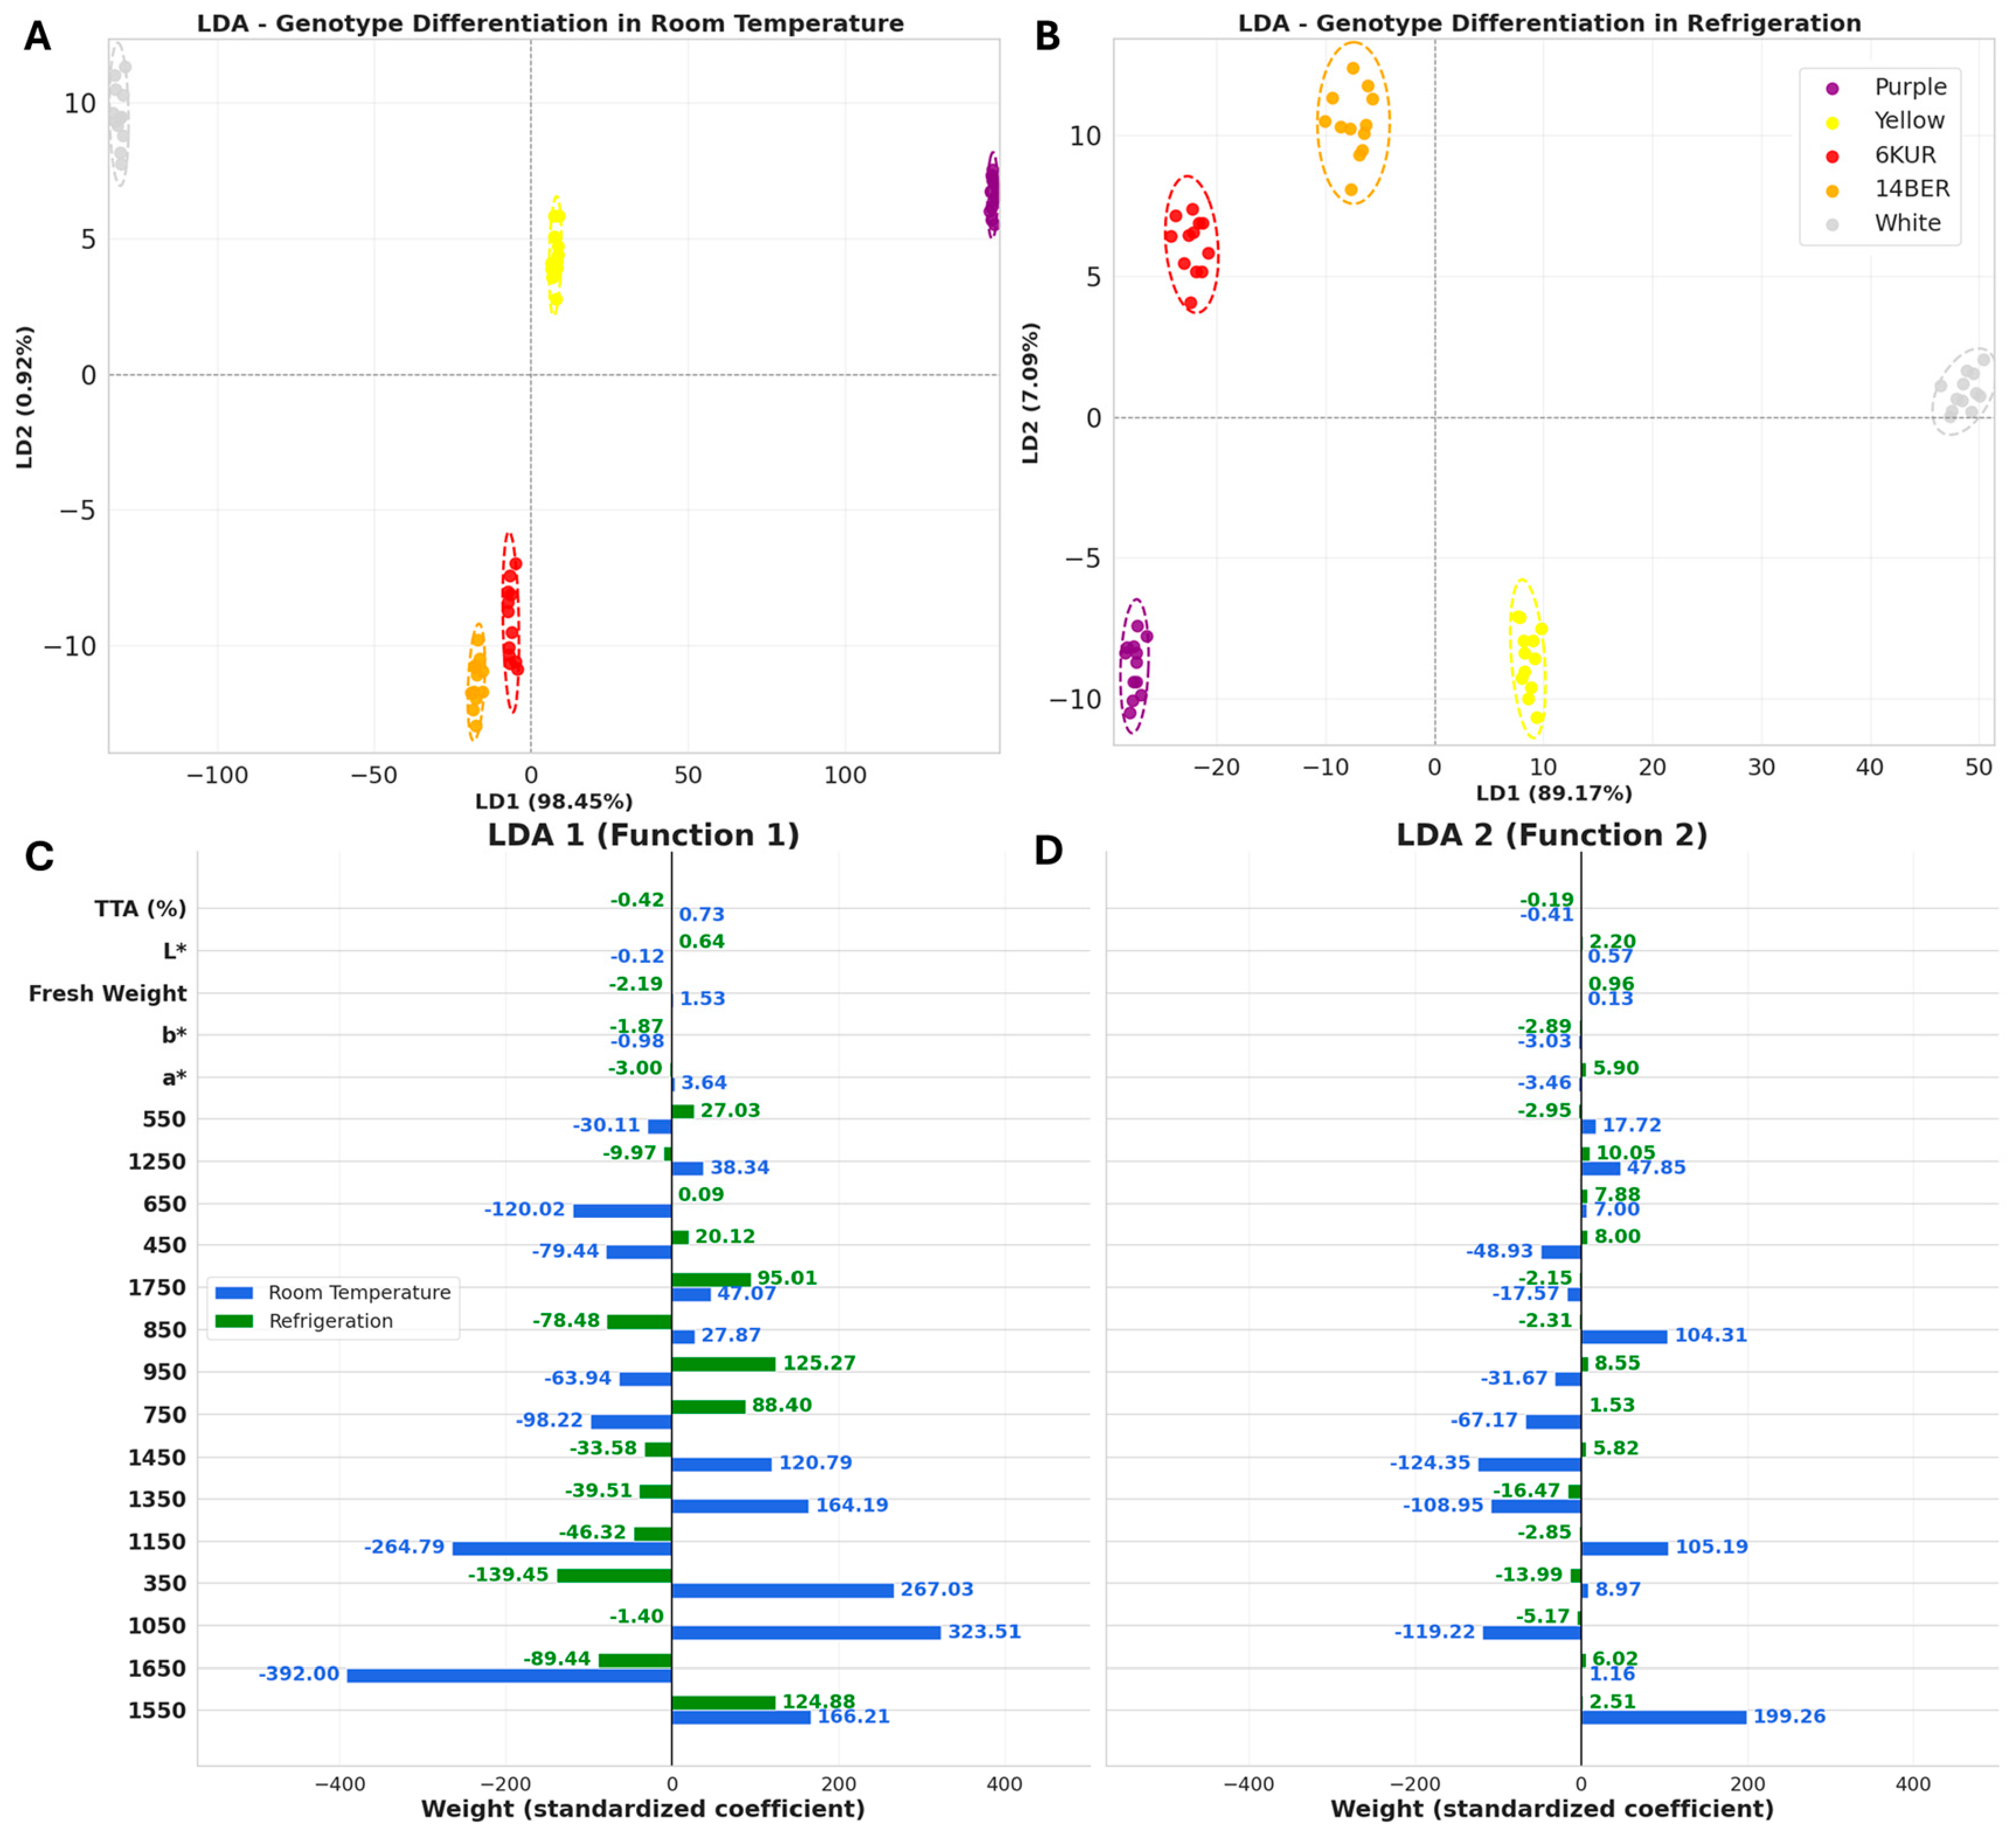
Figure 6A–D presents the results of the Linear Discriminant Analysis (LDA) applied to combined data from spectral signatures and physicochemical parameters. In the analysis corresponding to storage at room temperature (
Figure 6A,C,D), a clear distinction between the genotypes was observed. The groups, represented by their 95% confidence ellipses, showed clear separation with minimal to no overlap. This well-defined clustering indicates that the physicochemical and spectral profiles of each genotype are inherently unique and remain stable at room temperature, enabling precise identification and differentiation using the LDA model. The low within-group variability suggests high homogeneity within each genotype under these conditions.
In contrast, the analysis of samples stored under refrigeration (
Figure 6B–D) revealed an altered discrimination pattern. Although the LDA model still succeeded in differentiating the genotypes, a notable reduction in the distance between group centroids and an increase in the overlap of the confidence ellipses were observed. This phenomenon suggests that refrigeration conditions attenuate the distinctive differences between the genotypes. The coherent clustering of replicates within each genotype confirms that refrigeration preserves sample integrity and reduces internal variability.
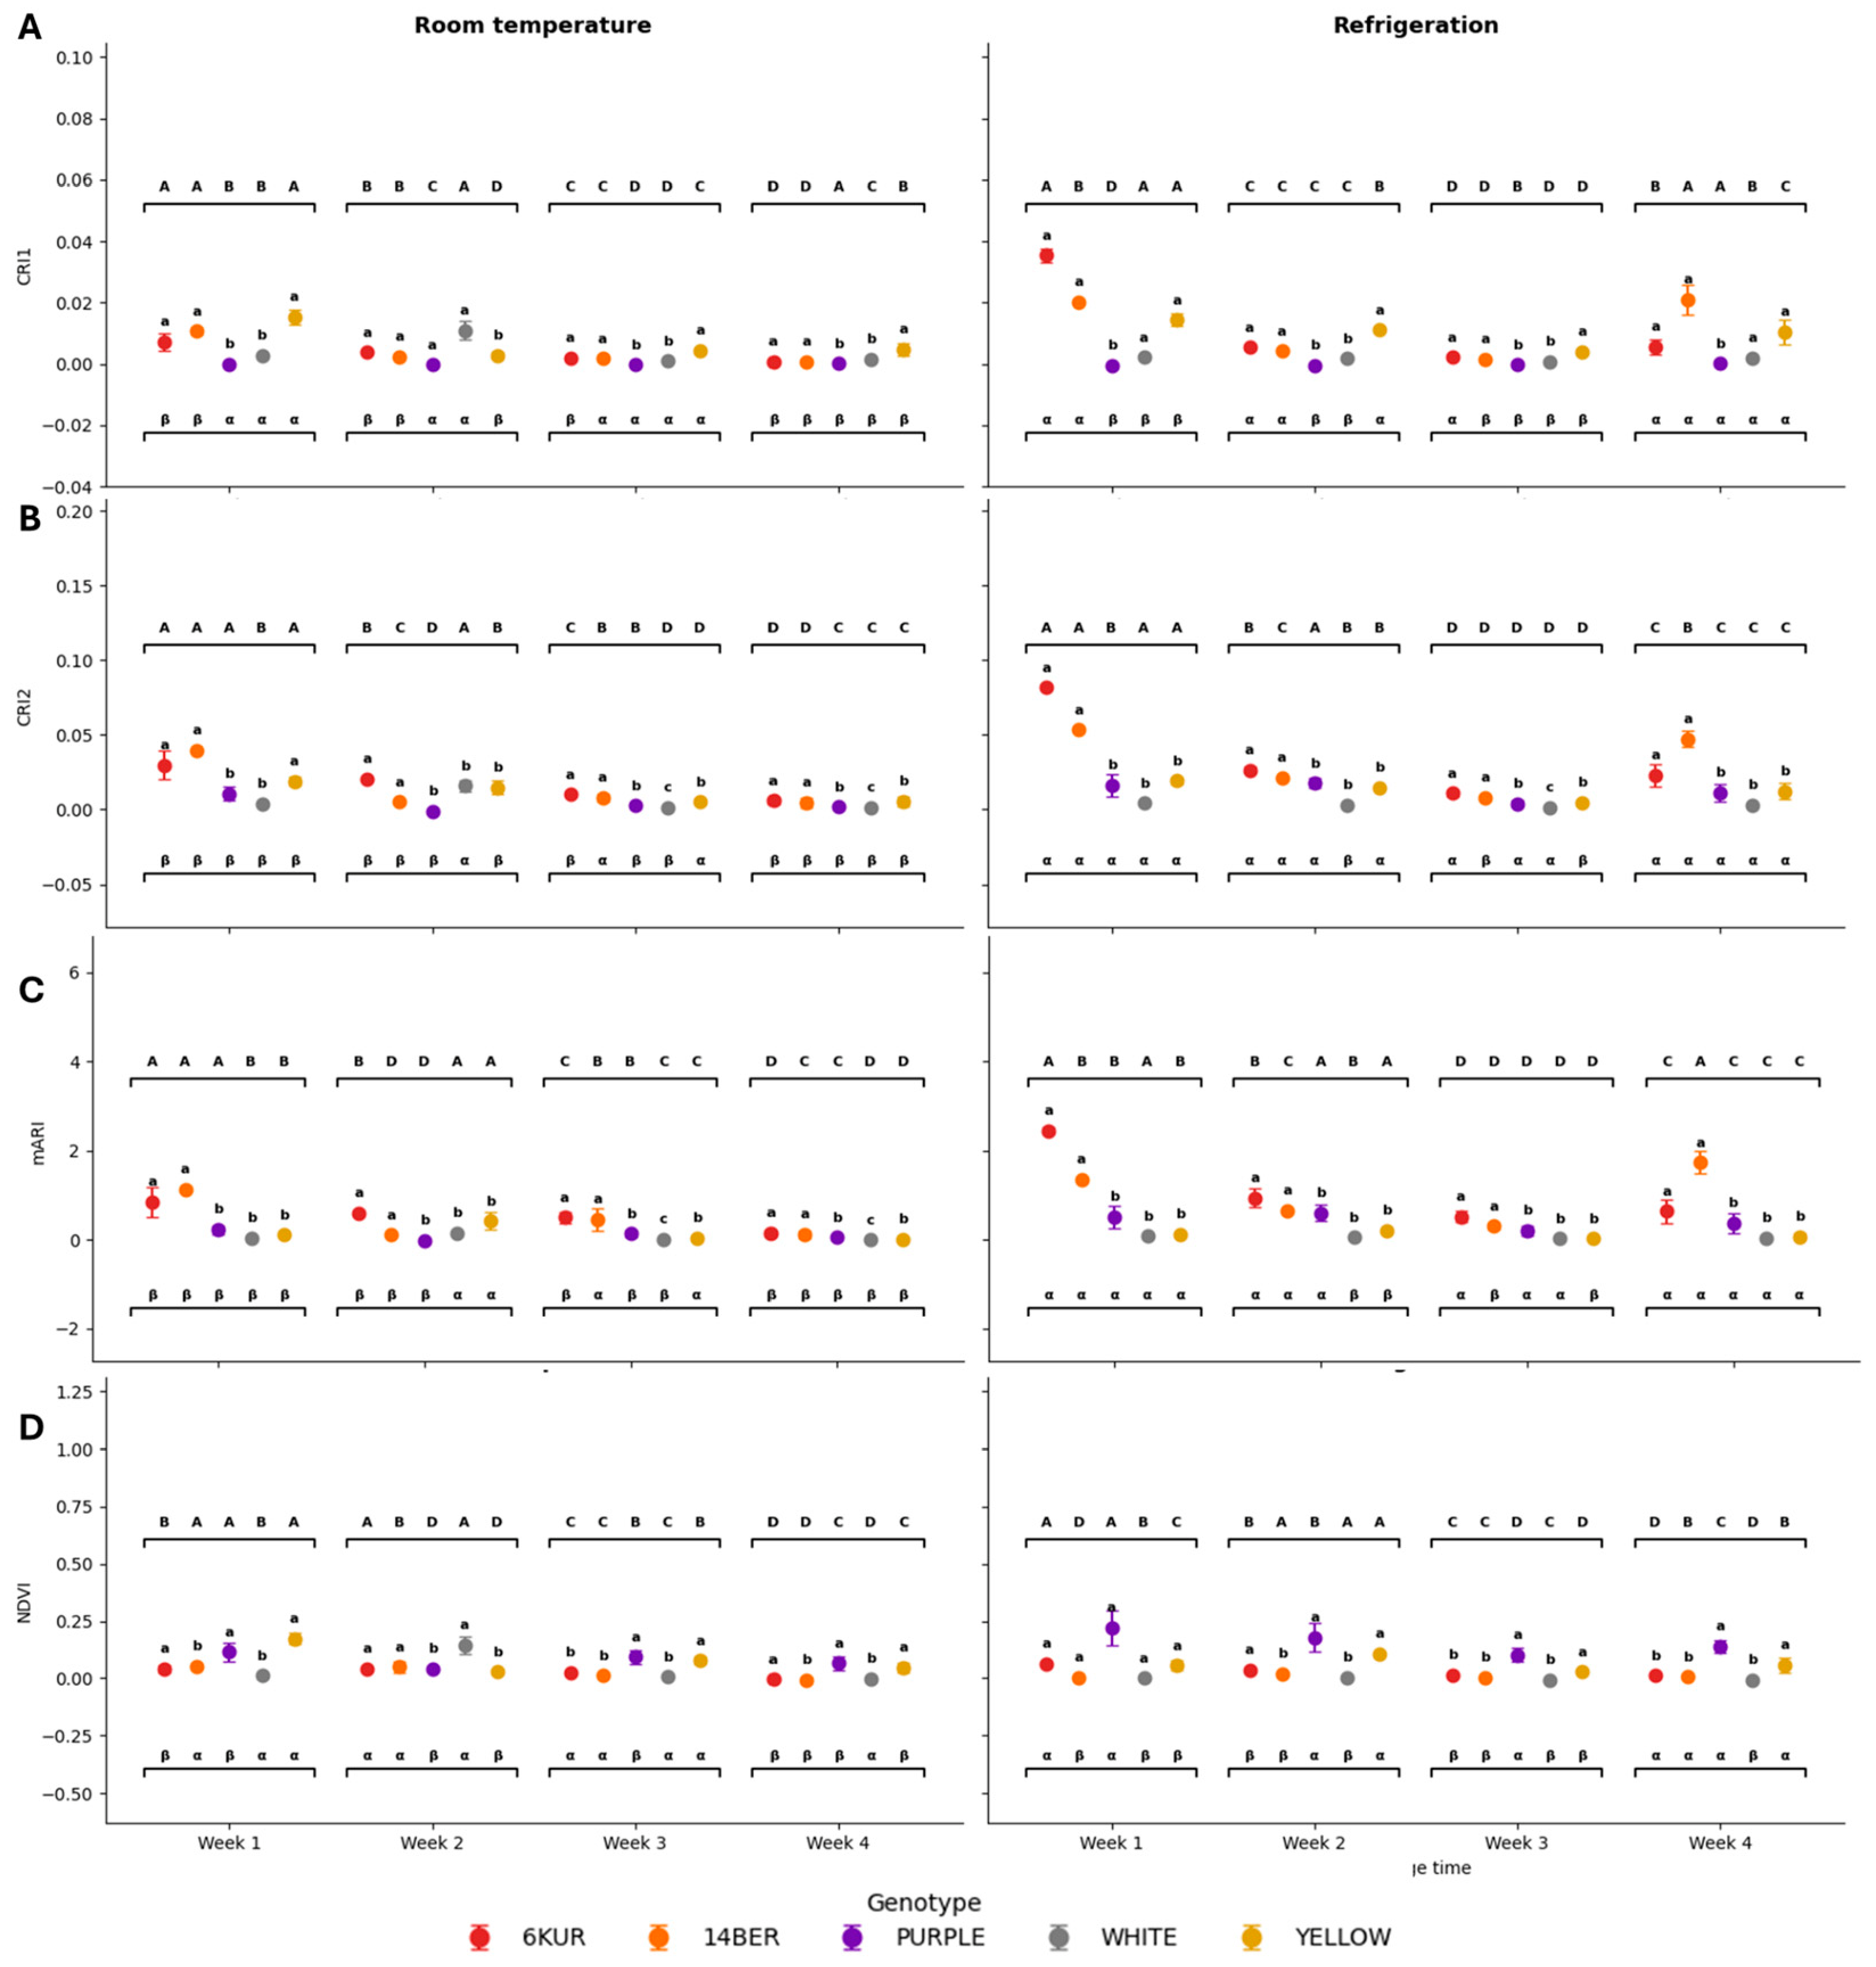
ART analysis of spectral indices measured on the external surface revealed significant effects of genotype, time, and their interactions across all evaluated indices (
Figure 7 and
Supplementary Table S2). For NDVI, significant effects were detected for genotype (F = 42.49,
p < 0.001, η
2 = 0.69) time (F = 19.93,
p < 0.001, η
2 = 0.43), genotype × treatment (F = 15.04,
p < 0.001), and genotype × time (F = 4.37,
p < 0.001), while storage temperature alone had no significant main effect (
p = 0.626, η
2 = 0.003), indicating that NDVI variation was primarily driven by genotype and postharvest time rather than temperature per se. However, the significant three-way interaction (G × T × W; F = 6.60,
p < 0.001) demonstrates that temperature effects emerge only when considered in combination with genotype and storage time.
For pigment-related indices, CR1, CRI2 and mARI exhibited significant main effects and interactions (p < 0.001 in all cases), with large effect sizes (η2 > 0.5). In CRI1, genotype (F = 38.78, η2 = 0.67), treatment (F = 85.33, η2 = 0.52) and time (F = 70.80, η2 = 0.73) all contributed to variation, with a significant three way-interaction (F = 18.47, η2 = 0.74), indicating complex, genotype-specific pigment degradation patterns across storage conditions. A similar pattern was observed for CRI2, where genotype (η2 = 0.78) and time (η2 = 0.73) explained most of the variability, and all interaction terms were significant (p < 0.001), confirming a strong dependency of carotenoid dynamics on the combined effects of genotype, temperature and storage duration. The mARI index also showed sensitivity to all factors, with significant effects of genotype (F = 75.32, η2 = 0.79), treatment (F = 78.57, η2 = 0.50), and time (F = 28.17, η2 = 0.52), as well as a significant three way interaction (F = 7.66, η2 = 0.54). This indicates that anthocyanin-related responses are dependent on storage conditions and vary markedly among genotypes.
From a biological perspective, purple and yellow genotypes showed consistently higher initial NDVI values than white and 6KUR, a difference that persisted throughout storage with varying magnitude. In contrast, carotenoid indices (CRI1 and CRI2) clearly differentiated orange genotypes (14BER and 6KUR), which consistently exhibited the highest values, while white carrots showed minimal variation, consistent with their low pigment content.
3.3. Biofunctional Characterization of Carrot Genotypes Under Different Storage Conditions over Time
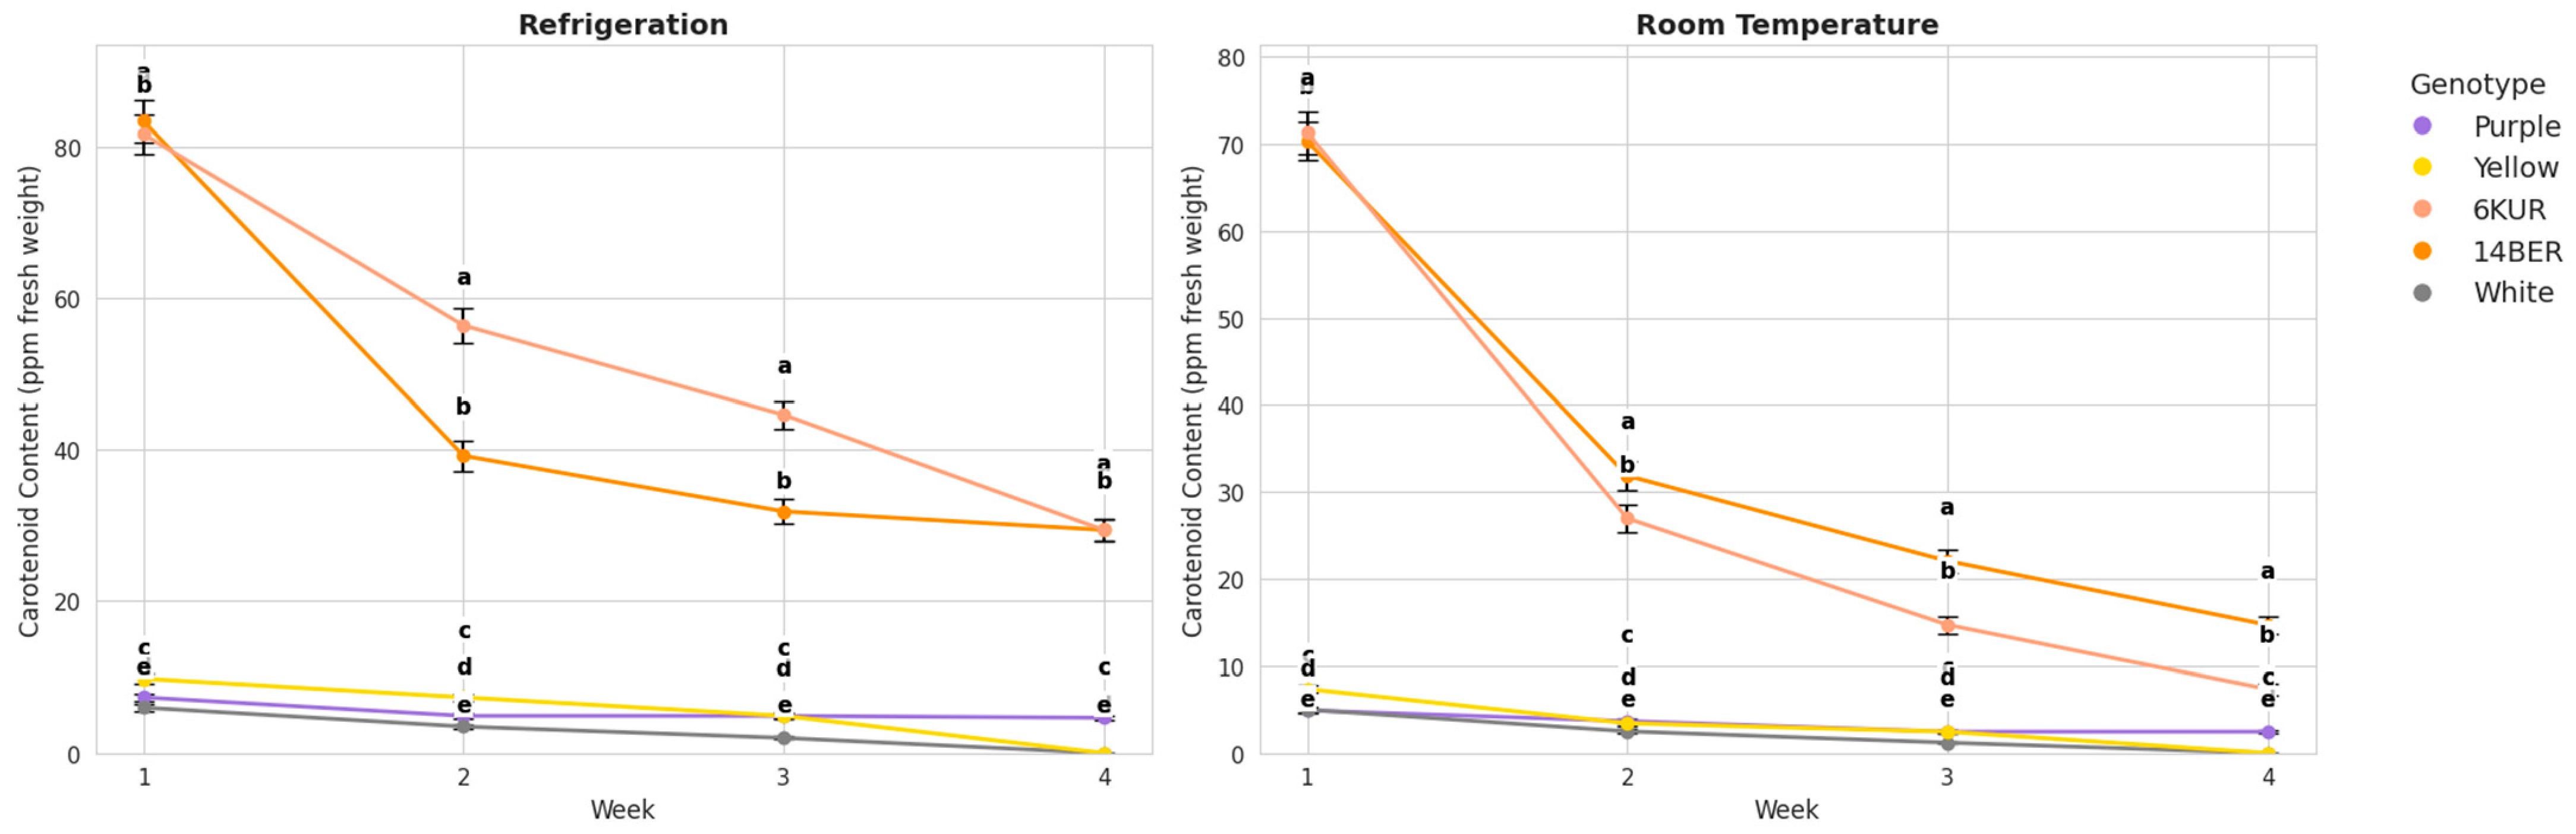
β-carotene content varied substantially among genotypes at baseline, with 14BER and 6KUR showing the highest initial concentrations under refrigeration (83.28 and 81.57 ppm, respectively), approximately double those of the remaining genotypes (
Table S3). Temporal monitoring (
Figure 8) revealed a consistent biphasic degradation pattern across all genotypes and storage conditions: a rapid initial phase during weeks 1–3 (30–53% loss) followed by a decelerated phase between weeks 3–4 (10–15% additional loss).
A logarithmic decay model (ppm = A·ln(week) + B) was fitted to the data for each genotype × storage condition combination (
Table S3; R
2 ≥ 0.83 for all fits). The degradation rate coefficient A was consistently negative across all cases, confirming progressive β-carotene loss over time. The steepest degradation was recorded for 6KUR at ambient temperature (A = −46.62), while purple under refrigeration showed the slowest decline (A = −1.925). The intercept parameter B closely matched observed week-1 values (e.g., 66.73 vs. 70.30 ppm for 14BER at ambient temperature), supporting model validity.
Refrigeration limited the weekly degradation rate to 2.1–2.8 ppm, compared to 4.3–5.6 ppm under ambient storage approximately twice the rate. Among all genotypes, purple showed the greatest postharvest stability, retaining 63.4% of its initial β-carotene after four weeks under refrigeration. In contrast, yellow and white genotypes reached complete β-carotene depletion at ambient temperature by week 4, underscoring the critical and differential role of both genotype and storage condition in carotenoid preservation.
3.4. Consumer Perception and Preference Evaluation of Carrot Genotypes Under Different Storage Conditions over Time
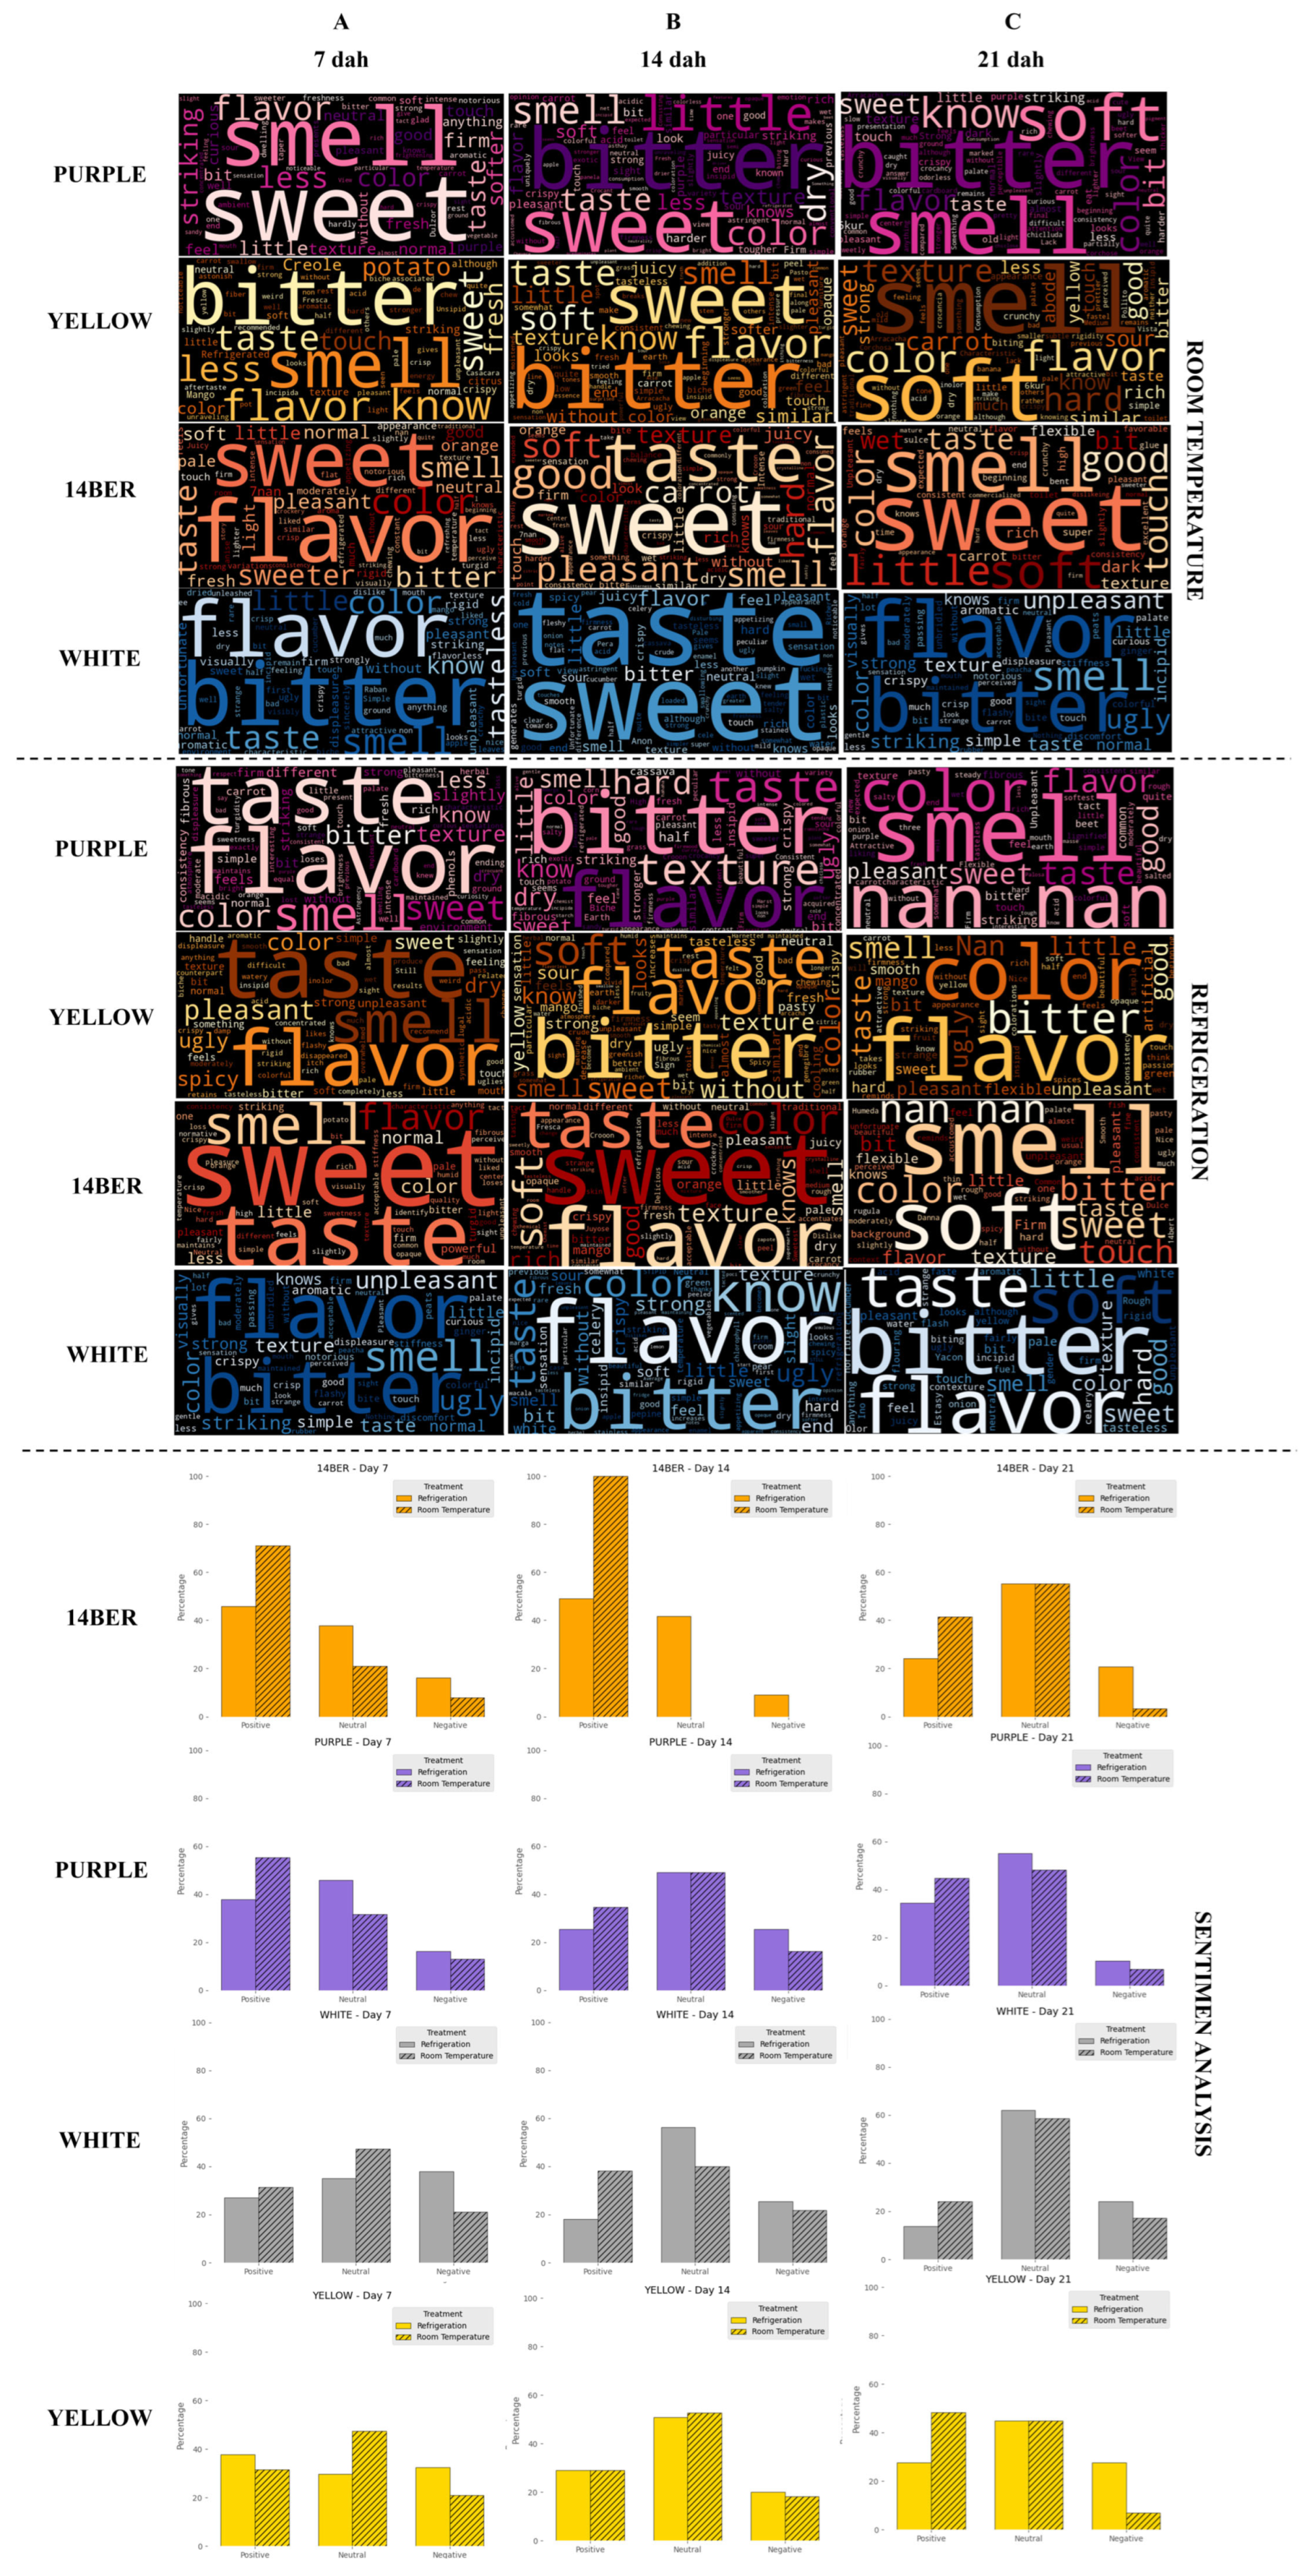
NLP analysis of consumer responses (
Figure 9) revealed progressive, genotype- and treatment-dependent shifts in sensory perception throughout storage. During week 1, refrigerated yellow and 14BER genotypes received predominantly positive descriptors “sweet” and “fresh” (37% frequency) with 68–72% positive sentiment scores. The descriptor “crunchy” (29% frequency) consistently co-occurred with firmness values exceeding 16 N, indicating strong alignment between instrumental texture and consumer perception. By week 2, ambient-stored samples showed early sensory deterioration, particularly in purple, where “soft” reached 27% frequency and positive sentiment dropped to 42% coinciding with a 32% firmness reduction compared to 18% in 14BER under identical conditions.
By week 3, deterioration was most pronounced in ambient-stored white carrots, which recorded 63% negative descriptors (“dry”, “fibrous”) and only 19% positive sentiment. Refrigerated yellow maintained comparatively higher acceptance (52% positive) associated with descriptors such as “juicy” (21% frequency) and stable soluble solids (8.4 °Brix). Under ambient conditions, purple reached only 15% positive responses with “unpleasant” at 38% frequency, versus 33% acceptance under refrigeration, demonstrating the pronounced moderating effect of storage temperature on sensory perception in pigmented genotypes.
Quantitative relationships between NLP outputs and instrumental parameters were consistent across genotypes. Texture-related descriptors explained 41% of variance in sentiment scores; “sweet” appearing in more than 25% of responses systematically corresponded with polarity scores above 0.6; and each 10% increase in negative descriptor frequency was associated with a 0.35-unit reduction in mean sentiment score. These relationships were most stable in yellow and 14BER, while purple and white showed faster and more pronounced sensory decline, particularly under ambient storage. Collectively, firmness loss emerged as the primary driver of consumer acceptance decline, followed by flavor profile deterioration.
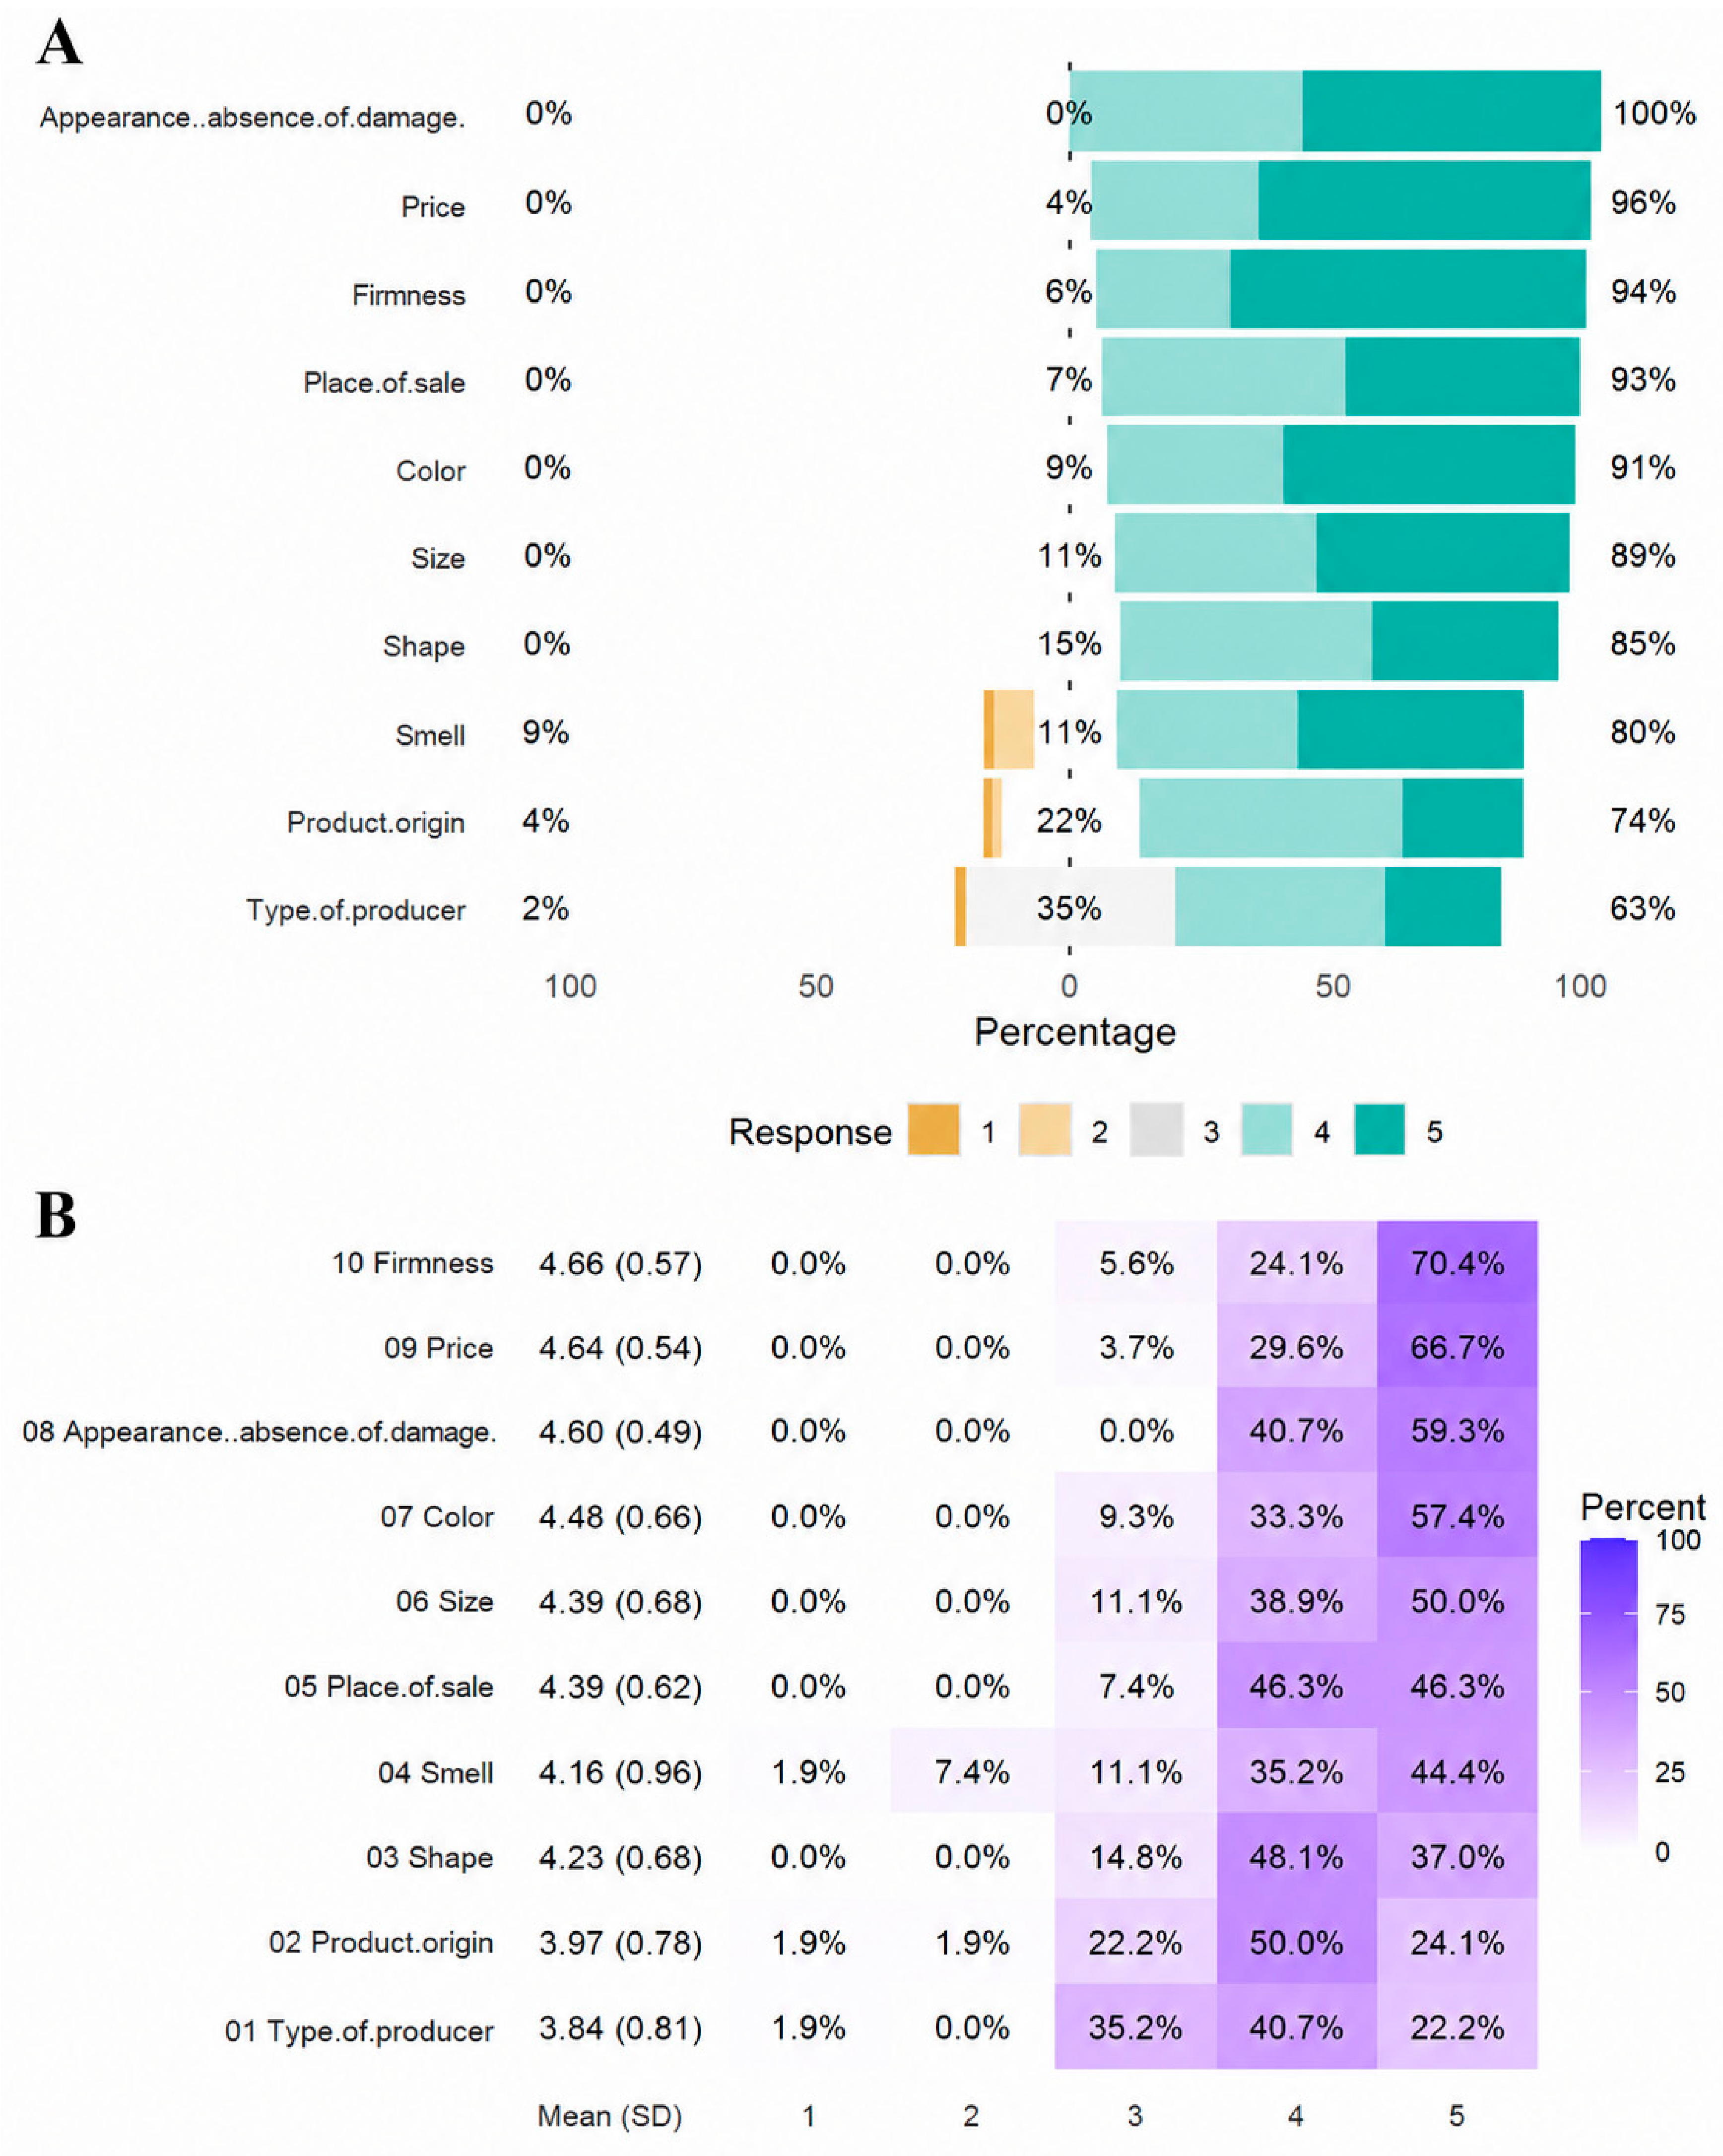
Consumer quality attribute prioritization (
Figure 10A) showed a clear hierarchy. Appearance and absence of damage was rated important by 100% of respondents, followed by price (96%) and firmness (94%), establishing visual integrity, cost, and texture as the primary drivers of carrot purchase decisions. Point of sale (93%), color (91%), and size (89%) ranked highly, while shape (85%) and odor (80%) were moderately important. Product origin (74%) and producer type (63%) were comparatively less prioritized.
The Likert-scale heat map (
Figure 10B) confirmed this hierarchy quantitatively. Firmness and price received the highest mean scores (4.66 and 4.64, respectively), with more than 70% of respondents assigning the maximum rating (score 5). Appearance followed with 59.3% at score 5. Color and size showed balanced distributions (57.4% and 50% at score 5, respectively), while point of sale and shape exhibited bimodal distributions concentrated at score 4 (46.3% and 48.1%). Odor showed greater variability (44.4% at score 5; 11.1% at score 3), reflecting divergent consumer opinions. Product origin and producer type received the lowest mean scores (3.97 and 3.84), with fewer than 25% of respondents assigning the maximum rating, indicating that production-related attributes are consistently subordinated to immediate sensory and economic factors in carrot quality perception.
4. Discussion
The findings of this study support the central hypothesis that postharvest quality deterioration in carrot is genotype- and storage condition-dependent, and that these dynamics can be characterized through the integration of physicochemical, biofunctional, spectral, and consumer perception assessment. The findings address a documented gap in the literature, where systematic comparative evidence across biochemically diverse carrot genotypes particularly pigmented materials with contrasting carotenoid and anthocyanin profiles under realistic storage conditions has been largely absent [
36].
The substantially lower β-carotene losses observed under refrigeration are consistent with the established role of low temperature in suppressing oxidative enzyme activity and reducing cell membrane permeability [
37], extending this evidence to a genotypically diverse panel that includes pigmented materials rarely evaluated simultaneously. The superior stability of purple carrots is consistent with the reported antioxidant capacity of anthocyanins, which delay carotenoid oxidation through reactive oxygen species scavenging and lipid peroxidation inhibition [
38,
39] a protective mechanism that was absent in yellow and white genotypes and translated into substantially greater degradation under both storage conditions. The logarithmic decay model provided a superior fit relative to zero-order and first-order kinetics in genotypes exhibiting biphasic degradation, consistent with the progressive depletion of labile carotenoid fractions leaving a structurally more stable residual [
40]. This kinetic framework constitutes the predictive component of the study and must be distinguished from the spectral indices, which were applied strictly as exploratory pattern detection tools without predictive validation, as clearly delineated in the
Section 2+.
The significant three-way interaction confirmed by ART-ANOVA indicates that the effect of storage temperature on quality preservation is not uniform across genotypes or time a finding with direct implications for genotype-tailored postharvest management that would not have been detectable in a simpler two-factor design. The apparent firmness stability under ambient storage is a well-recognized artifact in postharvest research [
41] attributable to dehydration-induced surface hardening rather than genuine textural integrity, as supported by the concurrent weight loss data. This dissociation underscores the importance of interpreting firmness measurements jointly with weight loss rather than as an isolated quality indicator [
42], a consideration that should be incorporated into future postharvest protocols for carrot. The progressive increase in titratable acidity under ambient storage is consistent with senescence-associated organic acid accumulation driven by mitochondrial dysfunction [
35,
42], while the biochemical stability observed under refrigeration is consistent with suppressed respiratory activity and preserved membrane integrity [
33] together providing a coherent mechanistic basis for the differential quality trajectories across storage conditions.
The genotype- and treatment-dependent temporal variation observed in spectral indices is consistent with the hypothesis that Vis/NIR reflectance can detect quality-related optical changes in biochemically diverse carrot material. The finding that NDVI variation was primarily explained by genotype identity and its interaction with storage environment rather than by temperature alone reinforces the importance of genotype-specific approaches to non-destructive quality monitoring, a direction not previously explored systematically across pigmented and non-pigmented carrot genotypes. The anomalous spectral convergence between purple and white genotypes under advanced ambient deterioration is mechanistically consistent with enzymatic oxidation of anthocyanins and phenolics by polyphenol oxidase and peroxidase, generating spectrally similar degradation products [
24,
38] demonstrating a critical boundary condition for index-based discrimination under severe quality loss. The lower-than-expected mARI values in purple carrots are consistent with documented spectral interference between anthocyanin and carotenoid absorption regions, and overlap with other phenolics [
16,
24,
30,
39], highlighting the need for genotype-specific calibration models before these indices can be operationalized in pigmented tissue. These limitations, now clearly acknowledged in the manuscript, define the scope within which the spectral characterization findings should be interpreted and identify specific methodological priorities for future predictive modeling work.
The LDA clustering patterns are most accurately interpreted through the lens of preservation efficacy rather than attenuation of intrinsic differences a distinction with important biological implications raised by one of the reviewers and adopted in the revised interpretation. Refrigeration preserves the initial biochemical identity of each genotype by suppressing stress-induced deterioration variance, while ambient storage amplifies apparent inter-genotype differences through accelerated and differential metabolic decay before driving phenotypic convergence in the most susceptible genotypes [
7]. This interpretation is mechanistically coherent with the concurrent kinetic modeling and physicochemical data, and avoids the speculative causal framing that characterized the original manuscript.
The progressive shifts in consumer descriptors from positive to negative across storage time are coherent with the physicochemical and biochemical deterioration trajectories documented instrumentally, particularly the loss of cell wall integrity and the accumulation of phenolic oxidation products [
16,
42,
43]. The high consumer priority assigned to firmness and appearance precisely the attributes that deteriorate most rapidly under ambient storage underscores the practical relevance of refrigeration and genotype selection for commercial postharvest chains. It must be emphasized that the spectral and sensory analyses were conducted as independent exploratory components, and the parallel temporal trajectories observed between spectral and perceptual shifts represent descriptive co-occurrences rather than statistical associations or causal relationships. Any formal linkage between spectral changes and consumer perception requires integrative predictive modeling on larger, purpose-designed datasets, and lies beyond the scope of the present work.
The exploratory scope of this study imposes boundaries on the generalizability of the findings. The small number of biological replicates, the coarse temporal resolution, the rotating consumer panel design, and laboratory-controlled storage conditions collectively limit extrapolation to commercial environments. The spectral interference between anthocyanins and carotenoids in purple tissue represents a specific technical constraint requiring resolution before mARI and related indices can be reliably deployed. Future research should prioritize designs enabling non-destructive repeated measurement on the same biological units, the development of validated predictive models using Partial Least Squares Regression or Support Vector Machines linking Vis/NIR spectra to quality parameters, and systematic evaluation of complementary postharvest technologies under commercial-scale cold chain conditions.



 ,
,