Article

Combined Metabolomic and Transcriptomic Analyses Reveal the Fruit Color Mutation in Ilex rotunda

College of Forestry and Grassland, Nanjing Forestry University, 159 Longpan Road, Xuanwu District, Nanjing 210037, China
*
Author to whom correspondence should be addressed.
Horticulturae 2026, 12(5), 557; https://doi.org/10.3390/horticulturae12050557
Submission received: 11 April 2026 / Revised: 27 April 2026 / Accepted: 29 April 2026 / Published: 2 May 2026
(This article belongs to the Section Fruit Production Systems)

Abstract

Ilex rotunda Thunb. is a prestigious ornamental tree renowned for its vibrant red fruits, yet the molecular mechanisms governing its fruit color variation remain poorly understood. The discovery of a rare yellow-fruited natural bud sport cultivar, ‘Peace Time’, provides an ideal model to investigate these processes compared to the wild-type red fruit. In this study, we integrated physiological evaluations, untargeted metabolomics, and de novo transcriptomics across multiple fruit developmental stages to elucidate the basis of this color transition. Our results demonstrated that the yellow phenotype is characterized by high lightness and yellowness values, driven by the profound suppression of anthocyanin biosynthesis. Biochemical and transcriptomic profiling revealed that DFR (dihydroflavonol 4-reductase), a critical “gatekeeper” gene, experiences severe transcriptional silencing in the yellow-fruited cultivar. This enzymatic bottleneck triggers a “passive substrate overflow,” redirecting shared precursors toward the parallel flavonol branch, resulting in the substantial accumulation of specific flavonols, including rutin and isoquercitrin. Furthermore, correlation network analysis highlighted a putative dual regulatory module associated with this metabolic reprogramming: the down-regulation of the putative activator bHLH30 coupled with the robust up-regulation of the putative repressor bHLH51, together likely contributing to the silencing of DFR transcription. These findings provide a comprehensive “dual-module” and “passive overflow” framework for fruit coloration in I. rotunda, highlighting a remarkable metabolic plasticity that reshapes this cultivar’s phytochemical profile and offers vital insights for future ornamental breeding.

1. Introduction

Ilex rotunda Thunb., a member of the Aquifoliaceae family, is a prestigious evergreen broad-leaved ornamental tree species widely distributed in East Asia. It is extensively utilized in urban landscaping and horticulture due to its elegant tree form, evergreen foliage, and dense clusters of vibrant red fruits that persist throughout the winter. Fruit color is one of the core traits determining the ornamental and economic value of Ilex species [1]. Although the majority of I. rotunda genotypes bear typical red fruits, a rare yellow-fruited natural bud sport cultivar, ‘Peace Time’ (TY), was discovered from a wild population in Fujian, China, in 2012 [2]. This cultivar is renowned not only for its distinct yellow fruits (RHS 13B) but also for its excellent heat tolerance and high horticultural value [2]. Crucially, it provides an ideal, unified genetic background model for investigating the complex metabolic and molecular networks underlying fruit color mutation in Ilex species.
The coloration of plant fruits is primarily determined by the proportional accumulation of chlorophylls, carotenoids, and flavonoids (especially anthocyanins). The phenylpropanoid and flavonoid metabolic pathways are considered among the most plastic secondary metabolic networks in the plant kingdom, where complex branch competition dictates the final metabolic profile [3]. Increasingly, multi-omics studies have shown that the mutation of plant organ color is often accompanied by a systemic reprogramming and redirection of the entire metabolic pathway [4,5]. For example, recent studies in sweet cherry, pomegranate, and sand rice have demonstrated that color variation during development is driven by profound metabolic flux redirection [6,7,8]. Within this network, late structural genes, such as dihydroflavonol 4-reductase (DFR), have been proven to act as core “gatekeepers” that determine the metabolic flux toward the terminal anthocyanin branch, as observed in crabapple and Nitraria [9,10].
Anthocyanin biosynthesis is precisely regulated at the transcriptional level, predominantly controlled by the MBW complex (MYB-bHLH-WD40) [11]. The bHLH family has undergone significant functional divergence during plant evolution, exhibiting complex patterns of synergism or antagonism in regulating flavonoid synthesis [12]. In addition to traditional positive activation mechanisms, active suppression by negative regulators (repressors) plays a crucial role in shutting down the anthocyanin biosynthetic pathway in response to developmental or environmental cues [13]. Crucially, the transcription of core structural genes like DFR is frequently targeted by specific bHLH or MYB repressors, which directly bind to their promoters to silence expression, thereby creating an enzymatic bottleneck that redirects the metabolic flux away from anthocyanins. Currently, the integrated analysis of transcriptomics and metabolomics has become a cutting-edge approach for elucidating these complex coloration mechanisms in various horticultural plants [5].
In the genus Ilex, preliminary progress has been made regarding the molecular basis of pigmentation. Comparative studies between the red and yellow fruits of Ilex verticillata, as well as leaf color mutations in specific Ilex cultivars, have confirmed that, relative to the normally pigmented wild-types, the failure of pigment accumulation in the yellow or mutant tissues is primarily caused by the down-regulation of core structural genes and the differential expression of key transcription factors [14,15]. Moreover, Ilex species are renowned for their rich diversity of color-determining flavonoids [16,17]. However, compared to the general mechanisms of coloration, the precise molecular switches responsible for the red-to-yellow transition in the fruits of the I. rotunda ‘Peace Time’ cultivar—particularly how antagonistic bHLH transcription factors affect fruit color by orchestrating “metabolic flux redirection”—remain to be systematically elucidated.
In this study, we conducted a comprehensive evaluation combining physiological assays, untargeted metabolomics, and transcriptomic analyses to dissect the wild-type red-fruited I. rotunda (TR) and its yellow-fruited mutant ‘Peace Time’ (TY). We aimed to pinpoint the core biochemical nodes and underlying molecular mechanisms responsible for the loss of anthocyanins and the red-to-yellow phenotypic transition. Our integrative analysis reveals that the profound silencing of the “gatekeeper” gene DFR—putatively orchestrated by an antagonistic bHLH regulatory module—triggers a passive substrate overflow toward the parallel flavonol branch. Ultimately, these findings not only elucidate the biochemical basis of fruit color mutation in I. rotunda but also provide a new theoretical framework for understanding metabolic flux redirection and molecular breeding in Ilex species.

2. Materials and Methods

2.1. Plant Materials, Experimental Design, and Sampling

To elucidate the mechanisms underlying fruit color variation, a comparative experimental design was established using two genotypes of Ilex rotunda across distinct developmental stages. The wild-type red-fruited ‘Rotunda’ (TR) and its yellow-fruited bud sport cultivar ‘Peace Time’ (TY) were investigated. Samples were collected from the Baima National Agricultural High-tech Zone in Nanjing, China (31°3′ N, 119°8′ E) in 2025. For each genotype, three healthy 10-year-old trees exhibiting uniform growth vigor were selected as independent biological replicates.
Based on their natural phenological characteristics, the experiment was structured around four distinct fruit developmental stages: 30th September (S1, green), 30th October (S2, turning), 29th November (S3, ripe), and 27th December (S4, senescent). For each sampled tree, fruits of the same stage were pooled to form representative composite samples. The downstream analyses were strategically divided into two modules: (1) Samples from all four stages (S1–S4) were utilized for phenotypic and physiological assays to capture the complete senescent process, (2) whereas samples from the key color-transition stages (S1–S3) were subjected to combined metabolomic and transcriptomic analyses. Stage S4 was specifically excluded from the multi-omics profiling to avoid the confounding effects of RNA degradation and generalized metabolic breakdown typical of senescence, which could obscure the specific molecular mechanisms driving active color formation. All physiological evaluations and multi-omics sequencing were strictly performed using three independent biological replicates per genotype per stage. Immediately following collection, all samples were snap-frozen in liquid nitrogen and stored at −80 °C for subsequent analysis.

2.2. Fruit Color and Phenotypic Characterization

Fruit skin color at stages S1–S4 was evaluated through both instrumental measurements and visual comparisons. Colorimetric parameters, including lightness (L*), red/green coordinate (a*), and yellow/blue coordinate (b*), were determined using a 3nh TS7036 handheld colorimeter (3nh, Shenzhen, China) by measuring three equatorial points on ten fruits per sample (n = 30). Additionally, the fruits were photographed using a Canon R6 Mark II camera (Canon Inc., Tokyo, Japan), and their visual colors were cross-referenced with the RHS Colour Chart to assign standard color codes for each genotype across all developmental stages.

2.3. Pigment Contents Determination

The concentrations of total chlorophyll (Chl), carotenoids (Car), and anthocyanins (Anth) in the fruit peel were determined via spectrophotometry, following established protocols [18,19,20] with minor modifications. For Chl and Car quantification, approximately 0.1 g of frozen peel powder was extracted with 5 mL of 95% ethanol and incubated in the dark at room temperature for 24 h. The absorbance of the extract was measured at 470, 649, and 665 nm using a UV-3802 spectrophotometer (Unico Instruments Co., Ltd., Shanghai, China).
For anthocyanin extraction, 0.1 g of the frozen sample was mixed with 2 mL of an HCl:H2O:methanol solution (1:3:16, v/v/v) and incubated in the dark at 4 °C for 48 h. After centrifugation (5000 rpm, 4 °C, 5 min), the absorbance of the supernatant was recorded at 530 and 653 nm. The anthocyanin content was calculated using the following formula [19]: A n t h m g · g 1 F W = A 530 0.24 × A 653 × V W , where V is the extraction volume (2 mL) and W is the fresh weight (0.1 g). Three biological replicates were conducted for each variety across all developmental stages.

2.4. Enzyme Activity Determination

The activities of key enzymes in the flavonoid biosynthesis pathway—including phenylalanine ammonia-lyase (PAL, EC 4.3.1.24), chalcone isomerase (CHI, EC 5.5.1.6), dihydroflavonol 4-reductase (DFR, EC 1.1.1.219), and UDP-glucose: flavonoid 3-O-glucosyltransferase (UFGT, EC 2.4.1.91)—were determined spectrophotometrically according to established protocols [21,22,23,24,25]. All enzyme extraction procedures were performed at 4 °C. For the PAL and CHI assays, 0.5 g of frozen peel powder was homogenized in 50 mM phosphate buffer (pH 7.0) containing 50 mM ascorbic acid and 18 mM β-mercaptoethanol. Following centrifugation at 15,000× g for 20 min, the supernatant was collected as the crude enzyme extract. The PAL reaction mixture, comprising 1 mL of crude extract, 1 mL of 20 mM L-phenylalanine (in 100 mM borate buffer, pH 8.8), and 2 mL of distilled water, was incubated at 30 °C for 30 min. PAL activity was defined as an absorbance increase of 0.01 units per minute at 290 nm (U·g−1 FW). CHI activity was assessed concurrently using the corresponding standard procedure, quantified based on the specific absorbance change (U·g−1 FW).
For DFR extraction, 1.0 g of the sample was homogenized in 0.2 M Tris-HCl buffer (pH 7.5) containing 25% (v/v) glycerol and 0.1 M DTT [24]. The collected supernatant was mixed with 0.1 M Tris-HCl buffer (pH 7.5) supplemented with 1 μM NADPH and 0.5 μM dihydroquercetin. After a 120-min incubation at 30 °C, the decrease in absorbance was monitored at 340 nm. DFR activity was expressed as the amount of enzyme required to oxidize 1 nmol of NADPH per minute per gram of fresh weight (U·g−1 FW).
For the UFGT activity assay, 1.0 g of peel powder was initially washed twice with pre-cooled acetone (−20 °C) to remove interfering substances. The resulting precipitate was extracted using 0.1 M borate buffer (pH 8.8) containing 5 mM ascorbic acid [25]. The enzyme extract was then reacted with 50 mM diglycine buffer (pH 8.0) containing 1 mM quercetin and 2.5 mM UDP-glucose. Following the enzymatic reaction, UFGT activity was quantified based on the absorbance change at 350 nm, with one unit (U) defined as an absorbance variation of 0.001 per minute (U·g−1 FW).

2.5. Untargeted Metabolomics Analysis

2.5.1. Sample Preparation and LC-MS/MS Analysis

Fruit samples were ground into a fine powder in liquid nitrogen. Approximately 30 mg of the powder was extracted with 400 μL of a pre-cooled (−40 °C) methanol–water solution (1:1, v/v). The mixture was vortexed for 5 min, sonicated at 40 °C for 10 min, and incubated at 4 °C for 2 h. Following centrifugation at 12,000 rpm for 15 min at 4 °C, the supernatant was collected and vacuum-concentrated to dryness. The dried residue was reconstituted in 100 μL of 50% aqueous methanol, vortexed for 3 min, and centrifuged again (12,000 rpm, 4 °C, 15 min).
UPLC-MS/MS analyses were performed using a Vanquish UHPLC system coupled with an Orbitrap Q Exactive™ HF-X mass spectrometer (Thermo Fisher Scientific, Bremen, Germany) at Gene Denovo Biotechnology Co., Ltd. (Guangzhou, China). During the analysis, samples were maintained in an autosampler at 8 °C. Chromatographic separation was achieved on a Waters ACQUITY UPLC HSS T3 column (2.1 × 100 mm, 1.8 µm; Waters, Milford, MA, USA). The injection volume was 2 μL, the column temperature was set to 40 °C, and the flow rate was maintained at 0.3 mL/min. The mobile phases consisted of water containing 0.1% formic acid (phase A) and acetonitrile (phase B). The chromatographic gradient elution program was set as follows: 0–0.5 min, 2% B; 0.5–2 min, 2–50% B; 2–5 min, 50–98% B; 5–8 min, 98% B; 8–10 min, 98–2% B; and 10–12 min, 2% B.
The Q Exactive™ HF-X mass spectrometer (Thermo Fisher Scientific, Bremen, Germany) was operated in both positive and negative polarity modes with a spray voltage of 3.6 kV. The operating parameters were as follows: sheath gas flow rate, 30 L/min; auxiliary gas flow rate, 25 L/min; S-Lens RF level, 40; capillary temperature, 325 °C; and auxiliary gas temperature, 300 °C. Full MS scans were acquired at a resolution of 60,000 FWHM, followed by MS/MS secondary scanning using data-dependent acquisition (DDA) at a resolution of 15,000 FWHM. Fragmentation was performed using Higher-energy C-trap Dissociation (HCD) with normalized collision energies (NCE) of 20, 30, and 40. The Top N was set to 10, the scanning range was 70–1050 m/z, and the total scanning duration was 12 min.

2.5.2. Data Processing, Metabolite Identification, and Relative Quantification

The raw LC-MS/MS data were processed using Compound Discoverer 3.3 (Thermo Fisher Scientific, Waltham, MA, USA) for peak identification, peak extraction, and retention time correction. The parameters for peak alignment were set as follows: alignment model, adaptive curve; maximum shift, 0.5 min; mass tolerance, 10 ppm; intensity tolerance, 30%; and signal-to-noise (S/N) threshold, 1.5. For metabolite identification, the secondary mass spectrometry (MS/MS) spectra were matched against an automated multi-database search tool (including mzCloud, ChemSpider, KEGG, and HMDB) and a local mzVault spectral library. The identification parameters included a mass tolerance of 10 ppm and a match factor threshold of 10. For relative quantification, missing values in the extracted peak areas were first imputed using linear regression. Subsequently, the data were normalized to the median of the maximum peak areas across all samples to obtain the relative peak areas. These normalized relative peak areas were then used for downstream statistical analyses.
Multivariate statistical analyses, including Orthogonal Partial Least Squares Discriminant Analysis (OPLS-DA), were performed to evaluate the metabolic differences between groups. Differential metabolites (DMs) were identified based on a Variable Importance in Projection (VIP) score ≥ 1 and a Student’s t-test p-value < 0.05. The identified DMs were subsequently mapped to the Kyoto Encyclopedia of Genes and Genomes (KEGG) database for annotation and pathway enrichment analysis. Pathways with a False Discovery Rate (FDR) ≤ 0.05 were defined as significantly enriched.

2.6. Transcriptome Sequencing and Bioinformatics Analysis

2.6.1. Library Construction and Sequencing

Total RNA was extracted from the S1–S3 stages of the two varieties using the RNAsimple Total RNA Kit (Tiangen Biotech, Beijing, China). RNA quality and integrity were assessed using a Qsep100 DNA Analyzer (Bioptic, Taiwan, China). For library preparation, messenger RNA (mRNA) was enriched from total RNA using oligo(dT) magnetic beads. The enriched mRNA was fragmented and reverse-transcribed into first-strand cDNA, followed by second-strand cDNA synthesis to form stable double-stranded cDNA. The cDNA fragments subsequently underwent end-repair, A-tailing, and sequencing adapter ligation. After purification using Hieff NGS® DNA Selection Beads (Yeasen, Shanghai, China), the fragments were enriched via PCR amplification to construct the final sequencing libraries. The libraries were sequenced on an Illumina NovaSeq X Plus platform (Illumina, San Diego, CA, USA) by Gene Denovo Biotechnology Co., Ltd. (Guangzhou, China), generating 150 bp paired-end reads.

2.6.2. De Novo Assembly and Differential Expression Analysis

Raw sequencing reads were filtered using fastp (v0.18.0) to remove low-quality reads and adapter sequences. In the absence of a reference genome for I. rotunda, the high-quality clean reads were de novo assembled into unigenes using the Trinity platform (v2.8.4). Transcript abundance was quantified using RSEM and normalized to Transcripts Per Million (TPM) values. Differential expression analysis between the TR and TY groups was performed using the DESeq2 R package (v1.20.0). Unigenes satisfying the criteria of a False Discovery Rate (FDR) < 0.05 and an absolute log 2 F o l d   c h a n g e > 1 were defined as differentially expressed genes (DEGs). Furthermore, Gene Set Enrichment Analysis (GSEA) was performed using the R package clusterProfiler to evaluate the coordinated expression shifts in metabolic pathways without relying on a pre-defined DEG threshold. All expressed genes were pre-ranked based on the signal-to-noise metric between the TR and TY groups. The KEGG pathway database was utilized as the reference, and statistical significance was assessed via 1000 permutations. Pathways satisfying an absolute Normalized Enrichment Score (|NES|) > 1 and an FDR < 0.25 were defined as significantly polarized.

2.7. Multi-Omics Integration and Network Analysis

To systematically investigate the core regulatory mechanisms underlying flavonoid biosynthesis, an integrative analysis of the transcriptome, metabolome, and physiome was conducted. Pearson correlation coefficients (PCC) were calculated to evaluate the relationships between differentially expressed genes and major differential metabolites (including rutin, quercetin, isoquercitrin, and total anthocyanins). A strict threshold of |PCC| ≥ 0.8 and p < 0.05 was applied to identify significant correlations. The resulting gene-metabolite correlation matrix was visualized as a heatmap using the R package pheatmap, where color gradients indicate positive (red) and negative (blue) correlations. Furthermore, a core regulatory network was constructed based on these significant correlations and visualized using Cytoscape software (v3.9.1) to illustrate the directional interactions (positive or negative) among specific genes (e.g., CHI, BHLH51, DFR, PAL) and metabolites within the flavonoid pathway.

2.8. qRT-PCR Validation

Total RNA was extracted and reverse-transcribed as described in Section 2.6.1. The qRT-PCR assays for six flavonoid-related genes (DFR, bHLH30, bHLH51, CHI, CHS, and FLS2) were performed on an ABI 7500 Real-Time PCR System (Thermo Fisher Scientific, Waltham, MA, USA) using the SuperReal PreMix Plus kit (Tiangen Biotech, Beijing, China). Specific primers (Table S1) were designed via Primer Premier 5 (PREMIER Biosoft, Palo Alto, CA, USA). Relative expression levels were calculated using the 2−ΔΔCt method [26], normalized to the ACT7 gene (Unigene0008312). All assays were conducted with three biological and three technical replicates.

2.9. Statistical Analysis

All physiological, biochemical, and gene expression data are expressed as the mean ± standard error of the mean (SEM) of three independent biological replicates. Statistical analyses were performed using SPSS 27.0 software (IBM Corp., Armonk, NY, USA). For physiological and biochemical parameters, a two-way analysis of variance (ANOVA) was employed to evaluate the main effects and interactions of the developmental stage and genotype, followed by Tukey’s honestly significant difference (HSD) test. For comparisons across different developmental stages within the same variety, significant differences were denoted by distinct lowercase letters (for TR) and uppercase letters (for TY). Differences between the two varieties at the same developmental stage were evaluated using Bonferroni’s multiple comparisons test. For the qRT-PCR results, an independent samples Student’s t-test was utilized to assess the statistical significance of gene expression differences between the TR and TY varieties at corresponding stages. Statistical significance across all tests was indicated by asterisks (* p < 0.05, ** p < 0.01, *** p < 0.001). Graphical representations of these data were generated using GraphPad Prism 9.5 (GraphPad Software, San Diego, CA, USA). Multi-omics data visualizations and clustering analyses were executed using R software v4.5.0 (R Foundation for Statistical Computing, Vienna, Austria).

3. Results

3.1. Phenotypic and Colorimetric Variations During Fruit Development

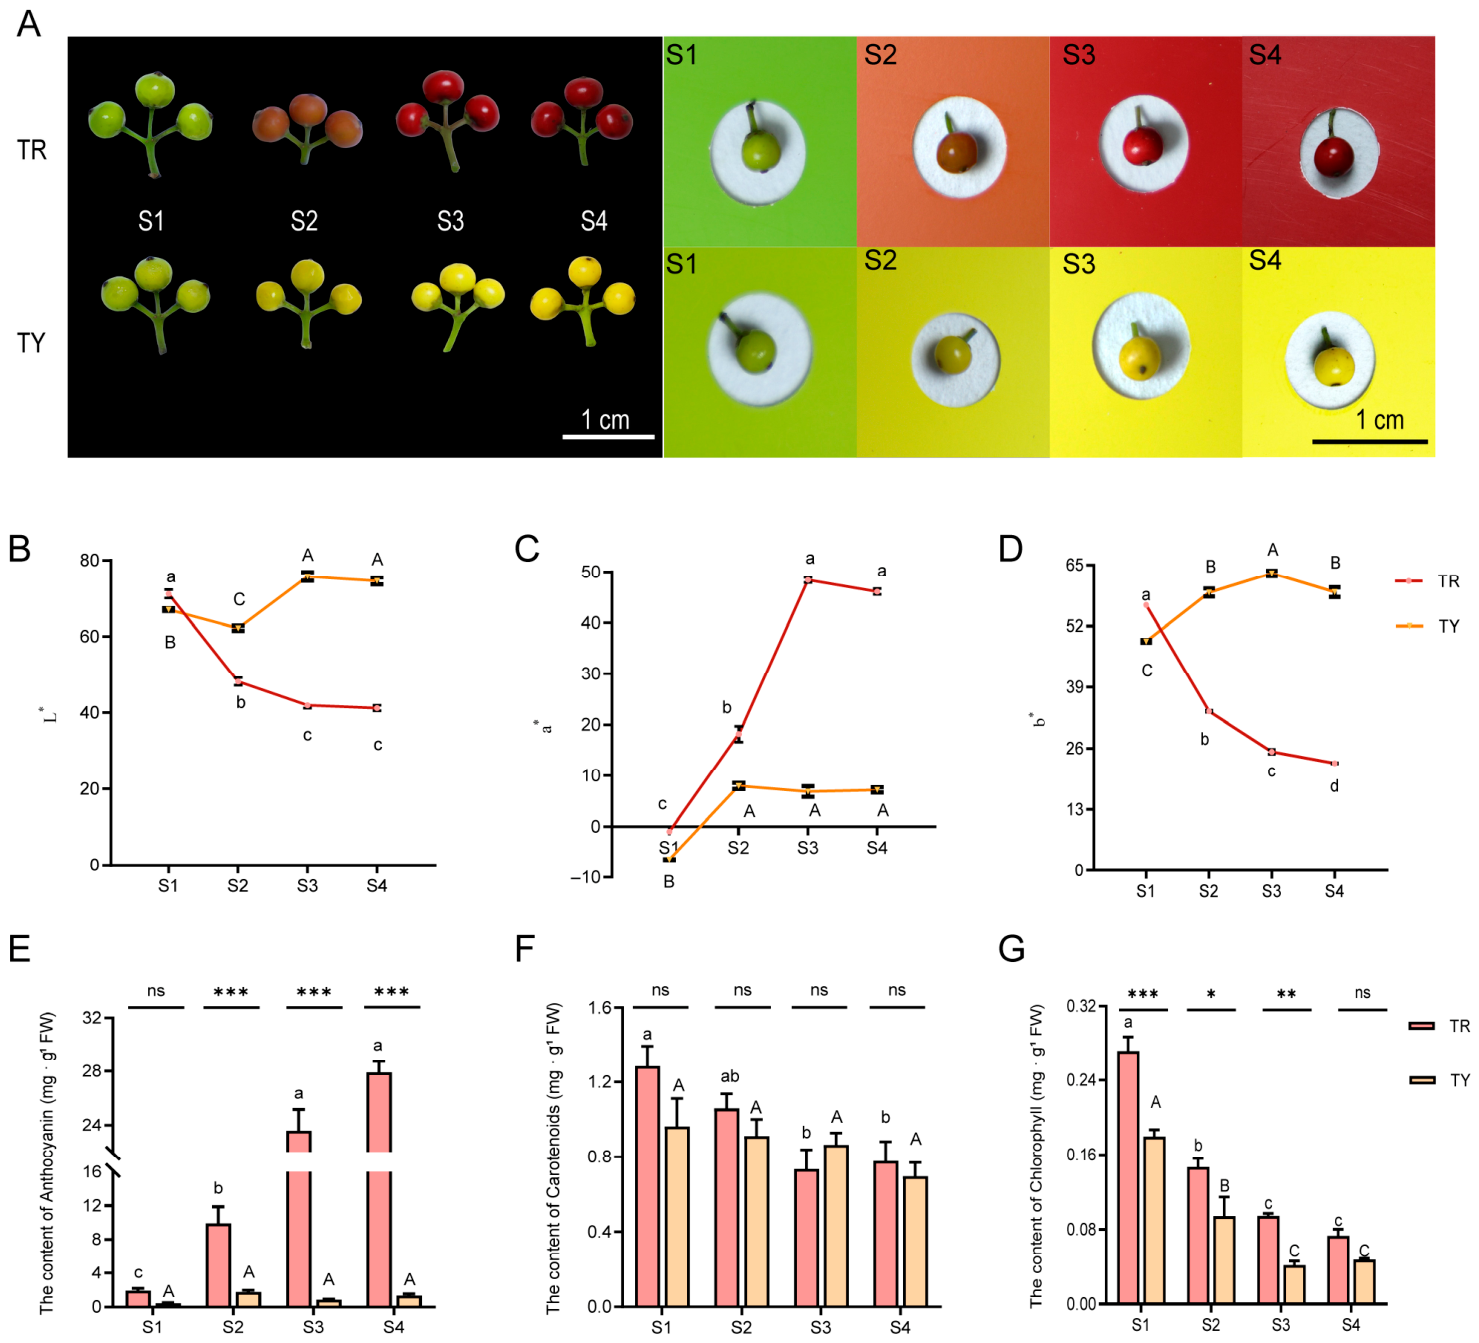
The visual phenotypes of TR and TY fruits displayed distinctly different developmental trajectories (Figure 1A). According to the RHS Color Chart (Table S2), TR fruits transitioned from Strong Yellow-Green (144A) at S1 to Vivid Red (46B/45B) at S3 and S4 stages. In contrast, TY fruits shifted from Strong Yellow-Green (144B) to Vivid Yellow (12B/13A). These visual observations were quantitatively supported by colorimetric parameters (Figure 1B–D and Table S3). In TR fruits, lightness (L*) and yellowness (b*) values significantly decreased (p < 0.05) as maturation progressed, whereas redness (a*) exhibited a dramatic surge, increasing from −0.96 at S1 to the peak of 48.41 at S3. Conversely, TY fruits maintained relatively high L* and b* values throughout development, with the b* value peaking at 63.20 at S3, while their a* values remained consistently low (below 8.00).

3.2. Dynamic Accumulation of Pigments in TR and TY Fruits

To elucidate the biochemical basis underlying these color divergences, the dynamic changes in major pigments were quantified (Figure 1E–G and Table S3). Both TR and TY fruits exhibited a continuous decline in total chlorophyll content from S1 to S4 (Figure 1G), corresponding to the fading of the initial green background. Carotenoid concentrations showed a slight downward trend in both varieties and remained at relatively low levels (<1.3 mg·g−1 FW) throughout the developmental stages (Figure 1F). Notably, the most striking difference between the two genotypes was observed in anthocyanin accumulation (Figure 1E). In TR fruits, the anthocyanin content increased exponentially during the turning and ripening stages, rising dramatically from 1.91 mg·g−1 FW (S1) to 27.89 mg·g−1 FW (S4), a pattern that strictly paralleled the surge in the a* value. In sharp contrast, anthocyanin accumulation was severely suppressed in TY fruits, with concentrations remaining at trace levels (<1.8 mg·g−1 FW) across all four stages. These physiological data strongly indicate that the specific impairment of anthocyanin biosynthesis, rather than alterations in carotenoid metabolism, is the primary biological determinant of the yellow fruit phenotype in TY fruits.

3.3. Activities of Key Enzymes in the Flavonoid Biosynthesis Pathway

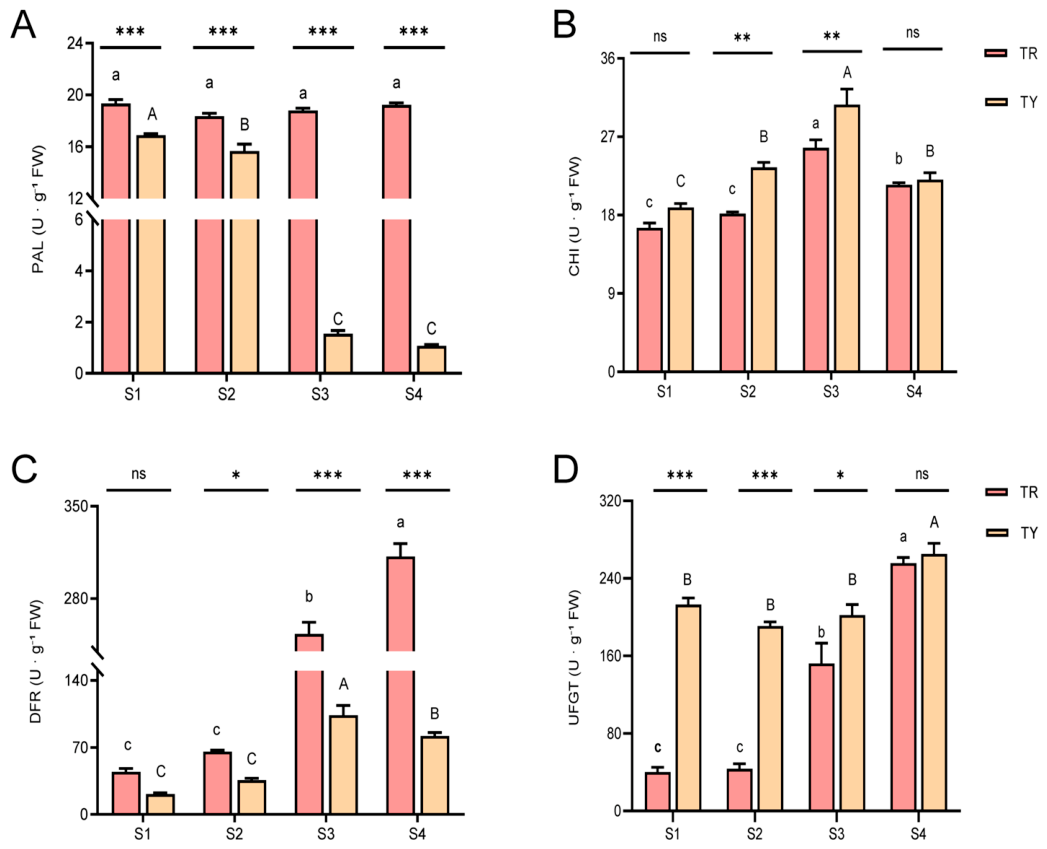
To elucidate the biochemical basis underlying the differential anthocyanin accumulation, the activities of four pivotal enzymes in the flavonoid biosynthetic pathway were assayed across the developmental stages (Figure 2A–D and Table S4). PAL, the primary rate-limiting enzyme of the upstream phenylpropanoid pathway, maintained consistently high activity in TR fruits, which was significantly higher than that in TY (p < 0.05) across all stages (Figure 2A). Similarly, the activity of CHI, an early-stage flavonoid enzyme, gradually increased during TR maturation and peaked at S3, whereas the activity exhibited a different fluctuation pattern in TY (Figure 2B). The robust activities of PAL and CHI indicate that the upstream metabolic flux providing flavonoid precursors was highly active in both genotypes, although it was significantly stronger in TR.
However, the activities of downstream, anthocyanin-specific enzymes exhibited dramatic divergences in their dynamic patterns (Figure 2C,D). In TR fruits, DFR experienced a profound up-regulation during the S2 and S3 stages, continuing to rise and peaking at S4, which strongly correlated with the exponential accumulation of anthocyanins. In contrast, DFR activity in the TY variety maintained a relatively stable and low basal level throughout the entire developmental process, lacking the developmental surge observed in TR. Consequently, DFR activity in TR was significantly higher than that in TY during the critical S3 and S4 stages. Although UFGT in TY showed high basal activity and an upward trend, its overall pattern was distinct from the coordinated surge observed in TR.
These findings strongly suggest that the divergent dynamic patterns of late structural enzymes—particularly the failure of the critical DFR to up-regulate coordinately in TY—limit the terminal anthocyanin biosynthetic branch. This enzymatic divergence provides the direct biochemical prerequisite for the subsequent redirection of metabolic flux.

3.4. Global Metabolomic Alterations and Redirection of Flavonoid Flux

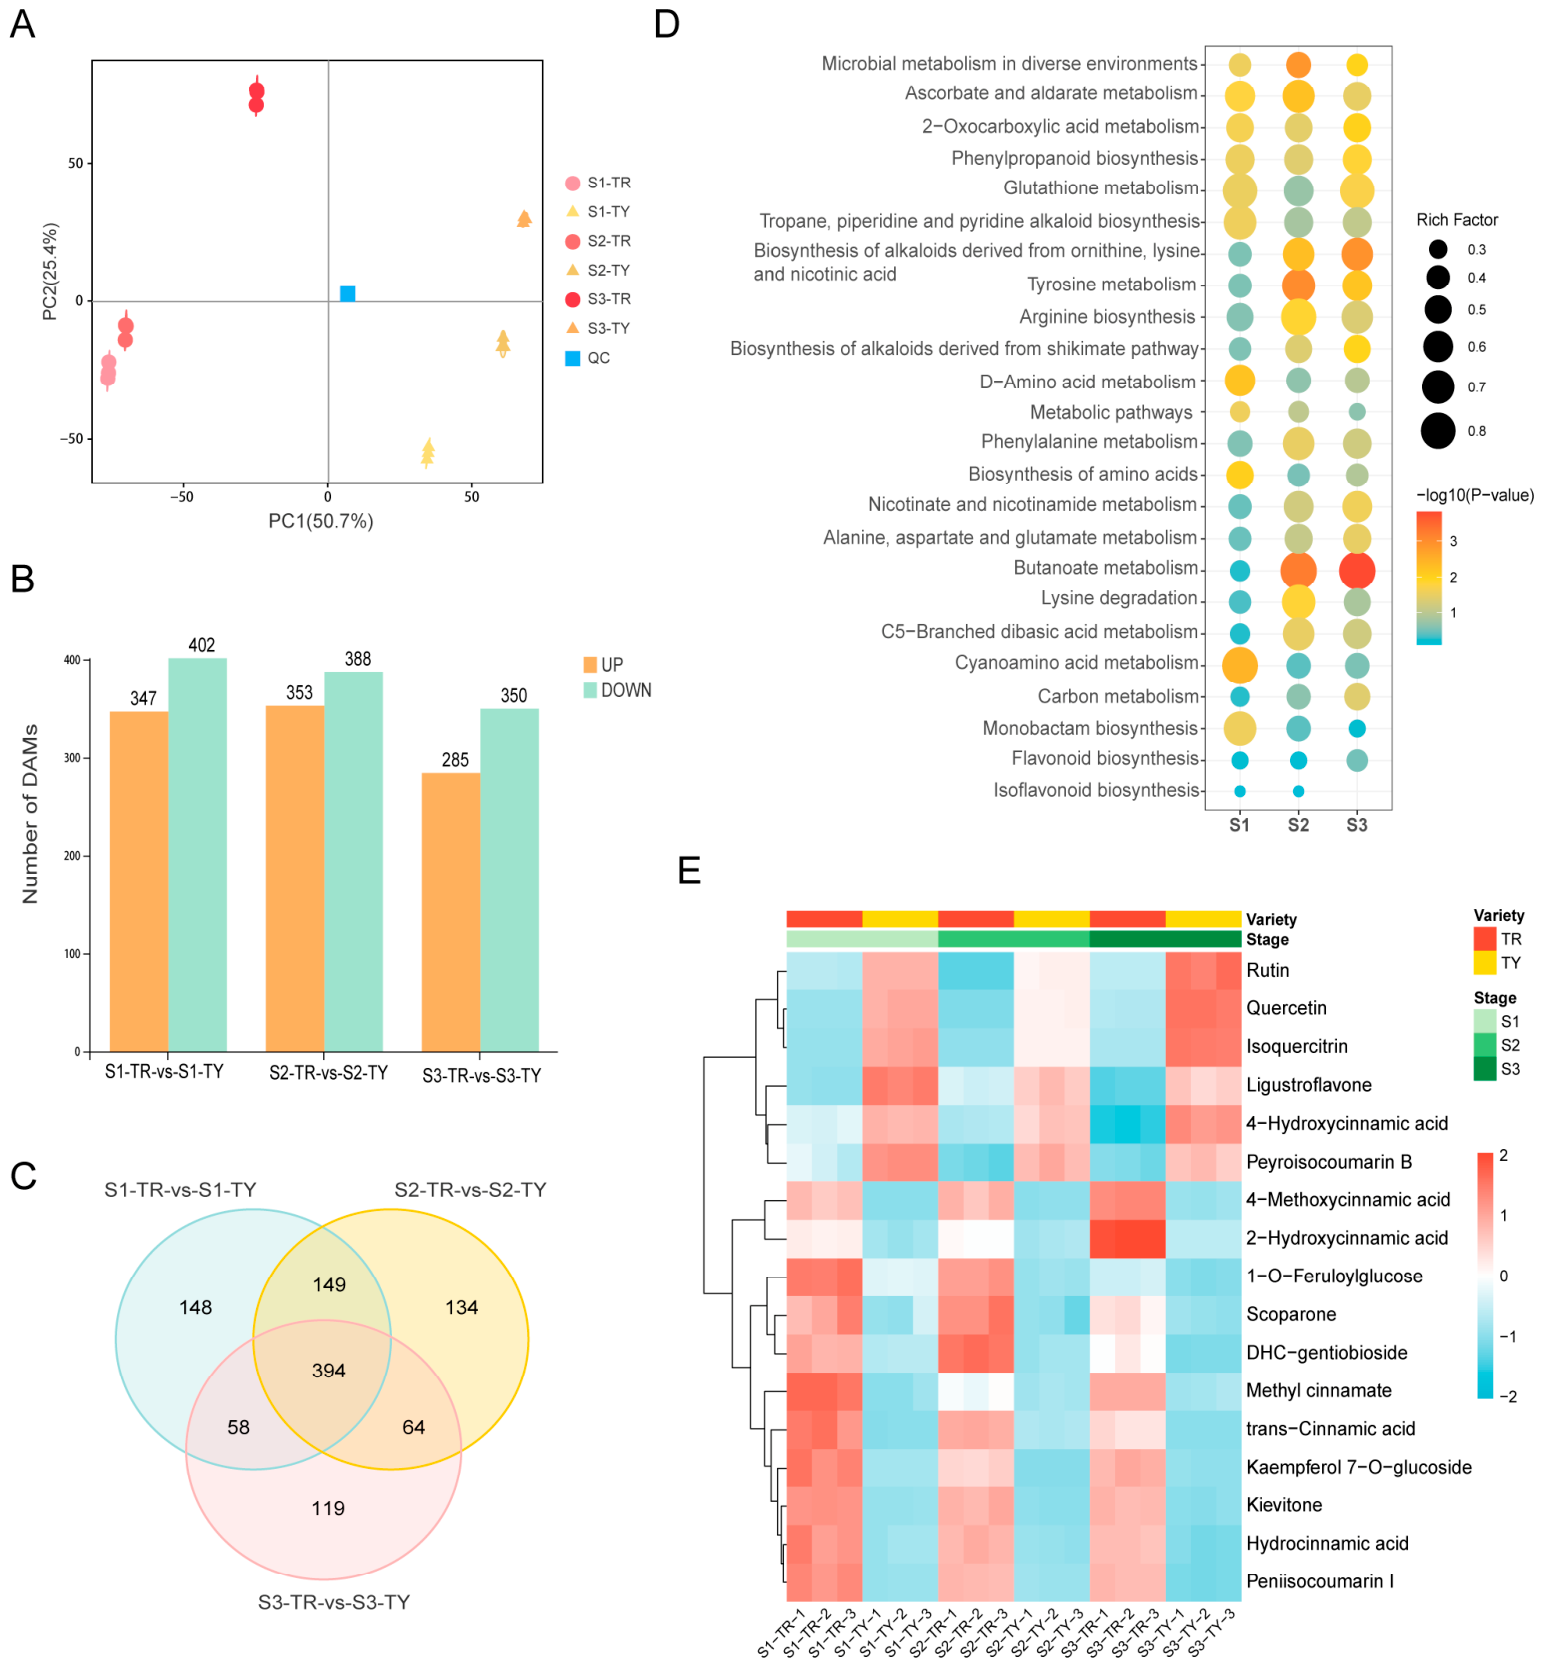
To globally assess the extensive metabolic changes underlying the fruit color divergence, an untargeted metabolomics analysis was performed on TR and TY fruits at the S1–S3 stages. The PCA score plot (Figure 3A) revealed a clear separation not only among the different developmental stages but also between the two genotypes within each specific stage. The quality control (QC) samples clustered tightly in the center, demonstrating the high stability and reproducibility of the LC-MS/MS analytical system. To maximize the discrimination of metabolic profiles between TR and TY, OPLS-DA models were constructed for each developmental stage. Validation via 200-permutation tests demonstrated that all permuted Q2 values were significantly lower than those of the original models (R2 intercepts: 0.85–0.92; Q2 intercepts: 0.06–0.27). This confirms the high reliability of the models and the absence of overfitting, thereby ensuring the accuracy of the subsequent metabolite screening (Figure S1). Furthermore, the comprehensively annotated metabolites were functionally categorized into diverse classes, with a prominent proportion of secondary metabolites, including flavonoids and phenolic acids (6.2%) (Figure S2).
Based on the stringent criteria of VIP ≥ 1 and p < 0.05, DAMs between TR and TY were identified. Across the three developmental stages, the total number of down-regulated DAMs in the TY mutant was consistently higher than that of the up-regulated DAMs (347 up/402 down at S1; 353 up/388 down at S2; 285 up/350 down at S3) (Figure 3B). A Venn diagram analysis further delineated 394 core DAMs that were strictly shared across all three developmental stages (Figure 3C). Kyoto Encyclopedia of Genes and Genomes (KEGG) pathway enrichment analysis of these shared DAMs (Figure 3D) revealed that, in addition to fluctuations in primary metabolism, secondary metabolic pathways closely associated with fruit color divergence were significantly enriched across all stages. These pathways predominantly included “Phenylpropanoid biosynthesis”, “Flavonoid biosynthesis”, and “Flavone and flavonol biosynthesis”. This is highly consistent with the differences in upstream key enzyme activities observed in the aforementioned physiological experiments.
To pinpoint the specific metabolic flux direction, a hierarchical clustering heatmap was constructed focusing on the core pigment-related and phenylpropanoid DAMs extracted from the 394 shared intersections (Figure 3E). Consistent with the severe enzymatic suppression at the DFR node observed in physiological assays, the downstream metabolic flux in the TY mutant underwent a substantial redirection. Specifically, certain flavonols—such as rutin, quercetin, and isoquercitrin—exhibited significantly higher relative abundances in TY fruits compared to the TR control across all developmental stages. Furthermore, upstream phenylpropanoid precursors exhibited distinct metabolic signatures. Notably, the foundational amino acid precursor L-phenylalanine, along with 4-hydroxycinnamic acid, showed a clear accumulation trend in the TY mutant. In contrast, trans-cinnamic acid levels were strictly lower in TY than in the TR control. This specific depletion of trans-cinnamic acid, coupled with the massive accumulation of its direct precursor L-phenylalanine, perfectly corroborates the lower PAL enzyme activity observed in TY fruits during the physiological assays. These untargeted metabolomic profiles provide objective evidence that the blockage of the terminal anthocyanin pathway in TY triggers a targeted accumulation of substrates, promoting a substantial redirection of metabolic flux toward the upstream flavonol branches.

3.5. Transcriptomic Sequencing, De Novo Assembly, and Functional Annotation

To investigate the molecular mechanisms underlying the fruit color variation in Ilex rotunda, we performed transcriptomic sequencing and de novo assembly of fruits at different developmental stages. The assembly generated a total of 65,716 unigenes with an N50 of 2000 bp, encompassing a high proportion of sequences longer than 1000 bp (Figure S3A and Table S5). The BUSCO completeness assessment, combined with functional annotations across four major public databases (Nr, KEGG, SwissProt, and KOG) (Figure S3B,C and Table S6), confirmed the high assembly quality and comprehensive annotation coverage of the transcriptomic data. This establishes a reliable molecular foundation for the subsequent mining of key differentially expressed genes.

3.6. Global Expression Profiling and Pathway-Level Transcriptional Shift Analysis

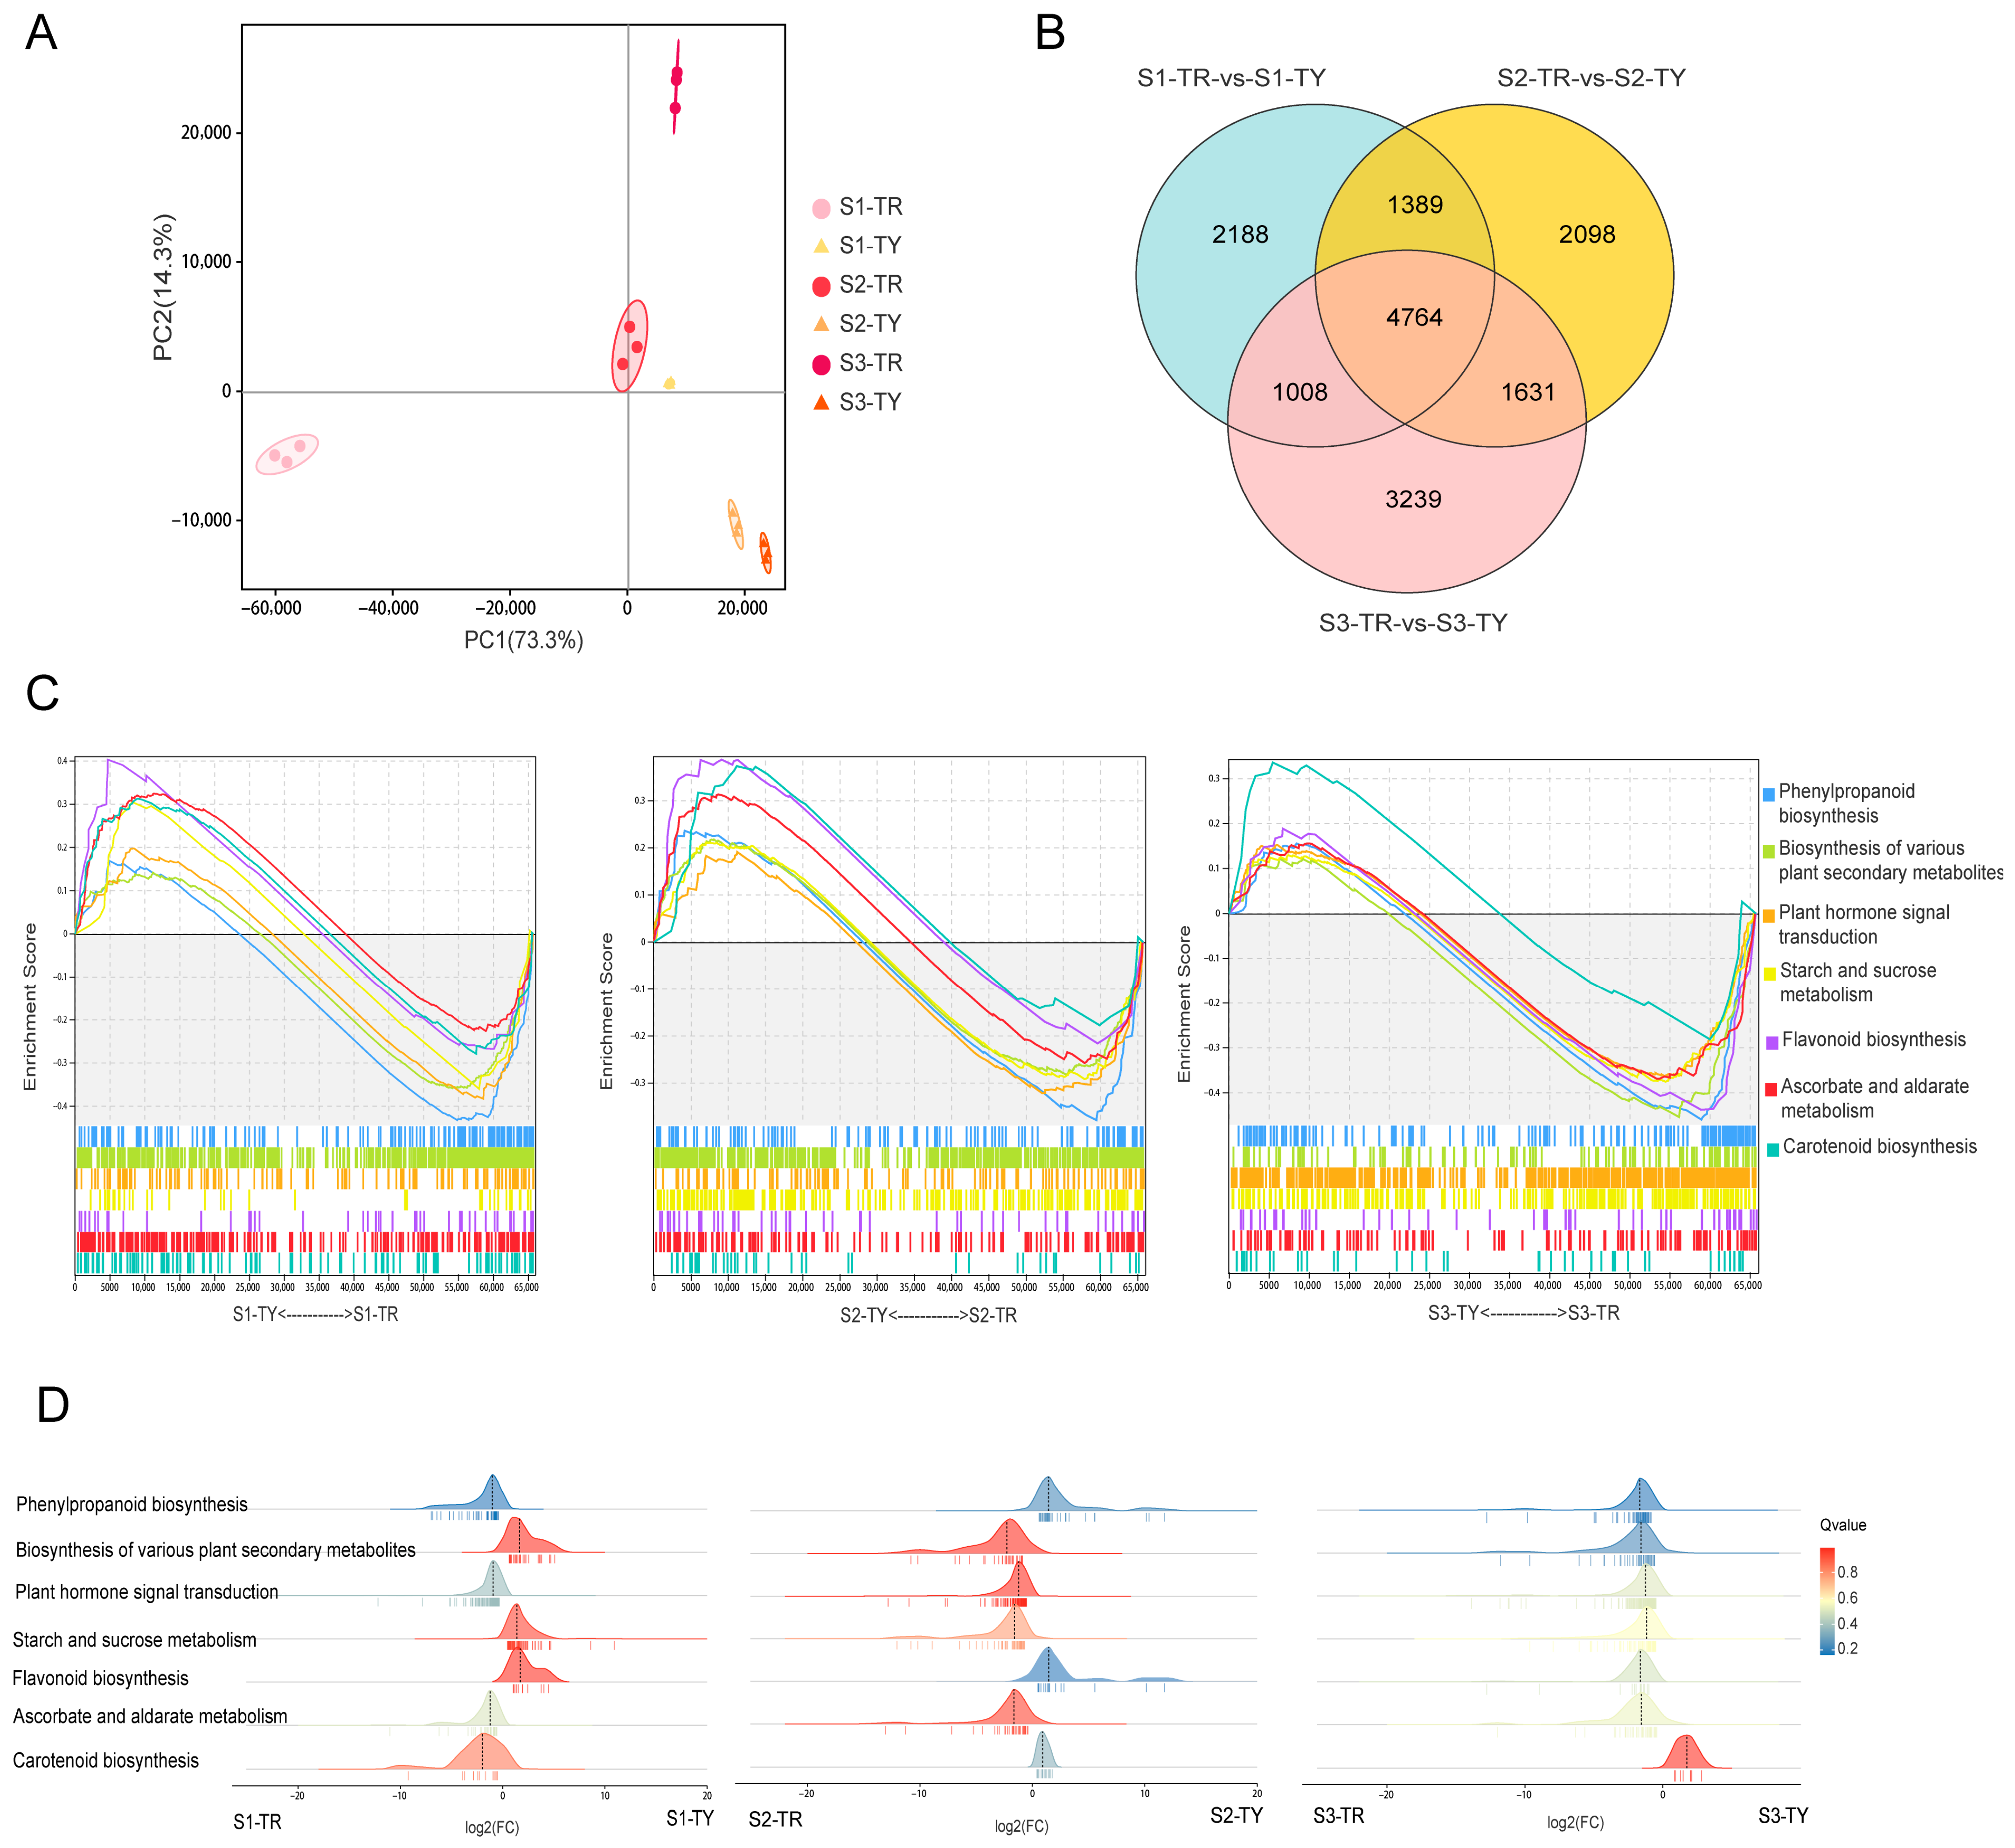
Based on the high-quality transcriptomic data, PCA results (Figure 4A) revealed clear transcriptional divergence between TR and TY fruits across S1 to S3 stages. Conventional enrichment analysis of DEGs demonstrated that these transcripts were significantly enriched in secondary metabolic pathways. Furthermore, a joint KEGG pathway enrichment analysis integrating both transcriptomic and DAM data visually confirmed a highly coordinated reprogramming (Figure S4). Notably, “Phenylpropanoid biosynthesis” and “Flavonoid biosynthesis” consistently emerged as the most profoundly co-enriched pathways across S1 to S3 stages, effectively bridging the transcriptional shifts with the specific metabolic outputs.
To further evaluate global expression dynamics at the pathway level, we performed Gene Set Enrichment Analysis (GSEA). The results (Figure 4C,D) indicated a significant and persistent transcriptional polarization in the “flavonoid biosynthesis” and “phenylpropanoid biosynthesis” gene sets between TR and TY. In TR, genes within these pathways exhibited highly coordinated upregulation. Conversely, in the TY mutant, the overall expression distribution of these pathway gene sets shifted significantly downward. This systemic transcriptional repression at the pathway level, rather than the loss-of-function of a single gene, constitutes the molecular basis for the yellow phenotype of the TY mutant, strongly echoing the drastic metabolic shifts observed in our earlier metabolomic analysis.

3.7. Precise Identification of Core Candidate Genes and Transcriptional Regulatory Logic

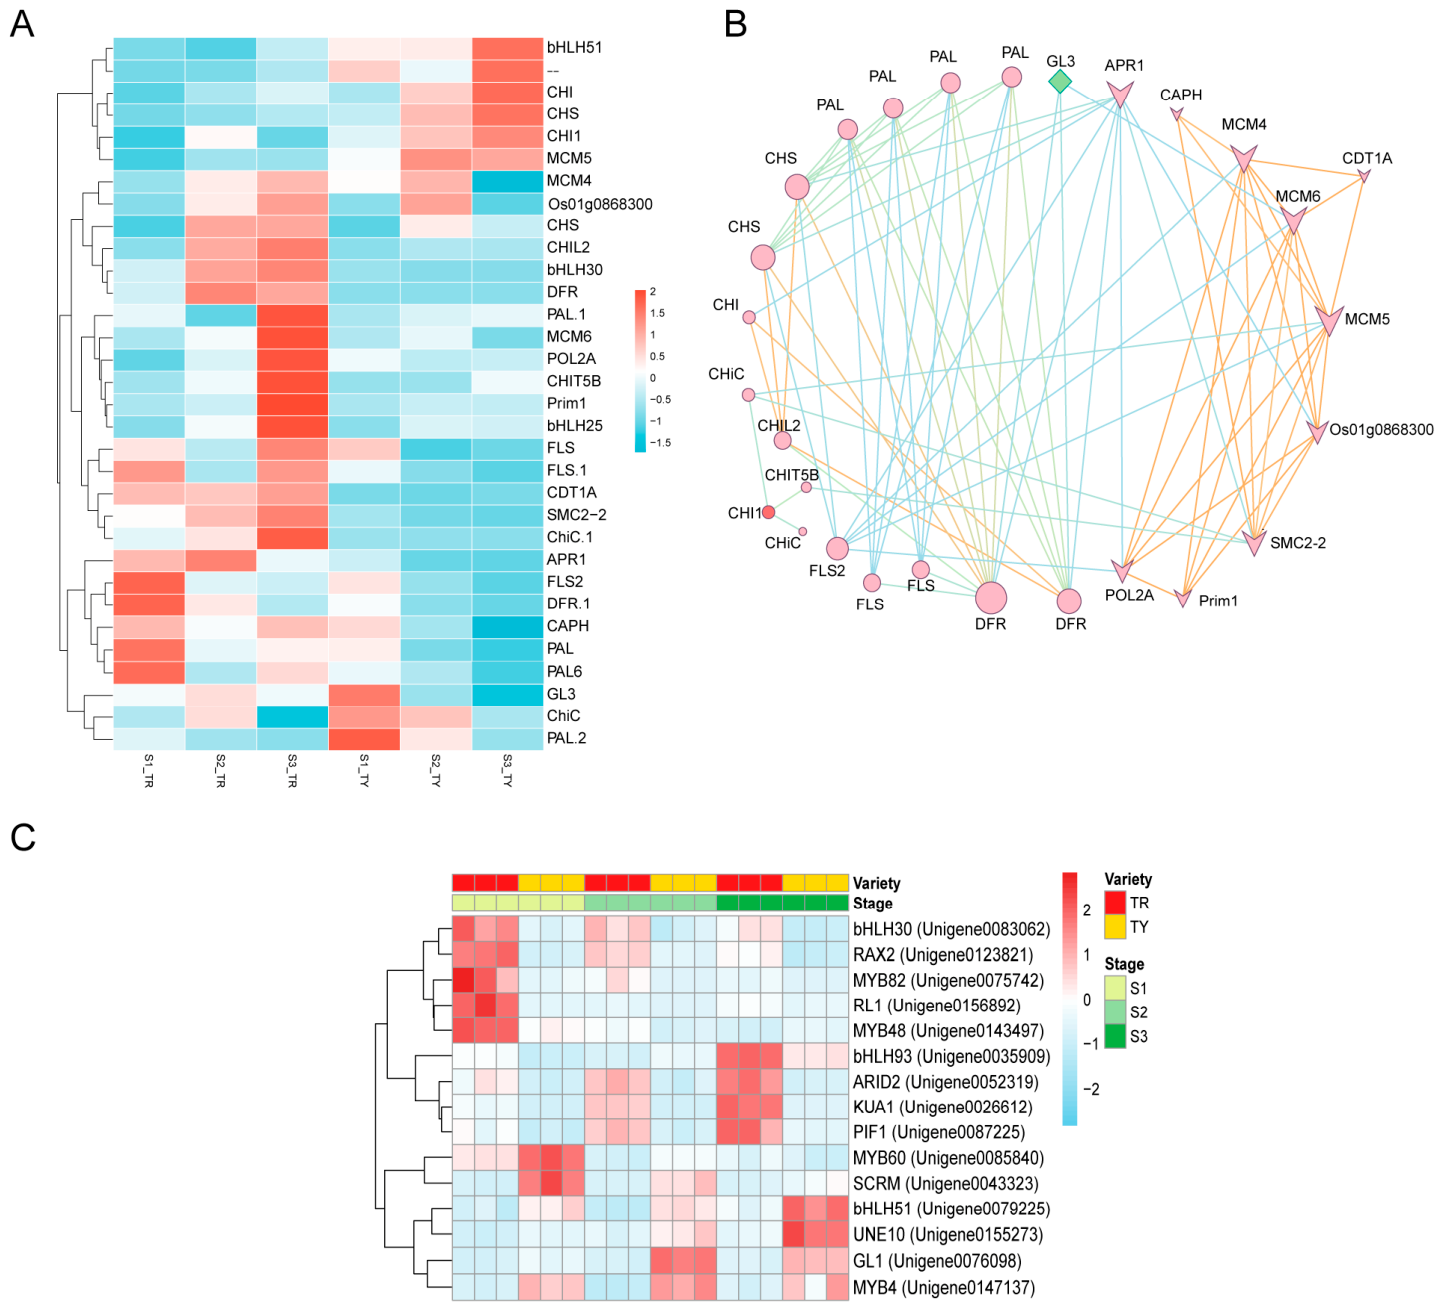
Venn diagram analysis of transcriptomic differences across the three developmental stages (S1-TR-vs-S1-TY, S2-TR-vs-S2-TY, and S3-TR-vs-S3-TY) identified 4764 core genes that were consistently differentially expressed. By deeply screening these 4764 core DEGs, we focused on 32 key structural genes directly related to flavonoid metabolism (Figure 5A). Expression profiling revealed that as TR fruits entered the color transition phase (S2–S3), the expression levels of key downstream genes in anthocyanin biosynthesis, especially DFR and members of the CHS and CHI families, increased exponentially.
However, in the TY mutant, although upstream genes such as PAL maintained a basal level of expression, the transcription of the downstream hub gene DFR was almost entirely silenced (Figure 5A,B). This precise transcriptional blockade effectively explains why the metabolic flux, once obstructed at the DFR node, was forced to redirect towards alternative branches, leading to the substantial accumulation of flavonols (such as rutin and quercetin).
To uncover the upstream regulatory drivers responsible for this massive transcriptomic shift, we systematically annotated and classified all differentially expressed transcription factors (TFs). As illustrated in Figure S5, members of the ERF, bHLH, and MYB families constituted the most abundantly represented TF classes among the DEGs. Given the universally established role of the MBW (MYB-bHLH-WD40) complex in controlling anthocyanin flux, we specifically targeted the highly enriched bHLH family. Further regulatory network analysis (Figure 5C) identified bHLH30 and bHLH51 as core candidate transcription factors regulating DFR. Their expression patterns exhibited significant antagonism: bHLH30 (a potential activator) showed extremely low expression in TY, whereas bHLH51 (a potential repressor) was highly expressed in TY. As correctly suggested, this striking antagonism in their expression patterns strongly indicates their putative role in the shutdown of anthocyanin biosynthesis. This potential dual regulatory imbalance—characterized by “loss of activation” and “gain of repression”—likely contributes to the profound transcriptional silencing of DFR, ultimately facilitating the reallocation of metabolic flux in TY fruits.

3.8. Multi-Omics Integration and qRT-PCR Validation

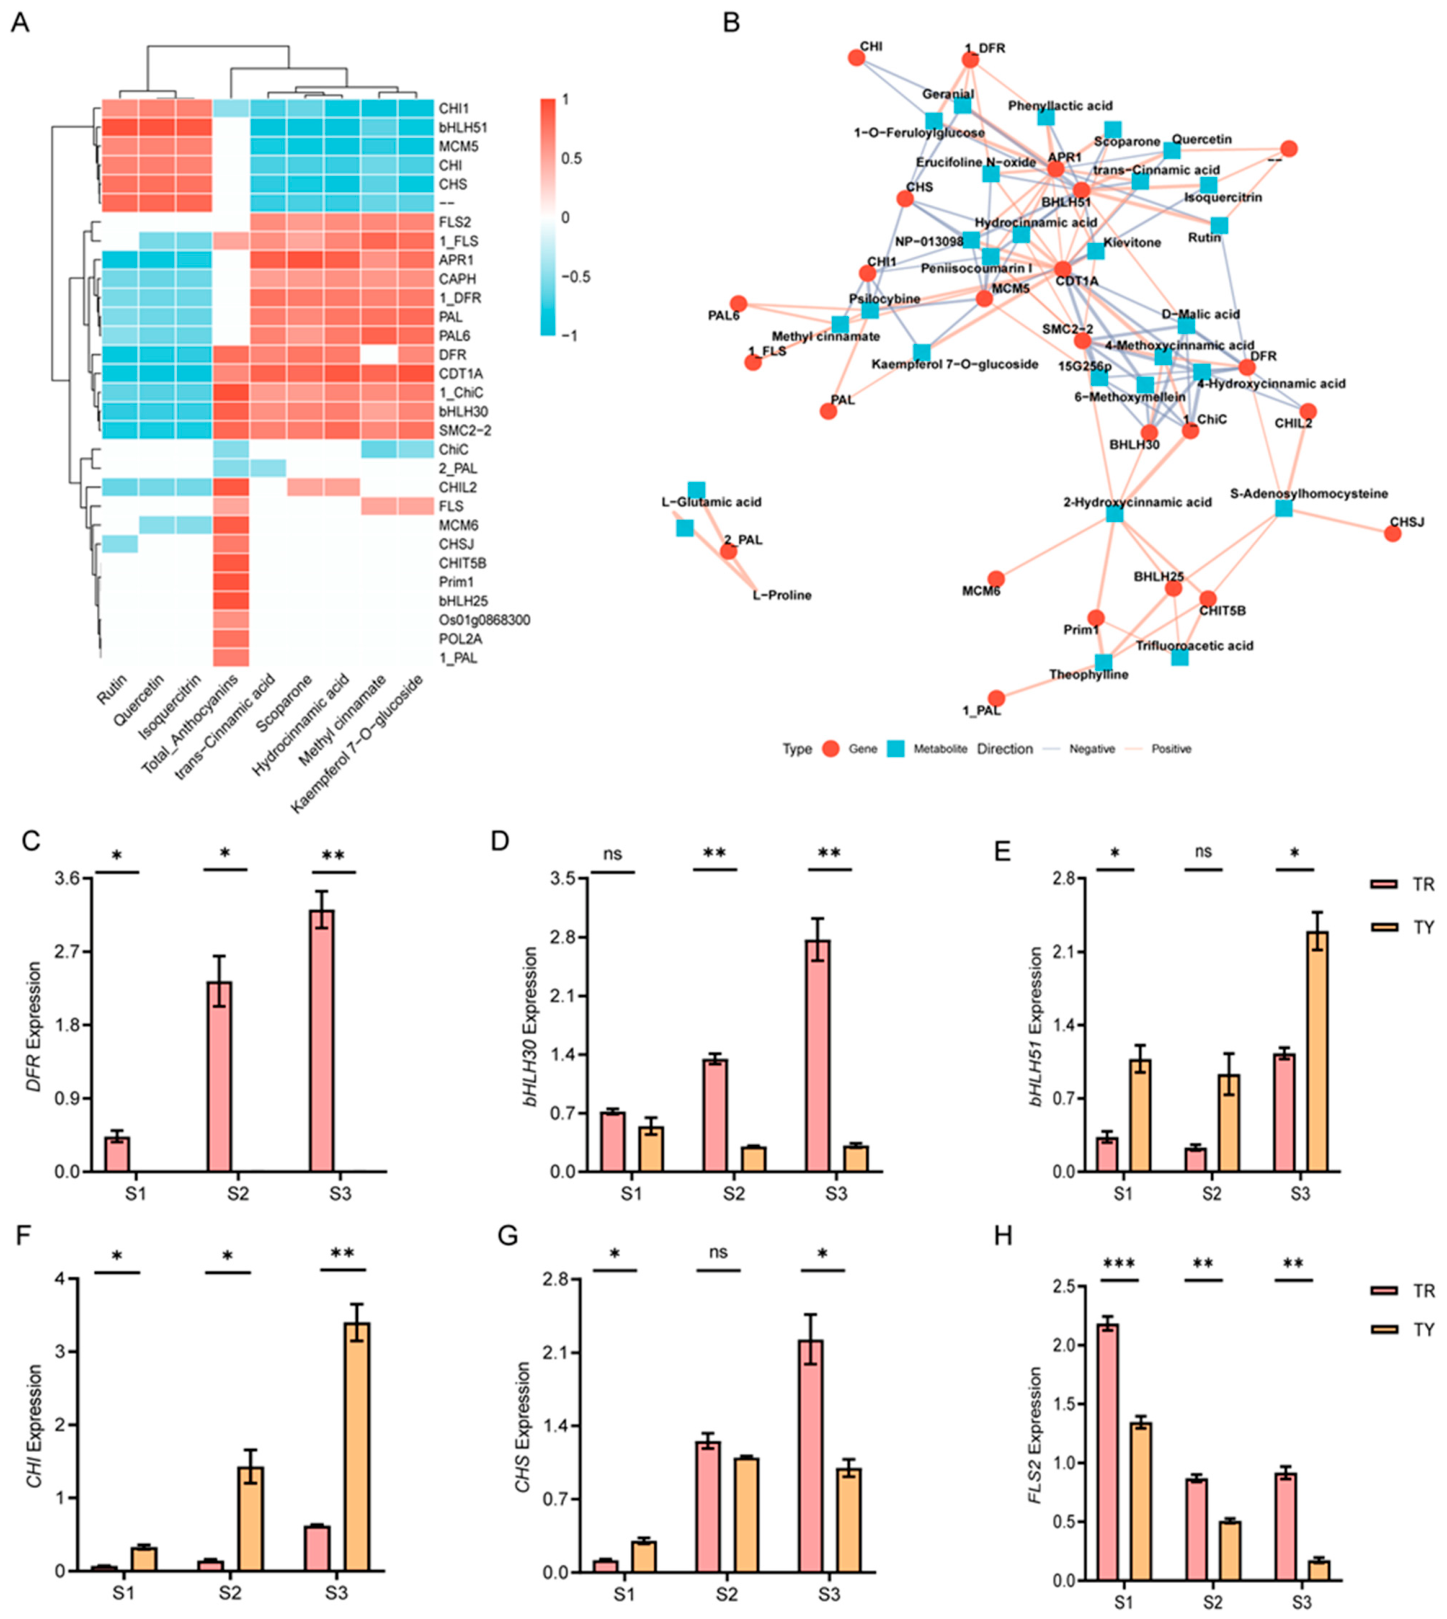
Building upon the identification of the metabolic redirection and the antagonistic transcriptional regulatory module, an integrative multi-omics correlation analysis was performed to systematically define the hierarchical flow from transcriptional reprogramming to metabolic outputs. The Pearson correlation heatmap (Figure 6A) clearly delineated two opposing regulatory clades. The putative activator bHLH30 strictly co-clustered with the critical downstream structural gene DFR and the accumulation of total anthocyanins. Conversely, the putative repressor bHLH51 exhibited an exceptionally robust positive correlation with the hyper-accumulated flavonols in the TY mutant—namely rutin, quercetin, and isoquercitrin—as well as upstream genes such as CHS and CHI. This antagonistic interplay was further visualized in a comprehensive gene-metabolite regulatory network (Figure 6B), intuitively mapping the topology of how the delicate balance between bHLH30 and bHLH51 dictates the downstream metabolic bifurcation.
To cross-validate the reliability of the RNA-seq data and to precisely trace the temporal expression dynamics of these hub genes, qRT-PCR assays were conducted across the S1–S3 stages (Figure 6C–H). The qRT-PCR profiles flawlessly mirrored the transcriptomic and earlier physiological data. Specifically, the transcript levels of bHLH30 and its primary target “gatekeeper” gene DFR surged exponentially in TR fruits during the S3 stage, tightly aligning with the peak DFR enzyme activity and the anthocyanin burst. In sharp contrast, their expression was profoundly silenced in the TY mutant. Meanwhile, the repressor bHLH51 maintained an overwhelmingly high transcript abundance in TY from the early S1 stage, providing robust molecular evidence for its role in the early and sustained suppression of the anthocyanin pathway.
Crucially, the expression of FLS2, the direct structural gene responsible for flavonol synthesis, did not exhibit a massive transcriptional up-regulation in the TY mutant. This critical piece of molecular evidence consolidates our previous physiological and metabolomic deductions: the massive accumulation of flavonol derivatives in TY is not driven by an active transcriptional enhancement of the flavonol branch. Instead, the profound, bHLH-mediated silencing of DFR completely abolishes the downstream anthocyanin sink. This profound bottleneck forces the abundant shared intermediate substrates (continually supplied by the highly active PAL and CHI) to be passively redirected. These overflowing intermediates are then exclusively consumed by basal FLS enzymes, leading to the substantial accumulation of rutin and quercetin. Ultimately, this multi-omics integration rigorously confirms a “passive substrate overflow” mechanism orchestrated by a dual bHLH regulatory switch.

4. Discussion

4.1. Systemic Metabolic Reprogramming of the Flavonoid Pathway

The transition of fruit color from red to yellow in I. rotunda is not merely a localized pigment deficiency but reflects a systemic reprogramming of the flavonoid biosynthetic network. The phenylpropanoid and flavonoid pathways are highly plastic secondary metabolic networks that allow plants to adapt to developmental and environmental cues [3]. Consistent with recent multi-omics studies in other horticultural crops, our data revealed that while the upstream phenylpropanoid flux remains active in both genotypes, the TY cultivar undergoes a profound metabolic redirection at the late stages of fruit development. This global restructuring mirrors recent findings in related woody species, such as poplar roots [27] and Ilex verticillata fruits [14], where color polymorphism is driven by the global coordination of structural genes and regulatory factors. The significant polarization of the “Flavonoid biosynthesis” and “Phenylpropanoid biosynthesis” pathways, as identified through GSEA, further confirms that the yellow phenotype is the result of a genome-wide transcriptional shift rather than an isolated enzymatic failure.

4.2. DFR as a Critical “Gatekeeper” and the Passive Substrate Overflow

A central finding of this study is that the developmental trajectory of DFR serves as the primary biochemical bottleneck in the TY cultivar. In the flavonoid pathway of woody fruits, DFR acts as a critical “gatekeeper” enzyme that commits shared dihydroflavonols into the terminal anthocyanin branch. This fundamental role is highly conserved across various plant species, where DFR has been widely characterized as a critical metabolic switch directing flux toward anthocyanin biosynthesis. For instance, the expression levels and catalytic activities of DFR directly govern the massive accumulation of anthocyanins and subsequent color transitions in diverse horticultural crops, including strawberry [28], blueberry [29], and Zanthoxylum bungeanum [30]. By integrating transcriptomic and physiological profiles, our data reveal that the DFR gene undergoes profound transcriptional silencing in TY fruits during the color transition stages (Figure 5A). Crucially, rather than a complete suppression of enzymatic function, this transcriptional blockade prevents the essential developmental surge in DFR enzyme activity required during the S3 to S4 stages. Consequently, DFR activity in the TY mutant remains restricted to a low basal level (Figure 2C), which is drastically insufficient to handle the continuous influx of precursors supplied by the highly active upstream genes (e.g., PAL and CHI).
In the context of metabolic branch competition, as commonly observed in barley and sand rice [8,31], this severe bottleneck forces the unconsumed precursors to undergo a “passive substrate overflow” toward the parallel flavonol branch. As visualized in our multi-omics correlation network (Figure 6), this redirection accounts for the massive hyper-accumulation of specific flavonols, including rutin, quercetin, and isoquercitrin, in the TY mutant. Notably, the lack of significant up-regulation of FLS2 in TY suggests that this metabolic shift is primarily driven by the blockage of the competing anthocyanin sink [32]. The basal activity of FLS enzymes appears sufficient to consume the diverted substrates, highlighting a highly efficient flux-balancing mechanism within plant secondary metabolism.

4.3. Putative Dual bHLH Regulatory Module Associated with DFR Suppression

The transcriptional regulation of the flavonoid pathway relies on the coordinated action of the MBW (MYB-bHLH-WD40) complex. Given the extensive evolutionary amplification and functional divergence of the bHLH family, these transcription factors can act as either synergistic activators or competitive repressors. In this study, our multi-omics network analysis highlighted a putative dual regulatory module consisting of two antagonistic bHLH transcription factors, bHLH30 and bHLH51, whose expression patterns were highly correlated with the transcriptional silencing of DFR.
The profound down-regulation of the putative activator bHLH30 in TY fruits suggests a potential “loss-of-activation” mechanism. Concurrently, the explosive up-regulation of bHLH51 indicates its possible role as a negative regulator. However, since direct functional validation was not performed in this study, it remains to be determined whether bHLH30 and bHLH51 act directly on the DFR promoter. Extensive evidence from other species, including strawberry, has demonstrated that bHLH transcription factors typically cannot activate late structural genes (such as DFR) alone; instead, they must physically interact with specific MYB partners to form a functional MBW complex [33,34]. Based on established paradigms, we hypothesize that the up-regulated repressor bHLH51 may competitively interact with endogenous MYB partners, thereby disrupting the formation or stability of the active MBW complex. Such competitive interference mechanisms have been widely reported to attenuate the transcriptional activity of MBW complexes, ultimately silencing downstream structural genes and halting anthocyanin biosynthesis [35,36].
Interestingly, while anthocyanin synthesis is typically highly sensitive to environmental signals such as light and temperature [37,38], the constitutive high expression of the repressor bHLH51 may structurally “desensitize” the pathway in the TY mutant, potentially locking it in an irreversible yellow state. This proposed “dual-switch” model highlights the complexity of color mutation in woody perennials, where the simultaneous loss of positive regulators and the gain of negative regulators converge to redirect specific metabolic fluxes.

4.4. A Proposed “Dual-Module” and “Passive Overflow” Model for Yellow Fruit Coloration

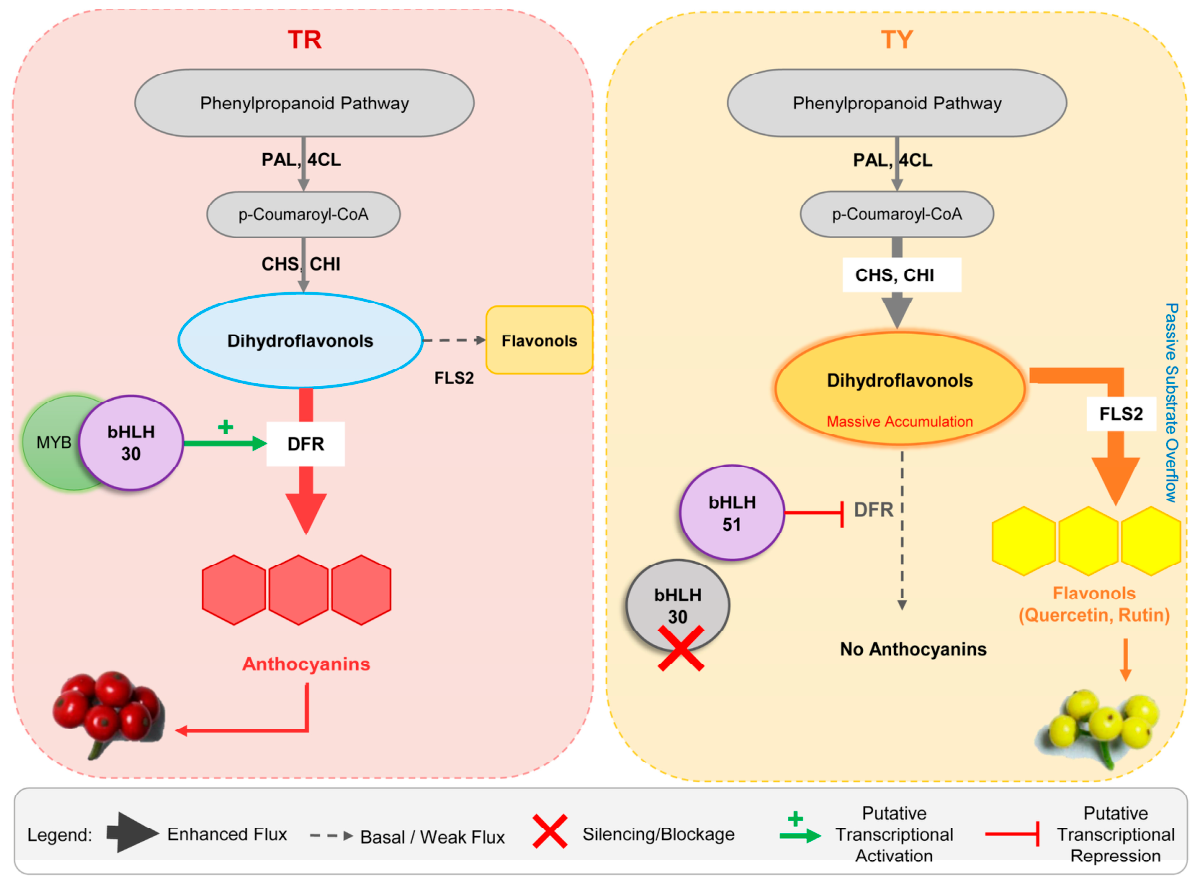
Combining our multifaceted physiological, metabolomic, and transcriptomic evidence, we propose a putative mechanistic model to elucidate the yellow fruit phenotype in the TY cultivar (Figure 7). We hypothesize that the profound down-regulation of bHLH30 prevents the functional activating MBW complex from efficiently assembling. Simultaneously, the explosive up-regulation of the putative repressor bHLH51 likely acts as a dominant “active-repression” module. While direct molecular functional validations remain to be performed, our integrative multi-omics data, together with established paradigms in other plant species, strongly suggest that this dual module potentially interferes with the MBW complex and leads to the severe transcriptional silencing of DFR.
Rather than an active transcriptional up-regulation of the entire flavonol pathway, this severe enzymatic blockade at the DFR node creates a competitive metabolic bottleneck. Consequently, the shared upstream precursors (dihydroflavonols), which are continually supplied by highly active upstream enzymes (e.g., PAL, 4CL, CHS, and CHI), are forced to be passively redirected toward the parallel flavonol branch. This proposed “dual-module” and “passive overflow” mechanism effectively accounts for both the specific failure of anthocyanin production and the simultaneous hyper-accumulation of flavonols, providing a comprehensive, though putative, molecular framework for understanding fruit color divergence in this species.

5. Conclusions

In conclusion, the red-to-yellow fruit color mutation in the ‘Peace Time’ (TY) cultivar is fundamentally driven by a systemic redirection of the flavonoid metabolic flux. Through an integrative multi-omics approach, we pinpointed the profound transcriptional silencing of the “gatekeeper” gene DFR as the critical biochemical bottleneck that severely restricts terminal anthocyanin biosynthesis. This enzymatic blockade triggers a “passive substrate overflow” toward the parallel flavonol branch, resulting in the massive hyper-accumulation of potent antioxidants, primarily rutin and isoquercitrin. At the molecular level, this metabolic reprogramming is putatively associated with a proposed dual regulatory module: the functional loss of the putative transcriptional activator bHLH30 coupled with the robust up-regulation of the putative repressor bHLH51. It should be noted that while this cohesive “dual-module” and “passive overflow” framework provides a compelling explanation for the color transition, it currently serves as a proposed model derived from multi-omics correlations. Future in vivo functional characterization and protein-DNA interaction assays are required to experimentally confirm the precise regulatory roles of these candidate TFs. Nevertheless, this study highlights a remarkable metabolic plasticity that ultimately reshapes the mutant’s phytochemical profile, providing vital candidate genes and a solid theoretical foundation for future ornamental breeding in Ilex.

Supplementary Materials

The following supporting information can be downloaded at: https://www.mdpi.com/article/10.3390/horticulturae12050557/s1, Figure S1: OPLS-DA score plots and permutation tests of Ilex rotunda TR and TY fruits at different developmental stages; Figure S2: Chemical classification and proportions of all identified metabolites in I. rotunda fruits; Figure S3: Quality assessment of the de novo transcriptome assembly and functional annotation of I. rotunda fruits; Figure S4: KEGG pathway co-enrichment analysis of the transcriptome and metabolome across different developmental stages; Figure S5: Distribution of the identified transcription factors (TFs) classified by gene family in the I. rotunda fruit transcriptome; Table S1: Primer sequences used for qRT-PCR validation; Table S2: Fruit color evaluation of two holly cultivars based on the RHS Color Chart; Table S3: Physiological index of holly fruits in different developmental stages; Table S4: Enzyme activities of anthocyanin biosynthesis pathway in holly fruits; Table S5: Summary of the de novo transcriptome assembly; Table S6: BUSCO assessment of the transcriptome assembly; Table S7: Functional annotation statistics of the assembled unigenes in different databases.

Author Contributions

Conceptualization, M.H.; methodology, X.Z. (Xiaonan Zhao) and M.H.; software, X.Z. (Xiaonan Zhao); validation, X.Z. (Xueqing Zhao) and M.H.; formal analysis, X.Z. (Xiaonan Zhao); investigation, X.Z. (Xiaonan Zhao); resources, M.H.; data curation, X.Z. (Xiaonan Zhao); writing—original draft preparation, X.Z. (Xiaonan Zhao); writing—review and editing, M.H. and X.Z. (Xueqing Zhao); visualization, X.Z. (Xiaonan Zhao); supervision, M.H.; project administration, M.H.; funding acquisition, M.H. All authors have read and agreed to the published version of the manuscript.

Funding

This research was funded by the Nanjing Science and Technology Plan Project, grant number 202306003, and the Priority Academic Program Development of Jiangsu High Education Institutions (PAPD).

Data Availability Statement

The raw RNA-seq data presented in this study have been deposited in the Genome Sequence Archive (GSA) under the accession number CRA041246. The metabolomic datasets generated during this study are available from the corresponding author upon reasonable request.

Conflicts of Interest

The authors declare no conflicts of interest. The funders had no role in the design of the study; in the collection, analyses, or interpretation of data; in the writing of the manuscript; or in the decision to publish the results.

References

  1. He, P.; Lu, H.; Zhao, C.; Zhang, M.; Zhou, P.; Wang, Y.; Liu, J.; Shen, Q.; Kant, S.; Sun, S.; et al. Trichoderma bio-organic fertilizer enhances ornamental value of Ilex verticillata. Sci. Hortic. 2025, 350, 114348. [Google Scholar] [CrossRef] [Scilit]
  2. Zou, Y.; Li, Q.; Zhang, D.; Liang, Y.; Hao, M.; Yang, Y. Peace Time: A New Yellow-fruit Holly Cultivar. HortScience 2022, 57, 328–329. [Google Scholar] [CrossRef] [Scilit]
  3. Li, C.; Jiang, Y.; Xu, C.; Mei, X. Editorial: Contribution of phenylpropanoid metabolism to plant development and stress responses. Front. Plant Sci. 2024, 15, 1456913. [Google Scholar] [CrossRef] [Scilit] [PubMed]
  4. Jiang, Z.H.; He, F.; Zhang, Z.D. Large-scale transcriptome analysis reveals Arabidopsis metabolic pathways are frequently influenced by different pathogens. Plant Mol. Biol. 2017, 94, 453–467. [Google Scholar] [CrossRef] [Scilit]
  5. Chen, S.; Chen, Z.; Zhuang, Q.; Chen, H. Multi-omics joint analysis reveals the mechanism of flower color and fragrance variation in Lilium cernuum. Front. Plant Sci. 2025, 16, 1489918. [Google Scholar] [CrossRef] [Scilit]
  6. Chen, C.Q.; Zhang, Y.; Tang, W.J.; Chen, H.X.; Gong, R.G. Insights into the Coloring Mechanism of Dark-Red and Yellow Fruits in Sweet Cherry through Transcriptome and Metabolome Analysis. Agronomy 2023, 13, 2397. [Google Scholar] [CrossRef] [Scilit]
  7. Zhao, J.; Qi, X.; Li, J.; Cao, Z.; Liu, X.; Yu, Q.; Xu, Y.; Qin, G. Metabolic Profiles of Pomegranate Juices during Fruit Development and the Redirection of Flavonoid Metabolism. Horticulturae 2023, 9, 881. [Google Scholar] [CrossRef] [Scilit]
  8. Fang, T.; Zhou, S.; Qian, C.; Yan, X.; Yin, X.; Fan, X.; Zhao, P.; Liao, Y.; Shi, L.; Chang, Y.; et al. Integrated metabolomics and transcriptomics insights on flavonoid biosynthesis of a medicinal functional forage, Agriophyllum squarrosum (L.), based on a common garden trial covering six ecotypes. Front. Plant Sci. 2022, 13, 985572. [Google Scholar] [CrossRef] [Scilit]
  9. Zhang, H.L.; Hu, A.S.; Wu, H.W.; Zhu, J.F.; Zhang, J.B.; Cheng, T.L.; Shabala, S.; Zhang, H.X.; Yang, X.Y. Integrated metabolome and transcriptome analysis unveils novel pathway involved in the fruit coloration of Nitraria tangutorum Bobr. BMC Plant Biol. 2023, 23, 65. [Google Scholar] [CrossRef] [Scilit]
  10. Sun, T.; Wang, M.; Xiong, Q.; Xu, J.; Chen, X.; Chen, Z.; Chen, Y.; Zhang, W. Comprehensive analysis of the morphological, physiological, and transcriptional reveals the nutritional properties and pigmentation mechanism of Malus crabapple. J. Food Compos. Anal. 2025, 145, 107858. [Google Scholar] [CrossRef] [Scilit]
  11. Sun, C.; Deng, L.; Du, M.; Zhao, J.; Chen, Q.; Huang, T.; Jiang, H.; Li, C.-B.; Li, C. A Transcriptional Network Promotes Anthocyanin Biosynthesis in Tomato Flesh. Mol. Plant 2020, 13, 42–58. [Google Scholar] [CrossRef] [Scilit]
  12. Leng, L.; Zhang, X.; Liu, W.; Wu, Z. Genome-Wide Identification of the MYB and bHLH Families in Carnations and Expression Analysis at Different Floral Development Stages. Int. J. Mol. Sci. 2023, 24, 9499. [Google Scholar] [CrossRef] [Scilit]
  13. Tao, H.; Gao, F.; Linying, L.; He, Y.; Zhang, X.; Wang, M.; Wei, J.; Zhao, Y.; Zhang, C.; Wang, Q.; et al. WRKY33 negatively regulates anthocyanin biosynthesis and cooperates with PHR1 to mediate acclimation to phosphate starvation. Plant Commun. 2024, 5, 100821. [Google Scholar] [CrossRef] [Scilit]
  14. Fei, L.; Qi, J.J.; Peng, Z.; Min, Z. Insights into the distinct anthocyanin metabolism and transcriptomes in the mature pericarp of Ilex verticillata ‘Winter Red’ and ‘Winter Gold’. Plant Biotechnol. Rep. 2025, 19, 289–299. [Google Scholar] [CrossRef] [Scilit]
  15. Zou, Y.; Huang, Y.; Zhang, D.; Chen, H.; Liang, Y.; Hao, M.; Yin, Y. Molecular Mechanisms of Chlorophyll Deficiency in Ilex × attenuata ‘Sunny Foster’ Mutant. Plants 2024, 13, 1284. [Google Scholar] [CrossRef] [Scilit] [PubMed]
  16. Ma, Q.; Wang, S.D.; Tan, H.T.; Sun, Z.K.; Li, C.W.; Zhang, G.Y. Tissue-specific transcriptome analyses unveils candidate genes for flavonoid biosynthesis, regulation and transport in the medicinal plant Ilex asprella. Sci. Rep. 2024, 14, 81319. [Google Scholar] [CrossRef] [Scilit] [PubMed]
  17. Gandin, Y.E.M.; Quast, L.B.; Pinto, V.Z.; Valduga, A.T.; Gonçalves, I.L.; Quast, E. Drying and Bioactive Compounds Extraction of Ripe and Unripe Yerba-Mate Fruits. Plant Foods Hum. Nutr. 2025, 80, 100. [Google Scholar] [CrossRef] [Scilit] [PubMed]
  18. Zhang, W.; Wu, J.; He, J.; Liu, C.; Yi, W.; Xie, J.; Wu, Y.; Xie, T.; Ma, J.; Zhong, Z.; et al. AcMYB266, a key regulator of the red coloration in pineapple peel: A case of subfunctionalization in tandem duplicated genes. Hortic. Res. 2024, 11, uhae116. [Google Scholar] [CrossRef] [Scilit]
  19. An, T.; Wu, Y.; Xu, B.; Zhang, S.; Deng, X.; Zhang, Y.; Siddique, K.H.M.; Chen, Y. Nitrogen supply improved plant growth and Cd translocation in maize at the silking and physiological maturity under moderate Cd stress. Ecotoxicol. Environ. Saf. 2022, 230, 113137. [Google Scholar] [CrossRef]
  20. Wang, Y.; Zhang, M.; Bao, L.; Long, J.; Cui, X.; Zheng, Z.; Zhao, X.; Huang, Y.; Jiao, F.; Su, C.; et al. Metabolomic and transcriptomic analysis of flavonoids biosynthesis mechanisms in mulberry fruit (Hongguo 2) under exogenous hormone treatments. Plant Physiol. Biochem. 2024, 212, 108773. [Google Scholar] [CrossRef] [Scilit]
  21. Lister, C.E.; Lancaster, J.E.; Walker, J.R.L. Developmental Changes in Enzymes of Flavonoid Biosynthesis in the Skins of Red and Green Apple Cultivars. J. Sci. Food Agric. 1996, 71, 313–320. [Google Scholar] [CrossRef] [Scilit]
  22. Liu, Y.; Che, F.; Wang, L.; Meng, R.; Zhang, X.; Zhao, Z. Fruit Coloration and Anthocyanin Biosynthesis after Bag Removal in Non-Red and Red Apples (Malus × domestica Borkh.). Molecules 2013, 18, 1549–1563. [Google Scholar] [CrossRef] [Scilit] [PubMed]
  23. Xie, D.-Y. Molecular and biochemical analysis of two cDNA clones encoding dihydroflavonol-4-reductase from Medicago truncatula. Plant Physiol. 2004, 134, 979–994. [Google Scholar] [CrossRef] [Scilit]
  24. Cao, S.; Hu, Z.; Zheng, Y.; Yang, Z.; Lu, B. Effect of BTH on antioxidant enzymes, radical-scavenging activity and decay in strawberry fruit. Food Chem. 2011, 125, 145–149. [Google Scholar] [CrossRef] [Scilit]
  25. Ban, Y.; Kondo, S.; Ubi, B.E.; Honda, C.; Bessho, H.; Moriguchi, T. UDP-sugar biosynthetic pathway: Contribution to cyanidin 3-galactoside biosynthesis in apple skin. Planta 2009, 230, 871–881. [Google Scholar] [CrossRef] [Scilit] [PubMed]
  26. Chen, X.; Liu, H.; Wang, S.; Zhang, C.; Liu, L.; Yang, M.; Zhang, J. Combined transcriptome and proteome analysis provides insights into anthocyanin accumulation in the leaves of red-leaved poplars. Plant Mol. Biol. 2021, 106, 491–503. [Google Scholar] [CrossRef] [Scilit]
  27. Li, M.; Fu, Y.C.; Li, J.X.; Shen, W.N.; Wang, L.; Li, Z.; Zhang, S.Q.; Liu, H.X.; Su, X.H.; Zhao, J.P. Why the adventitious roots of poplar are so colorful: RNAseq and metabolomic analysis reveal anthocyanin accumulation in canker pathogens-induced adventitious roots in poplar. Planta 2024, 261, 19. [Google Scholar] [CrossRef] [Scilit] [PubMed]
  28. Chen, L.-Z.; Tian, X.-C.; Feng, Y.-Q.; Qiao, H.-L.; Wu, A.-Y.; Li, X.; Hou, Y.-J.; Ma, Z.-H. The Genome-Wide Identification of the Dihydroflavonol 4-Reductase (DFR) Gene Family and Its Expression Analysis in Different Fruit Coloring Stages of Strawberry. Int. J. Mol. Sci. 2024, 25, 9911. [Google Scholar] [CrossRef] [Scilit]
  29. Zhang, Y.; Guo, S.; Zhang, Z.; Li, R.; Du, S.; Hao, S.; Cheng, C. Functional Characterization of Anthocyanin Biosynthesis-Related Dihydroflavonol 4-reductase (DFR) Genes in Blueberries (Vaccinium corymbosum). Plants 2025, 14, 1449. [Google Scholar] [CrossRef] [Scilit]
  30. Zhao, A.G.; Ding, R.W.; Wang, C.; Chen, C.; Wang, D.M. Insights into the catalytic and regulatory mechanisms of dihydroflavonol 4-reductase, a key enzyme of anthocyanin synthesis in Zanthoxylum bungeanum. Tree Physiol. 2023, 43, 169–184. [Google Scholar] [CrossRef] [Scilit]
  31. Glagoleva, A.Y.; Vikhorev, A.V.; Shmakov, N.A.; Morozov, S.V.; Chernyak, E.I.; Vasiliev, G.V.; Shatskaya, N.V.; Khlestkina, E.K.; Shoeva, O.Y. Features of Activity of the Phenylpropanoid Biosynthesis Pathway in Melanin-Accumulating Barley Grains. Front. Plant Sci. 2022, 13, 923717. [Google Scholar] [CrossRef] [Scilit]
  32. Cao, Y.L.; Mei, Y.Y.; Zhang, R.N.; Zhong, Z.L.; Yang, X.C.; Xu, C.J.; Chen, K.S.; Li, X. Transcriptional regulation of flavonol biosynthesis in plants. Hortic. Res. 2024, 11, uhae043. [Google Scholar] [CrossRef] [Scilit] [PubMed]
  33. Yang, S.; Liu, M.; Zhao, C.; Wang, R.; Xue, L.; Lei, J. A novel bHLH transcription factor, FabHLH110, is involved in regulation of anthocyanin synthesis in petals of pink-flowered strawberry. Plant Physiol. Biochem. 2025, 222, 109713. [Google Scholar] [CrossRef] [Scilit] [PubMed]
  34. Jiang, L.; Yue, M.; Liu, Y.; Zhang, N.; Lin, Y.; Zhang, Y.; Wang, Y.; Li, M.; Luo, Y.; Zhang, Y.; et al. A novel R2R3-MYB transcription factor FaMYB5 positively regulates anthocyanin and proanthocyanidin biosynthesis in cultivated strawberries (Fragaria × ananassa). Plant Biotechnol. J. 2023, 21, 1140–1158. [Google Scholar] [CrossRef] [Scilit]
  35. Wang, X.C.; Wu, J.; Guan, M.L.; Zhao, C.H.; Geng, P.; Zhao, Q. Arabidopsis MYB4 plays dual roles in flavonoid biosynthesis. Plant J. 2020, 101, 637–652. [Google Scholar] [CrossRef] [Scilit]
  36. Yang, J.; Chen, Y.; Xiao, Z.; Shen, H.; Li, Y.; Wang, Y. Multilevel regulation of anthocyanin-promoting R2R3-MYB transcription factors in plants. Front. Plant Sci. 2022, 13, 1008829. [Google Scholar] [CrossRef] [Scilit] [PubMed]
  37. Liang, Y.; Han, C.; Yun, L.; Yang, Y.; Cao, Y. Transcriptomic and metabolomic analysis of the mechanism of temperature-regulated anthocyanin biosynthesis in purple asparagus spears. Sci. Hortic. 2022, 295, 110858. [Google Scholar] [CrossRef] [Scilit]
  38. Nutricati, E.; Sabella, E.; Negro, C.; Min Allah, S.; Luvisi, A.; De Bellis, L.; Accogli, R.A. Anthocyanins and Anthocyanin Biosynthesis Gene Expression in Passiflora Flower Corona Filaments. Plants 2025, 14, 1050. [Google Scholar] [CrossRef] [Scilit]
Figure 1. Phenotypic and physiological characteristics of TR and TY fruits during development. (A) Visual appearance and corresponding color charts of TR and TY fruits from S1 to S4 stages. (BD) Dynamic changes in fruit skin colorimetric parameters L* (lightness), a* (redness/greenness), and b* (yellowness/blueness). (EG) Accumulation patterns of anthocyanins, carotenoids, and total chlorophyll, respectively. Data are presented as the mean ± SEM (n = 3). Different lowercase (TR) and uppercase (TY) letters indicate significant differences among developmental stages within the same variety (p < 0.05). For differences between the two varieties at the same developmental stage, all fruit skin colorimetric parameters show significant differences (p < 0.05); differences in pigment parameters are indicated by asterisks (* p < 0.05, ** p < 0.01, *** p < 0.001), and “ns” denotes no significant difference.
Horticulturae 12 00557 g001
Figure 2. Activities of key enzymes involved in the flavonoid biosynthesis pathway during fruit development. (A) Phenylalanine ammonia-lyase (PAL). (B) Chalcone isomerase (CHI). (C) Dihydroflavonol 4-reductase (DFR). (D) UDP-glucose:flavonoid 3-O-glucosyltransferase (UFGT). Data are presented as the mean ± SEM (n = 3). Different lowercase (TR) and uppercase (TY) letters indicate significant differences among developmental stages within the same variety (p < 0.05). Differences in enzymatic activities between the two varieties at the same developmental stage are indicated by asterisks (* p < 0.05, ** p < 0.01, *** p < 0.001), and “ns” denotes no significant difference.
Horticulturae 12 00557 g002
Figure 3. Untargeted metabolomic profiling of I. rotunda TR and TY fruits across S1 to S3 stages. (A) PCA score plot of the metabolome profiles, including quality control (QC) samples. (B) Number of up-regulated and down-regulated differentially accumulated metabolites (DAMs) in the TY mutant relative to the TR control at each stage. (C) Venn diagram illustrating the overlap of DAMs across the three developmental stages. (D) KEGG pathway enrichment analysis of the DAMs. Bubble size represents the number of enriched metabolites, and the color gradient indicates the statistical significance (−log10 p-value). (E) Hierarchical clustering heatmap representing the relative accumulation patterns of flavonoid and phenylpropanoid DAMs shared among all three stages. The color scale indicates the row-normalized relative abundance (Z-score) of each metabolite. Untargeted metabolomic profiling of Ilex rotunda TR and TY fruits across S1 to S3 stages.
Horticulturae 12 00557 g003
Figure 4. Global transcriptomic profiling and Gene Set Enrichment Analysis (GSEA) of TR and TY fruits across the S1–S3 stages. (A) PCA score plot of the RNA-seq data. (B) Venn diagram illustrating the distribution and overlap of DEGs identified in the TY mutant relative to the TR control at each stage. (C) GSEA enrichment score plots for seven key KEGG pathways (Phenylpropanoid biosynthesis, Plant hormone signal transduction, Ascorbate and aldarate metabolism, Carotenoid biosynthesis, Flavonoid biosynthesis, Starch and sucrose metabolism, and Biosynthesis of various plant secondary metabolites) across the three stages, evaluating the coordinated expression polarization of pathway-associated genes between the two genotypes. (D) Ridge plots depicting the expression distribution of core-enriched genes within the seven corresponding KEGG pathways. The color gradient represents the statistical significance (Q-value) of the enrichment.
Horticulturae 12 00557 g004
Figure 5. Expression profiles and interaction network of key genes and candidate transcription factors involved in flavonoid biosynthesis. (A) Hierarchical clustering heatmap illustrating the expression patterns of 32 core genes (including structural and other pathway-related genes) across the S1–S3 stages in TR and TY fruits. The color scale represents the row-normalized expression levels (Z-score), with red indicating up-regulation and blue indicating down-regulation. (B) Protein–protein interaction (PPI) network analysis of the identified core genes, highlighting their functional associations and potential regulatory nodes. (C) Expression heatmap of selected candidate MBW transcription factors.
Horticulturae 12 00557 g005
Figure 6. Integrative multi-omics network analysis and qRT-PCR validation of key genes involved in flavonoid biosynthesis. (A) Pearson correlation heatmap between core DEGs and DAMs. Red indicates a positive correlation, while blue indicates a negative correlation. (B) Integrative correlation network illustrating the regulatory relationships among transcription factors (e.g., bHLH30, bHLH51), structural genes, and target metabolites. Circular nodes represent genes, whereas triangular nodes represent metabolites. Solid lines denote significant correlations. (CH) Validation of RNA-seq expression profiles via qRT-PCR for six pivotal genes: bHLH51 (C), DFR (D), bHLH30 (E), CHI (F), CHS (G), and FLS2 (H). The relative expression levels were normalized to the Actin gene. Data are presented as the mean ± SEM (n = 3). Asterisks indicate statistically significant differences between the TR and TY varieties at the corresponding developmental stages (* p < 0.05, ** p < 0.01, *** p < 0.001; Student’s t-test).
Horticulturae 12 00557 g006
Figure 7. Proposed mechanistic model accounting for the red-to-yellow fruit color mutation in I. rotunda. In the wild-type red fruit (TR, (left)), an intact activating complex (putatively involving bHLH30 and endogenous MYB partners) is hypothesized to activate the DFR promoter, driving robust terminal anthocyanin biosynthesis. In the TY cultivar (right), the putative loss of the bHLH30 activator, coupled with enhanced potential competitive repression by bHLH51, is highly correlated with the profound transcriptional silencing of DFR. This enzymatic blockade creates a competitive bottleneck, forcing shared upstream substrates (dihydroflavonols) to be passively redirected toward the parallel flavonol branch. This passive flux redirection likely results in the overwhelming hyper-accumulation of flavonols (such as rutin and quercetin) and the subsequent yellow phenotype. Red ‘╳’ indicates the primary silenced/blocked transcriptional and metabolic nodes.
Horticulturae 12 00557 g007
Disclaimer/Publisher’s Note: The statements, opinions and data contained in all publications are solely those of the individual author(s) and contributor(s) and not of MDPI and/or the editor(s). MDPI and/or the editor(s) disclaim responsibility for any injury to people or property resulting from any ideas, methods, instructions or products referred to in the content.