Article

Lineage-Specific WGD and SINEs Are Associated with Gene Family Dynamics and Stress Responsiveness in White Clover (Trifolium repens)

Key Laboratory of Molecular Cytogenetics and Genetic Breeding of Heilongjiang Province, College of Life Science and Technology, Harbin Normal University, Harbin 150025, China
*
Author to whom correspondence should be addressed.
Horticulturae 2026, 12(5), 531; https://doi.org/10.3390/horticulturae12050531
Submission received: 22 March 2026 / Revised: 23 April 2026 / Accepted: 24 April 2026 / Published: 25 April 2026
(This article belongs to the Special Issue Regulation of Flowering and Development in Ornamental Plants)

Abstract

Gene family expansion and contraction are key processes underlying functional innovation and genome evolution in plants, yet their roles in the horticultural plant white clover (Trifolium repens) remain poorly understood. In this study, we systematically investigated the association between lineage-specific whole-genome duplication (WGD) and short interspersed nuclear elements (SINEs) with gene family dynamics and stress-responsive transcription. Our results indicate that white clover underwent a lineage-specific WGD, which is associated with increased gene family expansion. SINE copy number was strongly correlated with the proportion of significantly expanded genes (r = 0.637, p = 0.0259, n = 12), but not with the proportion of significantly contracted genes. This result suggests a potential association between SINE insertions and gene family expansion. GO enrichment analyses indicated that expanded gene families are predominantly involved in metabolic processes, environmental stress responses, defense mechanisms, and floral organ development, whereas contracted gene families were mainly enriched in core housekeeping functions, such as ubiquitin-dependent protein catabolism and mitochondrial organization. Transcriptome analyses further showed that genes within expanded families were broadly upregulated under drought, cadmium, and cold stress, while generally upregulated in floral tissues compared with other organs. Collectively, these findings reveal the relationships among WGD, SINE elements, and gene family dynamics in environmental adaptation and flower development, providing a molecular framework for understanding adaptive regulation associated with gene family expansion.

1. Introduction

Gene duplication is a major source of genomic variation, including whole-genome duplication (WGD), segmental duplication, tandem duplication, and transposition-mediated duplication, and these events play important roles in genome evolution and environmental adaptation [1,2]. Legume genomes have been extensively shaped by large-scale duplication events, and multiple WGDs have been identified, including a major event approximately 58 million years ago that is shared by most agriculturally important legume crops [3,4]. In addition, more than 10% of genes in Arabidopsis thaliana are present as tandemly arrayed genes (TAGs) generated by tandem duplication, indicating that tandem duplication also represents an important mechanism for gene expansion in plant genomes [5]. However, compared with WGDs, tandem duplication has a more limited impact on the overall structure and evolution of legume genomes.
Among these duplication types, transposable element (TE)-mediated gene duplication has attracted considerable attention due to its unique molecular mechanisms [6]. TEs are repetitive DNA sequences capable of moving within the genome [7]. Based on their transposition mechanisms, TEs are classified into two major classes: DNA transposons, which move via a “cut-and-paste” mechanism, and retrotransposons, which transpose via a “copy-and-paste” mechanism [8]. First, several TE families, including LTR retrotransposons, non-LTR retrotransposons, TIR DNA transposons, and Helitrons, can mediate the capture and duplication of host genes [6,9,10,11]. Among these elements, short interspersed nuclear elements (SINEs) are a class of non-autonomous retrotransposons that rely on LINE-encoded reverse transcriptase for their mobilization [12]. Previous studies have shown that SINEs exhibit lineage-specific patterns across species, and their potential roles in genome evolution have been increasingly recognized [13]. Second, in addition to mediating gene duplication, TEs can also affect gene structure and function. For example, TE insertions may induce mutations, disrupt gene function, or cause deletions of genomic sequences, which can lead to gene loss [14,15,16].
Although many gene duplication events result in increased gene copy number, most duplicated genes are eventually lost during evolution, with only a small fraction stably retained in the genome [17,18]. To account for this stable retention, several models have been proposed, among which neofunctionalization, sub-functionalization, and dosage balance have been most extensively studied [17,19,20]. Collectively, these three mechanisms enable duplicated genes to escape pseudogenization and be stably preserved during long-term evolution, thereby providing a genetic basis for gene family expansion and functional diversification [21].
Plant adaptation to complex environments involves multiple genomic and evolutionary mechanisms, and increasing evidence indicates that gene family expansions driven by various duplication mechanisms are closely associated with environmental responsiveness and functional diversification in plants. In Arabidopsis thaliana and other land plants, orthologous gene groups expanded through tandem duplication predominantly function in responses to environmental stimuli, suggesting that local gene family expansions enhance the perception of and response to environmental changes [22]. In jackfruit, expanded gene families are enriched in functions related to biotic stress responses, transferase activity, and oxidoreductase activity [23]. In the macadamia genome, the expansion of KASI and SAD gene families contributes to fatty acid chain elongation, highlighting their role in metabolic diversification [24]. Moreover, polyploidization events can further improve plant adaptability; for instance, tetraploid Plectranthus esculentus exhibits increased tuber starch content and tolerance to root-knot nematodes (Meloidogyne spp.), whereas polyploid apple cultivars demonstrate enhanced resistance to apple scab [25,26]. Collectively, gene duplication promotes the functional diversification of individual genes or entire gene families, thereby enhancing plant adaptability to changing environments. Furthermore, studies in the Brassicaceae have reported that the expansion of certain gene families plays a critical role in floral organ development [27].
White clover is a prostrate, herbaceous perennial that originated in the Mediterranean region and is now widely distributed across temperate regions worldwide [28,29]. Its ornamental leaf patterns and white inflorescences make it an excellent plant for landscape and horticultural purposes [30,31]. As an allotetraploid, white clover has a highly complex genome, and its copy number of SINE transposons is significantly higher than that in most closely related legume species [32,33]. These features make it an ideal system for investigating the relationships among WGD, SINE transposons, gene family expansion, and adaptive evolution. Preliminary analyses of this study indicate that white clover exhibits more extensive gene family expansion than other legume species, which may be associated with its complex allotetraploid genome structure and abundant SINE transposons.
However, the roles of SINE transposable elements and lineage-specific WGDs in the genome evolution and environmental adaptation of the ornamental plant white clover remain poorly understood, and their genome-wide distribution and association with gene family dynamics have yet to be systematically characterized. In this study, we first performed a comparative analysis across species to assess gene family evolution and the contribution of whole-genome duplications (WGDs) to gene family expansion. Subsequently, we performed a cross-species correlation analysis to assess the relationship between SINE copy number and the proportion of significantly expanded genes, as well as the relationship between SINE copy number and the proportion of significantly contracted genes. Finally, we conducted functional enrichment and stress-responsive transcriptomic analyses in white clover to explore the role of gene family dynamics in environmental adaptation and floral development, thus revealing their association with environmental adaptation.

2. Materials and Methods

2.1. Genome Data Collection and Processing

The genomes of twelve legume species, including white clover, were analyzed in this study [34]. These genomic data were obtained from public databases, including Phytozome (https://phytozome-next.jgi.doe.gov/) and PlantGIR (http://plantgir.cn/). To ensure comparability among species, genome assembly quality was evaluated prior to downstream analyses. Assembly continuity was assessed using N50 statistics, and genome completeness was evaluated using BUSCO (version 6.0.0) with the Fabales single-copy ortholog dataset (fabales_odb12) [35]. These metrics were used to assess the overall quality and completeness of each genome assembly. In addition, to facilitate gene family clustering, protein sequences from each species were preprocessed to remove redundancy, standardize identifiers, and account for alternative splicing events, so that each gene was represented by a single, unique sequence (the longest transcript was retained for genes with multiple transcripts). Detailed information on the genome, CDS, GFF annotation, and protein sequences is provided in Table A1.

2.2. Gene Family Identification and Phylogenetic Analysis

Protein sequences from twelve legume species, together with the outgroup Arabidopsis thaliana, were used for gene family clustering. Orthologous gene families were identified using OrthoFinder (version 3.1.2) with default parameters [36]. Single-copy orthologous genes were aligned using MAFFT (version 7.525) with the L-INS-i strategy (--localpair --maxiterate 1000) to obtain high-quality multiple sequence alignments [37]. Poorly aligned regions were removed using Gblocks (version 0.91b) in protein mode (-t = p) with relaxed gap parameters (-b4 = 5, -b5 = h) to improve alignment quality [38]. The filtered alignments were concatenated into a supergene matrix using seqkit (version 2.13.0) for downstream phylogenetic analysis [39]. ModelTest-NG (version 0.1.7) was used to select the best substitution model based on the Bayesian Information Criterion (BIC). The JTT+I+G+F model was selected as the best-fit model [40]. A maximum likelihood (ML) phylogenetic tree was constructed using RAxML (version 8.2.12) under the PROTGAMMAIJTTF model. Branch support was assessed using 1000 bootstrap replicates. Arabidopsis thaliana was used as the outgroup [41]. For divergence time estimation, the ML tree was simplified to retain only the species topology. Branch lengths and node support values were removed. Divergence times were estimated using the MCMCtree module in PAML (version 4.10.10) [42]. Amino acid sequences (seqtype = 2) were analyzed under a correlated rates clock model (clock = 3) using approximate likelihood calculations (usedata = 2). Two independent Markov chain Monte Carlo (MCMC) runs were performed. Each run consisted of 20,000 burn-in iterations followed by sampling every 2 iterations until 100,000 samples were obtained. Calibration points were obtained from the TimeTree database. These included: (i) the divergence between Arabidopsis thaliana and legume species (102–112.5 Mya), and (ii) the divergence between Trifolium pratense and Trifolium repens (11.7–14.0 Mya) [43]. Gene family expansion and contraction were analyzed using CAFE (version 5) based on the gene family count matrix generated by OrthoFinder [44]. The K2P model (-k 2) was used. Gene families with copy numbers greater than 100 were excluded to reduce potential false positives and minimize bias in parameter estimation. Significant expansions and contractions were defined based on p-values reported by CAFE (p < 0.05). Based on this threshold, significantly expanded and contracted gene families, as well as the corresponding significantly expanded and contracted genes, were identified for downstream analyses.

2.3. Transposable Element Annotation and Gene Family Dynamics Correlation

For each species, genome-wide repetitive sequences were first identified using RepeatMasker (version 4.1.2-p1) [45]. SINE transposable elements were then specifically annotated using AnnoSINE (version 2), while other types of transposable elements were identified using EDTA (version 2.2.2) for genome-wide TE annotation [46,47]. To avoid redundancy in classification, SINE transposable elements were first specifically annotated using AnnoSINE, and the resulting SINE sequences were subsequently used as input for further transposable element classification using EDTA. For cases in which EDTA misclassified these SINE sequences as other TE types, the annotations were uniformly retained as SINE, and the corresponding overlapping regions were removed from the EDTA-derived TE categories. This procedure avoided redundant counting and ensured the accuracy and consistency of TE classification. The annotation results (Table A2) were subsequently visualized using the online tool Chiplot https://www.chiplot.online/stackedbar_plot.html (accessed on 3 March 2026). Based on these TE-related metrics, we calculated the correlation between SINE copy number and the proportion of significantly expanded genes relative to total genes, as well as the correlation between SINE copy number and the proportion of significantly contracted genes relative to total genes. Linear regression analyses were conducted and visualized using R (version 4.4.1). To further assess the robustness of these results, we additionally performed phylogenetic generalized least squares (PGLS) to control for phylogenetic relatedness among species and leave-one-out cross-validation by sequentially removing each species to evaluate the influence of individual species, with the results summarized in Table A3. Separately, to investigate whether SINE insertions are preferentially associated with significantly expanded or significantly contracted genes, Fisher’s exact test was used to compare SINE insertion frequencies among significantly expanded, significantly contracted, and background genes, and the Benjamini–Hochberg method was applied for multiple testing correction [48]. Finally, all TE prediction files have been deposited in the Zenodo repository (https://doi.org/10.5281/zenodo.19081159).

2.4. Gene Duplication and Whole-Genome Duplication Analysis

To identify putative homologous gene pairs for downstream analyses of gene duplication and whole-genome duplication (WGD), an all-versus-all protein sequence comparison was performed using BLASTP (version 2.5.0+) with an E-value threshold of 1 × 10⁻⁵ [49]. Based on these BLASTP results, collinear gene blocks were detected using the collinearity module of WGDI (version 0.75), requiring a minimum of five collinear gene pairs per block and applying a collinearity score cutoff of 100 [50]. Subsequently, synonymous substitution rates (Ks) of collinear gene pairs were estimated using the Ks module under the NG86 model, and the blockinfo module was used to integrate collinearity structure with Ks information to characterize the evolutionary dynamics of duplicated genomic regions. High-confidence collinear blocks were further refined using the kspeaks module with a Ks range of 0–10 and a significance threshold of p = 0.2 to identify robust Ks peak signals. We subsequently visualized the resulting Ks distributions as line plots in R, providing a comparative overview of gene duplication patterns across species. In addition, to further characterize the sources of gene family expansion, we classified the gene duplication modes of expanded genes in Trifolium repens using MCScanX (version 1.0.0) based on genomic positional information and collinearity relationships, including WGD/segmental, tandem, proximal, and dispersed duplications [51].

2.5. Gene Ontology Annotation and Enrichment Analysis

To improve GO annotation for the white clover genome, which currently suffers from limited annotation quality, GO annotation files for Glycine max (Wm82.a6), Arabidopsis thaliana (TAIR10), and Oryza sativa (v7.0) were downloaded from Phytozome (version 14) and used as reference datasets. A hierarchical annotation strategy was then applied. Glycine max was first used as the primary reference species due to its close phylogenetic relationship with white clover, and BLASTP (version 2.5.0+) searches were performed to assign initial functional annotations based on best-hit matches, using an E-value threshold of ≤1 × 10⁻⁵ and a sequence identity threshold of ≥50%. Arabidopsis thaliana and Oryza sativa were subsequently used as secondary reference species to complement annotations for genes that could not be reliably annotated using Glycine max. A secondary annotation was further performed using the UniProt database to improve annotation completeness [52]. GO annotations were obtained for all genes in the white clover genome using the hierarchical annotation strategy described above. Of all annotated genes, 51.3% were successfully assigned GO terms. GO annotations were then extracted for genes belonging to significantly expanded and significantly contracted gene families. GO enrichment analysis was performed separately for each gene set using all annotated genes in the white clover genome as the background universe, with a hypergeometric test and Benjamini–Hochberg correction applied to identify significantly enriched GO terms [48]. Redundant or closely related GO terms were merged using REVIGO (http://revigo.irb.hr/), and the results were visualized as balloon plots in R [53].

2.6. RNA-Seq Data Processing, Differential Expression and Homology Analysis

Public transcriptome sequencing (RNA-seq) data of white clover were obtained from the NCBI SRA database under three abiotic stress conditions and tissue-specific expression datasets. Cold stress included eight time points (0, 0.5, 1, 3, 6, 12, 24, and 72 h), each with three biological replicates (BioProject: PRJNA781064) [54]. Cadmium stress included five time points (0, 3, 12, 24, and 72 h), each with three biological replicates (BioProject: PRJNA771135) [55]. Drought stress was performed using cultivar GFL 007 with three biological replicates (BioProject: PRJNA953427) [56]. In addition, tissue-specific transcriptome data from flower, root, and leaf were included, each with two biological replicates (BioProject: PRJNA1124556) [57].
The white clover genome annotation file (GFF) was first converted into GTF format, and full-length transcript sequences were extracted using gffread (version 0.12.7) [58]. The resulting transcript FASTA files were standardized, and a Salmon index (version 0.12.0) was constructed for transcript-level quantification. RNA-seq reads were then quantified using Salmon with the parameters --gcBias for GC bias correction and -l A for automatic library type detection to obtain transcript-level expression estimates [59]. For differential expression analysis, representative time points were selected from time-series datasets, with 6 h used for cold stress and 72 h used for cadmium stress, and each selected time point was compared with its corresponding 0 h control to capture key transcriptional responses. Transcript-level expression estimates were then summarized to the gene level using tximport (version 1.34.0), generating a gene-level count matrix that served as the input for downstream analysis [60]. Differential expression analysis was subsequently performed using DESeq2 (version 1.46.0), which is based on a negative binomial model and accounts for sequencing depth as well as biological variation between replicates [61]. Statistical significance was assessed using the Wald test, and multiple testing correction was performed using the Benjamini–Hochberg method to control the false discovery rate (FDR < 0.05). Based on DESeq2 results, log2 fold change (log2 FC) values were extracted for both differentially expressed genes (DEGs) and genes in significantly expanded gene families, and these genes were classified as upregulated (log2 FC ≥ 1 and FDR < 0.05), downregulated (log2 FC ≤ −1 and FDR < 0.05), or unchanged (|log2 FC| < 1 or FDR ≥ 0.05), with all log2 FC and FDR values further used to construct volcano plots to illustrate global expression patterns, while log2 FC values of significantly differentially expressed genes (FDR < 0.05) were additionally summarized in tabular form to describe expression change characteristics. In addition, to investigate the potential functions of expanded gene families associated with flower development, BLASTP homology searches were performed using the NCBI online server with protein sequences of expanded genes that were significantly upregulated in floral tissues relative to other tissues. Searches were conducted against the Arabidopsis thaliana protein database using default parameters. For downstream analysis, only hits with E-values ≤ 1 × 10⁻¹⁰ were retained, and the best-hit homologs were used for preliminary homology-based functional inference.

3. Results

3.1. Phylogenomics and Ks Analysis of Gene Family Dynamics in Legumes

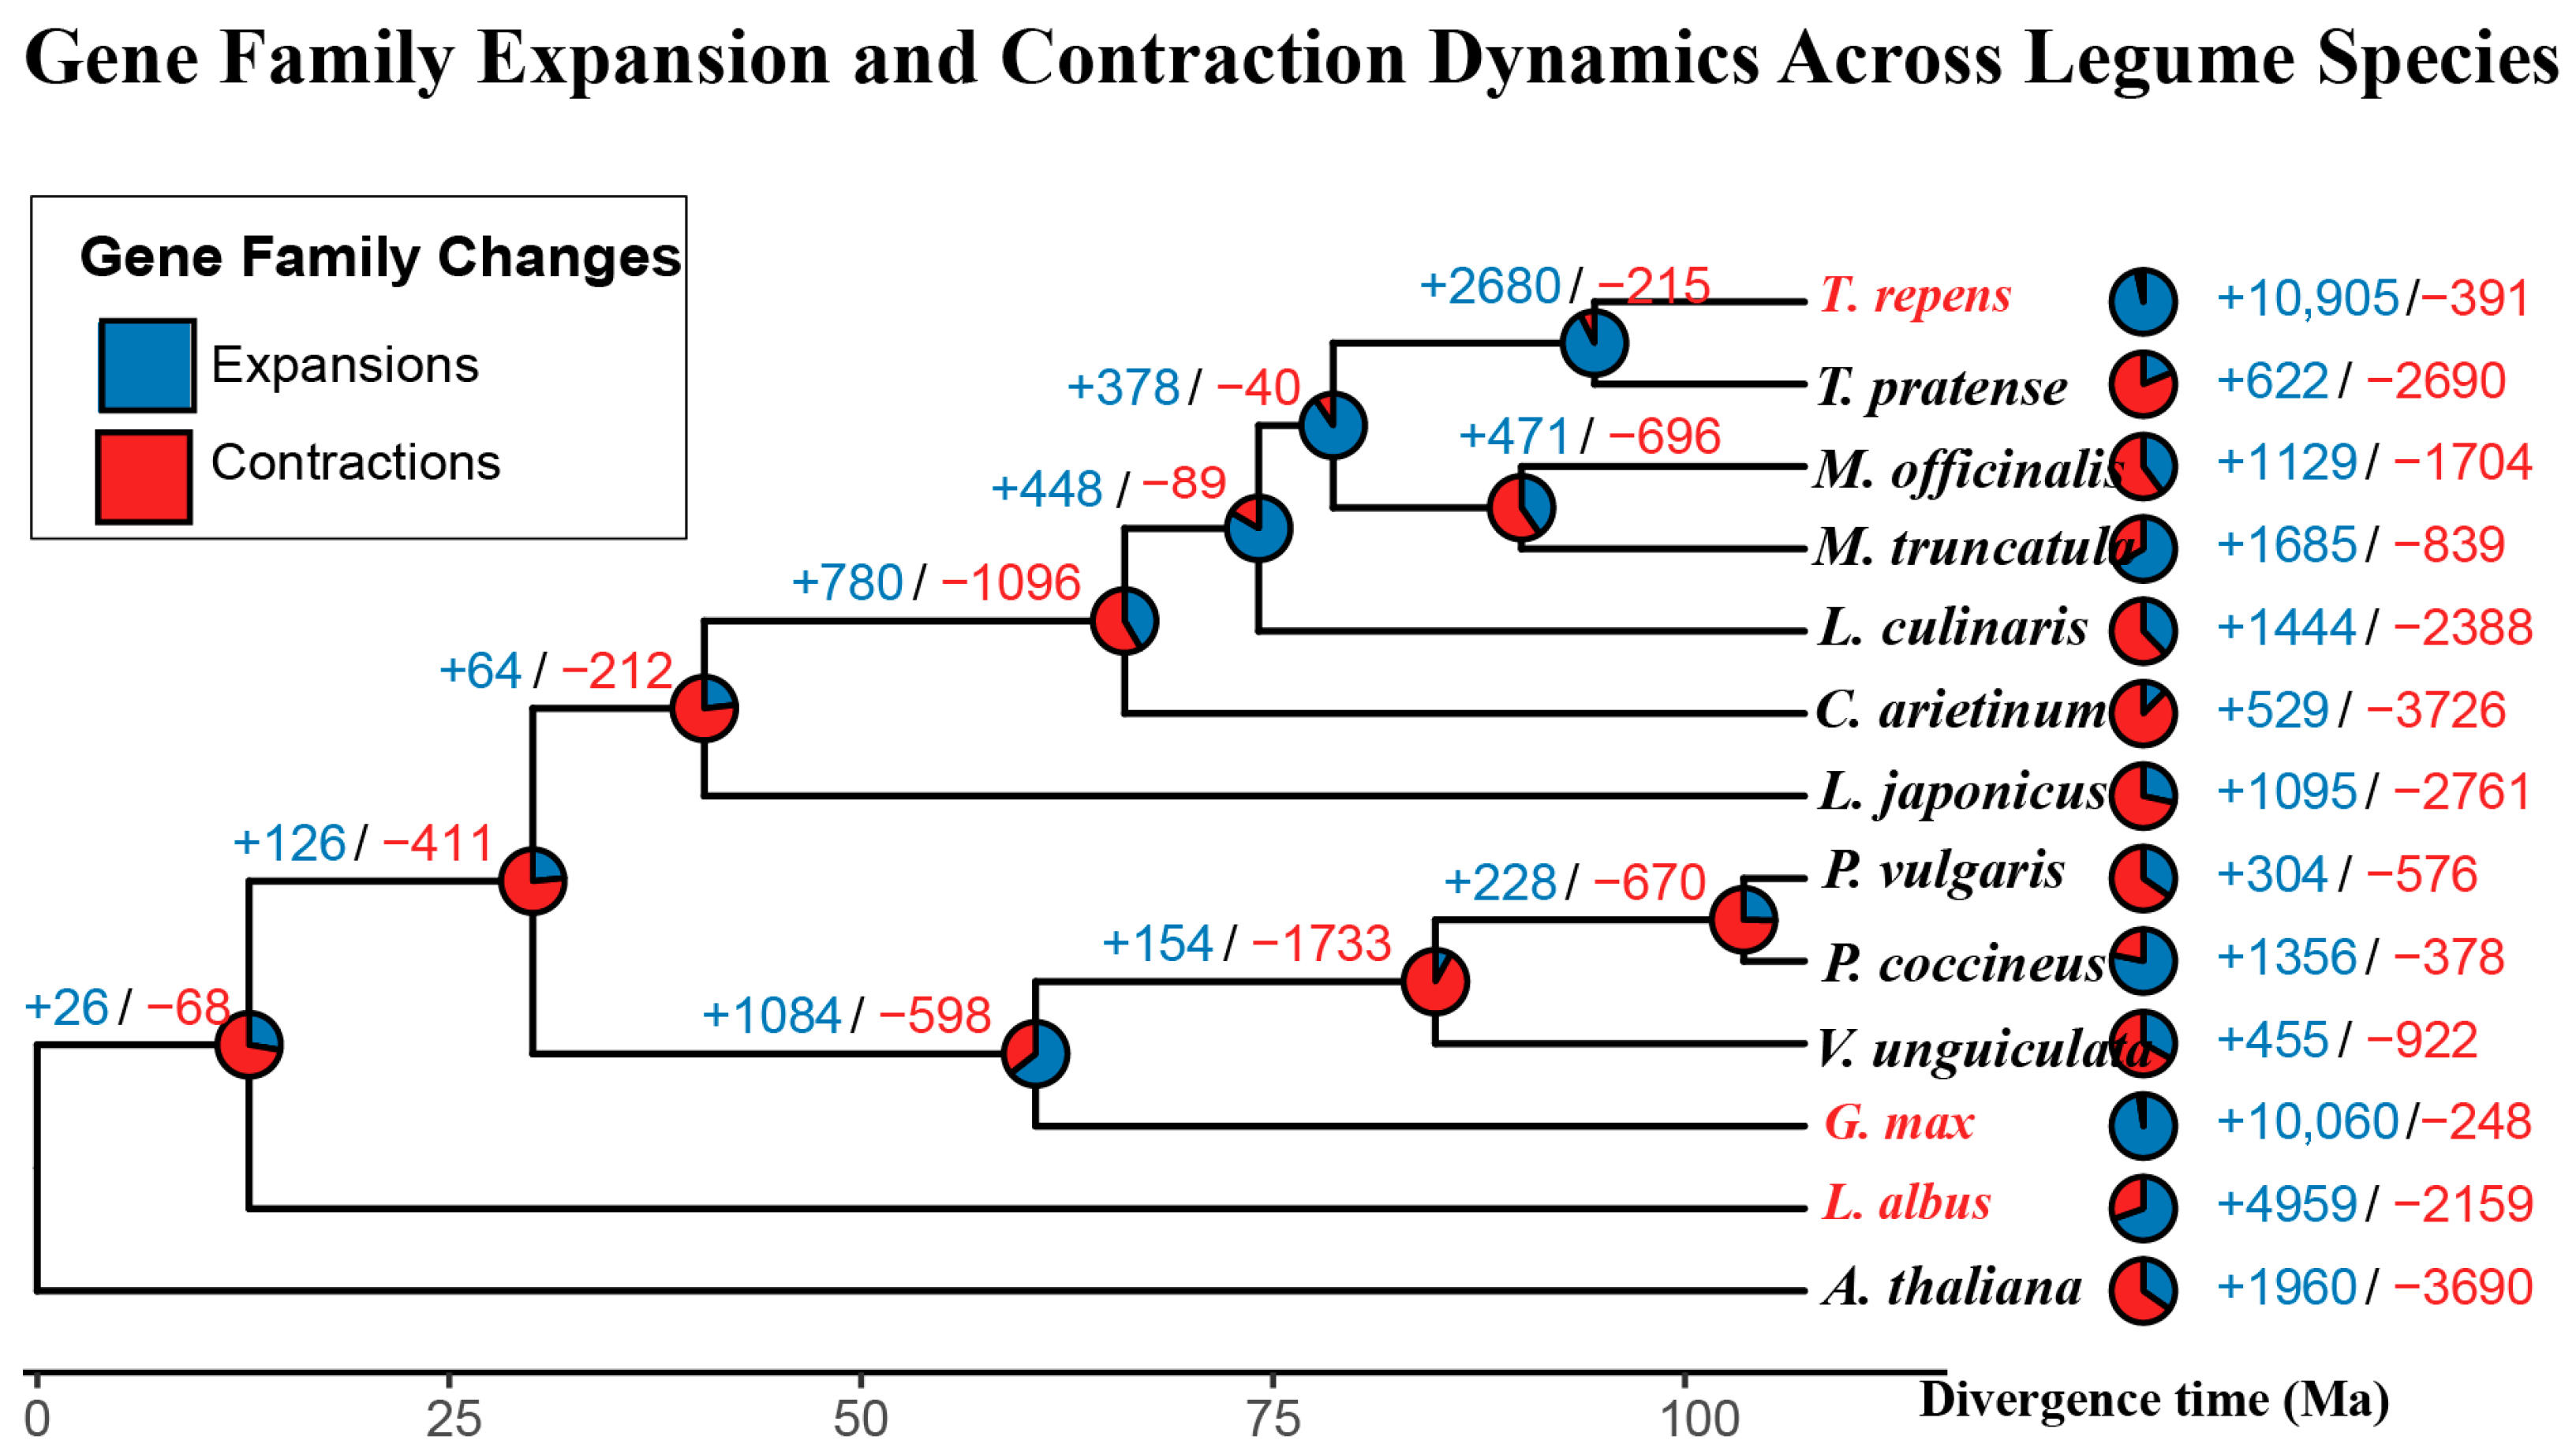
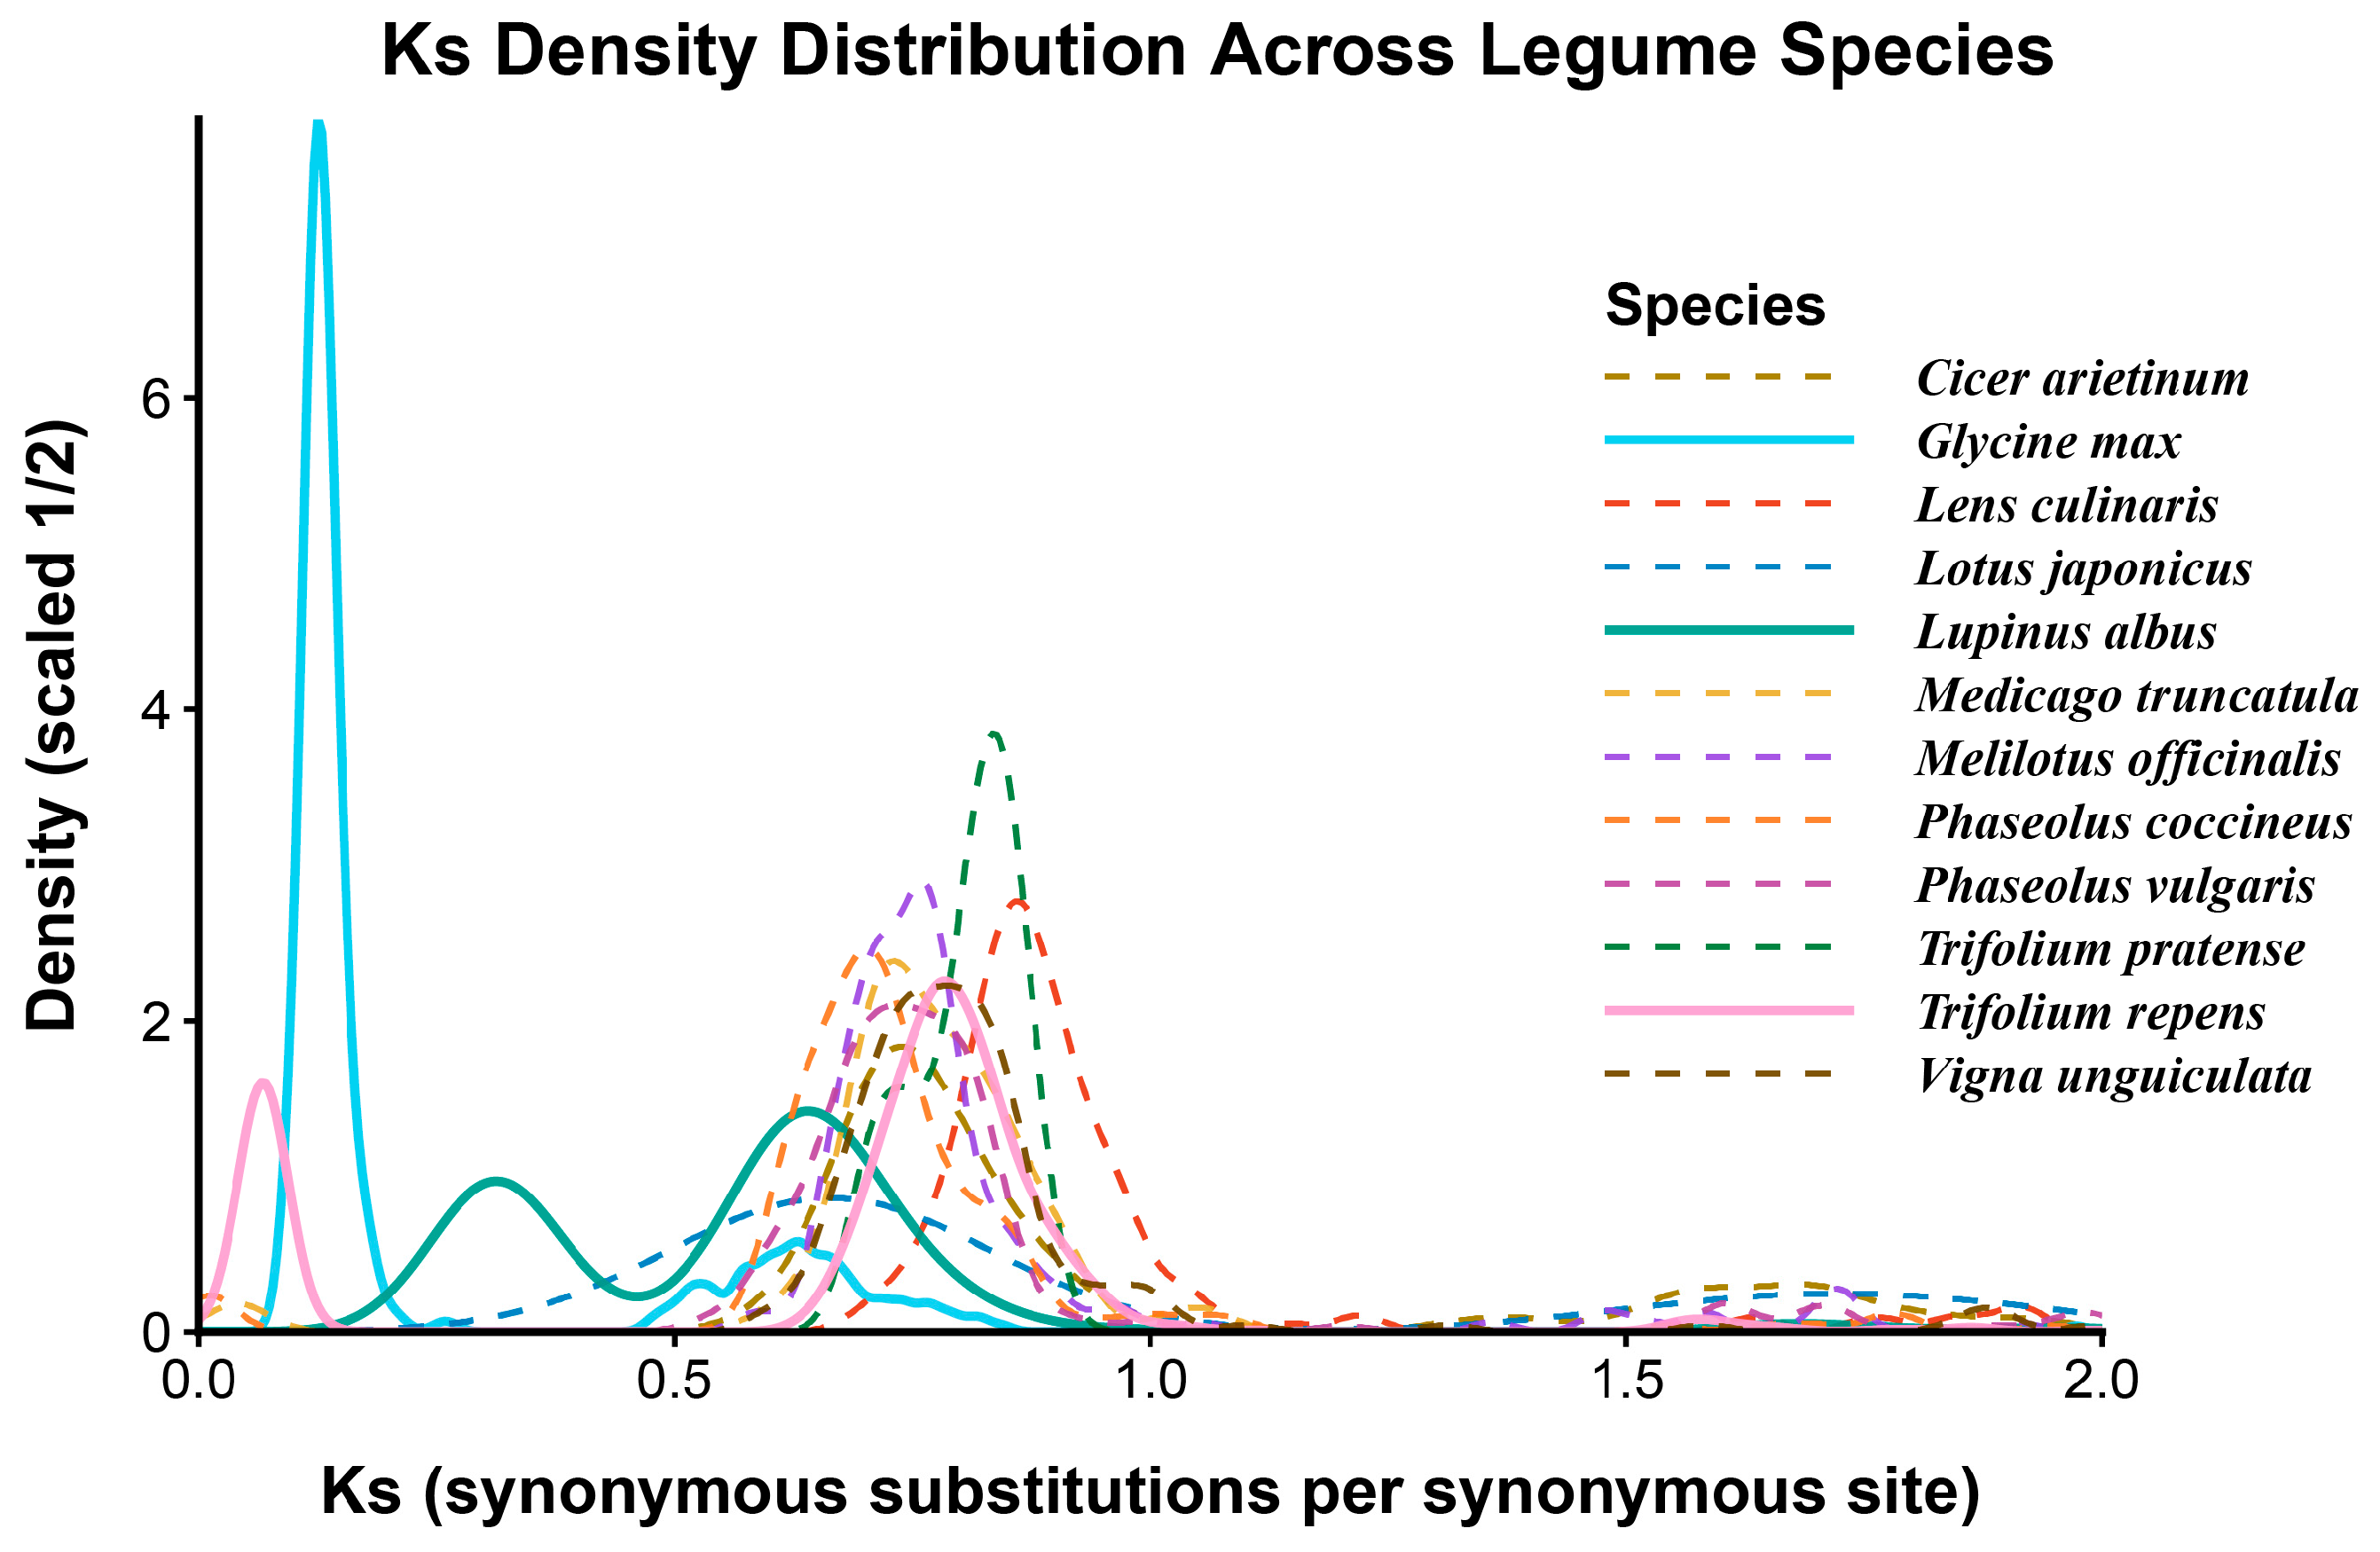
In order to elucidate the relationship between gene family evolutionary dynamics and whole-genome duplication (WGD) events in legumes, we conducted phylogenetic and comparative genomic analyses. Phylogenetic analysis revealed that all legume species formed a strongly supported monophyletic clade, which was clearly separated from the outgroup species Arabidopsis thaliana. Analysis of gene family expansion and contraction (Figure 1) indicated that evolutionary patterns of gene families varied considerably among different legume lineages. Specifically, species exhibiting pronounced gene family expansion (expanded gene families are more than two-fold more numerous than contracted gene families) included Trifolium repens (+10,905/−391), Glycine max (+10,060/−248), Lupinus albus (+4959/−2159), and Phaseolus coccineus (+1356/−378). In contrast, species showing marked contraction (Contracted gene families are more than two-fold more numerous than expanded gene families.) included Trifolium pratense (+622/−2690), Lotus japonicus (+1095/−2761), and Cicer arietinum (+529/−3726). Ks density distribution analysis (Figure 2) indicated that all legume species exhibited a conserved peak at Ks ≈ 0.5–0.9. Notably Glycine max, Trifolium repens, and Lupinus albus also displayed a pronounced lineage-specific peak at Ks ≈ 0.1–0.3, corresponding to the significant gene family expansions described above. To further investigate the sources of gene family expansion, we analyzed the duplication modes of expanded genes in Trifolium repens (Table 1). The results showed that WGD/segmental duplication accounted for the highest proportion (52.3%). This was followed by dispersed duplication (26.7%), tandem duplication (11.1%), and proximal duplication (9.9%).

3.2. Transposable Element Distribution and Correlation with Gene Family Change Rate in Legumes

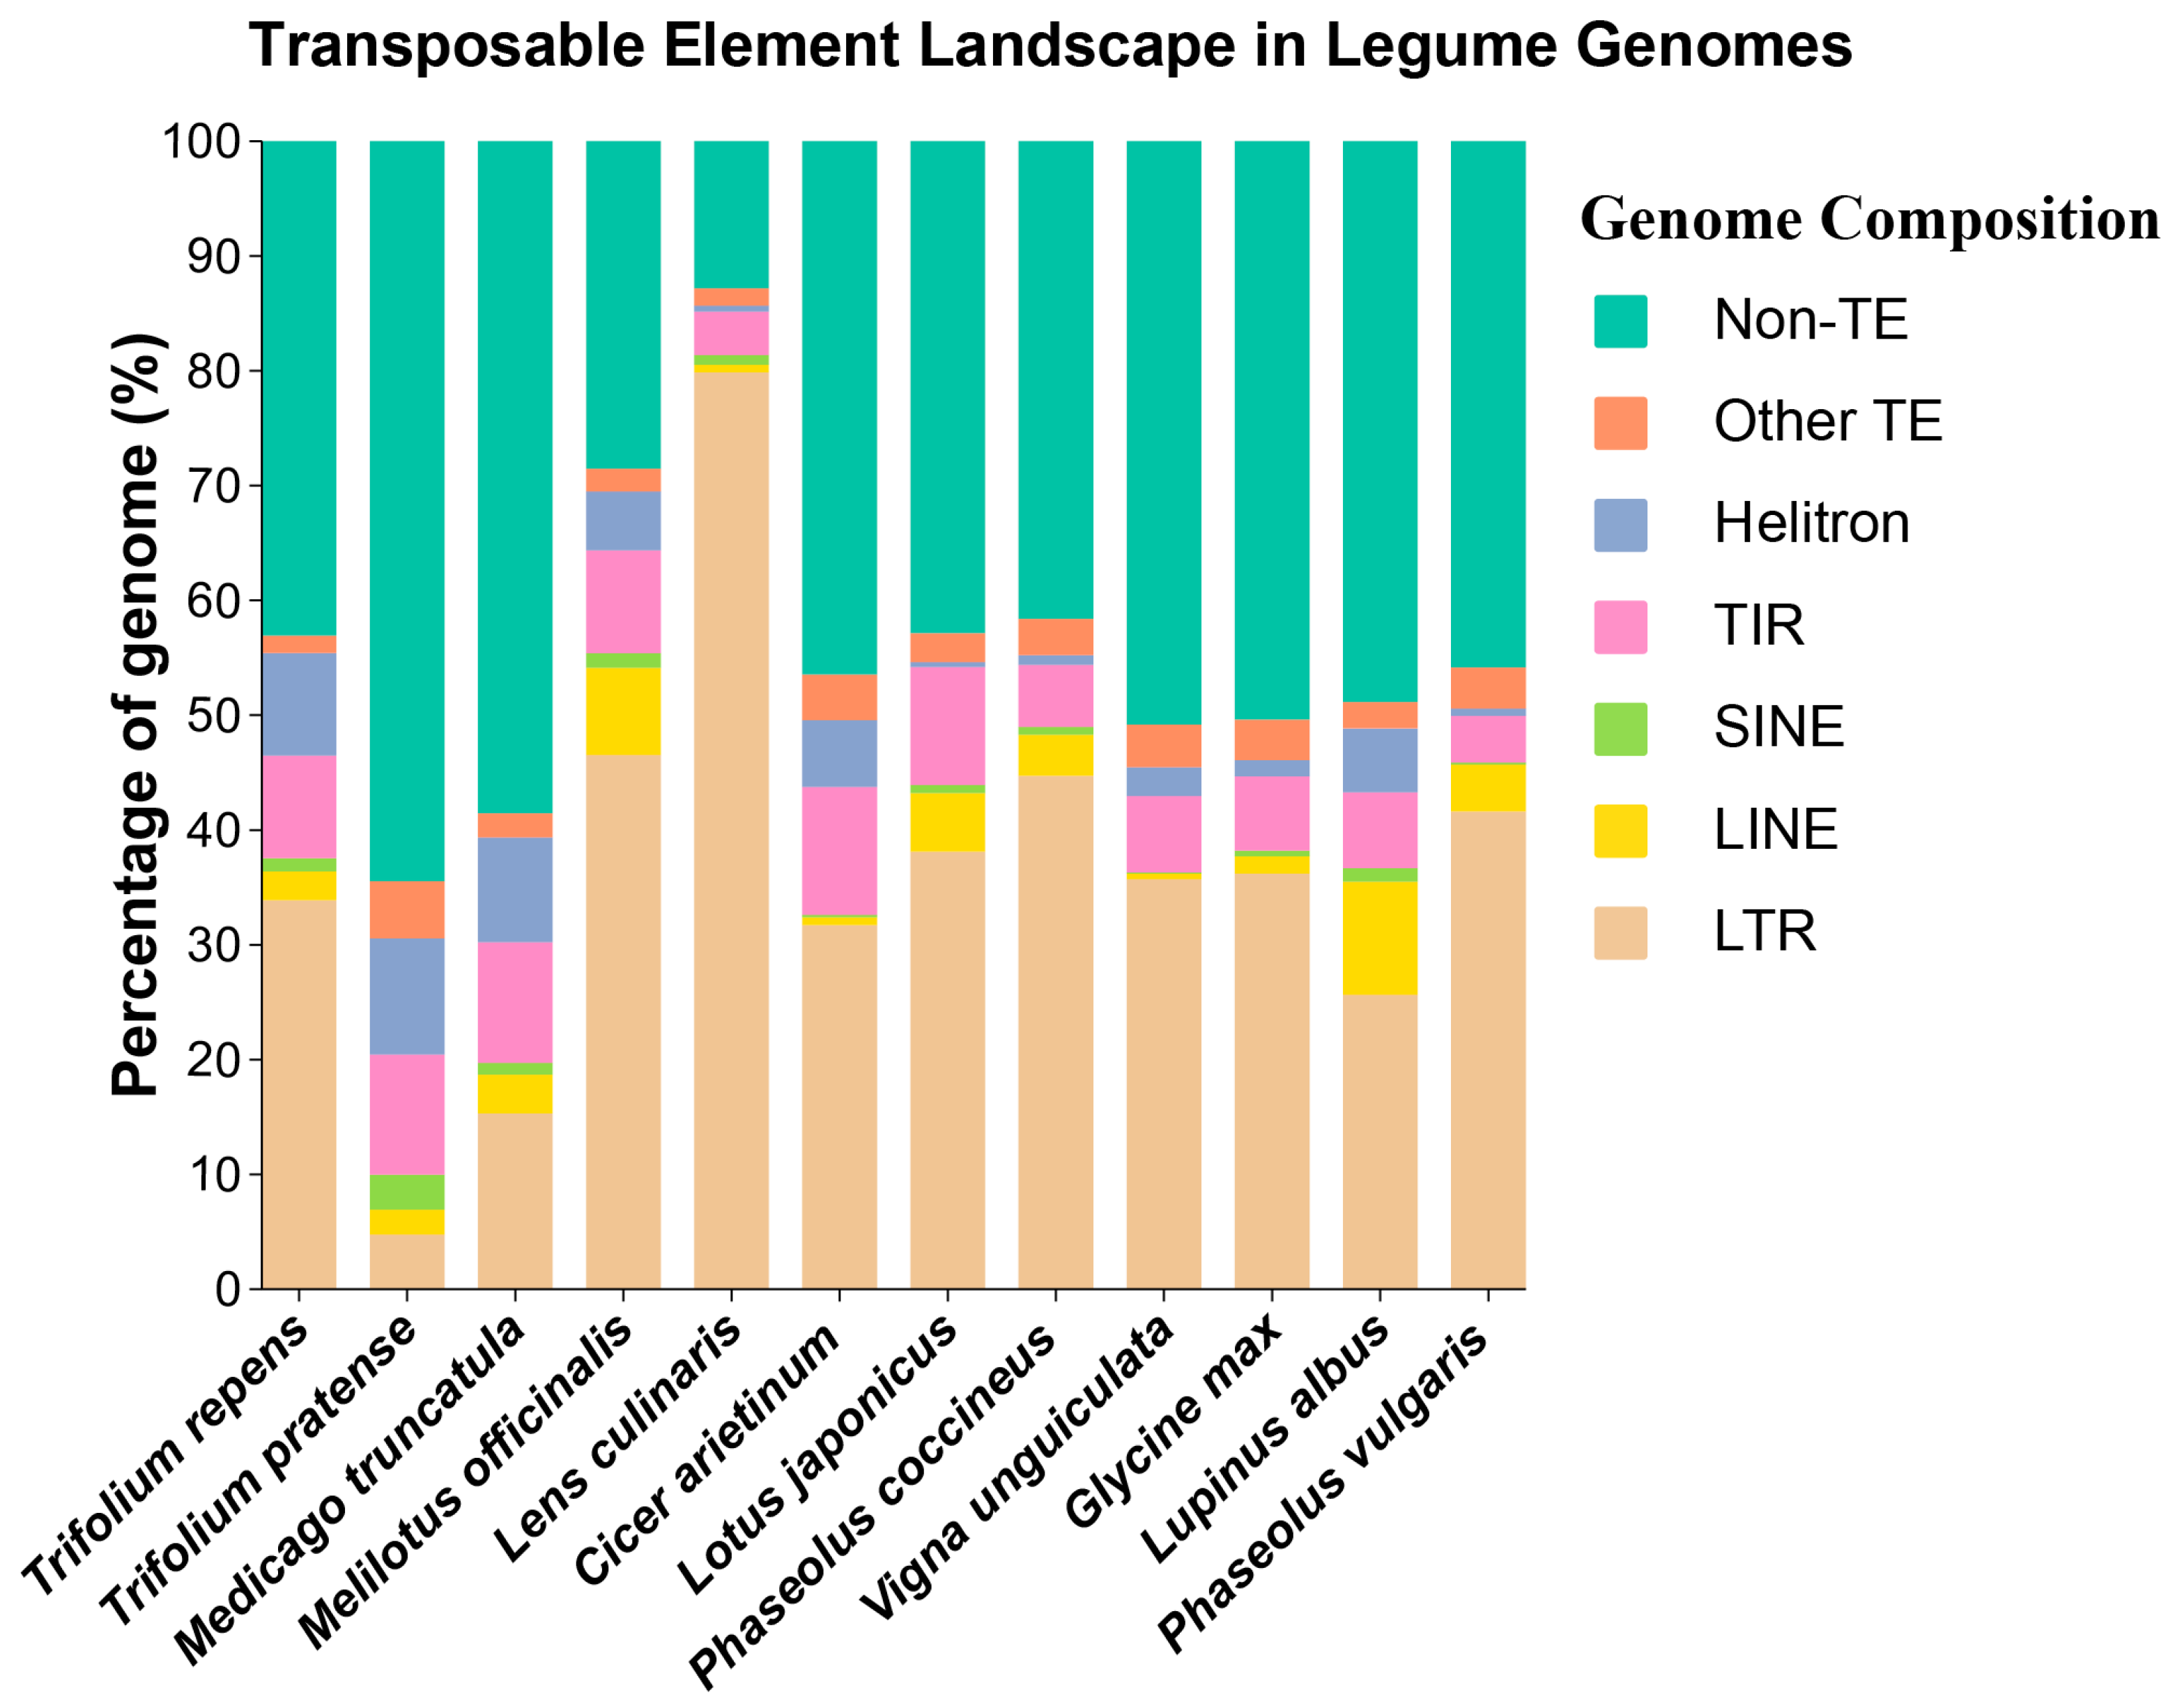
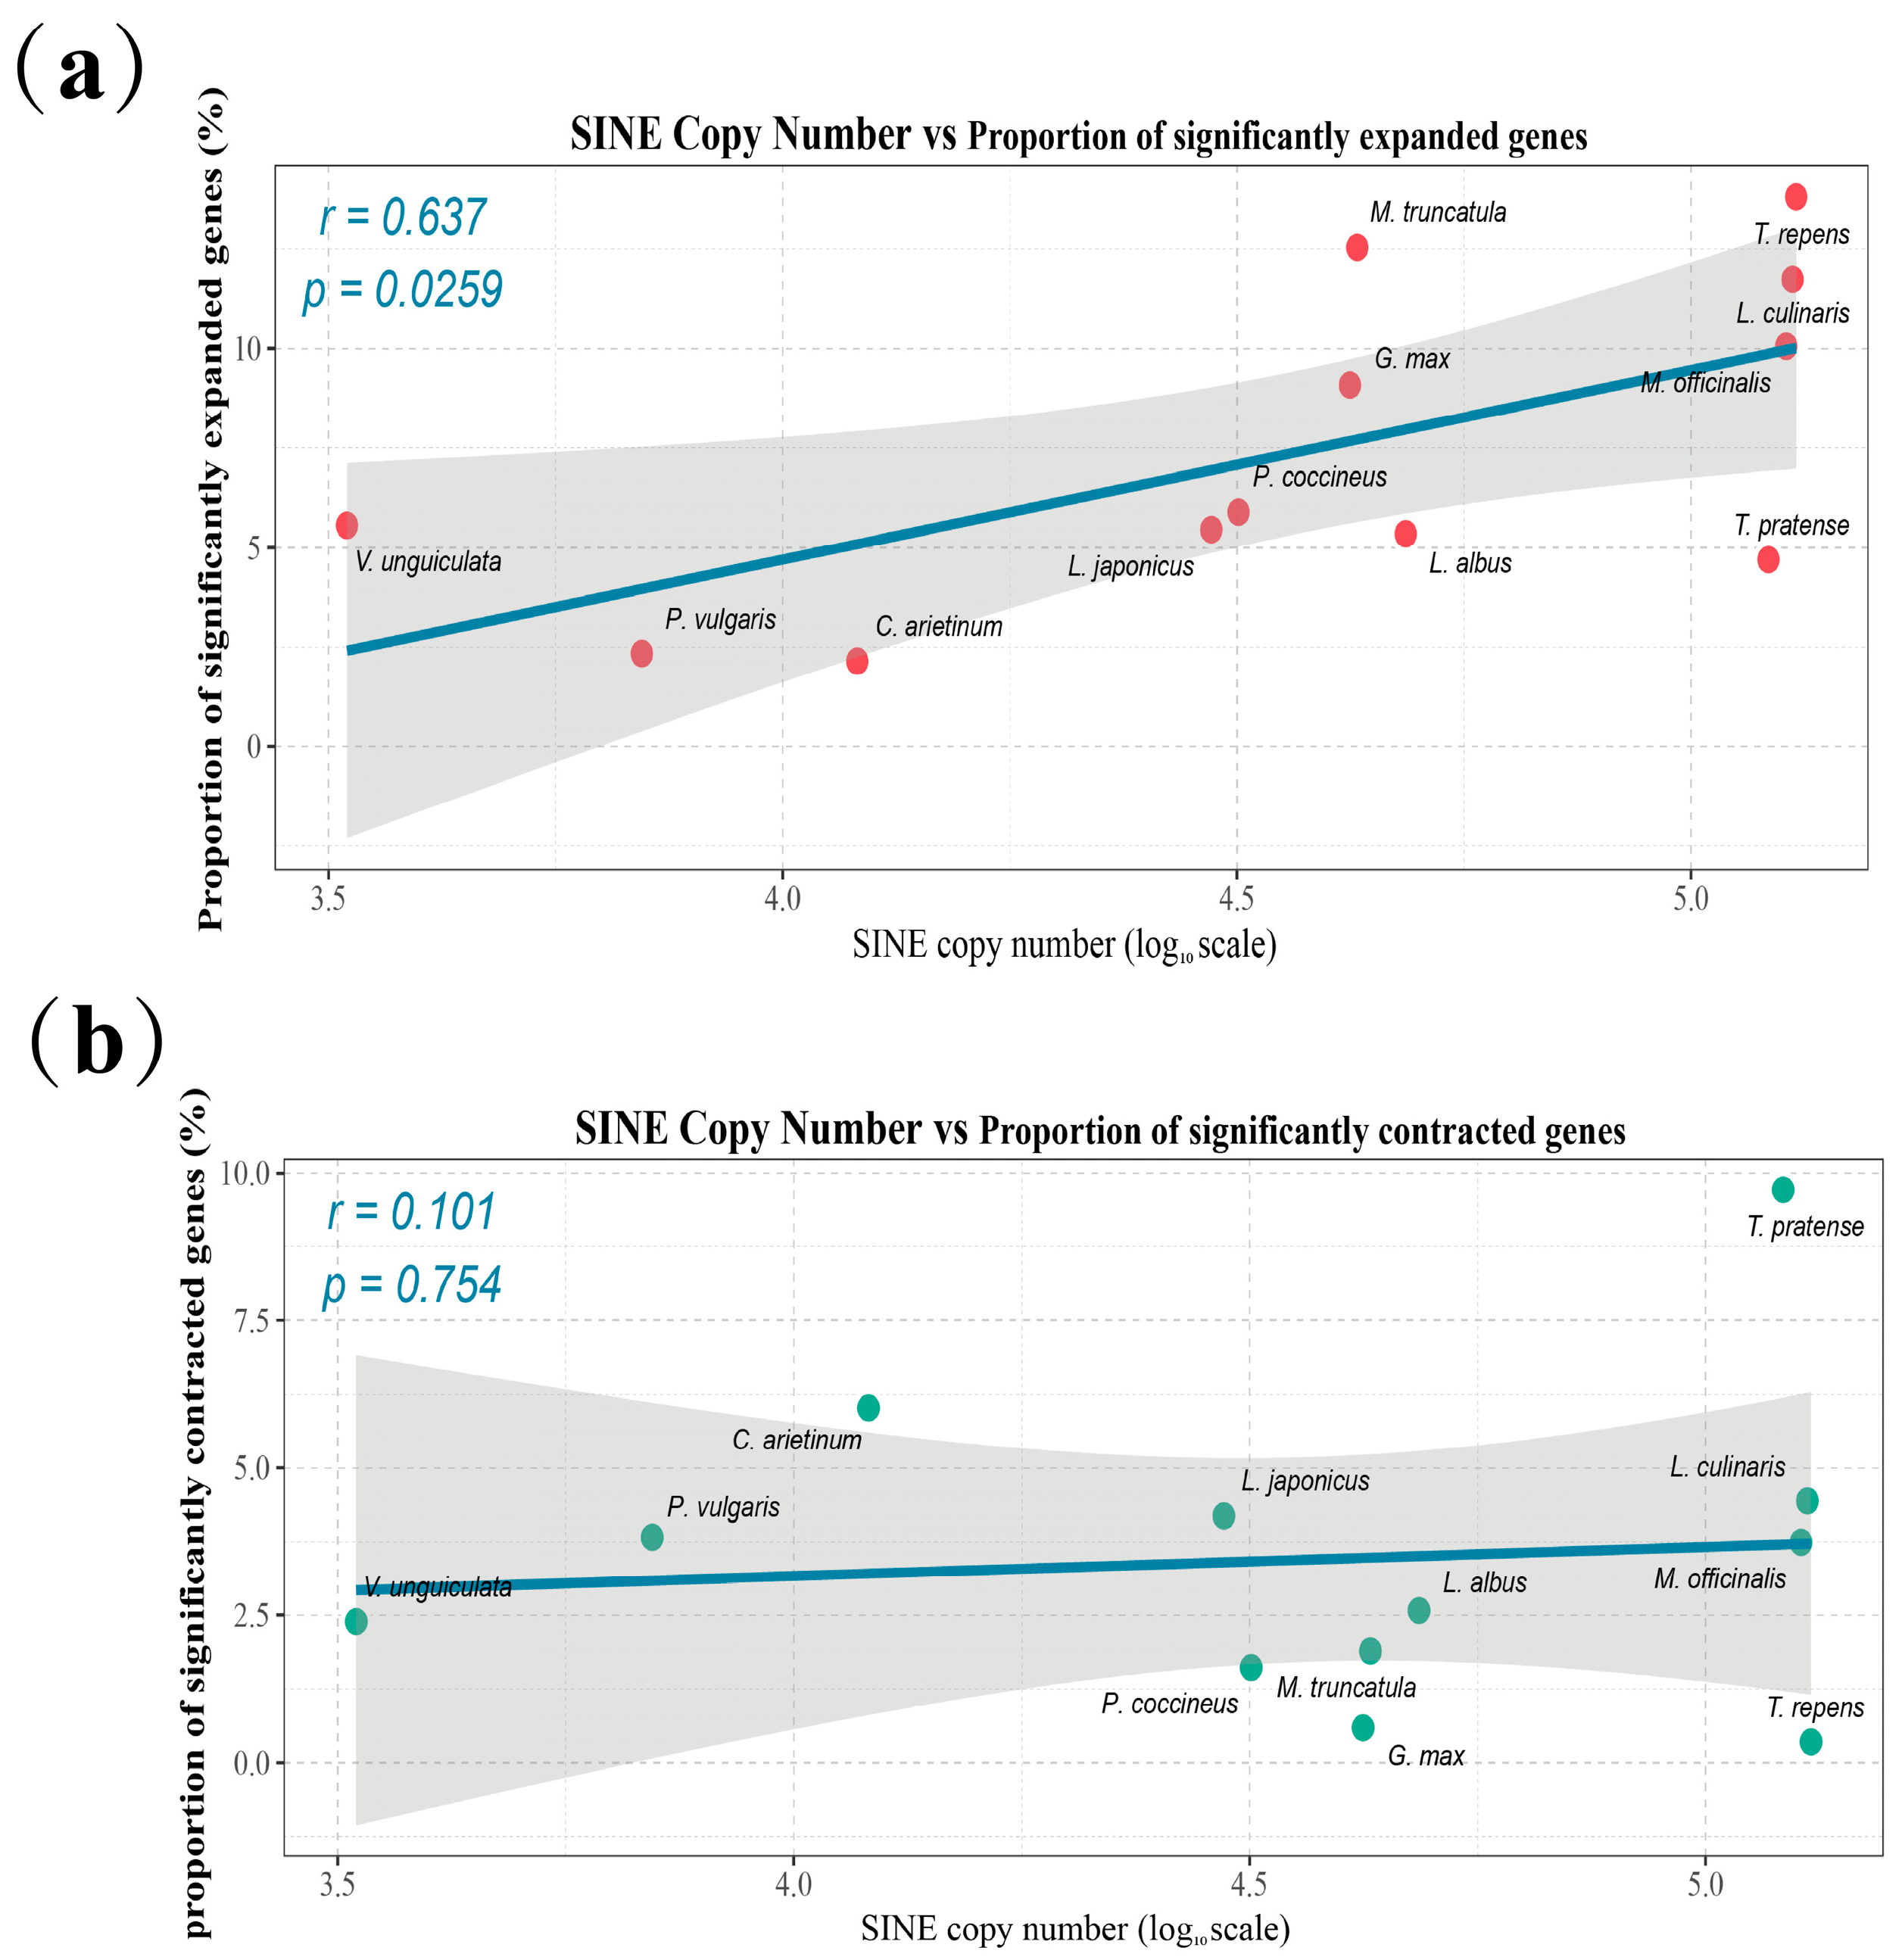
The composition, classification, and genomic distribution patterns of TEs varied markedly among legume species. To investigate the association between TEs and gene family dynamics, we performed TE annotation across the twelve legume species described above (Figure 3). The results revealed significant species-specific differences in TE composition and type distribution. In most species, LTR retrotransposons accounted for the largest proportion, followed by TIR transposons, whereas the abundance of SINEs varied substantially among species. For example, SINEs accounted for 3.05% of the genome in Trifolium pratense, but only 0.87% in Vigna unguiculata. Correlation analysis indicated that SINE copy number was strongly positively correlated with the proportion of significantly expanded genes (r = 0.637, p = 0.0259, n = 12) (Figure 4a). To account for the influence of phylogenetic relatedness, PGLS analysis showed that this correlation remained marginally significant after controlling for phylogeny (p = 0.0576). Leave-one-out cross-validation indicated that 8 out of 11 tests were significant (p < 0.05), three tests were marginally significant (p = 0.0603, 0.0645, and 0.0687), and no negative correlations were observed, suggesting that the correlation was not driven by any single species (Table A3). In contrast, no significant correlation was observed between SINE copy number and the proportion of significantly contracted genes (r = 0.101, p = 0.754, n = 12) (Figure 4b). Statistical analysis of SINE insertion positions further revealed that within the 2 kb upstream and downstream regions of genes, SINE insertion frequencies in both significantly expanded and contracted genes were higher than that in background genes. Specifically, the proportions of SINE insertions in expanded and contracted genes were 44.72% and 52.48%, respectively, compared with 43.75% in background genes. The enrichment for expanded genes was statistically significant but modest in effect size (odds ratio = 1.04, FDR = 0.045), whereas contracted genes exhibited a considerably stronger enrichment signal (odds ratio = 1.42, FDR = 0.0075) (Table 2).

3.3. Functional Enrichment Patterns of Significantly Expanded and Contracted Gene Families in Trifolium repens

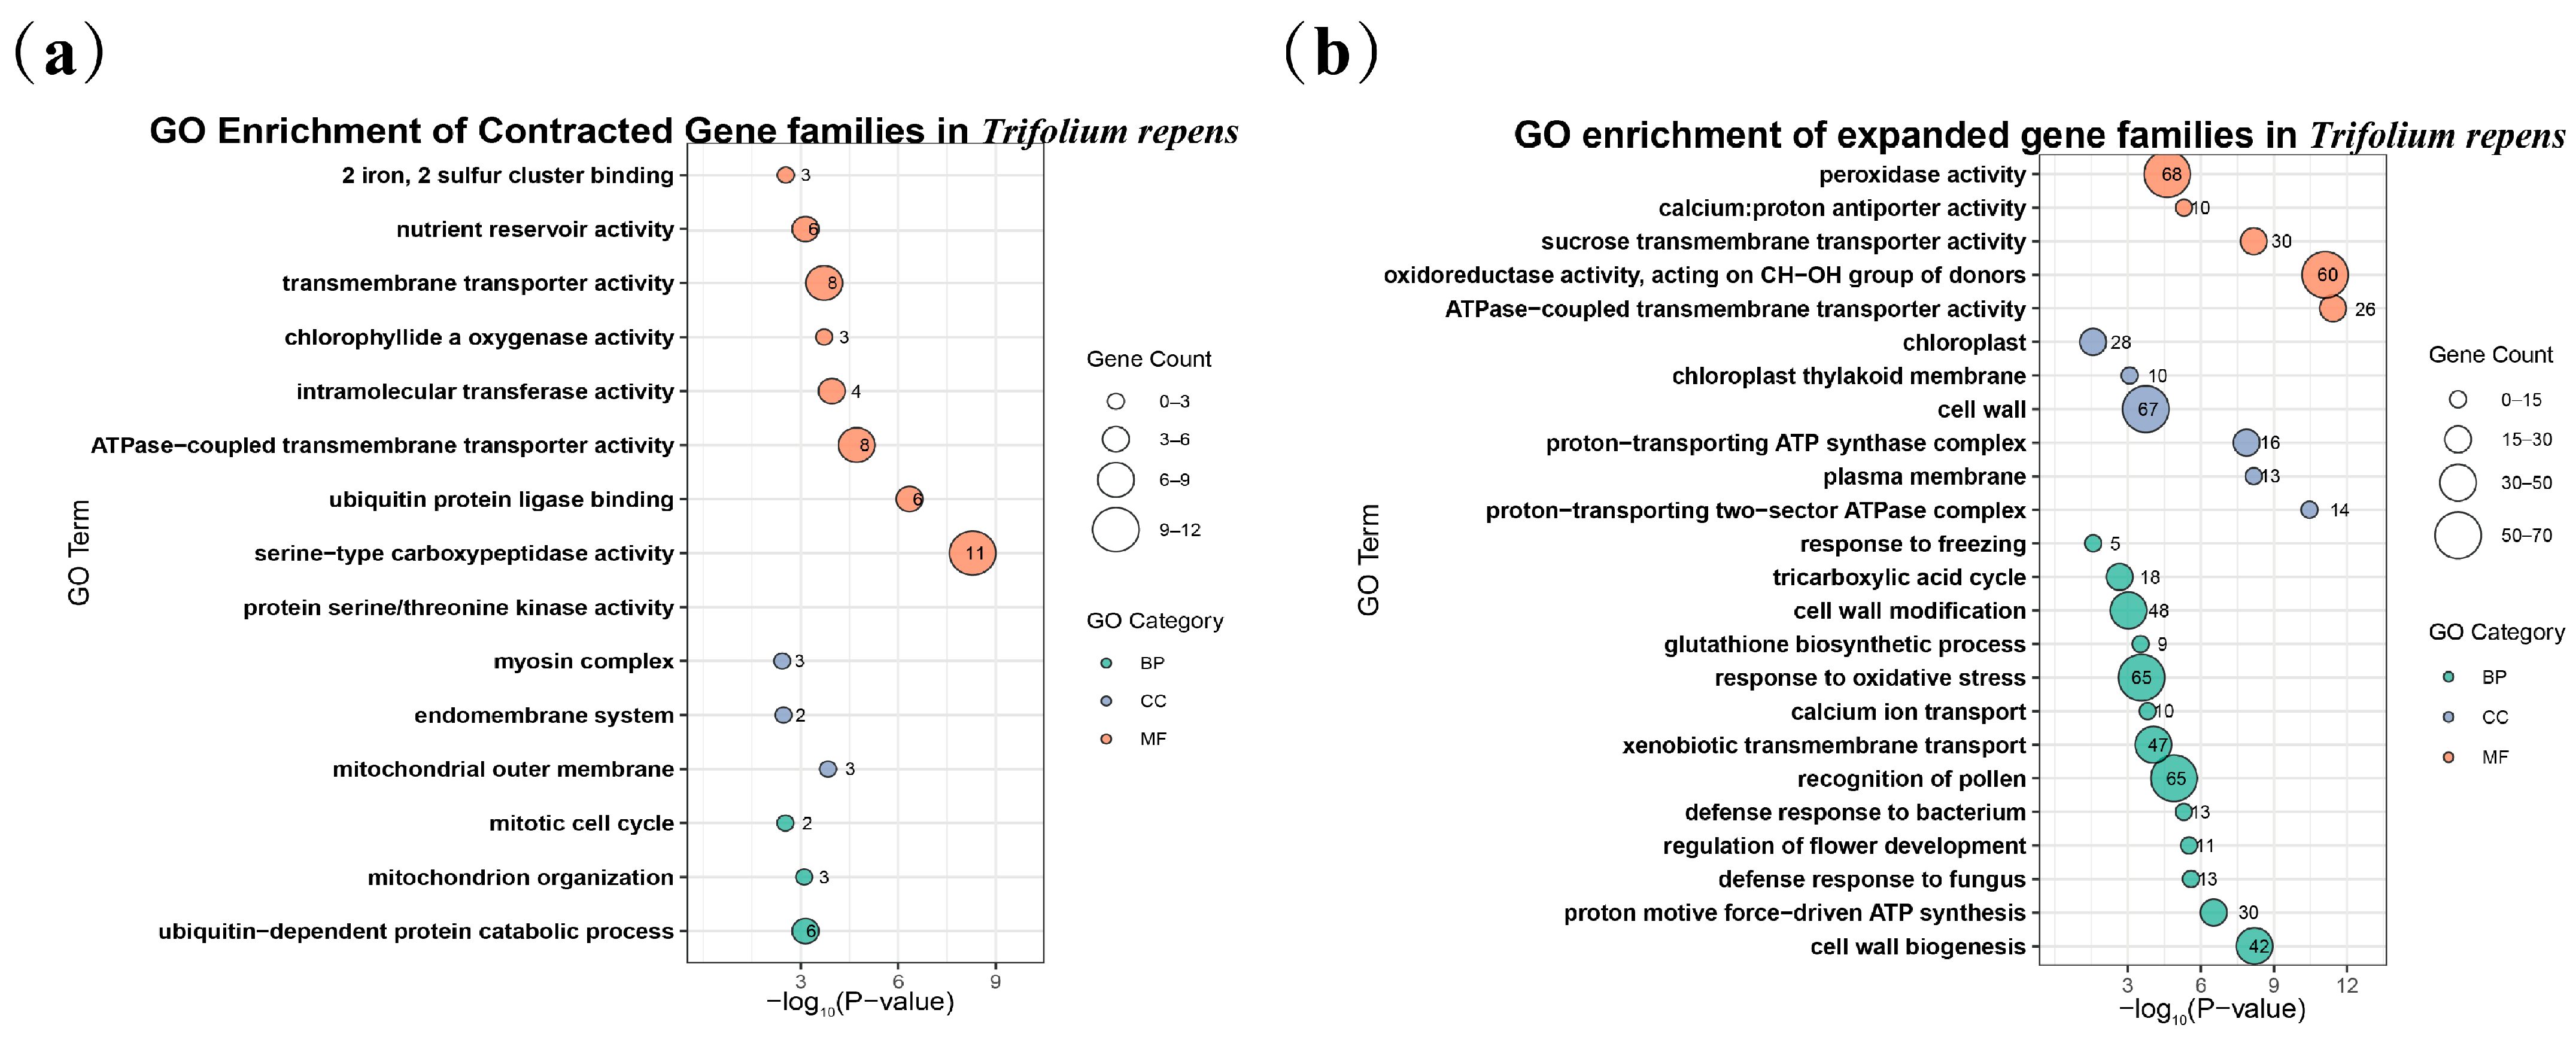
To investigate the functional biases associated with gene family contraction and expansion in white clover, Gene Ontology (GO) enrichment analysis was conducted separately for genes belonging to significantly contracted and expanded gene families (Figure 5), using all annotated genes in the white clover genome as the background set. The results suggested a potential functional divergence between the two gene family categories. Genes in significantly contracted families were mainly enriched in GO terms associated with core cellular functions, including the ubiquitin-dependent protein catabolic process, mitochondrial organization, and mitotic cell cycle (Figure 5a). In contrast, genes in significantly expanded families were enriched in GO terms associated with stress responses, defense mechanisms, cell wall-related processes, and flower development (Figure 5b). GO enrichment analysis revealed that these terms include peroxidase activity, oxidative and cold stress responses, defense responses to bacteria and fungi, as well as pollen recognition and regulation of flower development.

3.4. Expression Patterns and Potential Roles of Significantly Expanded Gene Families in Trifolium repens Under Abiotic Stress and Floral Development

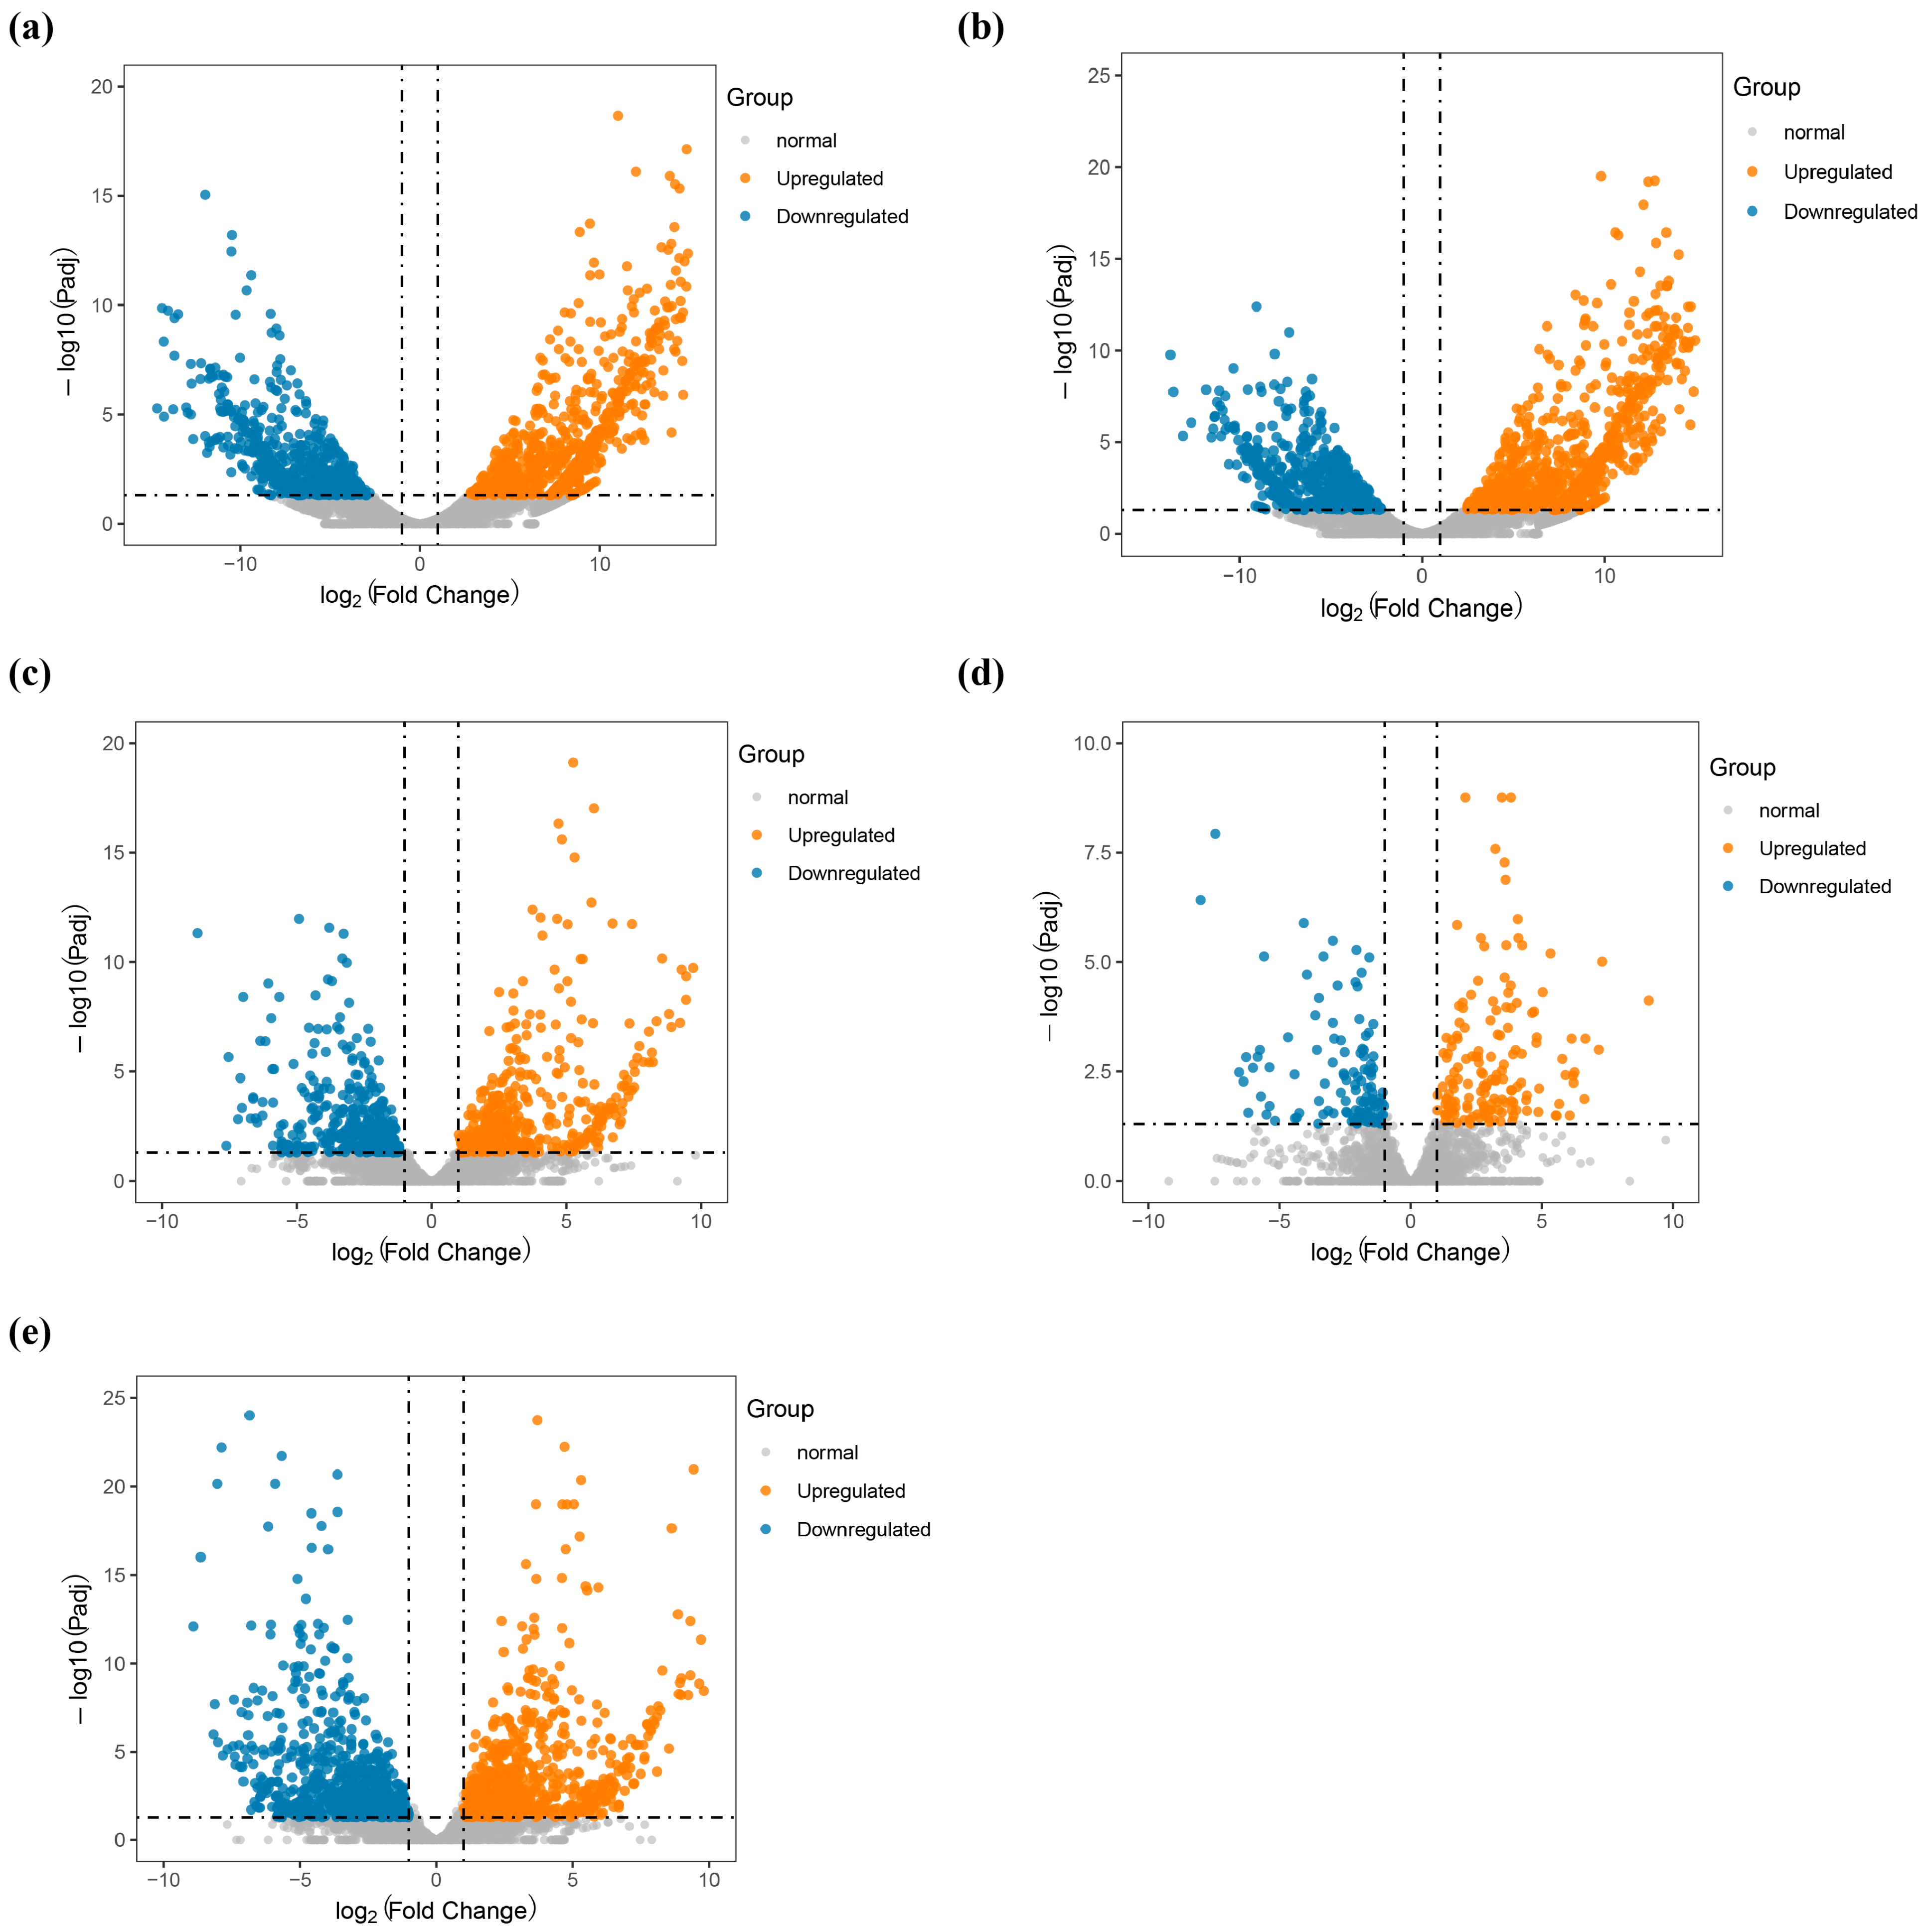
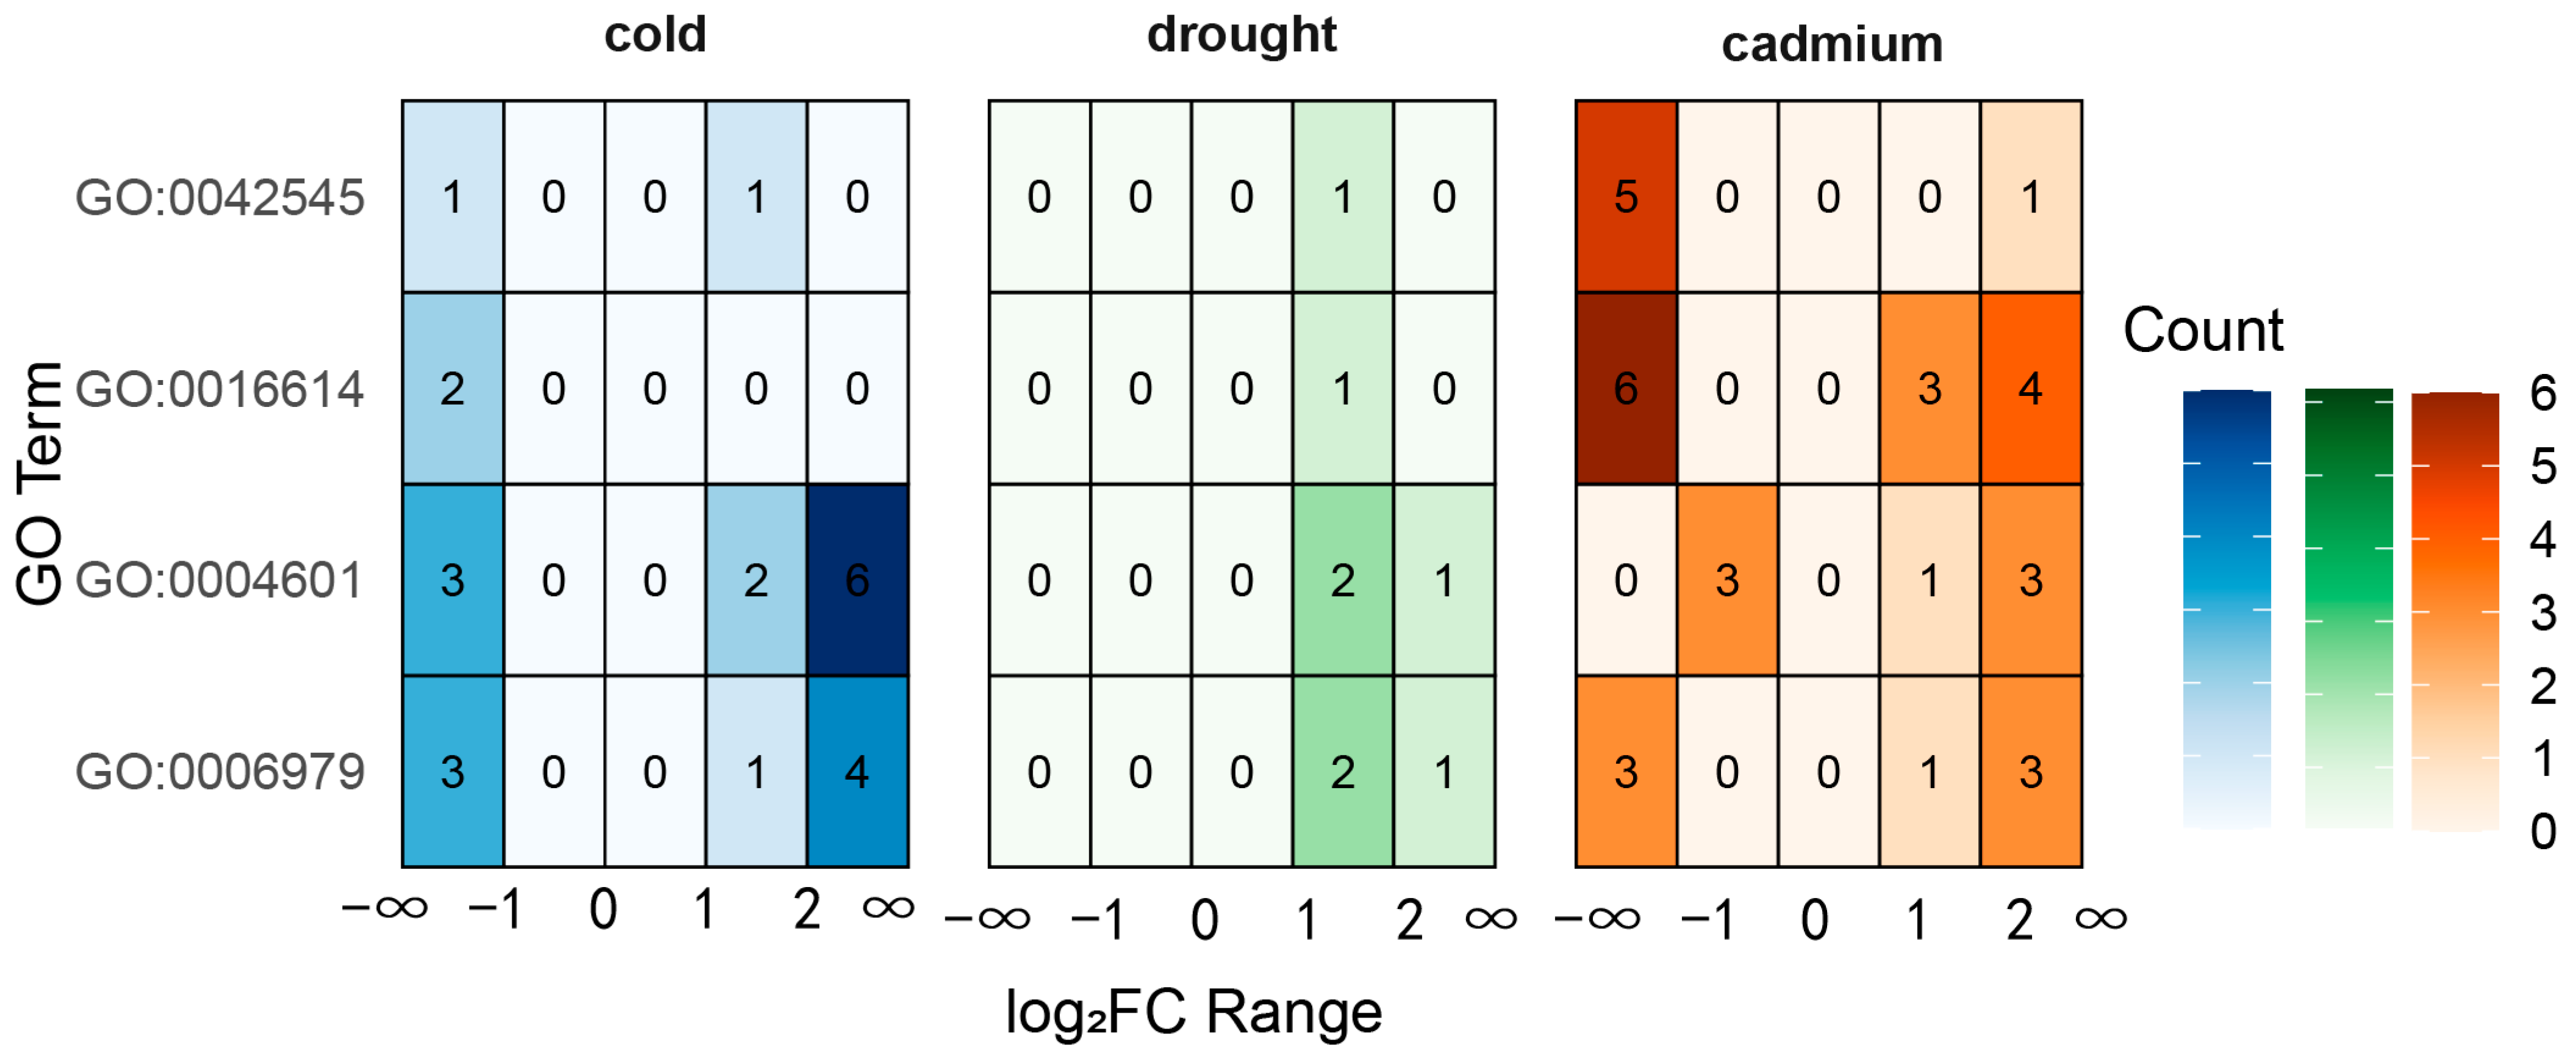
Due to the limited number of significantly contracted gene families and their reduced representation in the transcriptome data, this study primarily focused on the transcriptomic analysis of expanded gene families. To further elucidate the expression patterns of genes within significantly expanded gene families, we analyzed their transcriptional profiles across multiple tissues and various abiotic stress conditions (Figure 6; Table 3). Tissue differential expression analysis showed that, compared with roots, 838 genes were upregulated and 626 were downregulated in floral tissues (mean log2 FC = 1.82), while relative to leaves, 990 genes were upregulated and 562 were downregulated in flowers (mean log2 FC = 3.00). Under abiotic stress conditions, cold exposure induced 446 upregulated and 395 downregulated genes (mean log2 FC = 0.50), drought stress resulted in 157 upregulated and 120 downregulated genes (mean log2 FC = 0.67), and cadmium stress led to 435 upregulated and 328 downregulated genes (mean log2 FC = 0.30). Furthermore, we examined the expression patterns of genes from markedly expanded gene families that fell into four significantly enriched GO terms (GO:0042545, GO:0016614, GO:0004601, and GO:0006979) under the same stress conditions (Figure 7), revealing more upregulated than downregulated genes (38 with log2 FC > 1 vs. 26 with log2 FC < −1). Finally, we selected one candidate, gene family OG0000549, for BLASTP homology analysis. Its encoded protein showed high sequence similarity to Arabidopsis thaliana AT3G05610 (NP_187212.1) (Table A4) and was classified as a member of the plant invertase/pectin methylesterase inhibitor (PMEI) superfamily.

4. Discussion

To investigate the evolutionary drivers underlying gene family expansion in legumes, we first analyzed the impact of whole-genome duplication (WGD) across different species. WGD events are pervasive in angiosperm evolution, generating large numbers of duplicated genes and often retaining key functional categories, thereby providing essential genetic material for gene family expansion and functional innovation [62]. Previous studies have established that WGD events drive gene family expansion in various legumes. For instance, the expansion of the WRKY gene family in Glycine max has been largely attributed to WGD events; the expansion of phosphorus-use efficiency gene families in Lupinus albus is linked to an ancient whole-genome duplication followed by local duplications; similarly, gene family expansions in Trifolium repens have also been driven by WGD events [34,63,64]. However, the relative contribution of WGD to gene family expansion across multiple legume lineages remains incompletely characterized. In this study, Ks distribution analyses across 12 legume species revealed that Trifolium repens, Glycine max, and Lupinus albus exhibited lineage-specific Ks peak patterns, consistent with previously reported duplication histories and gene family expansion patterns (Figure 1 and Figure 2). Notably, these Ks peaks primarily reflect temporal signatures of gene duplication events rather than direct functional drivers of gene family expansion. More importantly, gene duplication mode analysis (Table 1) provides quantitative evidence that WGD/segmental duplication accounts for 52.3% of expanded genes in Trifolium repens, representing the predominant duplication mechanism among all categories. Taken together, these results provide additional evidence, beyond previous studies, supporting the important role of whole-genome duplication and segmental duplication in shaping gene family expansion in legumes.
However, not all duplicated genes are retained over evolutionary time. Although gene duplication increases copy number, most duplicated genes are eventually lost or degenerate into pseudogenes, with only a small fraction stably preserved. To account for the stable retention of this subset of duplicated genes, several evolutionary models have been proposed. Neofunctionalization refers to the divergence of duplicated genes that enables the acquisition of novel functions, exemplified by the tandemly duplicated homeobox genes in the Drosophila bithorax complex, which specify distinct body segment identities; subfunctionalization involves partitioning ancestral gene functions among duplicate copies, as observed in the human hemoglobin gene cluster; and dosage balance maintains genes involved in multi-component interactions that are sensitive to gene dosage, such as transcription factors and signaling components [65,66,67]. Together, these mechanisms enable duplicated genes to escape pseudogenization and be retained over long-term evolution, thereby contributing to subsequent gene family dynamics and functional diversification.
Beyond the aforementioned classical mechanisms of duplicate gene retention, TEs play a crucial role in genome evolution, particularly in gene family evolution. For instance, in the Abp gene clusters of mouse and rat, TEs are significantly enriched in regions of genes that are about to expand, suggesting a close association between TE distribution and gene family expansions [68]. Consistently, we analyzed SINE insertion patterns in the 2 kb upstream and downstream flanking regions of significantly expanded and contracted gene families in Trifolium repens. The results showed that SINE insertion frequencies in both expanded and contracted genes were higher than those in genome-wide background genes. The enrichment for expanded genes was statistically significant but modest in effect size (odds ratio = 1.04, FDR = 0.045), whereas contracted genes exhibited a considerably stronger enrichment signal (odds ratio = 1.42, FDR = 0.0075) (Table 2). Although the difference in SINE insertion frequency between expanded genes and background genes is relatively modest, previous studies have shown that SINE insertions can alter the expression patterns of adjacent genes [69]. Such regulatory changes can drive gene functional divergence and subsequently influence gene family dynamics. GO enrichment analysis (Figure 5) revealed that contracted genes are enriched in core housekeeping functions, whereas expanded genes are enriched in stress response and defense-related functions. We speculate that this functional divergence may shape the distribution patterns of SINE insertions, thus leading to a stronger enrichment signal in contracted genes (odds ratio = 1.42) than in expanded genes (odds ratio = 1.04). Moreover, multiple studies have demonstrated that LTR retrotransposons dominate the TE content in plant genomes, for example, in sugarcane, maize, and tetraploid cotton [70,71]. In contrast, SINE elements show pronounced lineage-specific differences. In Lepidoptera, their retrotransposition activity and copy number vary, whereas Au SINEs remain highly conserved across multiple angiosperm lineages but are degraded or lost in certain lineages [72,73]. Consistently, our analysis of TE abundance across 12 legume species (Figure 3) revealed similar patterns, suggesting that TE activity, particularly SINE insertion preference, may contribute to gene family dynamics.
In addition to exhibiting insertion preferences near genes, TE can also directly mediate gene duplication. Gene duplication mediated by TEs has been documented across multiple TE families. For example, LINE-1 elements in humans have transduced at least 1% of the genome; Pack-MULE elements in maize and Lotus japonicus have been shown to mediate numerous gene duplication events; and in Capsicum species, long terminal repeat retrotransposons (LTR-Rs) promote gene expansion via retroduplication, generating high-copy gene families such as NLRs, MADS-box, and cytochrome P450 genes [74,75,76,77]. Meanwhile, Alu elements can also facilitate both gene duplication and deletion [14]. In this study, SINE copy number was strongly correlated with the proportion of significantly expanded genes (r = 0.637, p = 0.0259, n = 12) (Figure 4a) but not with the proportion of significantly contracted genes (r = 0.101, p = 0.754, n = 12) (Figure 4b), suggesting that SINE activity may contribute to gene family dynamics primarily through its association with gene family expansion rather than contraction, although cross-species correlations are potentially sensitive to shared phylogeny.
Previous studies have indicated that gene family contraction and expansion may be closely associated with species’ environmental adaptability. For example, in plant pathogenic fungi of the genus Calonectria, gene families related to pathogenicity exhibit evident contraction in species with a restricted host range [78]. Moreover, gene family expansions in Amaranthaceae species are primarily concentrated in functional categories related to environmental adaptation [79]. Additionally, gene family expansions confer molecular flexibility, enabling plants to modulate gene expression under varying environmental conditions, thereby enhancing environmental responsiveness [80]. In this study, we also observed a clear functional divergence between significantly contracted and significantly expanded gene families. Significantly contracted gene families were mainly enriched in fundamental cellular processes, including ubiquitin-dependent protein catabolic process, mitochondrion organization, and mitotic cell cycle, indicating that these core biological processes are under strong evolutionary constraints and remain relatively stable (Figure 5a). In contrast, significantly expanded gene families were enriched not only in functional categories related to environmental responses, defense mechanisms, and cell wall-associated processes, such as peroxidase activity, response to oxidative stress, response to freezing, and defense response to pathogens, but also in flower development-related processes, including pollen recognition and regulation of flower development (Figure 5b). Taken together, these results suggest that expanded gene families in white clover may participate in the regulation of stress responses and structural adaptation, and may also contribute to floral development.
To further investigate the roles of significantly expanded gene families in environmental adaptability in white clover, we analyzed their transcriptome expression profiles under cold, cadmium, and drought stress conditions, and examined their differential expression across various tissues to explore potential functional divergence. The results showed that these genes were generally upregulated under stress conditions, as well as in floral tissues compared with other organs (Figure 6, Table 3). Based on these expression patterns, we propose a functional hypothesis: significantly expanded gene families may be involved in floral organ development. To explore this hypothesis, we focused on a gene family, OG0000549, as a candidate. The proteins encoded by this family are highly homologous to Arabidopsis thaliana AT3G05610 (NP_187212.1) (Table A4), which belongs to the plant invertase/pectin methylesterase inhibitor (PMEI) superfamily and is capable of regulating pectin methylesterase (PME) activity. Previous studies have demonstrated that BoPMEI1, a pollen-specific pectin methylesterase inhibitor, is critical for pollen tube growth, supporting the involvement of PMEI family proteins in pollen and floral organ development [81]. Accordingly, we speculate that the OG0000549 gene family may contribute to floral organ development in white clover by mediating cell wall modification; however, this speculation is currently based solely on tissue-specific expression patterns and homology analysis. To further explore the potential functions of significantly expanded gene families in environmental adaptation, we analyzed the GO terms that are enriched among these genes (Figure 5b). This analysis revealed that the number of upregulated genes generally exceeded that of downregulated genes under stress conditions (Figure 7), a pattern consistent with the overall transcriptional response to stress, further suggesting that these genes may participate in stress adaptation in white clover. This finding aligns with previous reports that white clover possesses considerable tolerance to various abiotic stresses, including high salinity, low temperature, drought, heavy metal toxicity, and weed competition [54,82,83,84,85]. In summary, our transcriptome analysis suggests that significantly expanded gene families may function in both abiotic stress responses and floral organ development in white clover. However, it should be emphasized that inferences regarding the role of the gene family OG0000549 in floral development are currently based solely on indirect evidence, including GO enrichment analysis, tissue-specific expression profiles, and sequence homology. Therefore, future experimental validation of these predicted functions is required using the following methods: detailed spatial/temporal expression analysis, coexpression network analysis, and gene editing.

5. Conclusions

This study systematically analyzed the drivers and functional characteristics of gene family dynamics in ornamental white clover. Lineage-specific whole-genome duplication (WGD) event was found to be associated with gene family expansion. SINE transposable elements were significantly enriched in both expanded and contracted gene families. Moreover, SINE copy number was positively correlated with the proportion of significantly expanded genes. Expanded gene families were primarily associated with stress responses, metabolism, defense mechanisms, and cell wall-related processes, while contracted families mainly participated in core cellular functions. Transcriptome analyses revealed that these expanded genes were broadly upregulated under drought, cadmium, and cold stress, suggesting their potential roles in environmental adaptation. Compared with roots and leaves, these genes were generally upregulated in floral tissues, and the OG0000549 gene family may potentially contribute to floral organ development through cell wall modification. Collectively, this study identifies associations among lineage-specific WGD, SINE elements, and gene family dynamics in stress responses and floral tissue development, providing correlative evidence for understanding adaptive regulation driven by gene family expansion and suggesting potential directions for the breeding of stress-tolerant ornamental white clover.

Author Contributions

Conceptualization, Y.S. and Y.B.; Investigation, W.H., J.T., K.W., Y.B., C.G. and Y.S.; Methodology, W.H., K.W. and J.T.; Data curation, W.H. and K.W.; Formal analysis, W.H. and J.T.; Funding acquisition, Y.S.; Project administration, C.G. and Y.S.; Resources, W.H., Y.B. and C.G.; Supervision, Y.S.; Validation, W.H. and J.T.; Writing—original draft, W.H.; Writing—review and editing, W.H., Y.B., C.G. and Y.S. All authors have read and agreed to the published version of the manuscript.

Funding

This research was funded by the Natural Science Foundation of Heilongjiang Province (Grant No. PL2025C051), and Basic Research Fund Project for Provincial Undergraduate Universities of Heilongjiang Province (2025-KYYWF-ZR0121).

Data Availability Statement

All genomic coordinate files for the predicted transposons generated in this study have been deposited in the Zenodo public repository and are freely accessible at the following persistent URL: https://doi.org/10.5281/zenodo.19081159. Additional data supporting the findings of this work are included in the article. For further inquiries, please contact the corresponding author.

Acknowledgments

We are grateful to the High-Performance Computing Center of Harbin Normal University for their support of our analysis work. In addition, we confirm that AI grammar-checking tools were used during manuscript preparation, and authors have reviewed and edited all content and accept full responsibility for the publication.

Conflicts of Interest

The authors declare no conflicts of interest.

Appendix A

Table A1. Summary of genomic information of the species used in this study.
SpeciesSourceAssembly VersionBUSCON50Protein Count
Glycine max Wm82.a2PhytozomeV1.099.5%48.6 Mb56,004
Trifolium pratensePhytozomeV2.090.5%22.7 Mb39,762
Trifolium repensfigshareV1.098.4%64.5 Mb90,128
Medicago truncatulaPhytozomeMt4.0v197.4%49.2 Mb50,883
Vigna unguiculataPhytozomeV1.199.9%41.7 Mb29,773
Melilotus officinalisPlantGIRV1.098%131.6 Mb47,873
Lotus japonicusPhytozomeLj1.0v196.3%85.6 Mb28,251
Lens culinarisPhytozomeV196.9%482.2 Mb38,992
Cicer arietinumPhytozome492_v1.0.99.4%40 Mb28,269
Phaseolus vulgarisPhytozomev2.199.6%49.7 Mb27,443
Phaseolus coccineusPhytozomev1.199.4%56.8 Mb29,443
Lupinus albusPhytozomeV191.9%17.3 Mb38,258
Table A2. Genomic composition of 12 legume species.
SpeciesLTR (%)LINE (%)SINE (%)TIR (%)Helitron (%)Other TE (%)Non-TE (%)
Glycine max Wm82.a236.211.510.486.471.423.5250.38
Trifolium pratense4.772.173.0510.4610.134.9964.44
Trifolium repens33.892.511.158.948.931.5243.06
Medicago truncatula15.333.351.0410.529.132.158.53
Vigna unguiculata35.730.490.096.650.523.7250.8
Melilotus officinalis46.547.591.288.965.131.9828.52
Lotus japonicus38.125.110.710.280.412.5442.84
Lens culinaris79.860.680.843.770.541.5012.8
Cicer arietinum31.720.670.2111.155.813.9846.45
Phaseolus vulgaris41.634.060.194.060.643.5745.84
Phaseolus coccineus44.743.570.685.420.833.1641.61
Lupinus albus25.669.841.196.595.572.348.85
Table A3. Sensitivity and robustness analysis of the correlation between SINE copy number and the proportion of significantly expanded genes.
AnalysisSample Size (n)p-ValueSignificance
Phylogenetic control (PGLS)120.0576Marginally significant
Removing V. unguiculata110.0402Significant
Removing G. max110.0288Significant
Removing C. arietinum110.0603Marginally significant
Removing L. japonicus110.0426Significant
Removing P. coccineus110.0409Significant
Removing M. truncatula110.0086Significant
Removing L. albus110.0389Significant
Removing P. vulgaris110.0645Marginally significant
Removing T. pratense110.0042Significant
Removing M. officinalis110.0472Significant
Removing L. culinaris110.0687Marginally significant
Table A4. Best hit proteins in Arabidopsis thaliana of gene family OG0000549 members.
Protein IDBest Hit in Arabidopsis thalianaE-ValuePer. Ident (%)Functional Annotation
Chr01.g03159.m1NP_187212.1048.6Pectinesterase inhibitor activity
Chr01.g02746.m1NP_187212.1048.77Pectinesterase inhibitor activity
Chr03.g17570.m1NP_187212.1047.55Pectinesterase inhibitor activity
Chr03.g17573.m1NP_187212.1048.07Pectinesterase inhibitor activity
Chr03.g17557.m1NP_187212.1048.15Pectinesterase inhibitor activity
Chr08.g42581.m1NP_187212.1047.7Pectinesterase inhibitor activity
Chr12.g68114.m1NP_187212.1048.21Pectinesterase inhibitor activity
Chr12.g69319.m1NP_187212.1048.21Pectinesterase inhibitor activity
Chr14.g77068.m1NP_187212.1048.51Pectinesterase inhibitor activity
Chr14.g77058.m1NP_187212.1048.42Pectinesterase inhibitor activity
Chr14.g77063.m1NP_187212.1047.9Pectinesterase inhibitor activity
scaffold1.g00545.m1NP_187212.1048.25Pectinesterase inhibitor activity

References

  1. Panchy, N.; Lehti-Shiu, M.; Shiu, S.H. Evolution of Gene Duplication in Plants. Plant Physiol. 2016, 171, 2294–2316. [Google Scholar] [CrossRef] [PubMed]
  2. Freeling, M. Bias in plant gene content following different sorts of duplication: Tandem, whole-genome, segmental, or by transposition. Annu. Rev. Plant Biol. 2009, 60, 433–453. [Google Scholar] [CrossRef]
  3. Vlasova, A.; Capella-Gutiérrez, S.; Rendón-Anaya, M.; Hernández-Oñate, M.; Minoche, A.E.; Erb, I.; Câmara, F.; Prieto-Barja, P.; Corvelo, A.; Sanseverino, W.; et al. Genome and transcriptome analysis of the Mesoamerican common bean and the role of gene duplications in establishing tissue and temporal specialization of genes. Genome Biol. 2016, 17, 32. [Google Scholar] [CrossRef]
  4. Young, N.D.; Bharti, A.K. Genome-enabled insights into legume biology. Annu. Rev. Plant Biol. 2012, 63, 283–305. [Google Scholar] [CrossRef]
  5. Rizzon, C.; Ponger, L.; Gaut, B.S. Striking similarities in the genomic distribution of tandemly arrayed genes in Arabidopsis and rice. PLoS Comput. Biol. 2006, 2, e115. [Google Scholar] [CrossRef]
  6. Tan, S.; Ma, H.; Wang, J.; Wang, M.; Wang, M.; Yin, H.; Zhang, Y.; Zhang, X.; Shen, J.; Wang, D.; et al. DNA transposons mediate duplications via transposition-independent and -dependent mechanisms in metazoans. Nat. Commun. 2021, 12, 4280. [Google Scholar] [CrossRef]
  7. Mc, C.B. The origin and behavior of mutable loci in maize. Proc. Natl. Acad. Sci. USA 1950, 36, 344–355. [Google Scholar] [CrossRef]
  8. Wicker, T.; Sabot, F.; Hua-Van, A.; Bennetzen, J.L.; Capy, P.; Chalhoub, B.; Flavell, A.; Leroy, P.; Morgante, M.; Panaud, O.; et al. A unified classification system for eukaryotic transposable elements. Nat. Rev. Genet. 2007, 8, 973–982. [Google Scholar] [CrossRef]
  9. Tan, S.; Cardoso-Moreira, M.; Shi, W.; Zhang, D.; Huang, J.; Mao, Y.; Jia, H.; Zhang, Y.; Chen, C.; Shao, Y. LTR-mediated retroposition as a mechanism of RNA-based duplication in metazoans. Genome Res. 2016, 26, 1663–1675. [Google Scholar] [CrossRef] [PubMed]
  10. Jiang, N.; Bao, Z.; Zhang, X.; Eddy, S.R.; Wessler, S.R. Pack-MULE transposable elements mediate gene evolution in plants. Nature 2004, 431, 569–573. [Google Scholar] [CrossRef] [PubMed]
  11. Thomas, J.; Phillips, C.D.; Baker, R.J.; Pritham, E.J. Rolling-Circle Transposons Catalyze Genomic Innovation in a Mammalian Lineage. Genome Biol. Evol. 2014, 6, 2595–2610. [Google Scholar] [CrossRef]
  12. Dewannieux, M.; Esnault, C.; Heidmann, T. LINE-mediated retrotransposition of marked Alu sequences. Nat. Genet. 2003, 35, 41–48. [Google Scholar] [CrossRef]
  13. Hong, W.; Wang, M.; Tian, J.; Zhu, X.; Zhang, R.; Guo, C.; Shu, Y. High-Copy SINE Transposons Facilitate Broad Ecological Adaptation in White Clover (Trifolium repens). Horticulturae 2026, 12, 6. [Google Scholar] [CrossRef]
  14. Bailey, J.A.; Liu, G.; Eichler, E.E. An Alu transposition model for the origin and expansion of human segmental duplications. Am. J. Hum. Genet. 2003, 73, 823–834. [Google Scholar] [CrossRef]
  15. Witherspoon, D.J.; Watkins, W.S.; Zhang, Y.; Xing, J.; Tolpinrud, W.L.; Hedges, D.J.; Batzer, M.A.; Jorde, L.B. Alu repeats increase local recombination rates. BMC Genom. 2009, 10, 530. [Google Scholar] [CrossRef] [PubMed]
  16. Sen, S.K.; Han, K.; Wang, J.; Lee, J.; Wang, H.; Callinan, P.A.; Dyer, M.; Cordaux, R.; Liang, P.; Batzer, M.A. Human genomic deletions mediated by recombination between Alu elements. Am. J. Hum. Genet. 2006, 79, 41–53. [Google Scholar] [CrossRef] [PubMed]
  17. Lynch, M.; Conery, J.S. The evolutionary fate and consequences of duplicate genes. Science 2000, 290, 1151–1155. [Google Scholar] [CrossRef] [PubMed]
  18. Innan, H.; Kondrashov, F. The evolution of gene duplications: Classifying and distinguishing between models. Nat. Rev. Genet. 2010, 11, 97–108. [Google Scholar] [CrossRef]
  19. Ohno, S. Evolution by Gene Duplication; Springer Science & Business Media: Berlin, Germany, 2013. [Google Scholar]
  20. Birchler, J.A.; Veitia, R.A. Gene balance hypothesis: Connecting issues of dosage sensitivity across biological disciplines. Proc. Natl. Acad. Sci. USA 2012, 109, 14746–14753. [Google Scholar] [CrossRef]
  21. Birchler, J.A.; Yang, H. The multiple fates of gene duplications: Deletion, hypofunctionalization, subfunctionalization, neofunctionalization, dosage balance constraints, and neutral variation. Plant Cell 2022, 34, 2466–2474. [Google Scholar] [CrossRef]
  22. Hanada, K.; Zou, C.; Lehti-Shiu, M.D.; Shinozaki, K.; Shiu, S.H. Importance of lineage-specific expansion of plant tandem duplicates in the adaptive response to environmental stimuli. Plant Physiol. 2008, 148, 993–1003. [Google Scholar] [CrossRef] [PubMed]
  23. Lin, X.; Feng, C.; Lin, T.; Harris, A.J.; Li, Y.; Kang, M. Jackfruit genome and population genomics provide insights into fruit evolution and domestication history in China. Hortic. Res. 2022, 9, uhac173. [Google Scholar] [CrossRef]
  24. Lin, J.; Zhang, W.; Zhang, X.; Ma, X.; Zhang, S.; Chen, S.; Wang, Y.; Jia, H.; Liao, Z.; Lin, J.; et al. Signatures of selection in recently domesticated macadamia. Nat. Commun. 2022, 13, 242. [Google Scholar] [CrossRef]
  25. Hias, N.; Svara, A.; Keulemans, J.W. Effect of polyploidisation on the response of apple (Malus × domestica Borkh.) to Venturia inaequalis infection. Eur. J. Plant Pathol. 2018, 151, 515–526. [Google Scholar] [CrossRef]
  26. Hannweg, K.; Steyn, W.; Bertling, I. In vitro-induced tetraploids of Plectranthus esculentus are nematode-tolerant and have enhanced nutritional value. Euphytica 2016, 207, 343–351. [Google Scholar] [CrossRef]
  27. Zhang, L.; Wang, L.; Yang, Y.; Cui, J.; Chang, F.; Wang, Y.; Ma, H. Analysis of Arabidopsis floral transcriptome: Detection of new florally expressed genes and expansion of Brassicaceae-specific gene families. Front. Plant Sci. 2014, 5, 802. [Google Scholar] [CrossRef] [PubMed]
  28. Burdon, J.J. Trifolium repens L. J. Ecol. 1983, 71, 307–330. [Google Scholar] [CrossRef]
  29. Ellison, N.W.; Liston, A.; Steiner, J.J.; Williams, W.M.; Taylor, N.L. Molecular phylogenetics of the clover genus (Trifolium—Leguminosae). Mol. Phylogenetics Evol. 2006, 39, 688–705. [Google Scholar] [CrossRef] [PubMed]
  30. Tashiro, R.M.; Bouton, J.H.; Parrott, W.A.J.H. ‘Frosty Morning’,‘Patchwork Quilt’,‘Irish Mist’, and ‘Pistachio Ice Cream’Ornamental White Clover (Trifolium repens L.). HortScience 2009, 44, 1779–1782. [Google Scholar] [CrossRef]
  31. Zhang, H.; Tian, H.; Chen, M.; Xiong, J.; Cai, H.; Liu, Y. Transcriptome analysis reveals potential genes involved in flower pigmentation in a red-flowered mutant of white clover (Trifolium repens L.). Genomics 2018, 110, 191–200. [Google Scholar] [CrossRef]
  32. Williams, W.M.; Ellison, N.W.; Ansari, H.A.; Verry, I.M.; Hussain, S.W. Experimental evidence for the ancestry of allotetraploid Trifolium repens and creation of synthetic forms with value for plant breeding. BMC Plant Biol. 2012, 12, 55. [Google Scholar] [CrossRef]
  33. Ansari, H.A.; Ellison, N.W.; Williams, W.M. Molecular and cytogenetic evidence for an allotetraploid origin of Trifolium dubium (Leguminosae). Chromosoma 2008, 117, 159–167. [Google Scholar] [CrossRef]
  34. Wang, H.; Wu, Y.; He, Y.; Li, G.; Ma, L.; Li, S.; Huang, J.; Yang, G. High-quality chromosome-level de novo assembly of the Trifolium repens. BMC Genom. 2023, 24, 326. [Google Scholar] [CrossRef]
  35. Simão, F.A.; Waterhouse, R.M.; Ioannidis, P.; Kriventseva, E.V.; Zdobnov, E.M. BUSCO: Assessing genome assembly and annotation completeness with single-copy orthologs. Bioinformatics 2015, 31, 3210–3212. [Google Scholar] [CrossRef]
  36. Emms, D.M.; Kelly, S. OrthoFinder: Phylogenetic orthology inference for comparative genomics. Genome Biol. 2019, 20, 238. [Google Scholar] [CrossRef] [PubMed]
  37. Katoh, K.; Standley, D.M. MAFFT Multiple Sequence Alignment Software Version 7: Improvements in Performance and Usability. Mol. Biol. Evol. 2013, 30, 772–780. [Google Scholar] [CrossRef] [PubMed]
  38. Talavera, G.; Castresana, J. Improvement of phylogenies after removing divergent and ambiguously aligned blocks from protein sequence alignments. Syst. Biol. 2007, 56, 564–577. [Google Scholar] [CrossRef] [PubMed]
  39. Shen, W.; Sipos, B.; Zhao, L. SeqKit2: A Swiss army knife for sequence and alignment processing. IMeta 2024, 3, e191. [Google Scholar] [CrossRef]
  40. Darriba, D.; Posada, D.; Kozlov, A.M.; Stamatakis, A.; Morel, B.; Flouri, T. ModelTest-NG: A New and Scalable Tool for the Selection of DNA and Protein Evolutionary Models. Mol. Biol. Evol. 2019, 37, 291–294. [Google Scholar] [CrossRef]
  41. Stamatakis, A. RAxML version 8: A tool for phylogenetic analysis and post-analysis of large phylogenies. Bioinformatics 2014, 30, 1312–1313. [Google Scholar] [CrossRef]
  42. Yang, Z. PAML 4: Phylogenetic Analysis by Maximum Likelihood. Mol. Biol. Evol. 2007, 24, 1586–1591. [Google Scholar] [CrossRef]
  43. Kumar, S.; Suleski, M.; Craig, J.M.; Kasprowicz, A.E.; Sanderford, M.; Li, M.; Stecher, G.; Hedges, S.B. TimeTree 5: An Expanded Resource for Species Divergence Times. Mol. Biol. Evol. 2022, 39, msac174. [Google Scholar] [CrossRef]
  44. Mendes, F.K.; Vanderpool, D.; Fulton, B.; Hahn, M.W. CAFE 5 models variation in evolutionary rates among gene families. Bioinformatics 2020, 36, 5516–5518. [Google Scholar] [CrossRef]
  45. Tarailo-Graovac, M.; Chen, N. Using RepeatMasker to Identify Repetitive Elements in Genomic Sequences. Curr. Protoc. Bioinform. 2009, 25, 4.10.11–14.10.14. [Google Scholar] [CrossRef] [PubMed]
  46. Liao, H.; Sun, Y.; Ou, S. Accelerating de novo SINE annotation in plant and animal genomes. Mob. DNA 2024, 15, 24. [Google Scholar] [CrossRef] [PubMed]
  47. Ou, S.; Su, W.; Liao, Y.; Chougule, K.; Agda, J.R.A.; Hellinga, A.J.; Lugo, C.S.B.; Elliott, T.A.; Ware, D.; Peterson, T.; et al. Benchmarking transposable element annotation methods for creation of a streamlined, comprehensive pipeline. Genome Biol. 2019, 20, 275. [Google Scholar] [CrossRef]
  48. Benjamini, Y.; Hochberg, Y. Controlling the False Discovery Rate: A Practical and Powerful Approach to Multiple Testing. J. R. Stat. Soc. Ser. B (Methodol.) 1995, 57, 289–300. [Google Scholar] [CrossRef]
  49. Camacho, C.; Coulouris, G.; Avagyan, V.; Ma, N.; Papadopoulos, J.; Bealer, K.; Madden, T.L. BLAST+: Architecture and applications. BMC Bioinform. 2009, 10, 421. [Google Scholar] [CrossRef]
  50. Sun, P.; Jiao, B.; Yang, Y.; Shan, L.; Li, T.; Li, X.; Xi, Z.; Wang, X.; Liu, J. WGDI: A user-friendly toolkit for evolutionary analyses of whole-genome duplications and ancestral karyotypes. Mol. Plant 2022, 15, 1841–1851. [Google Scholar] [CrossRef] [PubMed]
  51. Wang, Y.; Tang, H.; Debarry, J.D.; Tan, X.; Li, J.; Wang, X.; Lee, T.H.; Jin, H.; Marler, B.; Guo, H.; et al. MCScanX: A toolkit for detection and evolutionary analysis of gene synteny and collinearity. Nucleic Acids Res. 2012, 40, e49. [Google Scholar] [CrossRef]
  52. Consortium, T.U. UniProt: The Universal Protein Knowledgebase in 2023. Nucleic Acids Res. 2022, 51, D523–D531. [Google Scholar] [CrossRef]
  53. Supek, F.; Bošnjak, M.; Škunca, N.; Šmuc, T. REVIGO summarizes and visualizes long lists of gene ontology terms. PLoS ONE 2011, 6, e21800. [Google Scholar] [CrossRef] [PubMed]
  54. Li, M.; Zhang, X.; Zhang, T.; Bai, Y.; Chen, C.; Guo, D.; Guo, C.; Shu, Y. Genome-wide analysis of the WRKY genes and their important roles during cold stress in white clover. PeerJ 2023, 11, e15610. [Google Scholar] [CrossRef]
  55. Wu, F.; Fan, J.; Ye, X.; Yang, L.; Hu, R.; Ma, J.; Ma, S.; Li, D.; Zhou, J.; Nie, G.; et al. Unraveling Cadmium Toxicity in Trifolium repens L. Seedling: Insight into Regulatory Mechanisms Using Comparative Transcriptomics Combined with Physiological Analyses. Int. J. Mol. Sci. 2022, 23, 4612. [Google Scholar] [CrossRef]
  56. Kuo, W.-H.; Wright, S.J.; Small, L.L.; Olsen, K.M. De novo genome assembly of white clover (Trifolium repens L.) reveals the role of copy number variation in rapid environmental adaptation. BMC Biol. 2024, 22, 165. [Google Scholar] [CrossRef]
  57. Bhachu, K.; Santangelo, J.S.; Johnson, M.T.J.; Fadul, H.E. Tissue-specific expression of HCN and its metabolic precursors in Trifolium repens. Botany 2024, 102, 470–477. [Google Scholar] [CrossRef]
  58. Pertea, G.; Pertea, M. GFF Utilities: GffRead and GffCompare. F1000Research 2020, 9, 304. [Google Scholar] [CrossRef]
  59. Patro, R.; Duggal, G.; Love, M.I.; Irizarry, R.A.; Kingsford, C. Salmon provides fast and bias-aware quantification of transcript expression. Nat. Methods 2017, 14, 417–419. [Google Scholar] [CrossRef] [PubMed]
  60. Soneson, C.; Love, M.I.; Robinson, M.D. Differential analyses for RNA-seq: Transcript-level estimates improve gene-level inferences. F1000Research 2015, 4, 1521. [Google Scholar] [CrossRef] [PubMed]
  61. Love, M.I.; Huber, W.; Anders, S. Moderated estimation of fold change and dispersion for RNA-seq data with DESeq2. Genome Biol. 2014, 15, 550. [Google Scholar] [CrossRef]
  62. Ren, R.; Wang, H.; Guo, C.; Zhang, N.; Zeng, L.; Chen, Y.; Ma, H.; Qi, J. Widespread Whole Genome Duplications Contribute to Genome Complexity and Species Diversity in Angiosperms. Mol. Plant 2018, 11, 414–428. [Google Scholar] [CrossRef]
  63. Xu, W.; Zhang, Q.; Yuan, W.; Xu, F.; Muhammad Aslam, M.; Miao, R.; Li, Y.; Wang, Q.; Li, X.; Zhang, X.; et al. The genome evolution and low-phosphorus adaptation in white lupin. Nat. Commun. 2020, 11, 1069. [Google Scholar] [CrossRef]
  64. Yin, G.; Xu, H.; Xiao, S.; Qin, Y.; Li, Y.; Yan, Y.; Hu, Y. The large soybean (Glycine max) WRKY TF family expanded by segmental duplication events and subsequent divergent selection among subgroups. BMC Plant Biol. 2013, 13, 148. [Google Scholar] [CrossRef]
  65. Lewis, E.B. Pseudoallelism and gene evolution. Cold Spring Harb. Symp. Quant. Biol. 1951, 16, 159–174. [Google Scholar] [CrossRef]
  66. Hardison, R.C. Evolution of hemoglobin and its genes. Cold Spring Harb. Perspect. Med. 2012, 2, a011627. [Google Scholar] [CrossRef] [PubMed]
  67. Birchler, J.A.; Bhadra, U.; Bhadra, M.P.; Auger, D.L. Dosage-dependent gene regulation in multicellular eukaryotes: Implications for dosage compensation, aneuploid syndromes, and quantitative traits. Dev. Biol. 2001, 234, 275–288. [Google Scholar] [CrossRef] [PubMed]
  68. Janoušek, V.; Laukaitis, C.M.; Yanchukov, A.; Karn, R.C. The Role of Retrotransposons in Gene Family Expansions in the Human and Mouse Genomes. Genome Biol. Evol. 2016, 8, 2632–2650. [Google Scholar] [CrossRef]
  69. Cheng, Q.; Dong, S.; Guo, L.; Jiang, S.; Yin, N.; Sun, D.; Cheng, F.; Yu, C.; Wan, Z. Intronic transposon insertion within the MYB transcription factor gene BjPur disturbs anthocyanin accumulation by inducing epigenetic modification in Brassica juncea. New Phytol. 2026, 249, 325–341. [Google Scholar] [CrossRef] [PubMed]
  70. Negi, P.; Rai, A.N.; Suprasanna, P. Moving through the stressed genome: Emerging regulatory roles for transposons in plant stress response. Front. Plant Sci. 2016, 7, 1448. [Google Scholar] [CrossRef]
  71. Li, Q.; Zhang, Y.; Zhang, Z.; Li, X.; Yao, D.; Wang, Y.; Ouyang, X.; Li, Y.; Song, W.; Xiao, Y. A D-genome-originated Ty1/Copia-type retrotransposon family expanded significantly in tetraploid cottons. Mol. Genet. Genom. 2018, 293, 33–43. [Google Scholar] [CrossRef]
  72. Han, G.; Zhang, N.; Jiang, H.; Meng, X.; Qian, K.; Zheng, Y.; Xu, J.; Wang, J. Diversity of short interspersed nuclear elements (SINEs) in lepidopteran insects and evidence of horizontal SINE transfer between baculovirus and lepidopteran hosts. BMC Genom. 2021, 22, 226. [Google Scholar] [CrossRef]
  73. Fawcett, J.A.; Innan, H. High Similarity between Distantly Related Species of a Plant SINE Family Is Consistent with a Scenario of Vertical Transmission without Horizontal Transfers. Mol. Biol. Evol. 2016, 33, 2593–2604. [Google Scholar] [CrossRef]
  74. Pickeral, O.K.; Makałowski, W.; Boguski, M.S.; Boeke, J.D. Frequent human genomic DNA transduction driven by LINE-1 retrotransposition. Genome Res. 2000, 10, 411–415. [Google Scholar] [CrossRef]
  75. Kim, S.; Choi, D. New role of LTR-retrotransposons for emergence and expansion of disease-resistance genes and high-copy gene families in plants. BMB Rep. 2018, 51, 55–56. [Google Scholar] [CrossRef]
  76. Holligan, D.; Zhang, X.; Jiang, N.; Pritham, E.J.; Wessler, S.R.J.G. The transposable element landscape of the model legume Lotus japonicus. Genetics 2006, 174, 2215–2228. [Google Scholar] [CrossRef]
  77. Ferguson, A.A.; Zhao, D.; Jiang, N. Selective Acquisition and Retention of Genomic Sequences by Pack-Mutator-Like Elements Based on Guanine-Cytosine Content and the Breadth of Expression. Plant Physiol. 2013, 163, 1419–1432. [Google Scholar] [CrossRef] [PubMed]
  78. Rogers, L.W.; Koehler, A.M.; Crouch, J.A.; Cubeta, M.A.; LeBlanc, N.R. Comparative genomic analysis reveals contraction of gene families with putative roles in pathogenesis in the fungal boxwood pathogens Calonectria henricotiae and C. pseudonaviculata. BMC Ecol. Evol. 2022, 22, 79. [Google Scholar] [CrossRef]
  79. Wang, N.; Yang, Y.; Moore, M.J.; Brockington, S.F.; Walker, J.F.; Brown, J.W.; Liang, B.; Feng, T.; Edwards, C.; Mikenas, J.; et al. Evolution of Portulacineae Marked by Gene Tree Conflict and Gene Family Expansion Associated with Adaptation to Harsh Environments. Mol. Biol. Evol. 2019, 36, 112–126. [Google Scholar] [CrossRef] [PubMed]
  80. Hernandez, D.J.; Pohlmann, G.B.; Afkhami, M.E. Gene Family Expansions Provide Molecular Flexibility Required for Context-Dependent Species Interactions. Ecol. Lett. 2025, 28, e70213. [Google Scholar] [CrossRef]
  81. Zhang, G.Y.; Feng, J.; Wu, J.; Wang, X.W. BoPMEI1, a pollen-specific pectin methylesterase inhibitor, has an essential role in pollen tube growth. Planta 2010, 231, 1323–1334. [Google Scholar] [CrossRef] [PubMed]
  82. Zhou, L.; Zawaira, A.; Lu, Q.; Yang, B.; Li, J. Transcriptome analysis reveals defense-related genes and pathways during dodder (Cuscuta australis) parasitism on white clover (Trifolium repens). Front. Genet. 2023, 14, 1106936. [Google Scholar] [CrossRef] [PubMed]
  83. Li, Z.; Geng, W.; Tan, M.; Ling, Y.; Zhang, Y.; Zhang, L.; Peng, Y. Differential Responses to Salt Stress in Four White Clover Genotypes Associated With Root Growth, Endogenous Polyamines Metabolism, and Sodium/Potassium Accumulation and Transport. Front. Plant Sci. 2022, 13, 896436. [Google Scholar] [CrossRef] [PubMed]
  84. Hendrickson, B.T.; Stamps, C.; Patterson, C.M.; Strickland, H.; Foster, M.; Albano, L.J.; Kim, A.Y.; Kim, P.Y.; Kooyers, N.J. Evolution of drought resistance strategies following the introduction of white clover (Trifolium repens L.). Ann. Bot. 2025, 135, 1377–1392. [Google Scholar] [CrossRef] [PubMed]
  85. Oleńska, E.; Małek, W.; Sujkowska-Rybkowska, M.; Szopa, S.; Włostowski, T.; Aleksandrowicz, O.; Swiecicka, I.; Wójcik, M.; Thijs, S.; Vangronsveld, J. An Alliance of Trifolium repens-Rhizobium leguminosarum bv. trifolii-Mycorrhizal Fungi From an Old Zn-Pb-Cd Rich Waste Heap as a Promising Tripartite System for Phytostabilization of Metal Polluted Soils. Front. Microbiol. 2022, 13, 853407. [Google Scholar] [CrossRef] [PubMed]
Figure 1. Gene family expansion and contraction dynamics across 12 legume species. Red bars represent the number of contracted gene families, and blue bars represent the number of expanded gene families. Species names highlighted in red indicate those that have experienced lineage-specific genome duplication.
Horticulturae 12 00531 g001
Figure 2. Ks density distribution across 12 legume species. Solid lines represent species with lineage-specific genome duplication, whereas dashed lines represent species without lineage-specific genome duplication.
Horticulturae 12 00531 g002
Figure 3. Transposable element landscape in 12 legume genomes. The y-axis represents the percentage of each component in the genome, and the x-axis lists the species names. Non-TE sequences are shown in teal, while other colors represent different classes of transposable elements.
Horticulturae 12 00531 g003
Figure 4. Correlation between log10-transformed SINE copy number and the proportions of significantly expanded/contracted genes in 12 legume species. (a) SINE copy number vs. proportion of significantly expanded genes. (b) SINE copy number vs. proportion of significantly contracted genes. The x-axis represents log10-transformed SINE copy number, and the y-axis represents the proportion of significantly expanded or contracted genes (%). Each point represents a legume species. The blue line indicates the linear regression fit, with the shaded area representing the 95% confidence interval.
Horticulturae 12 00531 g004
Figure 5. Gene Ontology (GO) enrichment bubble plots of contracted and expanded gene families in Trifolium repens. (a) GO enrichment of contracted gene families in Trifolium repens. (b) GO enrichment of expanded gene families in Trifolium repens. The X axis represents the negative logarithm of the p value (−log10 P), reflecting the statistical significance of enrichment (a larger absolute value indicates stronger significance). The Y axis lists the top enriched GO terms, which are categorized into Biological Process (BP), Cellular Component (CC), and Molecular Function (MF). The size of each bubble corresponds to the number of genes associated with each GO term.
Horticulturae 12 00531 g005
Figure 6. Volcano plots of differentially expressed genes from significantly expanded gene families. (a) Flower vs. leaf. (b) Flower vs. root. (c) Drought stress vs. control. (d) Cold stress vs. control. (e) Cadmium stress vs. control. Red: upregulated (log2 FC ≥ 1, FDR < 0.05); blue: downregulated (log2 FC ≤ −1, FDR < 0.05); gray: not significant. X-axis: log2 FC; Y-axis: −log10 (p-value).
Horticulturae 12 00531 g006
Figure 7. Stress-responsive expression of enriched GO terms in significantly expanded genes of Trifolium repens. The heatmap displays four enriched GO terms: GO:0006979, GO:0004601, GO:0016614, and GO:0042545. The x-axis represents log2 FC ranges (stress vs. control), and the y-axis represents GO terms. Color intensity indicates the number of genes within each expression bin, with blue representing cold stress, green representing drought stress, and orange representing cadmium stress. Numbers within each cell indicate the raw gene count.
Horticulturae 12 00531 g007
Table 1. Duplication modes of genes in expanded gene families of Trifolium repens.
Duplication TypeNumber of GenesPercentage (%)
WGD/segmental619252.3
Dispersed316626.7
Tandem132111.1
Proximal11679.9
Total11,846100
Table 2. SINE insertion proportions in genes with different evolutionary patterns and background genes.
Gene CategoryTotal GenesWith SINE InsertionWithout SINE InsertionSINE Insertion (%)FDROdds Ratio
Expanded genes11,8675307656044.720.0451.04
Contracted genes30315914452.480.00751.42
Background genes90,12839,43150,69743.75
Table 3. Differential expression profiles of genes within significantly expanded gene families in diverse tissues and abiotic stresses.
ComparisonsNumber of
Upregulated Genes
Number of
Down Genes
Mean log2 Fold Change
Tissue: Flower vs. Root8386261.82
Tissue: Flower vs. Leaf9905623.00
Stress: Cold vs. Control4463950.50
Stress: Drought vs. Control1571200.67
Stress: Cadmium vs. Control4353280.30
Disclaimer/Publisher’s Note: The statements, opinions and data contained in all publications are solely those of the individual author(s) and contributor(s) and not of MDPI and/or the editor(s). MDPI and/or the editor(s) disclaim responsibility for any injury to people or property resulting from any ideas, methods, instructions or products referred to in the content.