Article

Agroforestry Hedgerows Influence Tomato Fruit Quality Traits Including Soluble Solids, Acidity, and Antioxidant Profiles


1
Department of Agroecology and Organic Farming, Institute of Rural Development and Sustainable Production, Hungarian University of Agriculture and Life Sciences, Villányi út 29-43, H-1118 Budapest, Hungary
2
Horticultural Research Center, Agriculture Research Corporation (ARC), Wad Madani P.O. Box 126, Sudan
3
Department of Applied Statistics, Institute of Mathematics and Basic Sciences, Hungarian University of Agriculture and Life Sciences, Villányi út 29-43, H-1118 Budapest, Hungary
4
Department of Fruit and Vegetable Processing Technology, Institute of Food Science and Technology, Hungarian University of Agriculture and Life Sciences, Villányi Street 29-43, H-1118 Budapest, Hungary
5
Department of Fruit Growing, Institute of Horticulture, Hungarian University of Agriculture and Life Sciences, Villányi út 29-43, H-1118 Budapest, Hungary
6
Institute of Viticulture and Enology, Faculty of Natural Sciences, Eszterházy Károly Catholic University, Leányka út 12, H-3300 Eger, Hungary
*
Author to whom correspondence should be addressed.
Horticulturae 2026, 12(5), 516; https://doi.org/10.3390/horticulturae12050516
Submission received: 3 March 2026 / Revised: 20 April 2026 / Accepted: 20 April 2026 / Published: 23 April 2026
(This article belongs to the Section Vegetable Production Systems)

Abstract

The field production of tomato faces challenges regarding abiotic stress factors, which unfavorably impact fruit quality traits. Hedgerows, a form of agroforestry, offer a climate-resilient strategy to buffer temperatures and reduce the impact of direct wind stress on crop production. This study assessed the impact of hedgerow microclimate modulation effects on open-field tomato fruit quality, employing three genotypes (Roma, Ace55, and Szentlőrinckáta). Key quality traits (Total Soluble Solids (TSS), Titratable Acidity (TA), Sugar–Acid Ratio (SAR), Ferric-Reducing Antioxidant Power (FRAP), Total Phenolic Content (TPC), Chroma (C*), and Hue (ho)) were measured over two harvests per season, in two consecutive years (2023–2024). Plots were positioned at five distances (3, 6, 9, 12, and 15 m from the hedge) on both windy and protected sides (W1–W5 and P1–P5, respectively, with 1 showing the closest position). We observed that the microclimate of the protected side was consistently warmer, with an average deviation from the reference temperature of +3.54 °C at mid-distances and +0.38 °C higher overall across both growing seasons. Results show that mid-distance zones (P3–P4, W3–W4) consistently exhibited the highest C* (up to 39.44) at W4 and TSS values at W1 (7.00 °Bx). Protected sides favored higher TA at P3 (0.70%) and Hue (ho) values at P3 with (53.06 ± 0.30) with Ace55 and SAR at P3 (16.35) with Szentlőrinckáta. Windy sides significantly enhanced FRAP and TPC, with the Szentlőrinckáta genotype exhibiting the highest antioxidant capacity at W1 (23.67 mg AAE 100 g−1, FRAP) and TPC (244.17 mg GAE 100 g−1). At W4, Roma showed a 9.4% increase in TPC in the second harvest, while Ace55 showed the highest FRAP values during late-season sampling, highlighting genotype-specific antioxidant resilience under contrasting microclimates. These findings suggest that mid-distance zones and microclimatic variation between windy and protected sides remarkably influence fruit quality traits and antioxidant profiles.

1. Introduction

Tomato (Solanum lycopersicum L.) is one of the most widely cultivated vegetables worldwide, accounting for approximately 16% of global production [1]. Its fruits are consumed fresh or processed as juice, soup, paste, puree, ketchup, and sauce [2,3,4]. Tomato fruits have an outstanding nutritional profile; they are a good source of potassium, phenolic compounds, flavonoids, vitamins, minerals, and glycoalkaloids, as well as antioxidants such as carotenoids (mainly lycopene and β-carotene). Tomatoes contain significant levels of total flavanols, such as kaempferol and quercetin, and exhibit higher antioxidant activity in humans [5]. They also include key flavor compounds such as glucose, fructose, sucrose, citric acid, and malic acid, which are used to calculate the Sugar–Acid Ratio (SAR) to assess fruit quality [6]. However, a decline in crop nutritional quality due to climate change, among other factors [7,8], negatively impacts tomato growth, resulting in harvest losses of up to 70%. Although increased CO2 levels enhance yield, they may decrease fruit quality by reducing phenol, flavonoid, and carotenoid content [9,10]. Agroforestry systems can help restore resilience by improving microclimates and protecting crops naturally [11,12].
Antioxidants play a vital role in neutralizing reactive oxygen species generated during ripening, extreme temperature conditions, and radiation exposure. Total carotenoid levels increase with ripening, while ascorbic acid and certain phenolic compounds accumulate from the green stage to the mid-ripe phase [13,14]. However, earlier research has shown that total antioxidant capacity (TAC) is determined by multiple factors, including the stage of fruit ripening, cultivation practices such as water availability and mineral nutrition, and environmental conditions, particularly light intensity and temperature [15,16,17]. Furthermore, studies have shown that the phenolic profile of tomatoes, and consequently their nutritional value, can be significantly affected by genetic factors and agronomic practices, including fertilization and crop protection strategies [2,18]. Novel management techniques to improve open-field tomato production and enhance fruit quality and resilience to biotic and abiotic challenges could enhance global food and nutritional security, given the significance of the tomato crop [19,20,21].
Hedgerows, a form of agroforestry, involve the planting of trees, shrubs, forbs, and grasses to enhance the sustainability of agricultural systems [22,23,24]. Agroforestry is recognized for its potential to mitigate unfavorable environmental factors in agricultural production. Trees are integrated into field-based agriculture, especially in harsh climates and light soils. They are planted sporadically to minimize soil erosion, provide shading, and enhance productivity, and are often used as hedgerows or farm boundaries [23,25,26]. However, hedgerow structure plays a vital role in shaping microclimatic conditions and supporting biodiversity; taller and wider hedges offer improved temperature buffering, reduced direct light effects, and enhanced ecological resilience under changing climate conditions [27,28]. Agroforestry systems mimic natural ecosystems, providing shade for crops, reducing water stress, and preventing soil erosion [29,30,31]. Low light intensity in tomato plants, on the other hand, disrupts physiological metabolism, reducing photosynthesis and carbohydrate synthesis, leading to lower growth rates and productivity [1,29] and resulting in significant variation in growth, yield, and fruit quality [32,33]. Compared to monoculture farming, agroforestry systems incorporating hedgerows are more sustainable and resilient, as they leverage natural processes for soil fertility, pest control, and overall crop health [34]. In such systems, tomato crops provide both income and phytonutrient supply, while trees offer benefits such as shade and wind protection.
Environmental stress, including suboptimal temperature, light, salinity, and water availability, significantly influences tomato fruit quality traits such as Total Phenolic Content (TPC), Total Soluble Solids (TSS), and antioxidant capacity. High temperatures may increase TSS but often reduce TPC, antioxidant capacity, and yield when heat stress is severe. Light intensity generally enhances TPC and antioxidant capacity, while low light reduces metabolite levels and sweetness. Salinity stress can increase TSS, TPC, and antioxidant capacity but decreases fruit size and overall yield. Limited soil moisture may raise TSS and antioxidant-related metabolites, yet prolonged drought strongly reduces yield [35,36] while also reducing pest pressure through enhanced beneficial insects and potentially improving fruit nutritional quality under organic conditions [11,35]. Moreover, color-related parameters, particularly the a*/b* ratio and lycopene content, remain closely associated with fruit maturity and serve as reliable indicators of ripening stages [1,36]. Tomato quality attributes are strongly influenced by planting distance, with wider spacing often associated with improved fruit quality [37]. Furthermore, environmental conditions influence fruit quality by shaping primary metabolite production, distribution, osmotic and turgor regulation, and antioxidant metabolism. These effects vary depending on genotype, environmental intensity and duration, developmental and physiological stages, and the interplay of multiple factors [38]. However, both the nutritional value and overall productivity of tomato crops are profoundly affected by local microclimatic conditions [39]. Although hedgerows are increasingly promoted for their ecological functions, their potential role in shaping crop microclimates and thereby influencing consumer-relevant fruit quality traits remains largely unexplored in organic tomato production systems. Additionally, the extent of microclimate modulation with distance from the hedge has not yet been precisely defined, especially for tomato nutritional quality traits. Therefore, this study aims to investigate how hedgerow-induced modulation of the microclimate influences tomato fruit quality, based on the physiological hypothesis that hedgerows modify key environmental factors (light, temperature, humidity, and wind), thereby regulating plant stress responses, photosynthesis, and the synthesis of quality-related metabolites. The study focused on parameters valued by consumers, including the sweetness–acidity balance, nutritional composition, antioxidant capacity, and color traits (TSS, TA, SAR, TPC, FRAP, Chroma (C*), and Hue ()). The analysis was performed on different tomato genotypes cultivated in an organically managed open-field system, with comparisons between the windy and protected sides of the hedgerow.

2. Materials and Methods

2.1. Study Area and Microclimatic Conditions

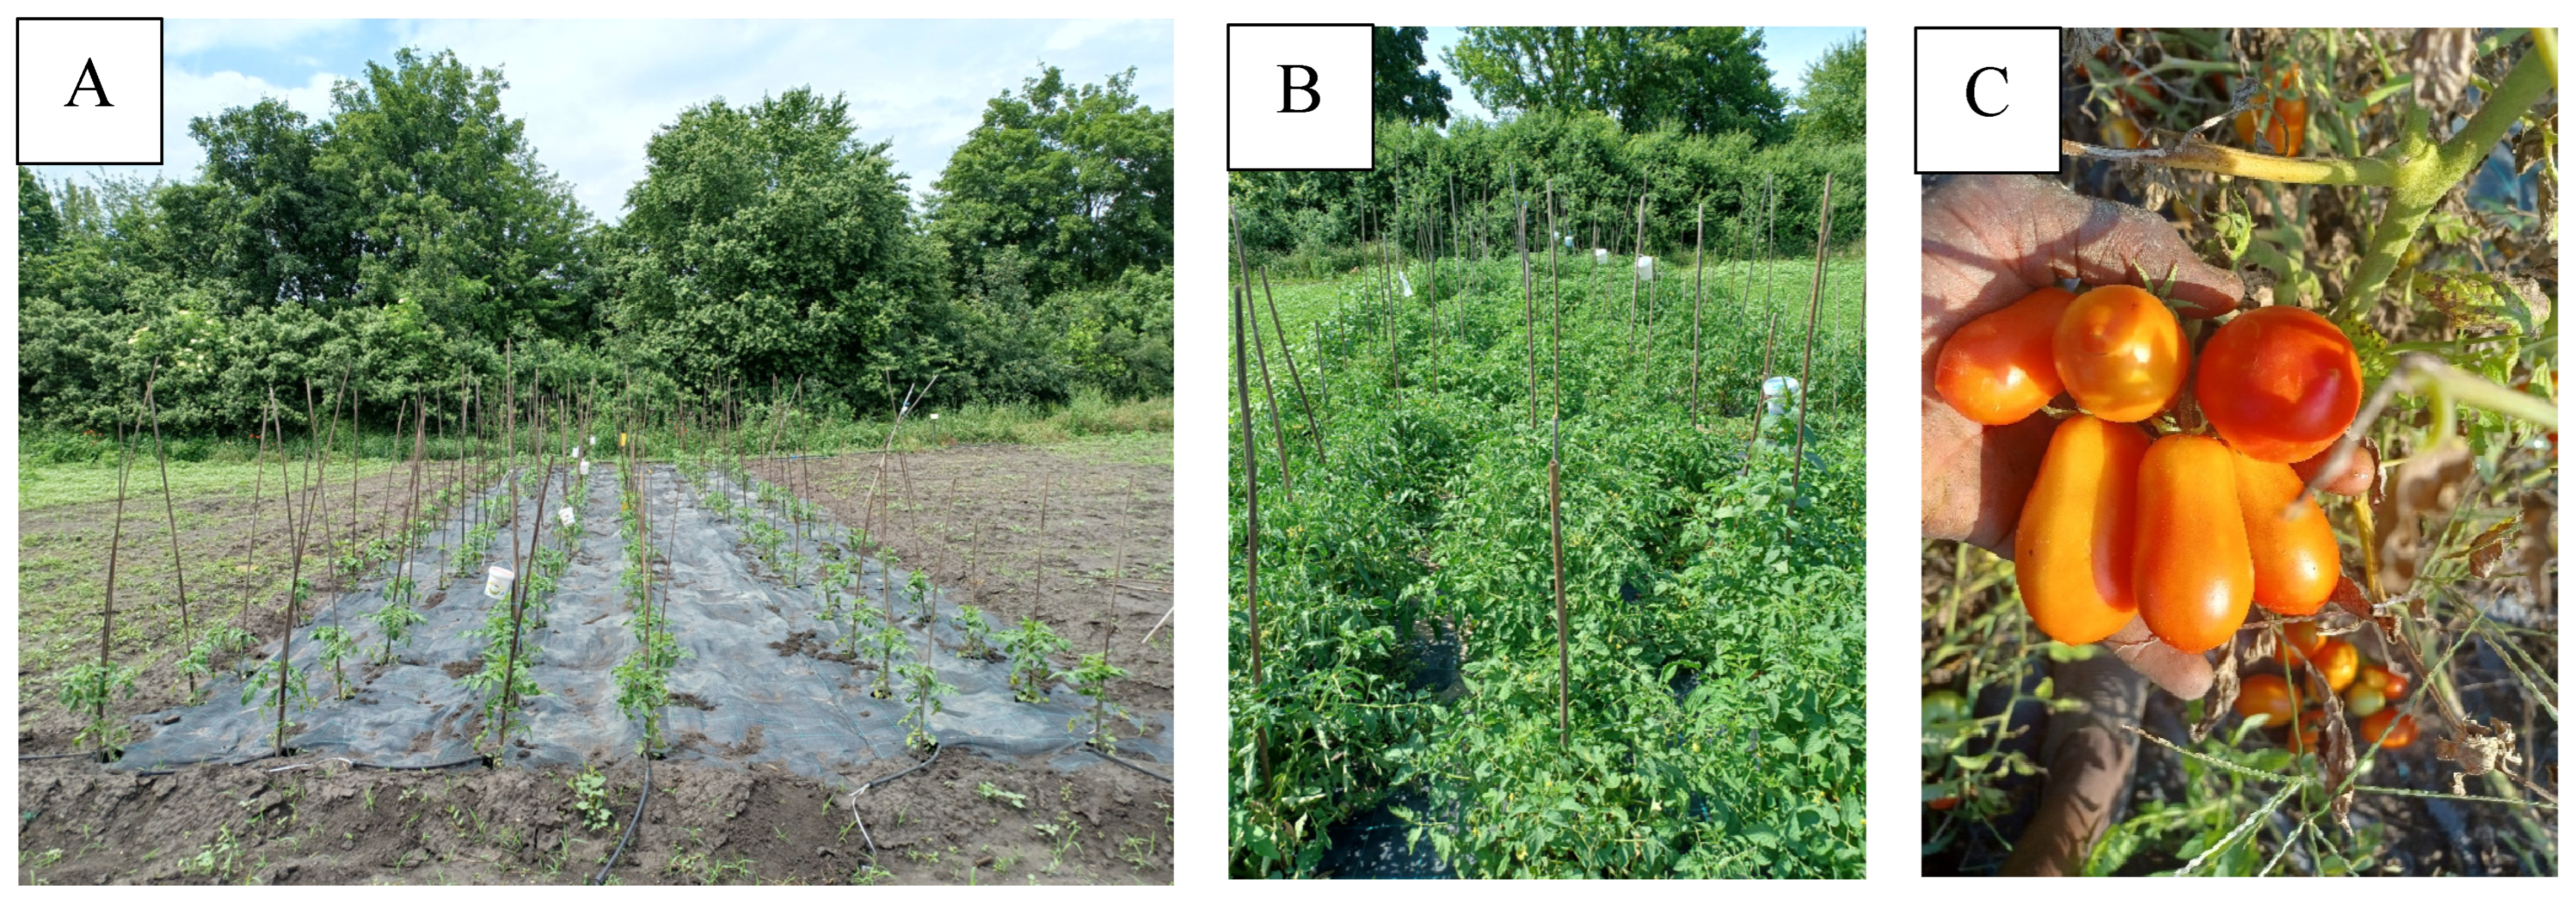
The experiment was conducted over two consecutive years (2023–2024) at the Soroksár Experimental and Research Station of the Hungarian University of Agriculture and Life Sciences (47.392897° N, 19.148496° E, 150 m above sea level), specifically at a certified organic unit, where no chemical inputs or pesticides had been used for over 20 years. The field is located in the capital’s suburban region, where extensive forage production and research activities are conducted each year. The experimental setup aimed to investigate the ability of a hedgerow system to mitigate the effects of climate extremes, with five distances from the hedge (W1–W5 = windy; P1–P5 = protected position). Weather data (temperature and humidity (not reported)) were collected using Voltcraft DL-121TH and DL-210TH data logger instruments (Voltcraft, Conrad Electronic SE, Hirschau, Germany) to assess microclimatic differences (Figure 1). Loggers were positioned in the middle of each distance block, on both sides, while one logger was installed within the hedge.
The hedgerow, in a Northeast–Southwest position, is considered narrow with an average width of 5 m and a height of 5 m. The soil type is sandy loam with a relatively low humus content. The hedge is composed of a diverse mix of native species, creating a closed plantation (1.5 m × 1.5 m in three rows), including Blackthorn (Prunus spinosa L.), Elderberry (Sambucus nigra L.), Common Hazel (Corylus avellana L.), Dog Rose (Rosa canina L.), Wild Privet (Ligustrum vulgare L.), Cornelian Cherry (Cornus mas L.), Common Dogwood (Cornus sanguinea L.), Spindle (Euonymus europaeus L.), Common Hawthorn (Crataegus monogyna Jacq.), Field Maple (Acer campestre L.), European Crab Apple (Malus sylvestris (L.) Mill.), and European Wild Pear (Pyrus pyraster (L.) Burgsd) [34].

2.2. Plant Material and Experimental Design

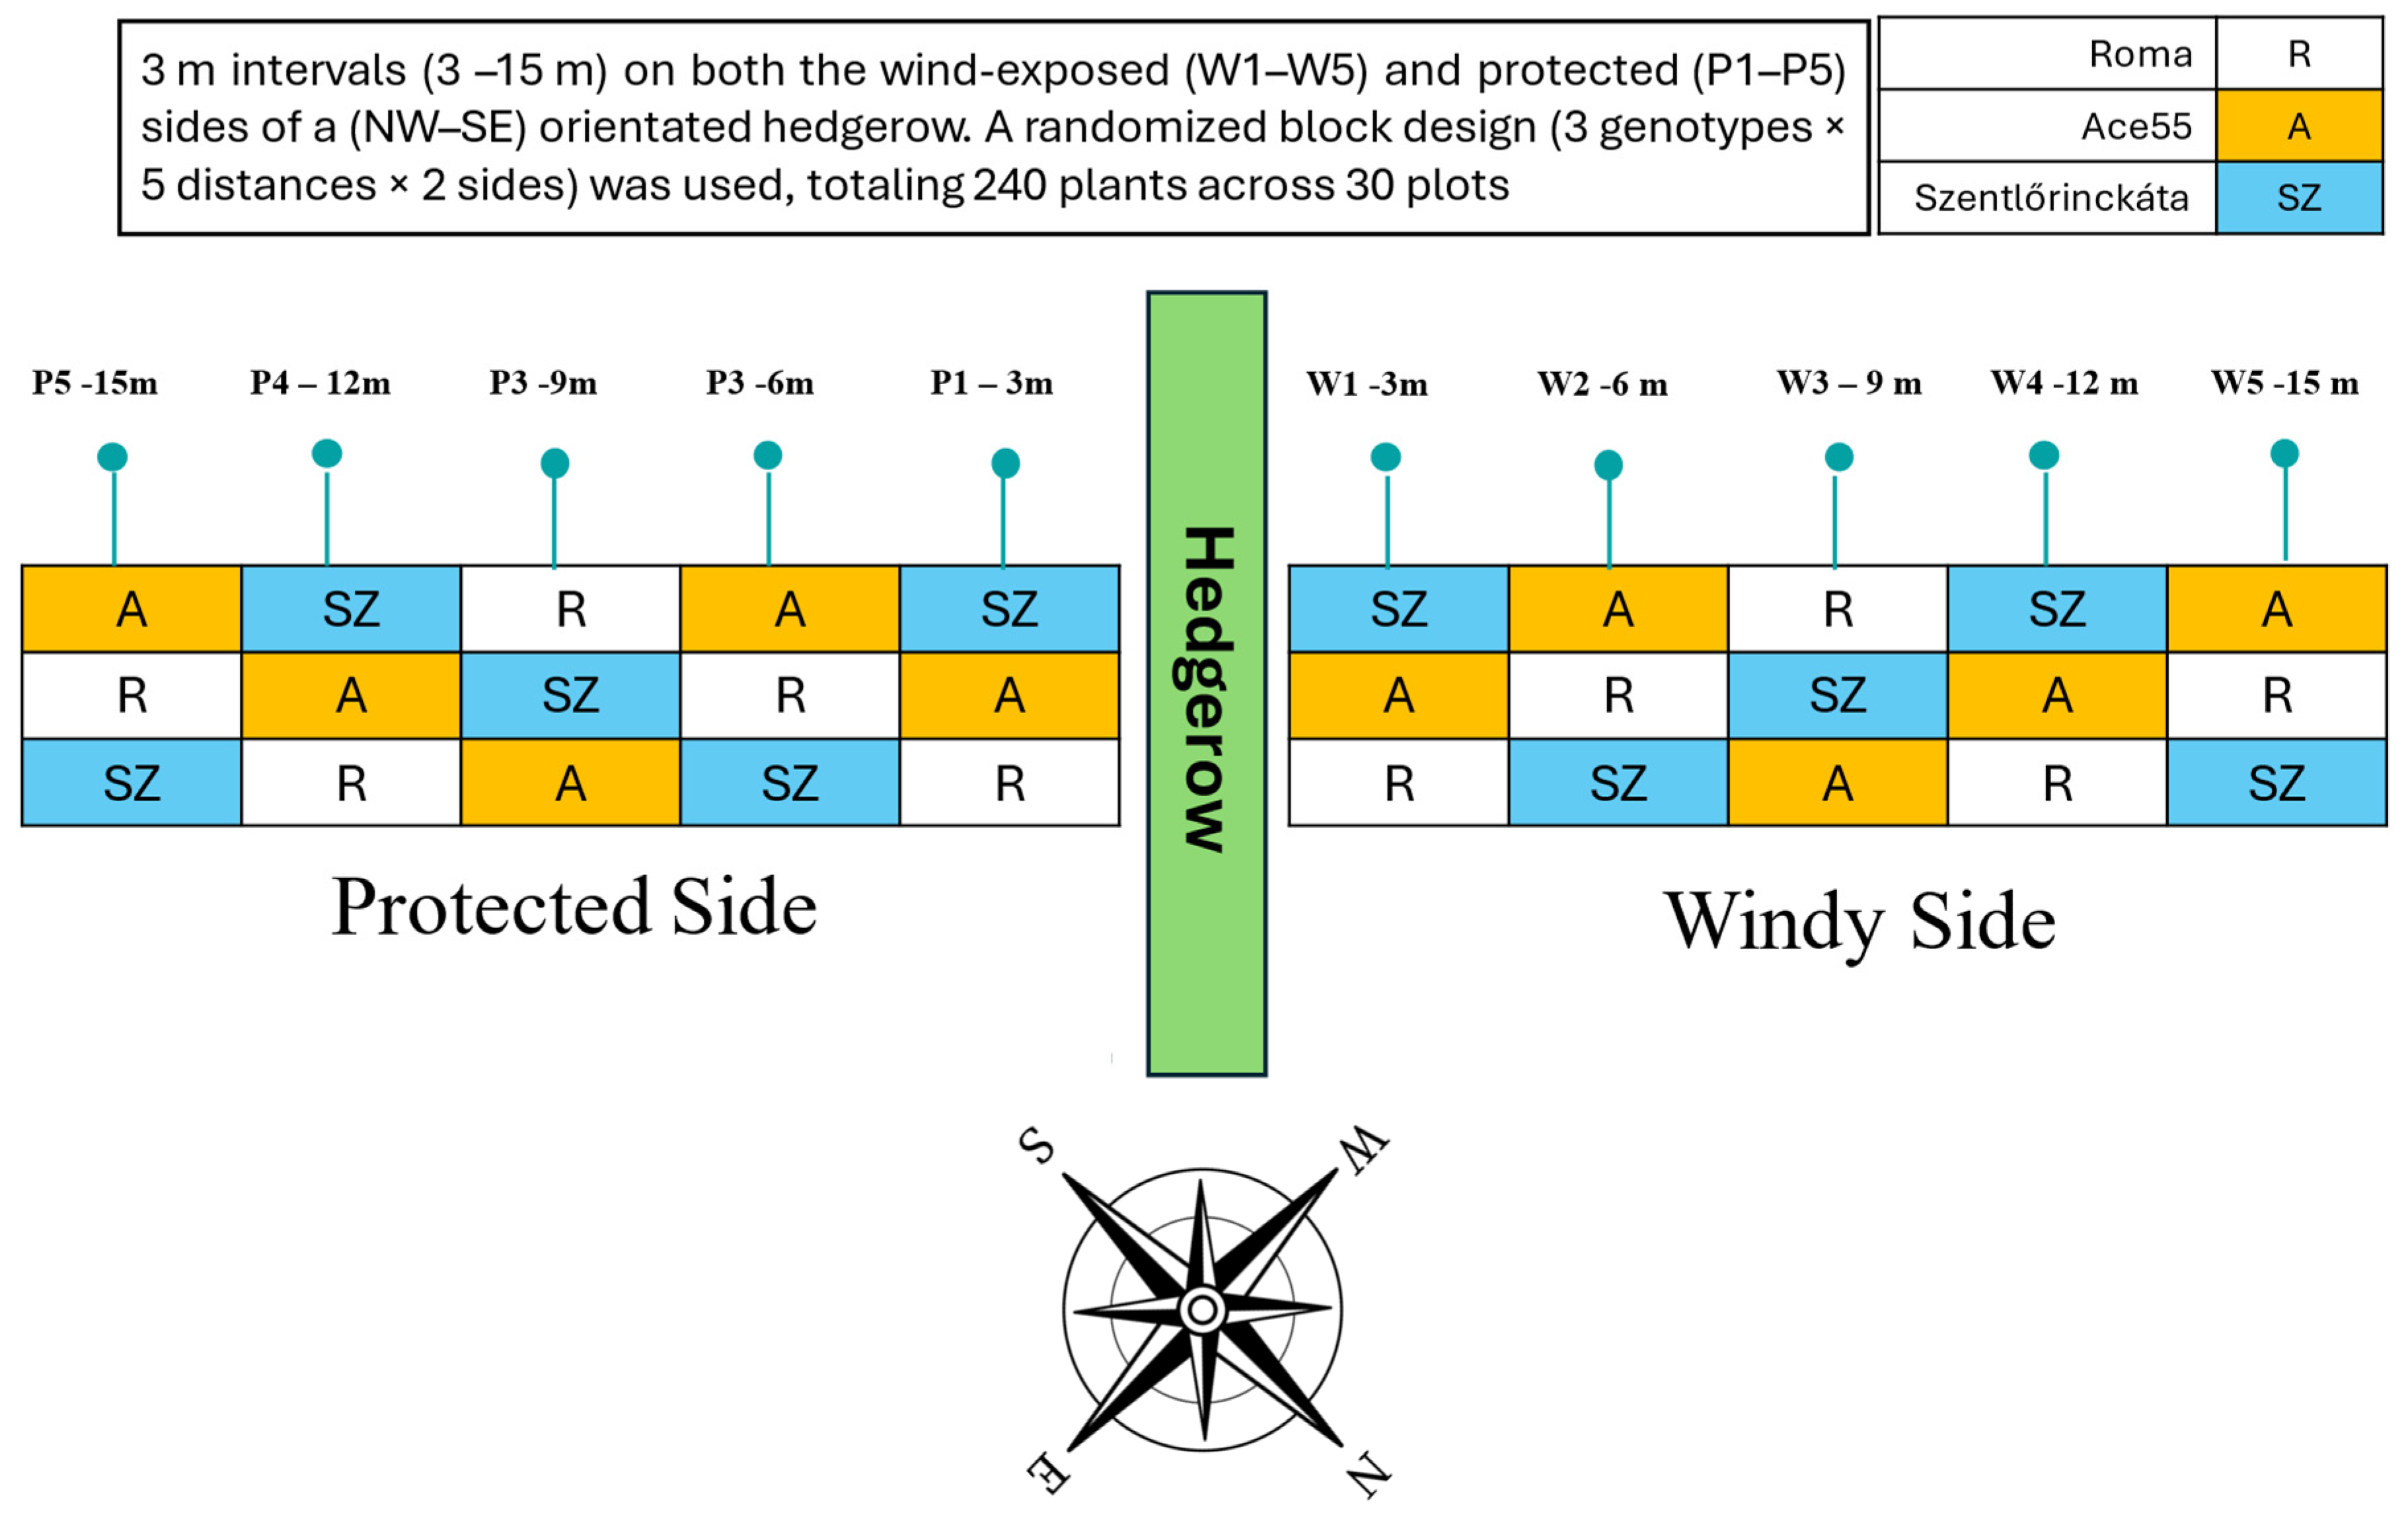
The experiment involved three tomato genotypes: two international varieties (Ace55, Roma) and Szentlőrinckáta (RCAT078726), a Hungarian tomato landrace named after its place of origin [40]. The propagation material of the landrace was provided by the Center for National Biodiversity and Gene Preservation (Nemzeti Biodiverzitás- és Génmegőrzési Központ NBGK), Tápiószele, Hungary, as described in Table 1. The seeds were sown each season in early April at the glasshouse at the Hungarian University of Agriculture and Life Sciences, Buda Campus, followed by direct planting in open-field conditions in early May. The experimental blocks were oriented Northwest–Southeast (NE–SW), designed to reduce wind speed and enhance microclimatic conditions (Figure 2). The plots were placed at varying distances from the hedge. The windy side (W) of the hedgerow experiences direct exposure to prevailing winds characteristic in Hungary [41], while the protected side (P) benefits from milder wind intensity, with reduced speed by 10–15% [42]. Plots were placed at three-meter intervals from the hedge, as shown in Figure 2. P1 and W1 were the closest to the hedgerows, while P5 and W5 were the farthest ones. The design was a random block design (RBD) with five replicates of three genotypes on both sides (windy and protected), resulting in 2 × 15 plots. Each plot had 8 plants in two rows, 120 plants on each side, and 240 plants on both sides of the hedgerow strip with a 45 × 60 cm row and plant distance arrangement. Drip irrigation was applied during the vegetation period, and organic fertilization was applied at transplanting in May using TRIBÚ organic fertilizer (65% organic matter derived from natural pelleted manure), with manual weed control and reasonable organic pest and disease management under certified organic conditions.

2.3. Sample Preparation

For each of the two harvests per season, approximately five to six fruits from each plot, corresponding to 1.5–2 kg of fully mature, intact tomato fruits free from any visible signs of infection, were collected at each sampling distance (W1–W5 and P1–P5) relative to the hedgerow, with samples collected separately for each of the three varieties. After washing, samples were randomly chopped into pieces using the toss-and-chop method to ensure representative tissue homogenization for analysis. The fruit pieces were then processed into puree and pomace using a laboratory homogenizer (Model H-16, LABOAO, Zhengzhou, China). A total of approximately 45 mL of homogenate for each variety × year × harvest × side × distance combination was placed into centrifuge tubes and frozen at −18 °C until undergoing further measurements.

2.4. Determination of Fruit Color Using the CIELCH (L*C*h°) Scale

Fruit color was measured using a Konica Minolta CR-410 tristimulus colorimeter (Konica-Minolta Business Solutions Ltd., Osaka, Japan) under standardized conditions with a D65 daylight illuminant and an 8 mm 0°/diffuse measurement geometry. Measurements were performed in triplicate on homogenized tomato samples at room temperature. Color parameters were initially recorded in the CIE L*a*b* space, where L* represents lightness, a* denotes the red–green axis, and b* the yellow–blue axis, as defined by the Commission Internationale de l’Éclairage (CIE). To better interpret color characteristics, Chroma (C*) and Hue angle (h°) were calculated according to McGuire [43], using the following Formulas (1) and (2):
Chroma (C*) = sqrt (a*2 + b*2)
Hue angle (h°) = arctan (b*/a*)
where a*: red–green axis; b*: yellow–blue axis.
Colorimetric results were used to estimate lycopene content, following Arias [36], using Formula (3):
Lycopene estimation = (a*/b*)2
where a*: red–green axis; b*: yellow–blue axis.
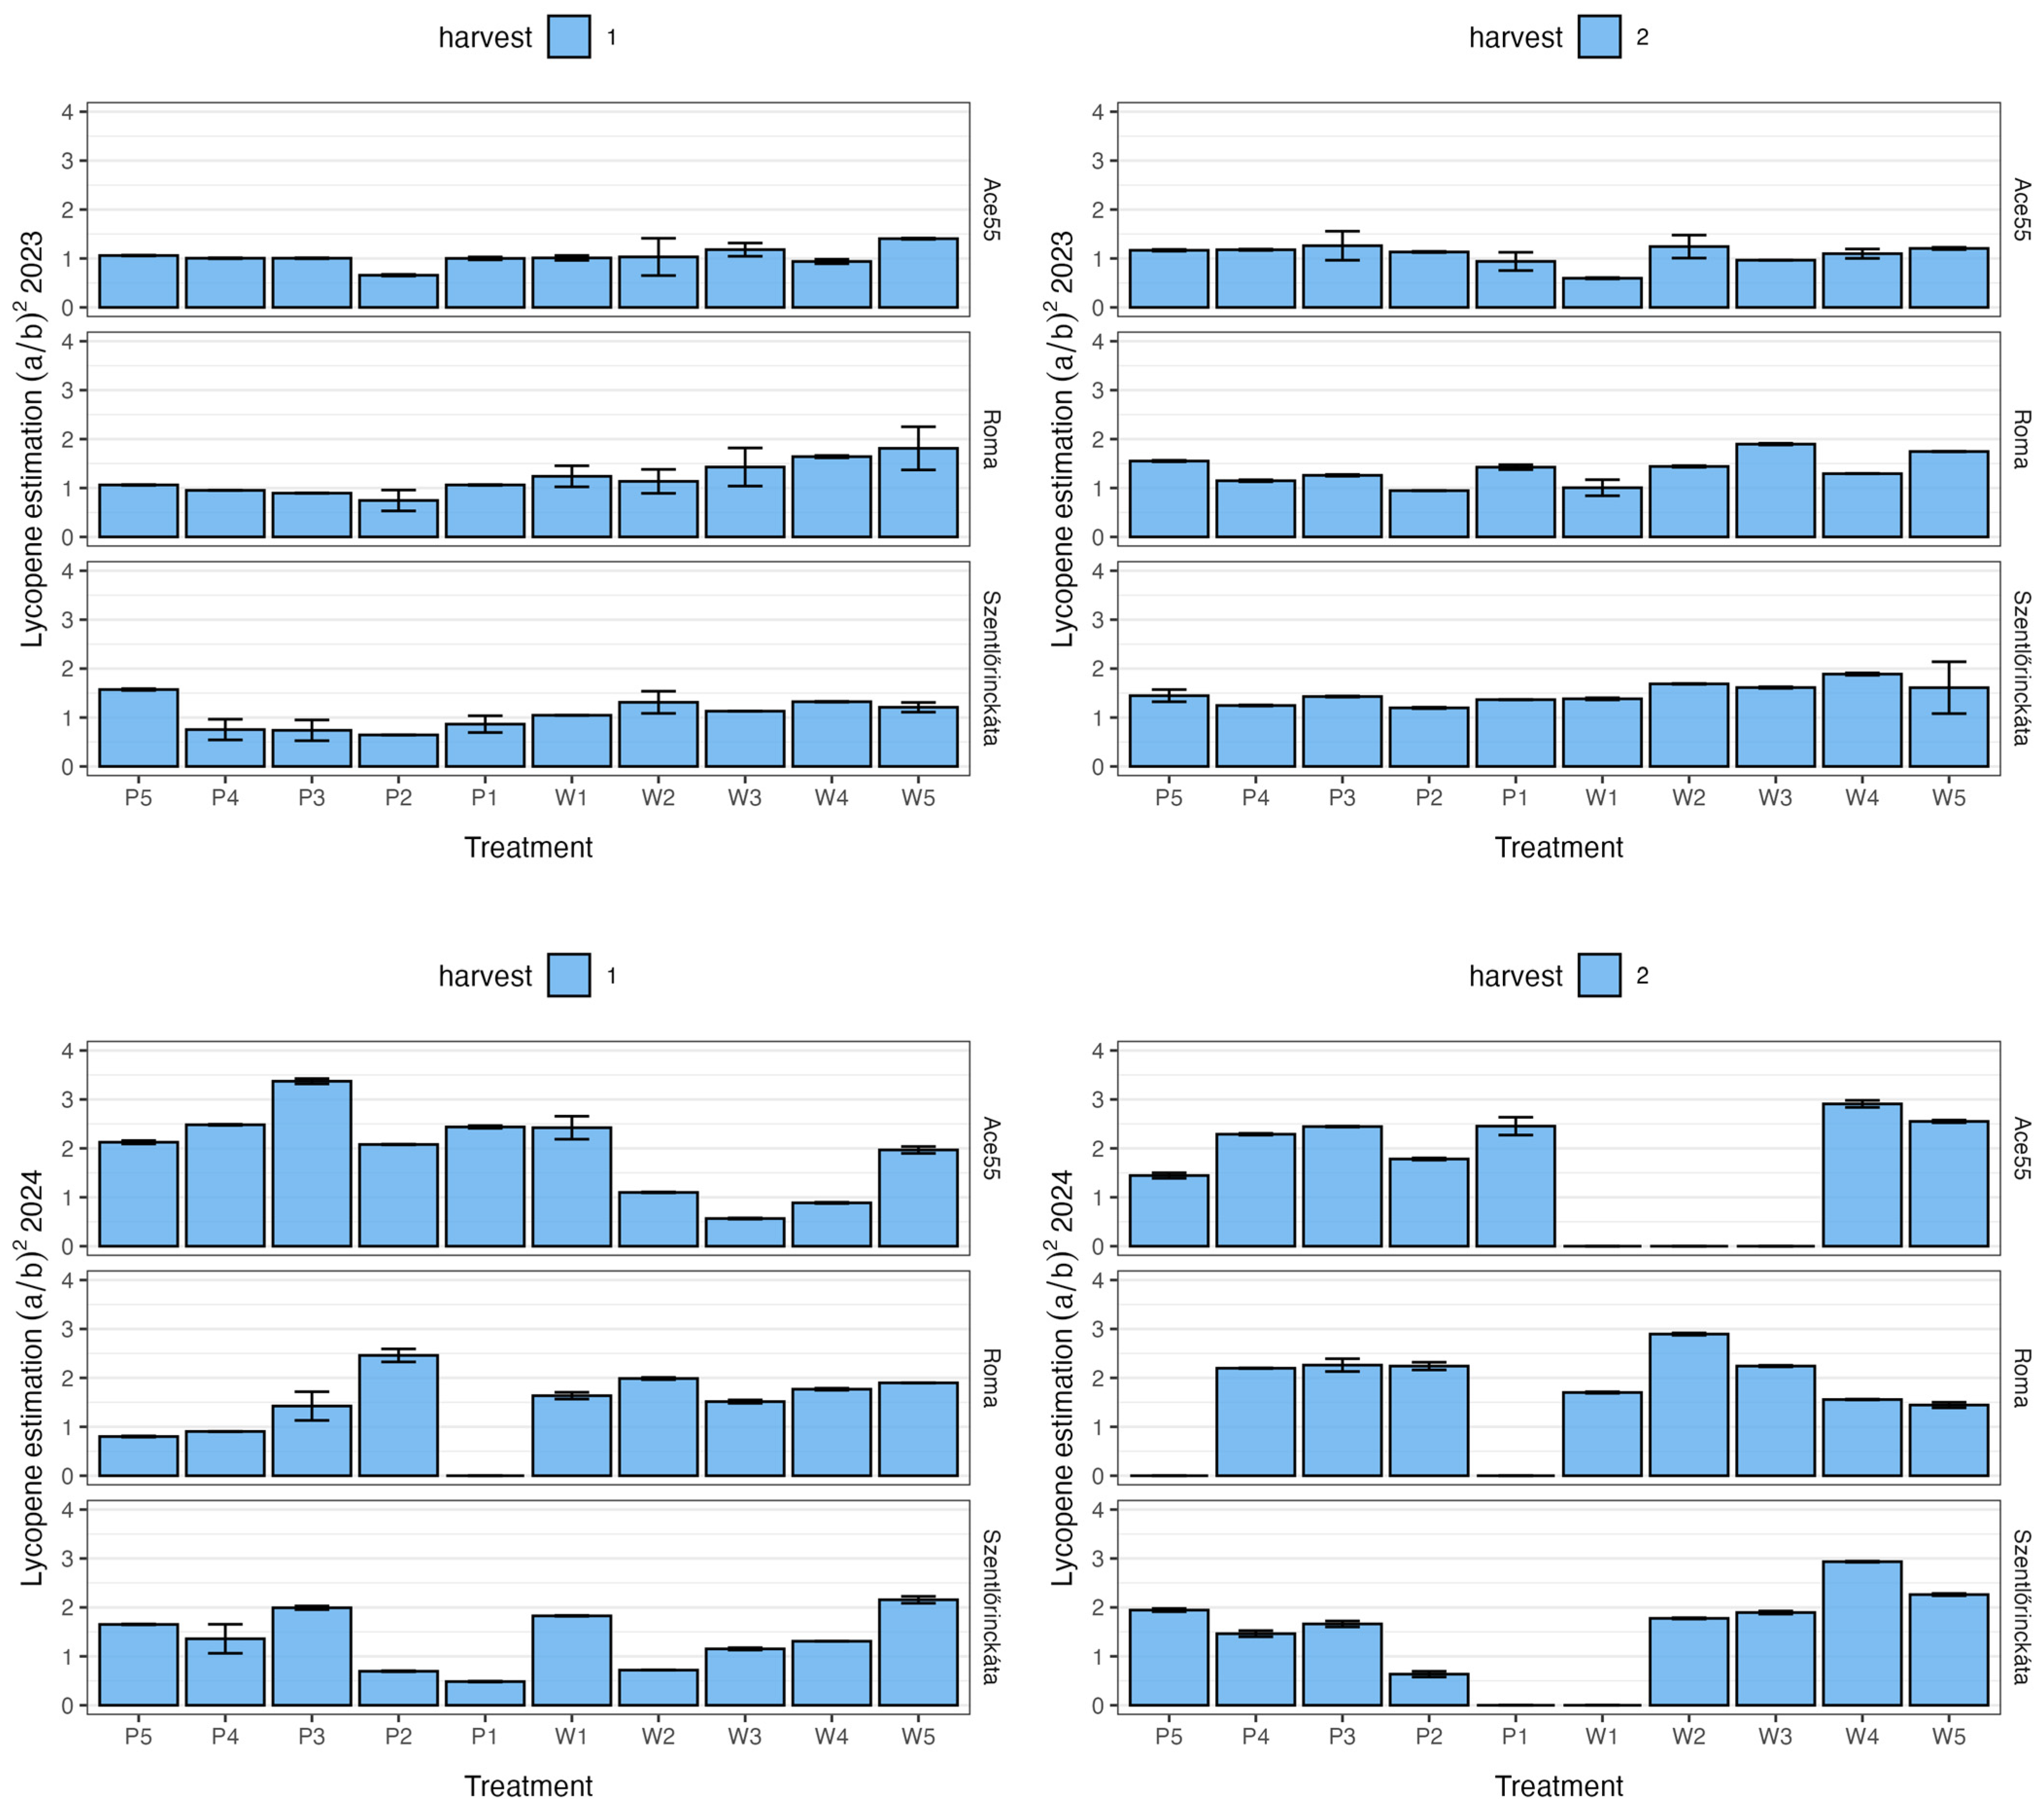
Due to the estimation nature of the lycopene values, these were only visualized to provide information regarding this important nutritional trait; however, the trait was excluded from both ANOVA and PCA analyses.
Measurements were performed in triplicate. Missing values were imputed using the (missRanger) method, and the suitability of the dataset for Principal Component Analysis (PCA) was confirmed via the Kaiser–Meyer–Olkin (KMO) test and Bartlett’s test of sphericity, ensuring robust dimensionality reduction and reliable sample discrimination.

2.5. Determination of TSS, TA, and SAR

Instrumental analyses were performed at the Institute of Food Science and Technology at the Hungarian University of Agriculture and Life Sciences, Hungary. Total Soluble Solids (TSS) were measured using a Hanna HI96801 digital refractometer (Hanna Instruments Magyarország, Szeged, Hungary) following ISO 2173:2003 [44] and expressed in degrees Brix (°Bx). Titratable Acidity (TA) was determined by titration with 0.1 N NaOH using phenolphthalein as an indicator, expressed as a percentage of citric acid equivalent (ISO 750:1998). The Sugar–Acid Ratio (SAR) was calculated by dividing (TSS) by (TA), using ISO methods [45]. All measurements were carried out in three technical repetitions.

2.6. Determination of Ferric-Reducing Antioxidant Power (FRAP)

The FRAP determination was performed according to the method of Benzie and Strain [46], to assess total antioxidant content. The FRAP reagent was prepared by blending 3.1 g of sodium acetate trihydrate (CH3COONa·3H2O) and hydrochloric acid, with 16 mL of acetic acid (1 L) to form a 300 mM acetate buffer (pH 3.6), and ferric chloride hexahydrate (FeCl3·6H2O) was dissolved in distilled water at a concentration of 5.4 mg/mL. Additionally, a 2,4,6-tripyridyl-s-triazine (TPTZ) solution was mixed in a 10:1:1 (v/v/v) ratio and used for FRAP analysis. This solution was then heated to 37 °C for 5 min in a water bath. For the measurement, 1500 µL of the prepared FRAP reagent was placed into a test tube, and a blank reading was recorded at 593 nm. Subsequently, 1500 µL of FRAP reagent, 50 µL of the prepared selected extracts, and 50 µL of distilled water were added to a cuvette. The second reading was recorded at 593 nm after 5 min of reaction [44]. The measurements were performed in three technical repetitions, and the results were expressed as ascorbic acid equivalence using mg AAE 100 g−1 dimensions.

2.7. Determination of Total Phenolic Content (TPC)

The colorimetric technique was employed to quantify total polyphenol content, with sample absorbance measured using a Hitachi U-2900 spectrophotometer (Hitachi High Technologies Europe GmbH, Krefeld, Germany) and compared with a blank solution [47]. The Folin–Ciocalteu reagent (Sigma-Aldrich, St. Louis, MO, USA), adapted from Singleton and Rossi, was prepared by blending 50 mL of Folin’s solution with 500 mL of distilled water to yield the Folin solution. Methanol was diluted with distilled water (DW) in a ratio of 80:20 mL, while 31.1 g of sodium carbonate Na2CO3 was dissolved in 500 mL of DW. Additionally, 5.1 mg of gallic acid (Merck KGaA, Darmstadt, Germany) was dissolved in a 80:20 mL mixture of methanol and distilled water. To prepare the samples, 1250 µL of the Folin solution and 200 µL of the MeOH: DW mixture were added to test tubes, which were then placed in a 50 °C water bath for 5 min. The absorbance at 750 nm was measured for the blank sample, followed by the addition of 50 µL of gallic acid and 10 mL of blended tomato juice. Each sample, with a final volume of 2500 mL, was measured in triplicate to ensure accuracy [47,48]. Results were expressed in gallic acid equivalence using mg GAE 100 g−1 dimension.

2.8. Statistical Analysis

The statistical analyses were conducted using R (v 4.4.2, R Core Team, 2024) [49]. Multivariate Analysis of Variance (MANOVA) models were constructed to assess the effects of variety, distance from the hedgerow (levels 1 to 5), and side (protected and windy) on Chroma and Hue in 2023 and 2024. Harvest time was included as a blocking factor. MANOVA models, employing the same fixed factors and blocking factors, were utilized to analyze Total Soluble Solids (TSS), Titratable Acidity (TA), Ferric-Reducing Antioxidant Power (FRAP), Total Phenolic Content (TPC), and Sugar–Acid Ratio (SAR) in 2023 and 2024. Normality of model residuals was assessed based on the absolute values of skewness (<1) and kurtosis (<2). Given that the assumption of homogeneity of variances was violated in certain instances (Levene’s test, p < 0.05), Games–Howell post hoc tests were employed to ensure robustness. Pairwise comparisons were conducted for each of the three fixed factors, holding the levels of the other two fixed factors constant.
To investigate the multivariate discrimination between protected and windy cultivation conditions, a Principal Component Analysis (PCA) was conducted using statistical software R version 4.5.1 [49].
The analysis incorporated five chemical variables: Total Soluble Solids (TSS), Titratable Acidity (TA), Sugar–Acid Ratio (SAR), Ferric-Reducing Antioxidant Power (FRAP), and Total Phenolic Content (TPC).
Prior to conducting the Principal Component Analysis, the dataset was screened for missing observations. To ensure the completeness of the dataset and prevent the loss of information associated with listwise deletion, missing values were imputed using the missRanger algorithm [50] in R. We employed a chained Random Forest (RF) approach, where variables containing missing data are predicted iteratively using all other variables in the dataset (predictive mean matching). The imputation model was configured with 1000 trees per forest to ensure robust predictive stability, and a fixed random seed was applied to guarantee the reproducibility of the results. The variables were then transformed (square root for TPC (sqrtTPC), FRAP (sqrtFRAP), TSS (sqrtTSS); ln for TA (lnTA), and inverse for SAR (invSAR)) to improve normality and standardized (mean = 0, SD = 1) to account for unit differences.
To maximize the interpretability of the axes, a Varimax orthogonal rotation was applied to the first two retained components. The analysis was performed on the combined dataset (2023–2024) and subsequently stratified by year to assess temporal stability.
The suitability of the data for Factor Analysis was assessed using the Kaiser–Meyer–Olkin (KMO) measure and Bartlett’s test of sphericity. While standard guidelines suggest a KMO threshold of 0.6 for identifying latent constructs (Factor Analysis), this study utilizes PCA primarily for dimensionality reduction and graphical discrimination of treatment groups. Therefore, despite low KMO values indicating weak inter-variable partial correlations, PCA was accepted as a valid method because (i) Explained Cumulative Variance was high (81.7%), indicating that the 2D biplots accurately represent the majority of the information in the dataset, and (ii) the biological research question focuses on sample discrimination (protected vs. windy) rather than the identification of latent covariance structures.
Taking these aspects into account, the KMO value for the combined dataset was 0.42, indicating insufficient suitability for standard Factor Analysis. Individual variable measures differed markedly, with sqrtTPC (0.95) and sqrtFRAP (0.94) demonstrating excellent sampling adequacy, whereas invSAR (0.28), lnTA (0.34), and sqrtTSS (0.35) suggested that these variables operate largely independently from the others. However, Bartlett’s test was highly significant (χ2(df = 10) = 1756.58; p < 0.001), confirming that the correlation matrix was not an identity matrix, and the determinant of the correlation matrix (0.007) indicated no multicollinearity issues.
The assumption profile of the data of 2023 mirrored the combined dataset with a KMO of 0.30. Notably, sqrtTSS, InvSAR and inTA exhibited an extremely low MSA (0.15, 0.28, and 0.34, respectively), confirming them as unique sources of variance in this year. MSA values of sqrtTPC and sqrtFRAP were slightly higher (0.52 and 0.55, respectively). Bartlett’s test was highly significant (χ2(df = 10) = 873.47; p < 0.001), and the determinant of the correlation matrix was 0.007.
Considering the multifactorial nature of the study, KMO was 0.30 for the data of 2024. In this growing season, sqrtTSS became almost entirely orthogonal to the dataset (MSA = 0.04), and pairwise correlations were weak (determinant of the correlation matrix = 0.025). The low KMO values confirm that sqrtTSS, invSAR (MSA = 0.36), and lnTA (MSA = 0.35) do not correlate strongly with TPC (MSA = 0.52) and FRAP (MSA = 0.92) profiles. However, as these variables may be critical markers for discriminating the growing conditions, they were retained. The high explained variances validated that the resulting biplots are accurate 2D representations of the samples. (χ2(df = 10) = 650.12; p < 0.001), and the determinant of the correlation matrix was near zero.
The PCA biplots, displaying the scaled and transformed continuous variables and the sample scores, were generated using the ggplot2 package (v. 4.0.3) [51].

2.9. Limitations

This study focused on the influence of hedgerow-induced microclimatic variation on fruit quality traits rather than performing in-depth plant stress analyses. While parameters such as water potential, photosynthetic efficiency, or stress-related metabolites could provide mechanistic insights into plant responses, our experimental design prioritized measurable outcomes that directly reflect consumer- and market-relevant quality (TSS, TA, SAR, calculated color indices, FRAP, and TPC). This approach aims to establish a clear link between field-level microclimate modulation and basic fruit nutritional quality. However, future research is advised to integrate detailed physiological stress markers with quality assessments to more comprehensively elucidate the pathways through which hedgerows buffer abiotic stress in open-field tomato production.
Furthermore, lycopene content was estimated from approximate instrumental measurements and used solely for visualization; trait-related data were excluded from both ANOVA and PCA analyses. As lycopene is one of the most important nutritional quality determinants of tomato and is likely to have a high impact on human health, it is advised to perform instrumental measurements in tomato-related studies.

3. Results

3.1. Impact of Hedgerow on Microclimate, 2023–2024

The average temperatures were measured at different distances on the windy and protected sides of a hedge. The windy side (W1–W5) had an average deviation of +2.07 °C, while the protected side (P1–P5) showed a higher average deviation of +3.54 °C compared to the reference temperature inside the hedgerow (H) in the first year. At a distance of 15 m from the hedgerow, the protected side benefited from the hedge effect with an average increase of +1.04 °C in air temperature. In the second year, the windy side had an average difference of +2.49 °C from the air temperature measured within the hedge (H). Generally, the results indicate that the average temperature on the protected side was +0.38 °C higher than on the windy side throughout the vegetation period of both seasons 2023 and 2024. Throughout both years, May was consistently the coldest month, with minimum temperatures recorded at P4 (18.80 °C in May 2024), W1 (21.41 °C in May 2023), and W2 (18.29 °C in May 2024). September 2023 also showed relatively low temperatures, 19.46 °C at P4, though still warmer than May 2024. July was the hottest month, reaching 27.49 °C at P1 in 2023, 28.94 °C in 2024, and 27.18 °C at W2 in 2023, and 27.68 °C in 2024. The widest temperature ranges occurred at P4 and W5, reflecting clear microclimatic variation with distance from the hedgerow over both growing seasons (Table 2).

3.2. Basic Tomato Fruit Quality-Related Traits

According to the results of the statistical analysis of fruit quality-related traits, all two- and three-way interactions were significant in both years (Table 3).

3.2.1. Total Soluble Solids (TSS)

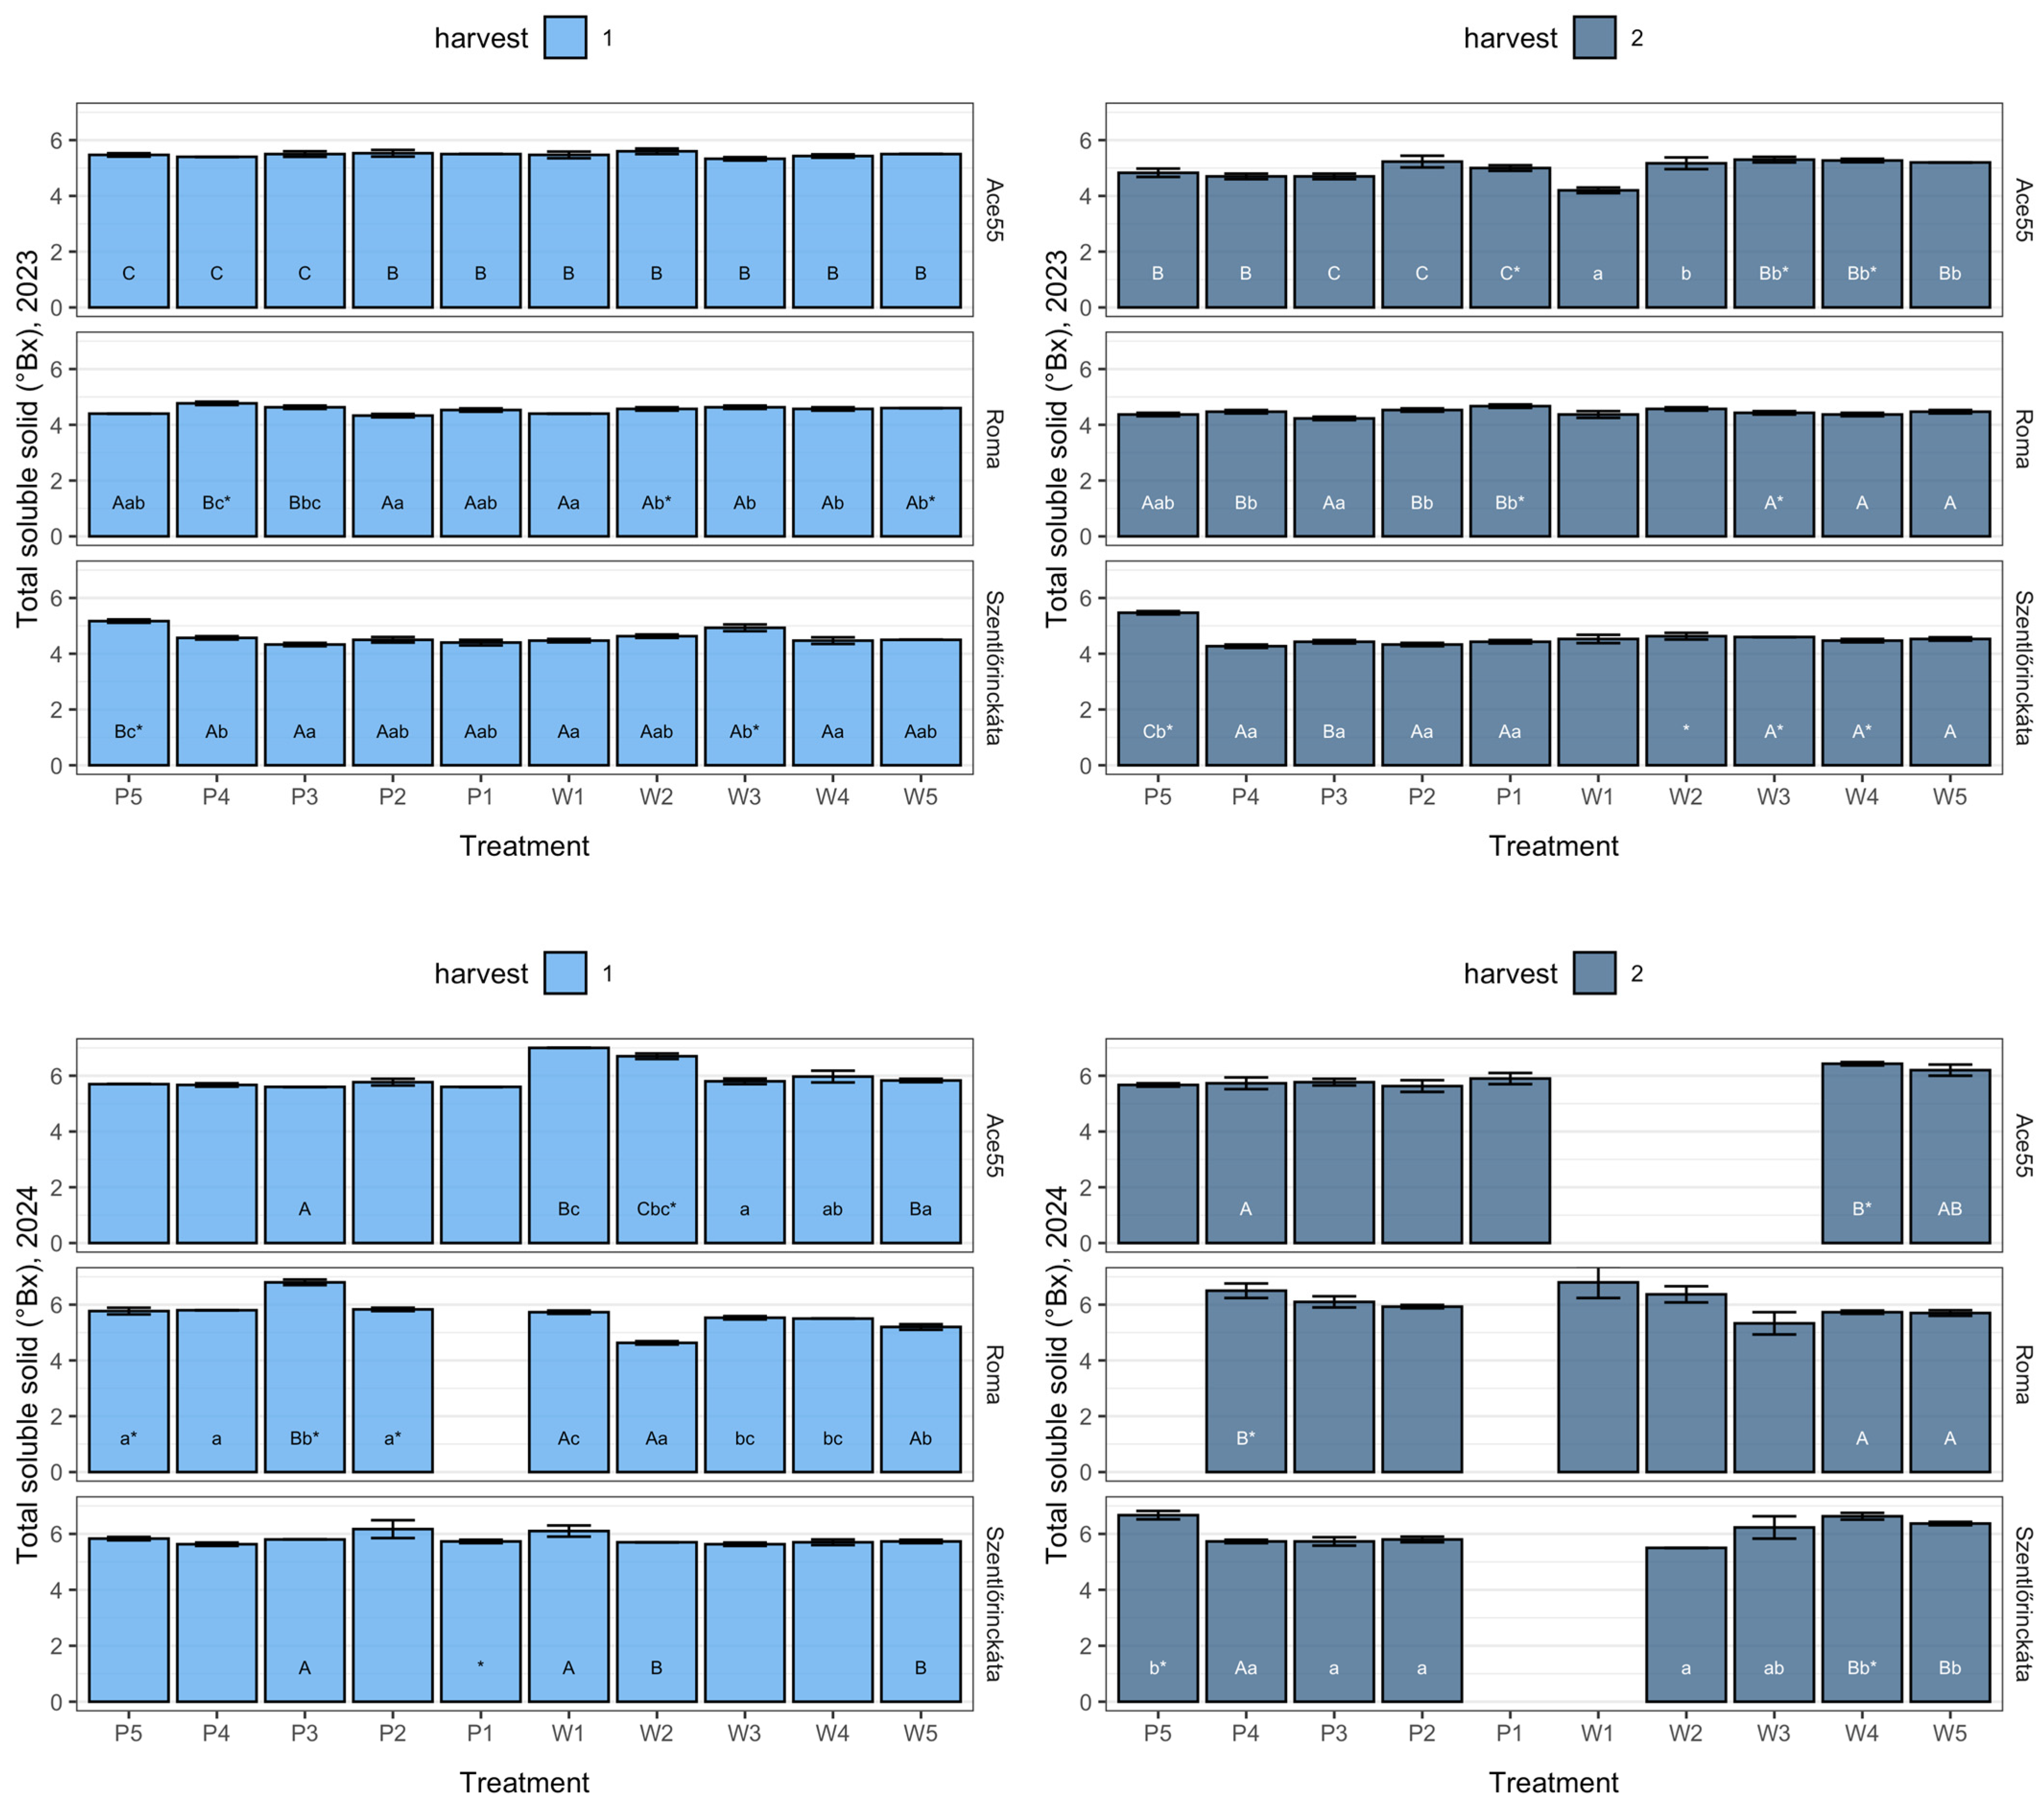
In 2023, Total Soluble Solids content showed very limited spatial variation, with only small differences among a few distances on both sides, indicating that the hedgerow gradient had minimal influence on sugar accumulation that year. Harvest 1 and Harvest 2 exhibited comparable value ranges, although the second harvest showed slightly more differentiation in some distance comparisons. Generally, the dispersion of total soluble solids values across the spatial gradient was low in 2023 (Table 3).
In 2024, TSS values exhibited clearer spatial patterns than in the previous year, with several distances differing significantly within each side. Some positions, particularly on the protected side, showed modest but consistent deviations from neighboring distances. Side effects remained limited; however, they were observed more frequently compared to 2023, especially in Harvest 2. Differences between the two harvests were more pronounced, with Harvest 1 showing elevated values at certain mid-distance positions. The year’s data indicate greater within-season and within-side variation than observed in 2023.
Ace55 showed modest but noticeable spatial variation in 2024, whereas it remained nearly uniform across distances in 2023. Roma maintained a narrow TSS range across almost all treatments in both years, with only occasional deviations. Szentlőrinckáta tended to show the smallest absolute TSS variation, remaining highly stable across distances and years (Figure 3).

3.2.2. Titratable Acidity (TA)

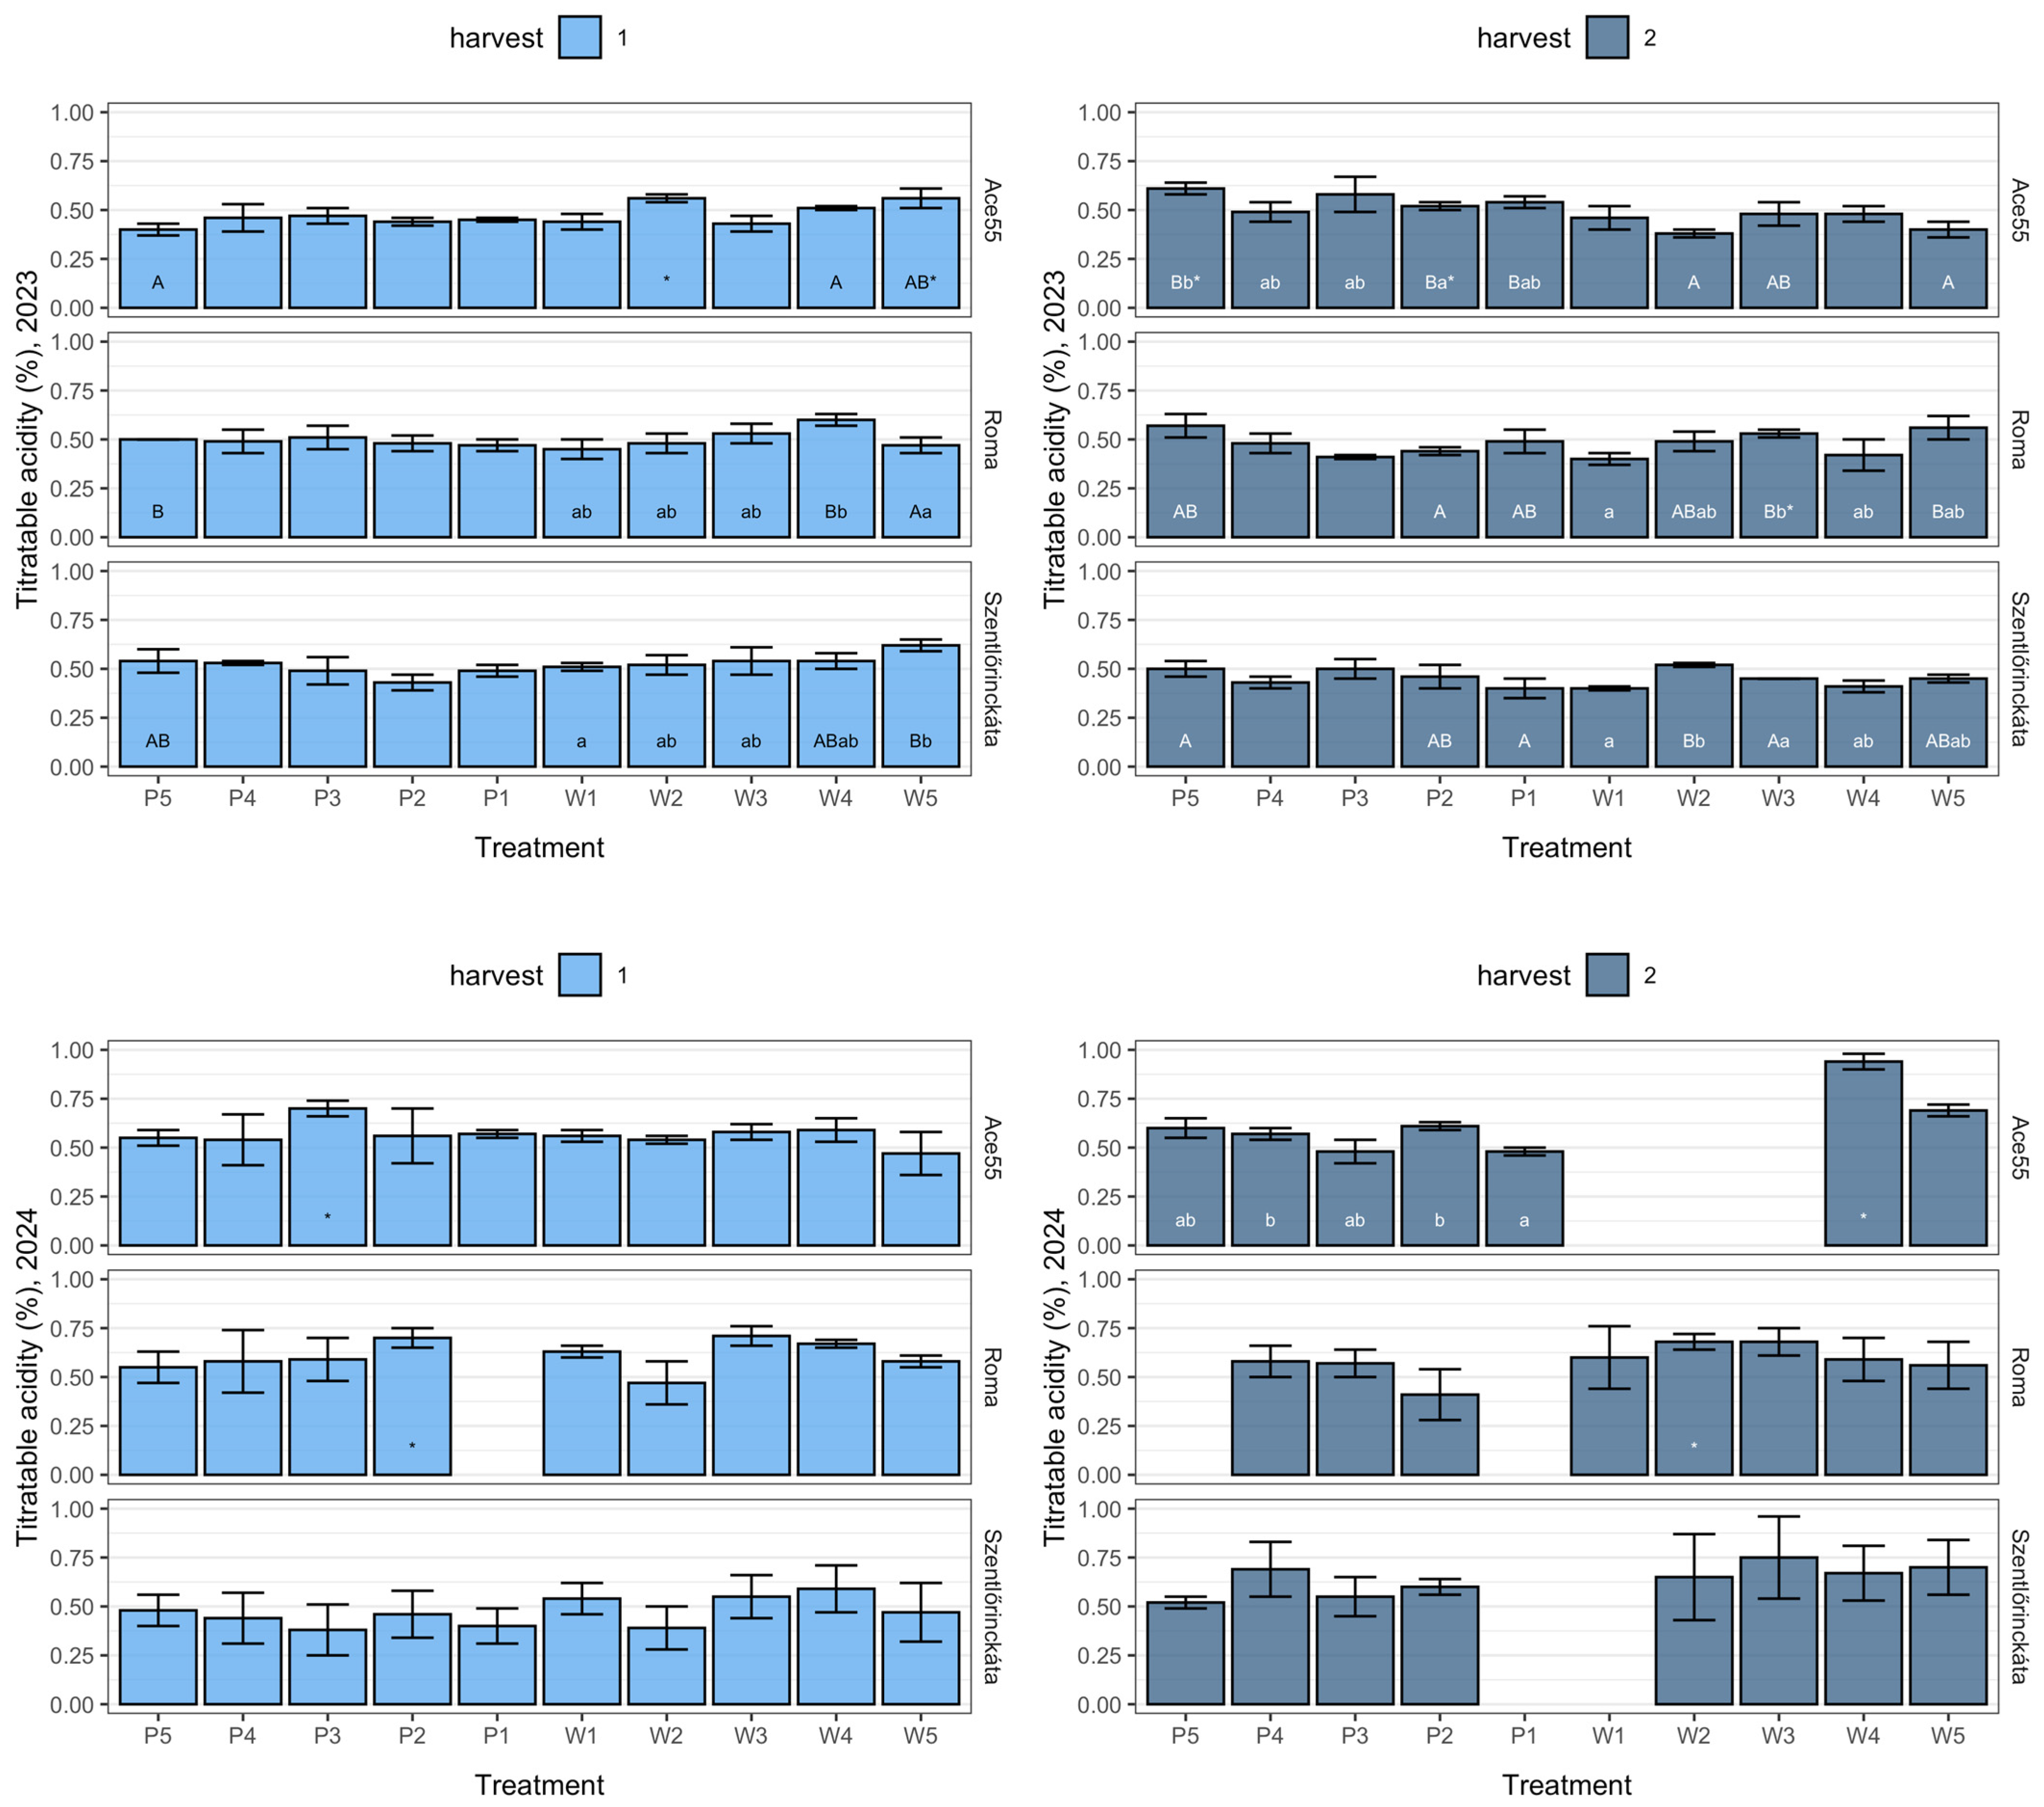
In 2023, Titratable Acidity showed low to moderate spatial variability across the hedgerow gradient. Within-side distance effects were present at several positions, but differences were generally small and irregular. No consistent increase or decrease in acidity was associated with proximity to the hedgerow on either side, although terminal positions seem more favorable for high TA content. Windy–protected contrasts occurred only at isolated distances and remained limited in magnitude. Differences between the two harvests were minor, with broadly overlapping acidity ranges (Figure 4).
In 2024, spatial differentiation among distances became more pronounced, particularly in Harvest 2. Several sampling positions showed separation from adjacent distances; however, these differences were not statistically significant due to high variability (standard deviation), indicating a moderate microclimatic influence on acidity compared to 2023. Harvest-to-harvest contrasts were clearer than in the previous year, with greater dispersion of values in Harvest 2. Generally, acidity variability was higher in 2024 than in 2023. Ace55 showed moderate spatial and harvest-related variation, most notably in 2024. Roma exhibited clearer distance-related differences than the other cultivars, especially in 2024. Szentlőrinckáta displayed the highest variability, with pronounced dispersion across distances and between harvests (Table 3).

3.2.3. Sugar–Acid Ratio (SAR) Analysis

Variation in the sugar–acid ratio (Appendix A) across sampling positions closely matched the limited fluctuations observed in both total soluble solids and Titratable Acidity in 2023. Since neither sugars nor acids showed strong or consistent distance-related gradients, SAR values remained relatively uniform across positions. Local SAR differences were primarily associated with minor shifts in acidity rather than changes in sugar content. Side-related contrasts were sporadic, consistent with the weak windy–protected separation observed in both underlying parameters. However, SAR variability in 2023 mirrored the limited spatial structuring of its components (Table 3).
In 2024, the greater dispersion of SAR values closely matched the increased variability in Titratable Acidity, while sugar content remained comparatively stable (Appendix A). Several pronounced SAR peaks and minima coincided with positions showing reduced or elevated acidity rather than major changes in Total Soluble Solids. Side-related SAR differences followed the more frequent side effects observed for acidity, especially in the second harvest. Harvest-to-harvest contrasts in SAR were more pronounced than distance effects, reflecting the temporal divergence seen in acidity patterns. Thus, SAR variation in 2024 was driven mainly by acid dynamics. Roma showed stable SAR patterns, consistent with its limited variability in both sugar and acidity. Ace55 combined relatively high sugar levels with variable acidity, leading to greater SAR fluctuations. Szentlőrinckáta exhibited wide SAR dispersion, consistent with its high Titratable Acidity variability.

3.3. Tomato Fruit Pigment-Related Results

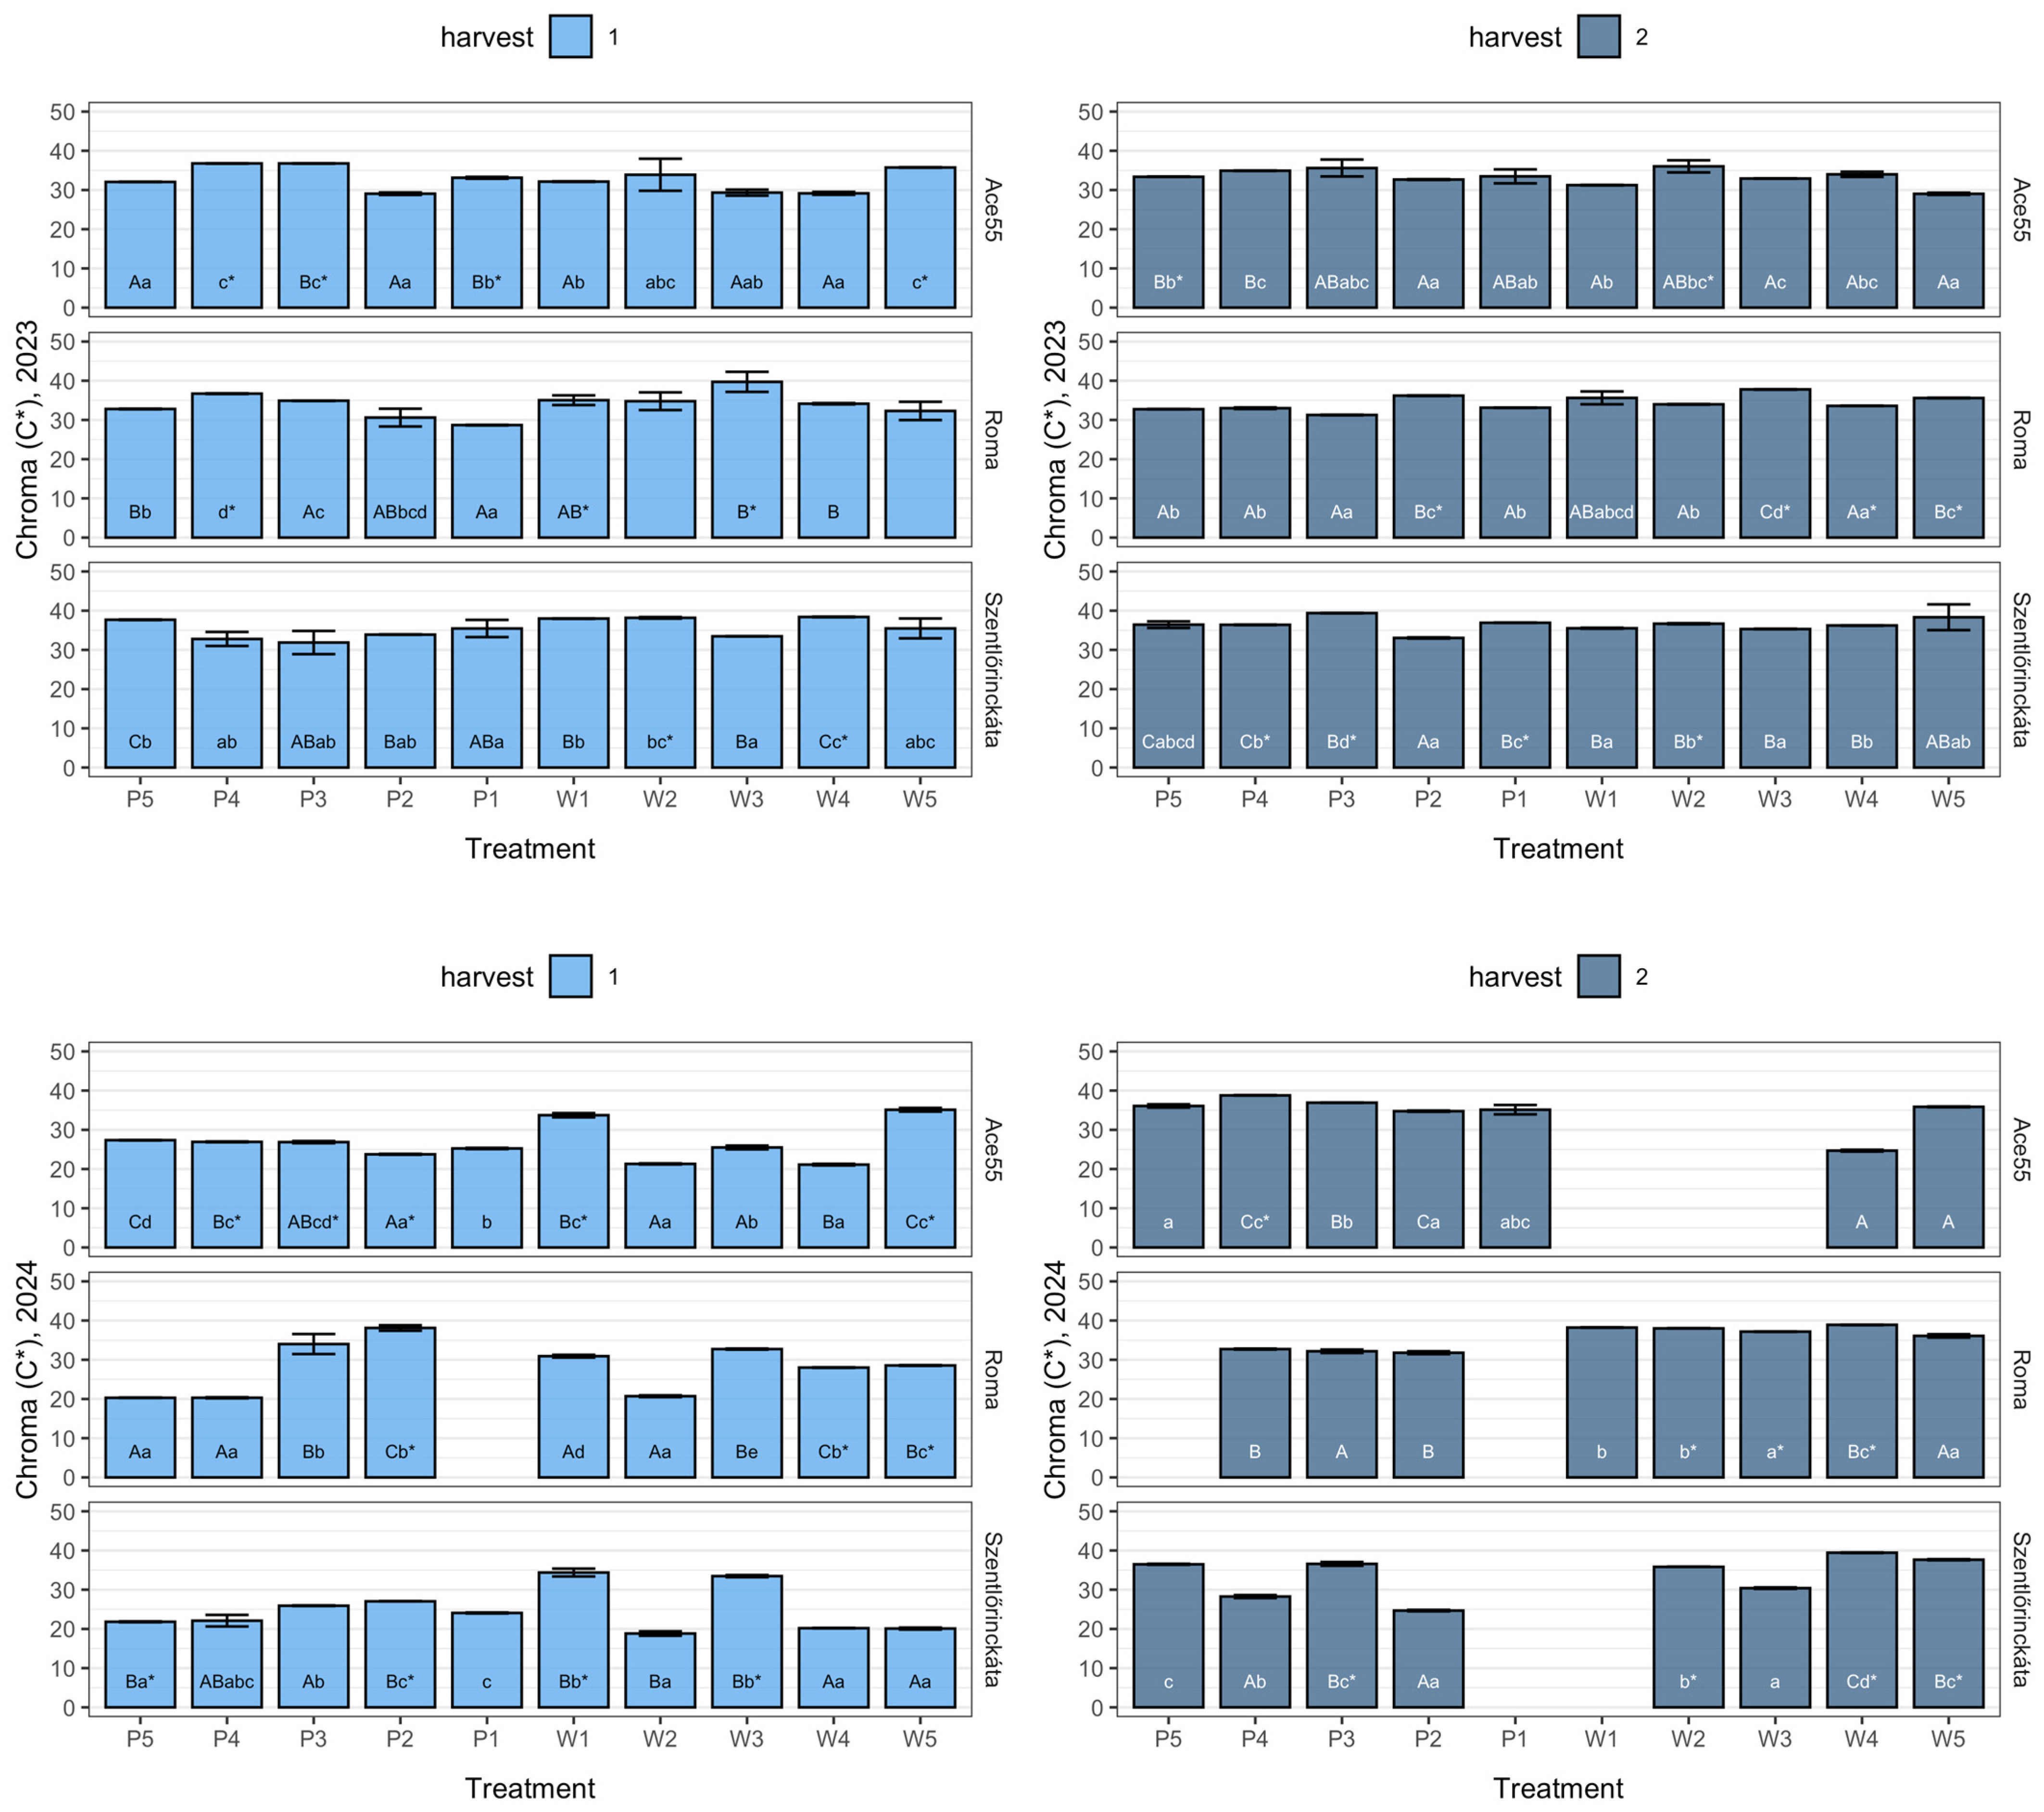
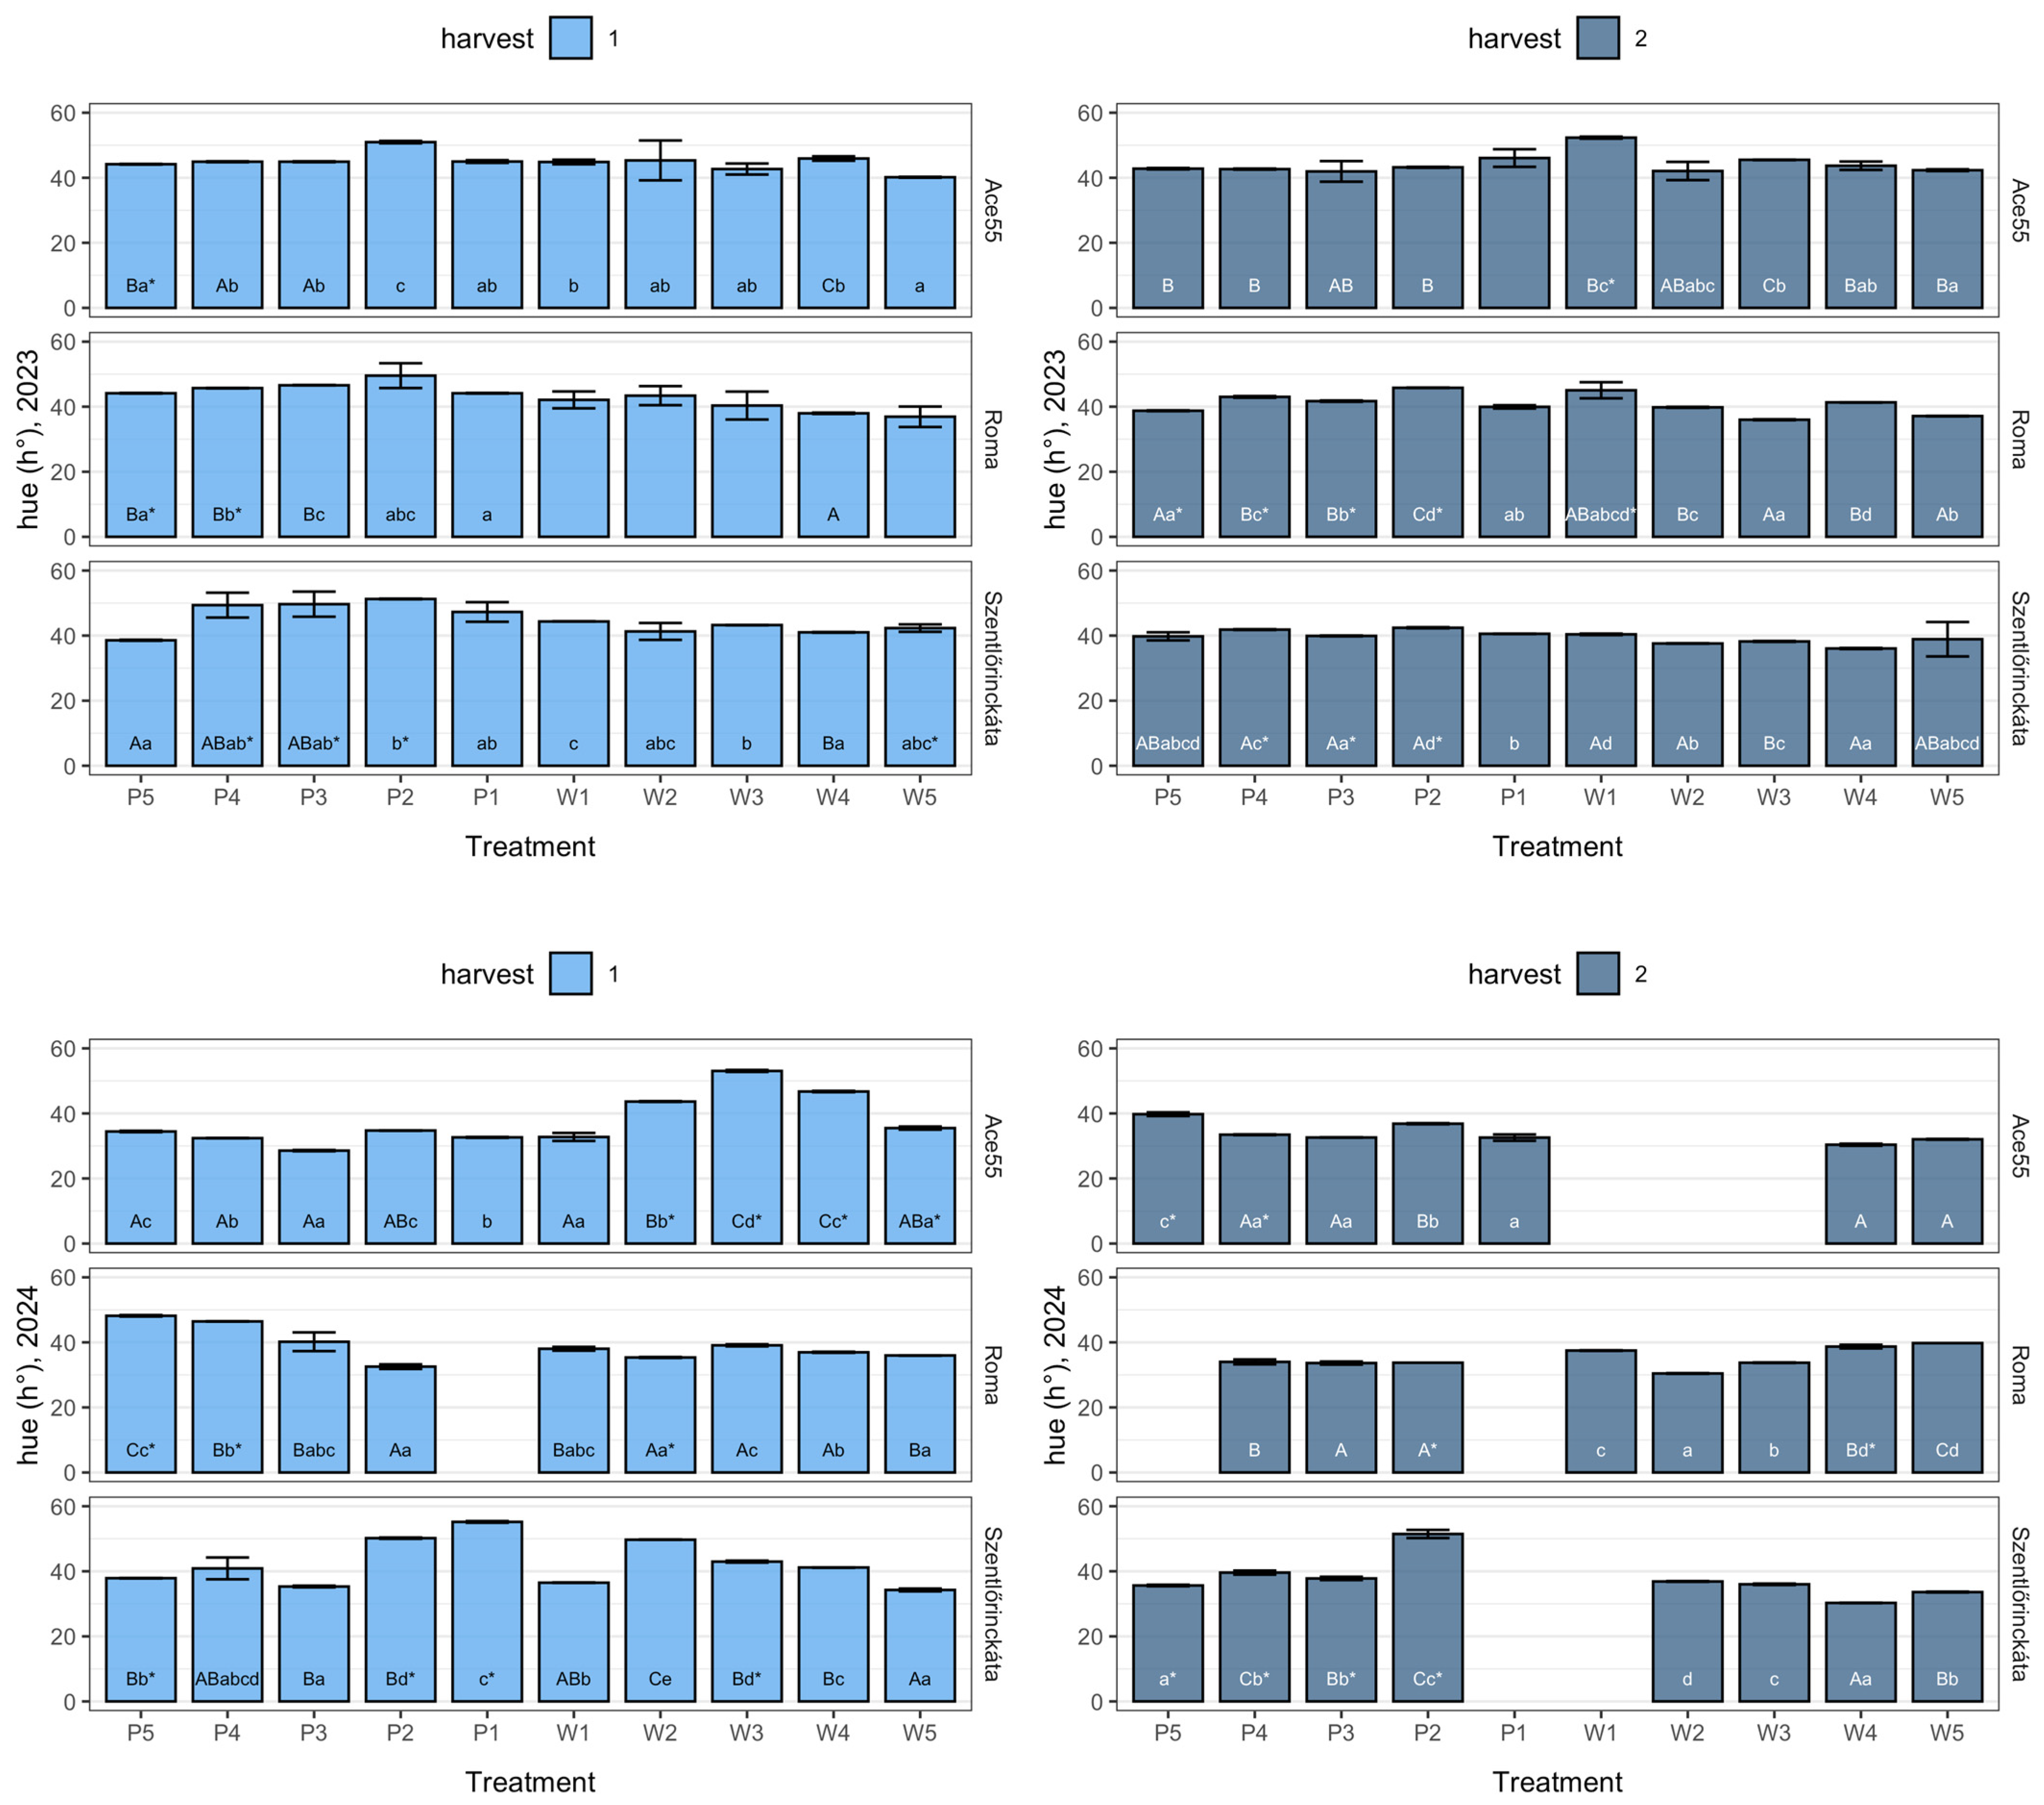
According to the statistical analysis of the fruit puree color-related traits (Chroma, Hue) (Table 4), all two- and three-way interactions were significant both in 2023 and in 2024 (p < 0.05, and p < 0.001, respectively).

3.3.1. Chroma (C*) Analysis

Across both harvests in 2023, fruit Chroma (C*) showed moderate but clear spatial responses to hedgerow distance; significant within-side gradients were observed for all three cultivars, but without a strong structured trend. The first-year dataset indicates windy-protected side differences, although with less consistency. Mid-distances (P2–P3, W2–W3) seem to be the most advantageous for color saturation-related traits.
In the second year (2024), contrasts between sampling distances became clearer and more stable compared to 2023. Although conditions on the sheltered side may have promoted pigment accumulation, relatively high chroma values were also recorded at multiple exposed locations across both varieties and harvest periods, particularly in the later harvest. It is worth noting that, in addition to mid-distances, W1 positions also showed elevated values across all varieties. The gradually lower chroma values of the first harvest in the second year indicate strong environmental stress impacting pigment synthesis. Furthermore, chroma levels were lower and more dispersed in 2024 than in 2023, indicating a stronger year effect on color intensity (Table 4). Roma consistently exhibited higher chroma values and stronger spatial contrast than Ace55 and Szentlőrinckáta in both years. Ace55 showed the lowest spatial sensitivity, while Szentlőrinckáta displayed the highest year-to-year variability (Figure 5).

3.3.2. Hue (h°) Analysis

In the first year (2023), Hue values showed relatively limited spatial variation along the hedgerow gradient, with only a few distances differing significantly on either side. Patterns across positions tend to show a slight directional trend, with higher Hue values around P2 on the protected side, decreasing towards both P5 and W5. Regarding side comparison, the protected side generally showed slightly higher values, which were significant in several cases across varieties, especially for Harvest 2. Furthermore, the 2023 Hue data indicate weak microclimatic influence on pigment-related synthesis, while suggesting higher lycopene content on the protected side and in hedge-adjacent plots.
Hue values in 2024 showed more pronounced differences among sampling positions compared to the previous year, with several treatments exhibiting noticeable variation across distances on both sides, albeit without a consistent pattern. Additionally, variation in Hue was influenced by genotype, indicating variety-specific responses. In terms of pairwise comparison within the same distances of two sides, the advantage of the protected side is significant in several cases, although Ace55 shows totally different patterns. The two harvests differed more distinctly than in 2023, with Harvest 2 displaying greater heterogeneity among distances. The year-to-year shift suggests increased environmental impact on Hue formation in 2024 (Table 4).
Regarding genotypes, Ace55 showed moderate spatial variation, mainly in 2024, but remained relatively stable overall. Roma maintained consistently narrow Hue ranges in both years, displaying the least sensitivity to distance or side. Szentlőrinckáta, however, exhibited the greatest fluctuations across distances and years, indicating higher responsiveness of Hue to microclimatic conditions (Figure 6).

3.3.3. Lycopene Content Estimation Based on (a/b)2 Values

The estimated lycopene values exhibited relatively minor variation across sampling positions, with most locations on both sides showing similar ranges and only slight local deviations in 2023. No consistent pattern related to distance from the hedgerow could be identified, though distal positions seem more favorable on the windy side. Differences between the windy and protected sides were visually apparent at some positions but remained inconsistent. Collectively, the 2023 estimates suggest limited spatial differentiation in lycopene-related color expression.
In 2024, the estimated lycopene content displayed greater variability among sampling positions compared to 2023. Differences between locations were evident in the color-based lycopene estimates; however, these variations did not follow a consistent gradient with distance and varied between harvest periods. Side-related contrasts occurred more frequently than in 2023, though their direction and magnitude varied across positions. The broader dispersion reflects increased variability in color ratios rather than a clear spatial gradient.
Ace55 tended to show higher estimated lycopene values in 2024 compared with 2023, with marked spatial variability. Roma exhibited moderate estimation ranges, with several localized peaks across distances in 2024. Szentlőrinckáta showed pronounced heterogeneity in estimated values, particularly in 2024, indicating that color ratios are highly sensitive to spatial and temporal factors (Figure 7).

3.4. Antioxidant-Related Traits

3.4.1. Ferric-Reducing Antioxidant Power (FRAP)

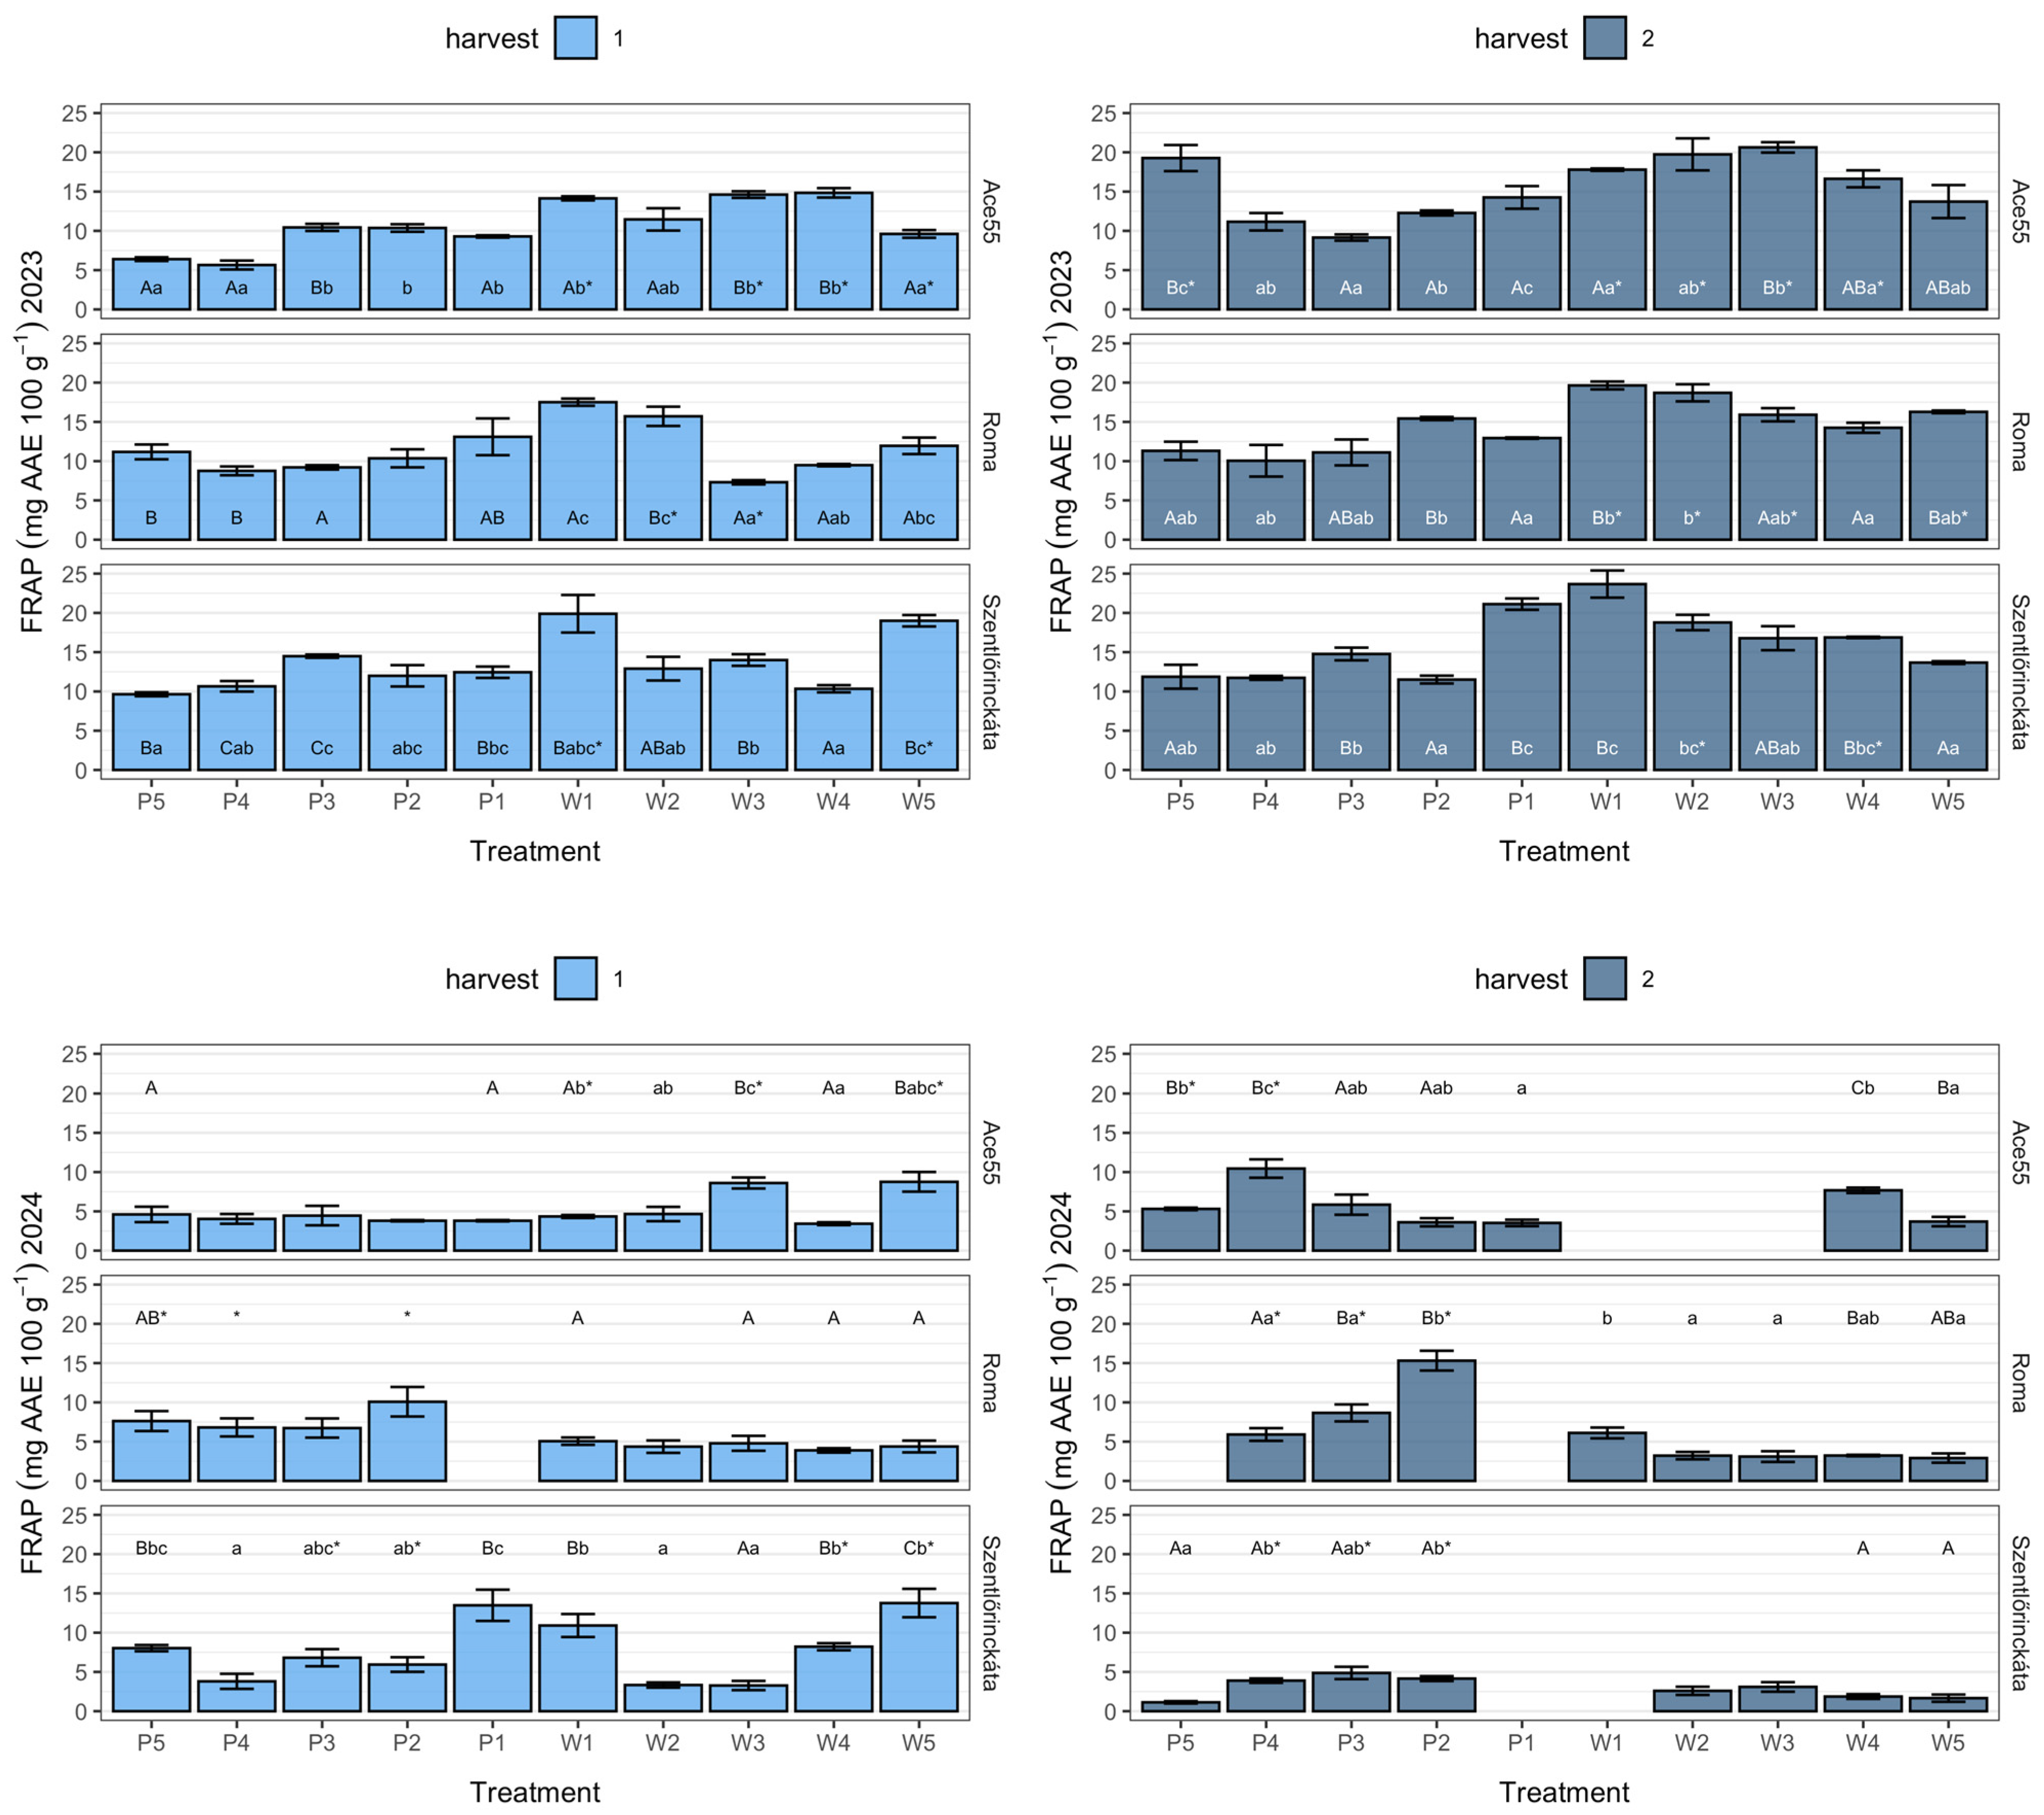
In 2023, FRAP values demonstrated clear spatial variability across distances on both sides. Several positions differed visibly from adjacent distances, indicating localized differences in antioxidant capacity. No consistent monotonic trend with distance from the hedgerow was observed. Windy and protected sides contrasts occurred at multiple positions, but their direction was not uniform. Differences between the two harvests were moderate, with Harvest 2 generally showing slightly higher FRAP values in several treatments (Figure 8).
FRAP values in 2024 showed greater variability among sampling positions than in 2023, particularly during Harvest 2. Several distances showed a more heterogeneous spatial pattern. Side-related contrasts were frequent and, in some cases, exceeded within-side distance differences. Harvest-to-harvest contrasts were substantial, with Harvest 2 exhibiting markedly lower or higher FRAP values depending on distance and cultivar. From this perspective, variability in antioxidant capacity was higher in 2024 than in the previous year.
In terms of genotypes, Ace55 indicated measurable variation along the distances sampled in FRAP, especially in 2024, with clear harvest-related contrasts. Roma showed generally lower FRAP values and less spatial differentiation than the other cultivars. Szentlőrinckáta displayed strong distance- and harvest-dependent variability, indicating high responsiveness of antioxidant capacity to spatial conditions (Table 3).

3.4.2. Total Phenolic Content (TPC)

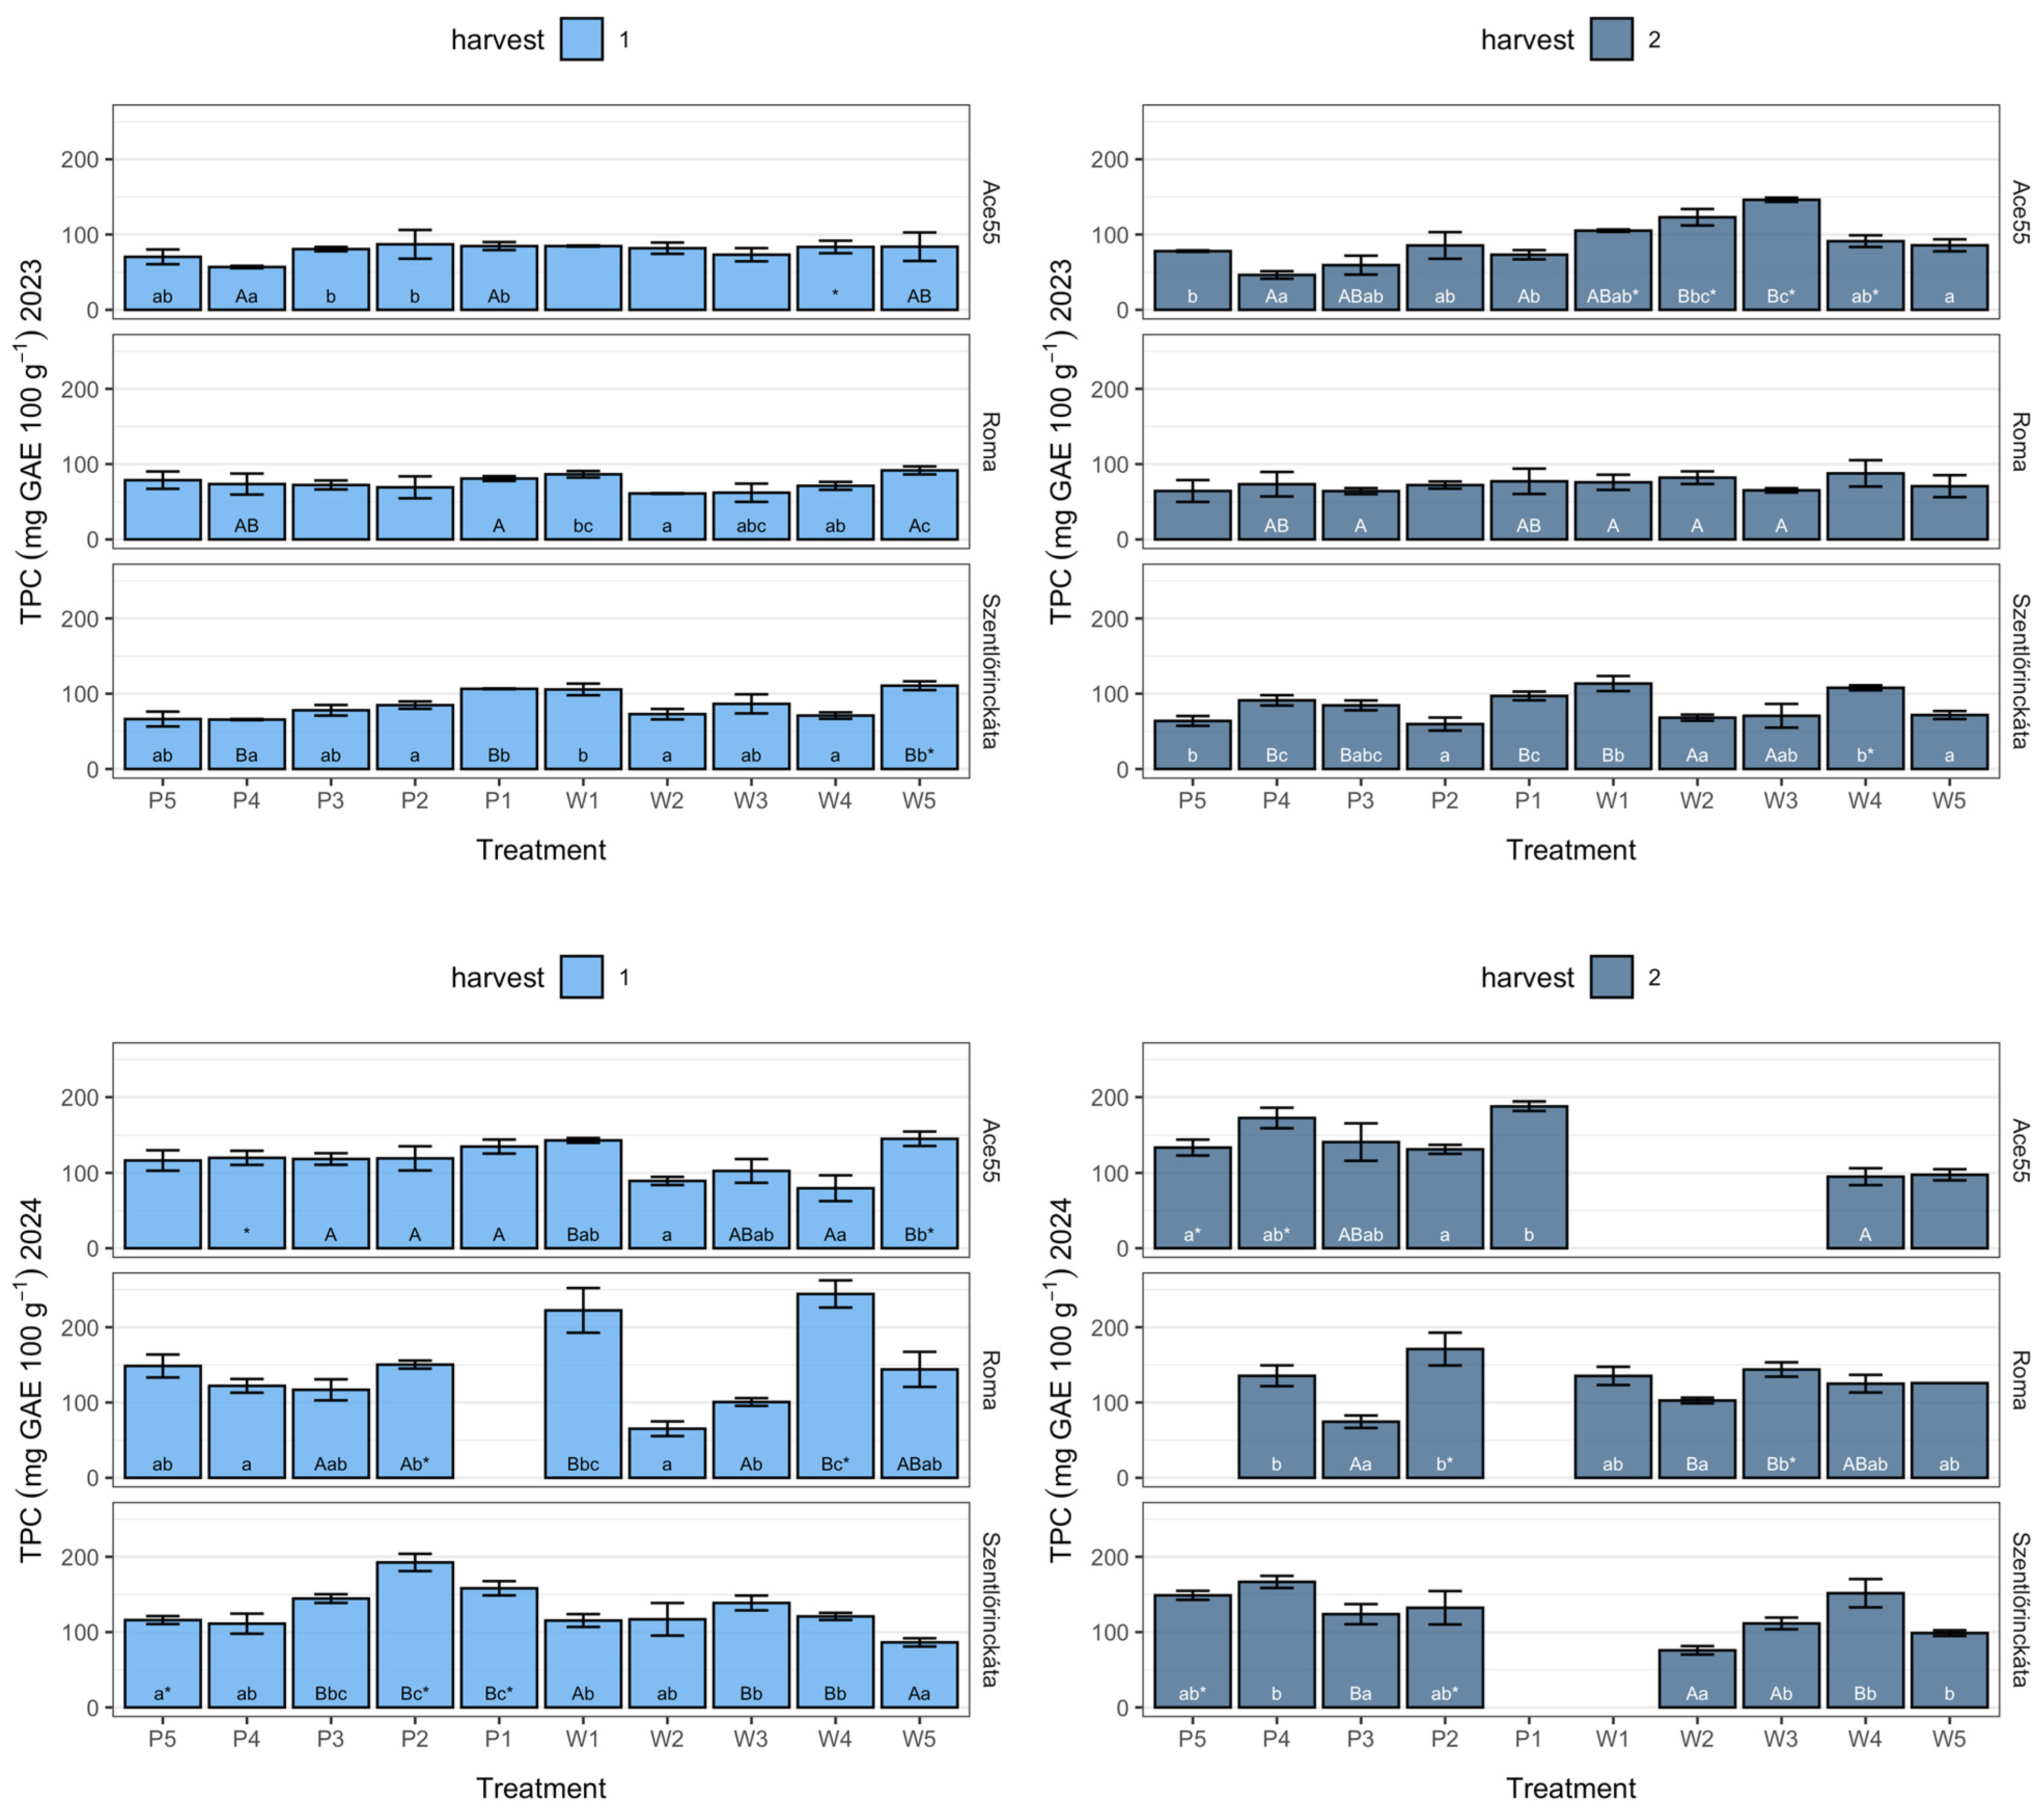
In 2023, Total Phenolic Content (TPC) differed significantly among treatments, although no uniform spatial gradient was observed between protected and windy sides. Several treatments showed statistically higher TPC values compared to others, but these effects were treatment- and variety-specific rather than systematic. The second harvest generally yielded TPC levels equal to or higher than those of the first harvest, indicating a harvest-dependent modulation of phenolic accumulation. However, treatment × harvest interactions were evident, as the magnitude and direction of changes varied across treatments. With respect to the study’s multifactorial structure, the 2023 data suggest that TPC was influenced by localized treatment effects rather than by a consistent environmental gradient.
In 2024, TPC measurements revealed more pronounced differences among treatments than in 2023, with several statistically significant variations detected across both harvests. The first harvest showed relatively higher TPC levels and greater variability, whereas the second harvest showed inconsistent values across treatments. Despite increased separation among treatments, no clear site-specific trend emerged. Treatment × harvest interactions indicate that phenolic accumulation responded dynamically to both spatial and temporal factors. These results point to a complex regulation of TPC driven by combined treatment effects rather than a single dominant factor (Table 3).
Regarding genotypes, Ace55 showed relatively stable TPC values across both years, with consistent but moderate treatment effects and a clear harvest dependency, indicating a comparatively buffered phenolic response to spatial variation. Roma exhibited pronounced interannual variability in TPC, with strong treatment- and harvest-specific differences, suggesting high sensitivity of phenolic accumulation to changing environmental conditions. Szentlőrinckáta displayed the highest total variability and the most distinct treatment effects across both years, confirming a strong genotype-dependent responsiveness in Total Phenolic Content (Figure 9).

3.5. Principal Component Analysis

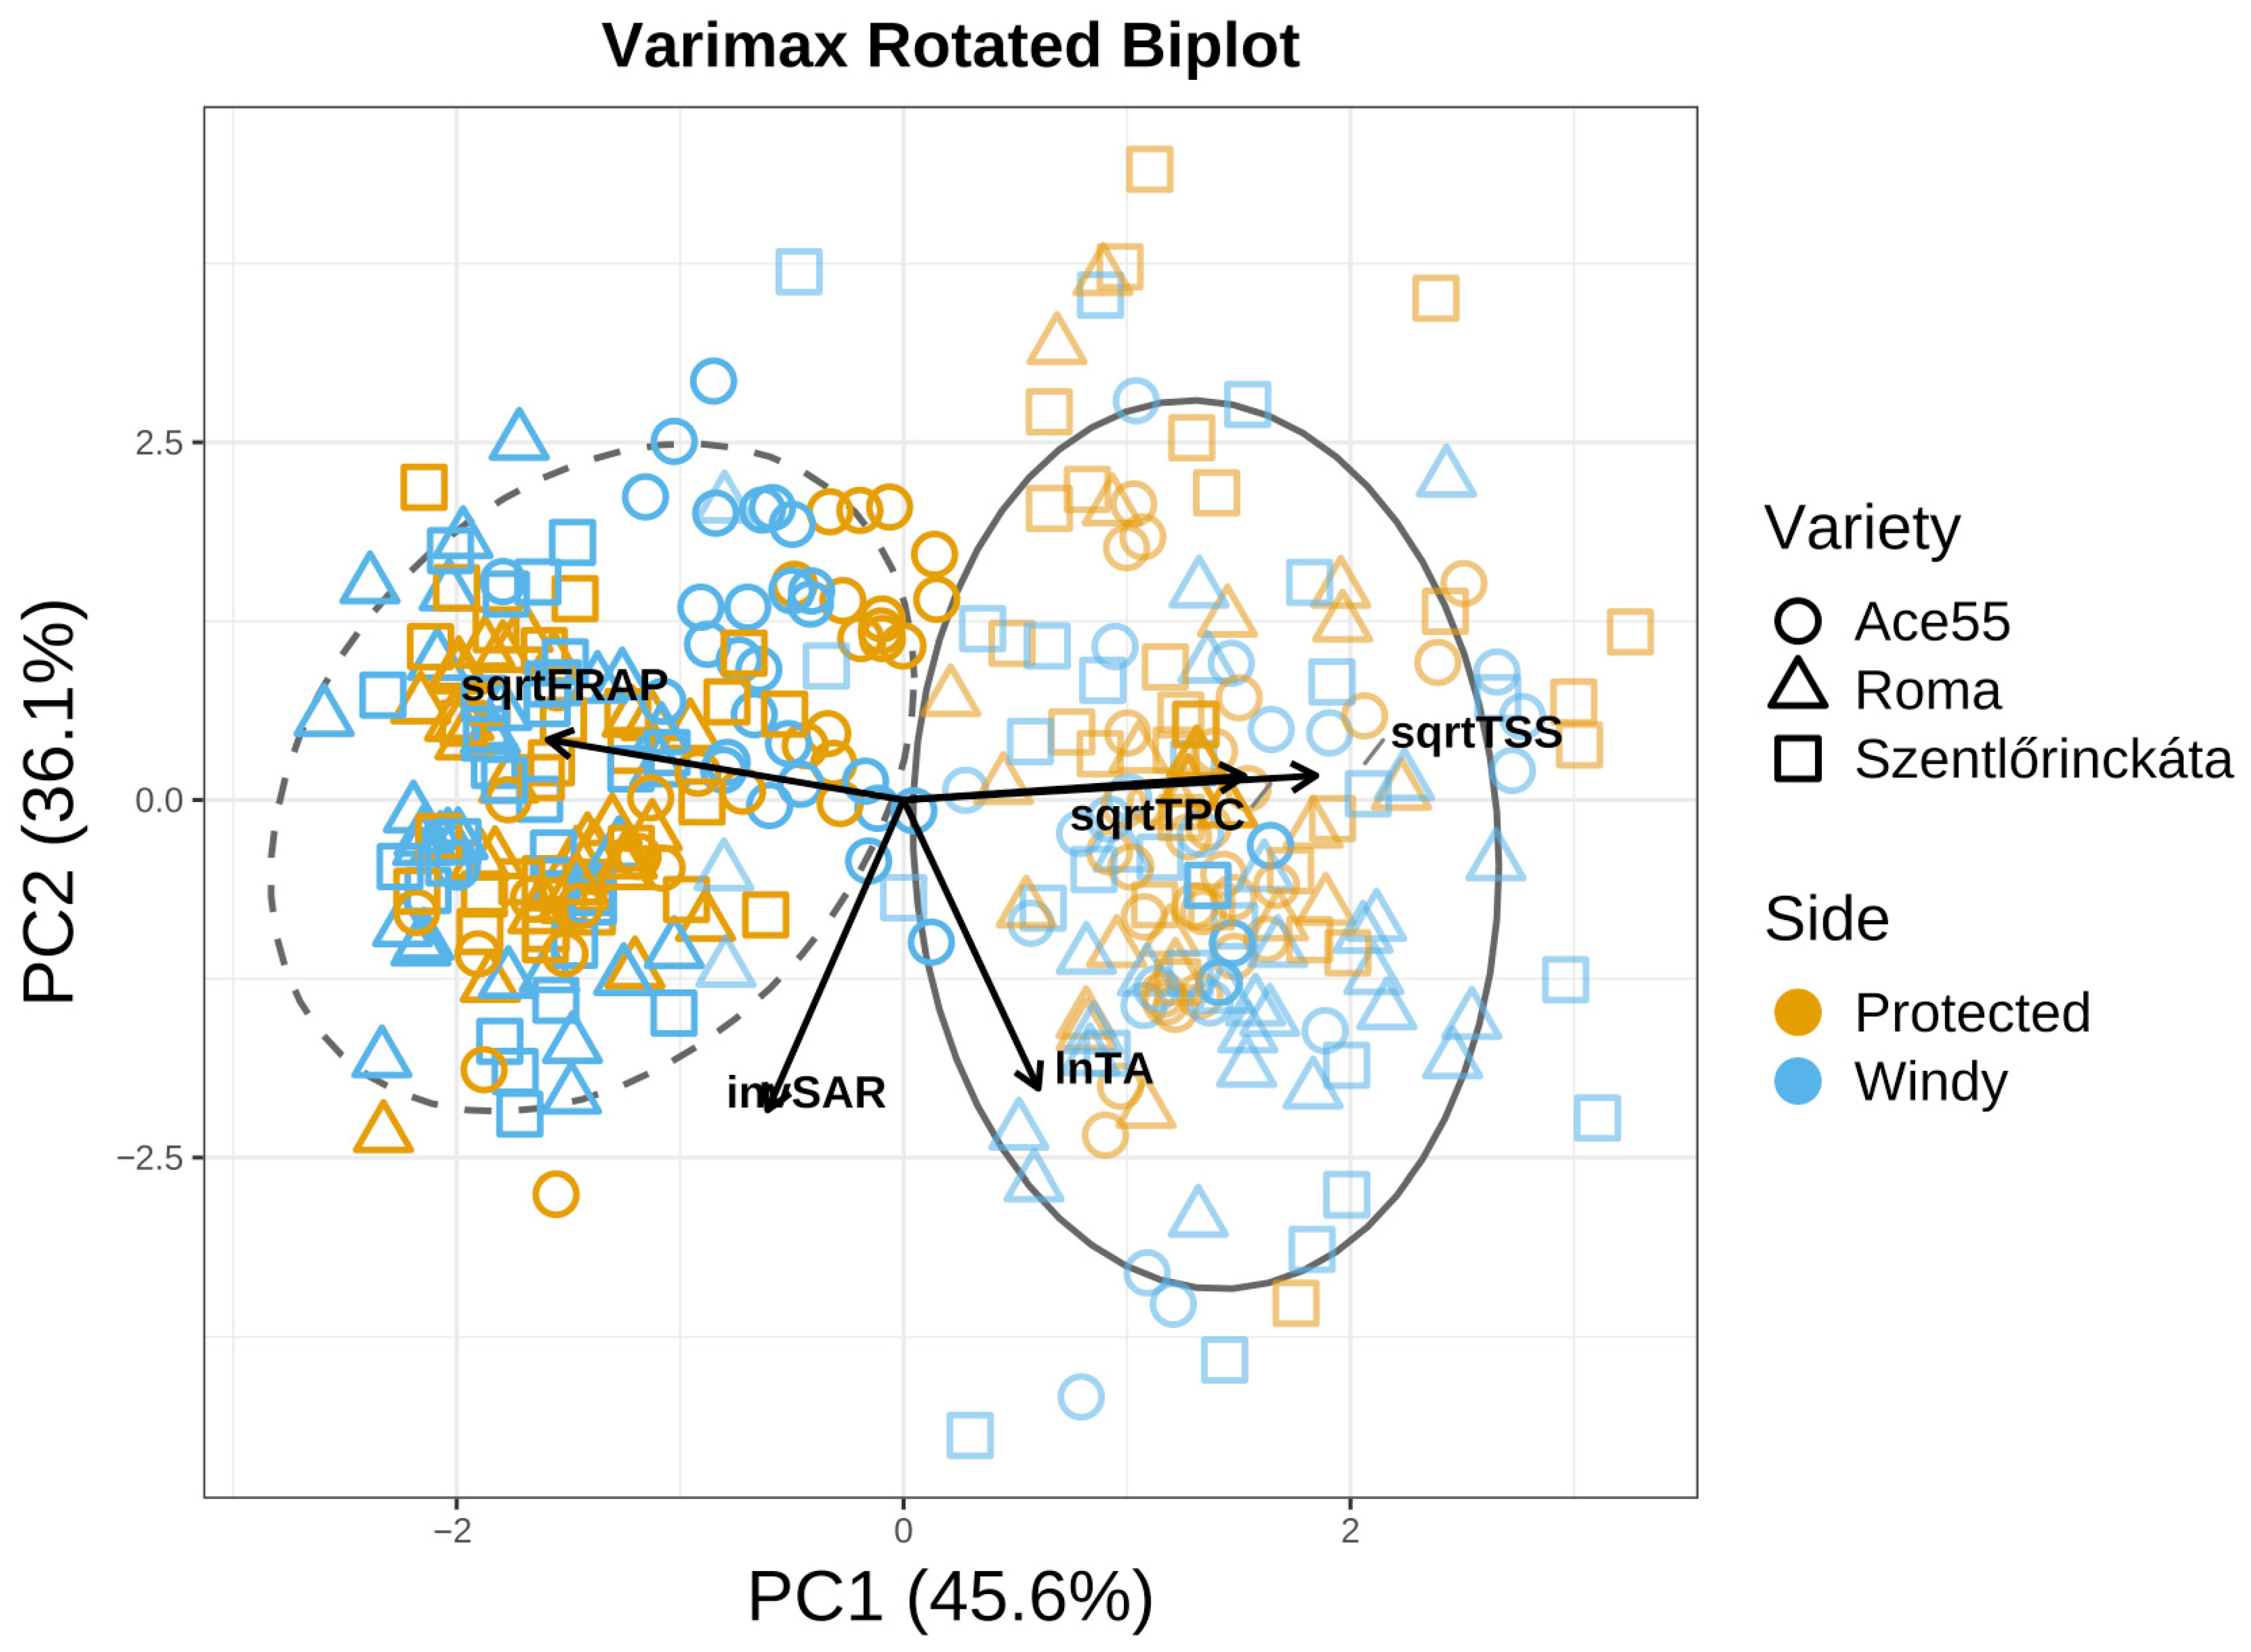
In the case of the combined dataset (2023–2024, Figure 10), the PCA extracted two principal components explaining a robust 47.10 + 34.67 = 81.77% of the total variance. Rotated Component 1 (PC1, 45.6% post-rotation variance) was characterized by strong positive loadings for sqrtTSS (0.615) and sqrtTPC (0.508) and negative loadings for sqrtFRAP (−0.531). Rotated Component 2 (PC2, 36.1% post-rotation variance) was dominated by acidity and salt-stress-related traits, with strong negative loadings for invSAR (−0.723) and lnTA (−0.672).
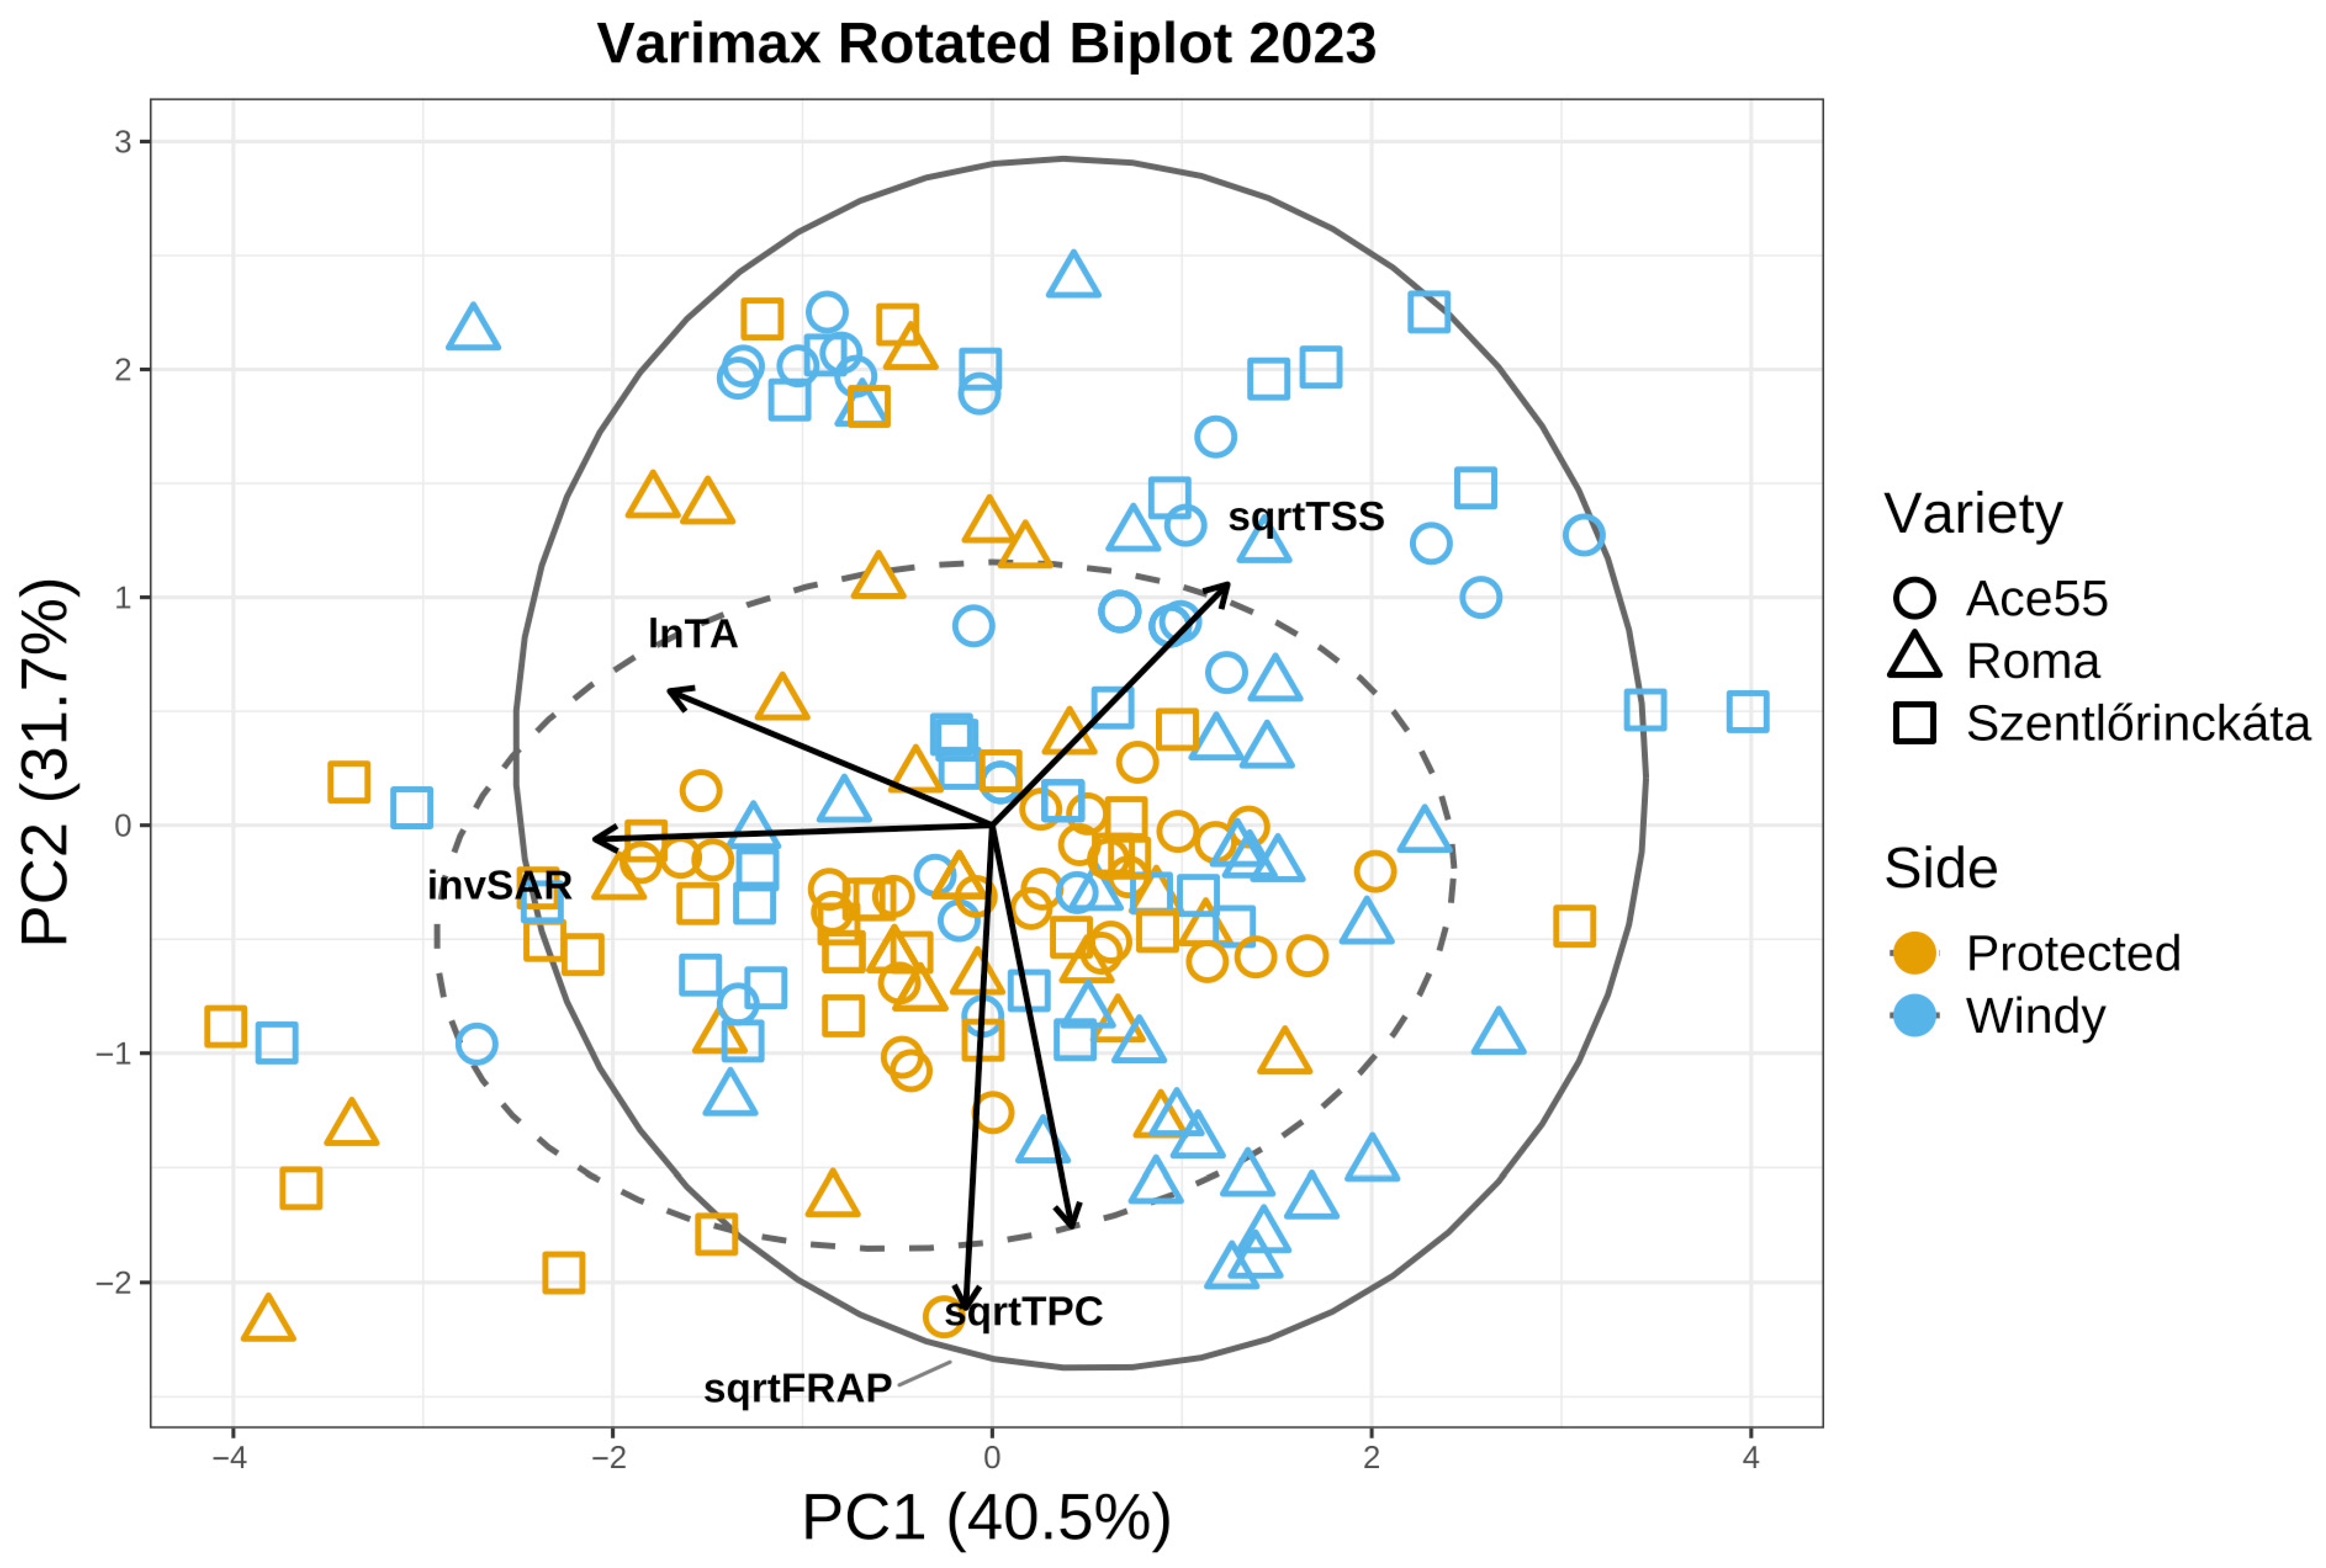
The biplot reveals a clear separation between the two years (Figure 10). Results of the year 2023 are clustered tightly in the left quadrants. This position is associated with higher FRAP values and lower TSS and TPC values. The tight clustering indicates that the abiotic factor in that year produced a consistent, predictable chemical profile. Results for 2024 showed high dispersion across the right quadrants. These samples exhibit lower FRAP, TSS, and TPC values. The spread suggests that the conditions introduced this year caused environmental stress, leading to unpredictable fluctuations in the fruit’s chemical profile. The first two components of the year 2023 explained 41.32 + 30.89 = 72.21% of the variance. Rotated Component 1 (PC1, 40.5% post-rotation variance) was characterized by strong positive loadings for sqrtTSS (0.413) and negative loadings for invSAR (−0.698) and lnTA (−0.567). Rotated Component 2 (PC2, 31.7% post-rotation variance) was dominated by sqrtFRAP and sqrtTPC, with strong negative loadings (−0.704 and −0.585, respectively) (Figure 11).
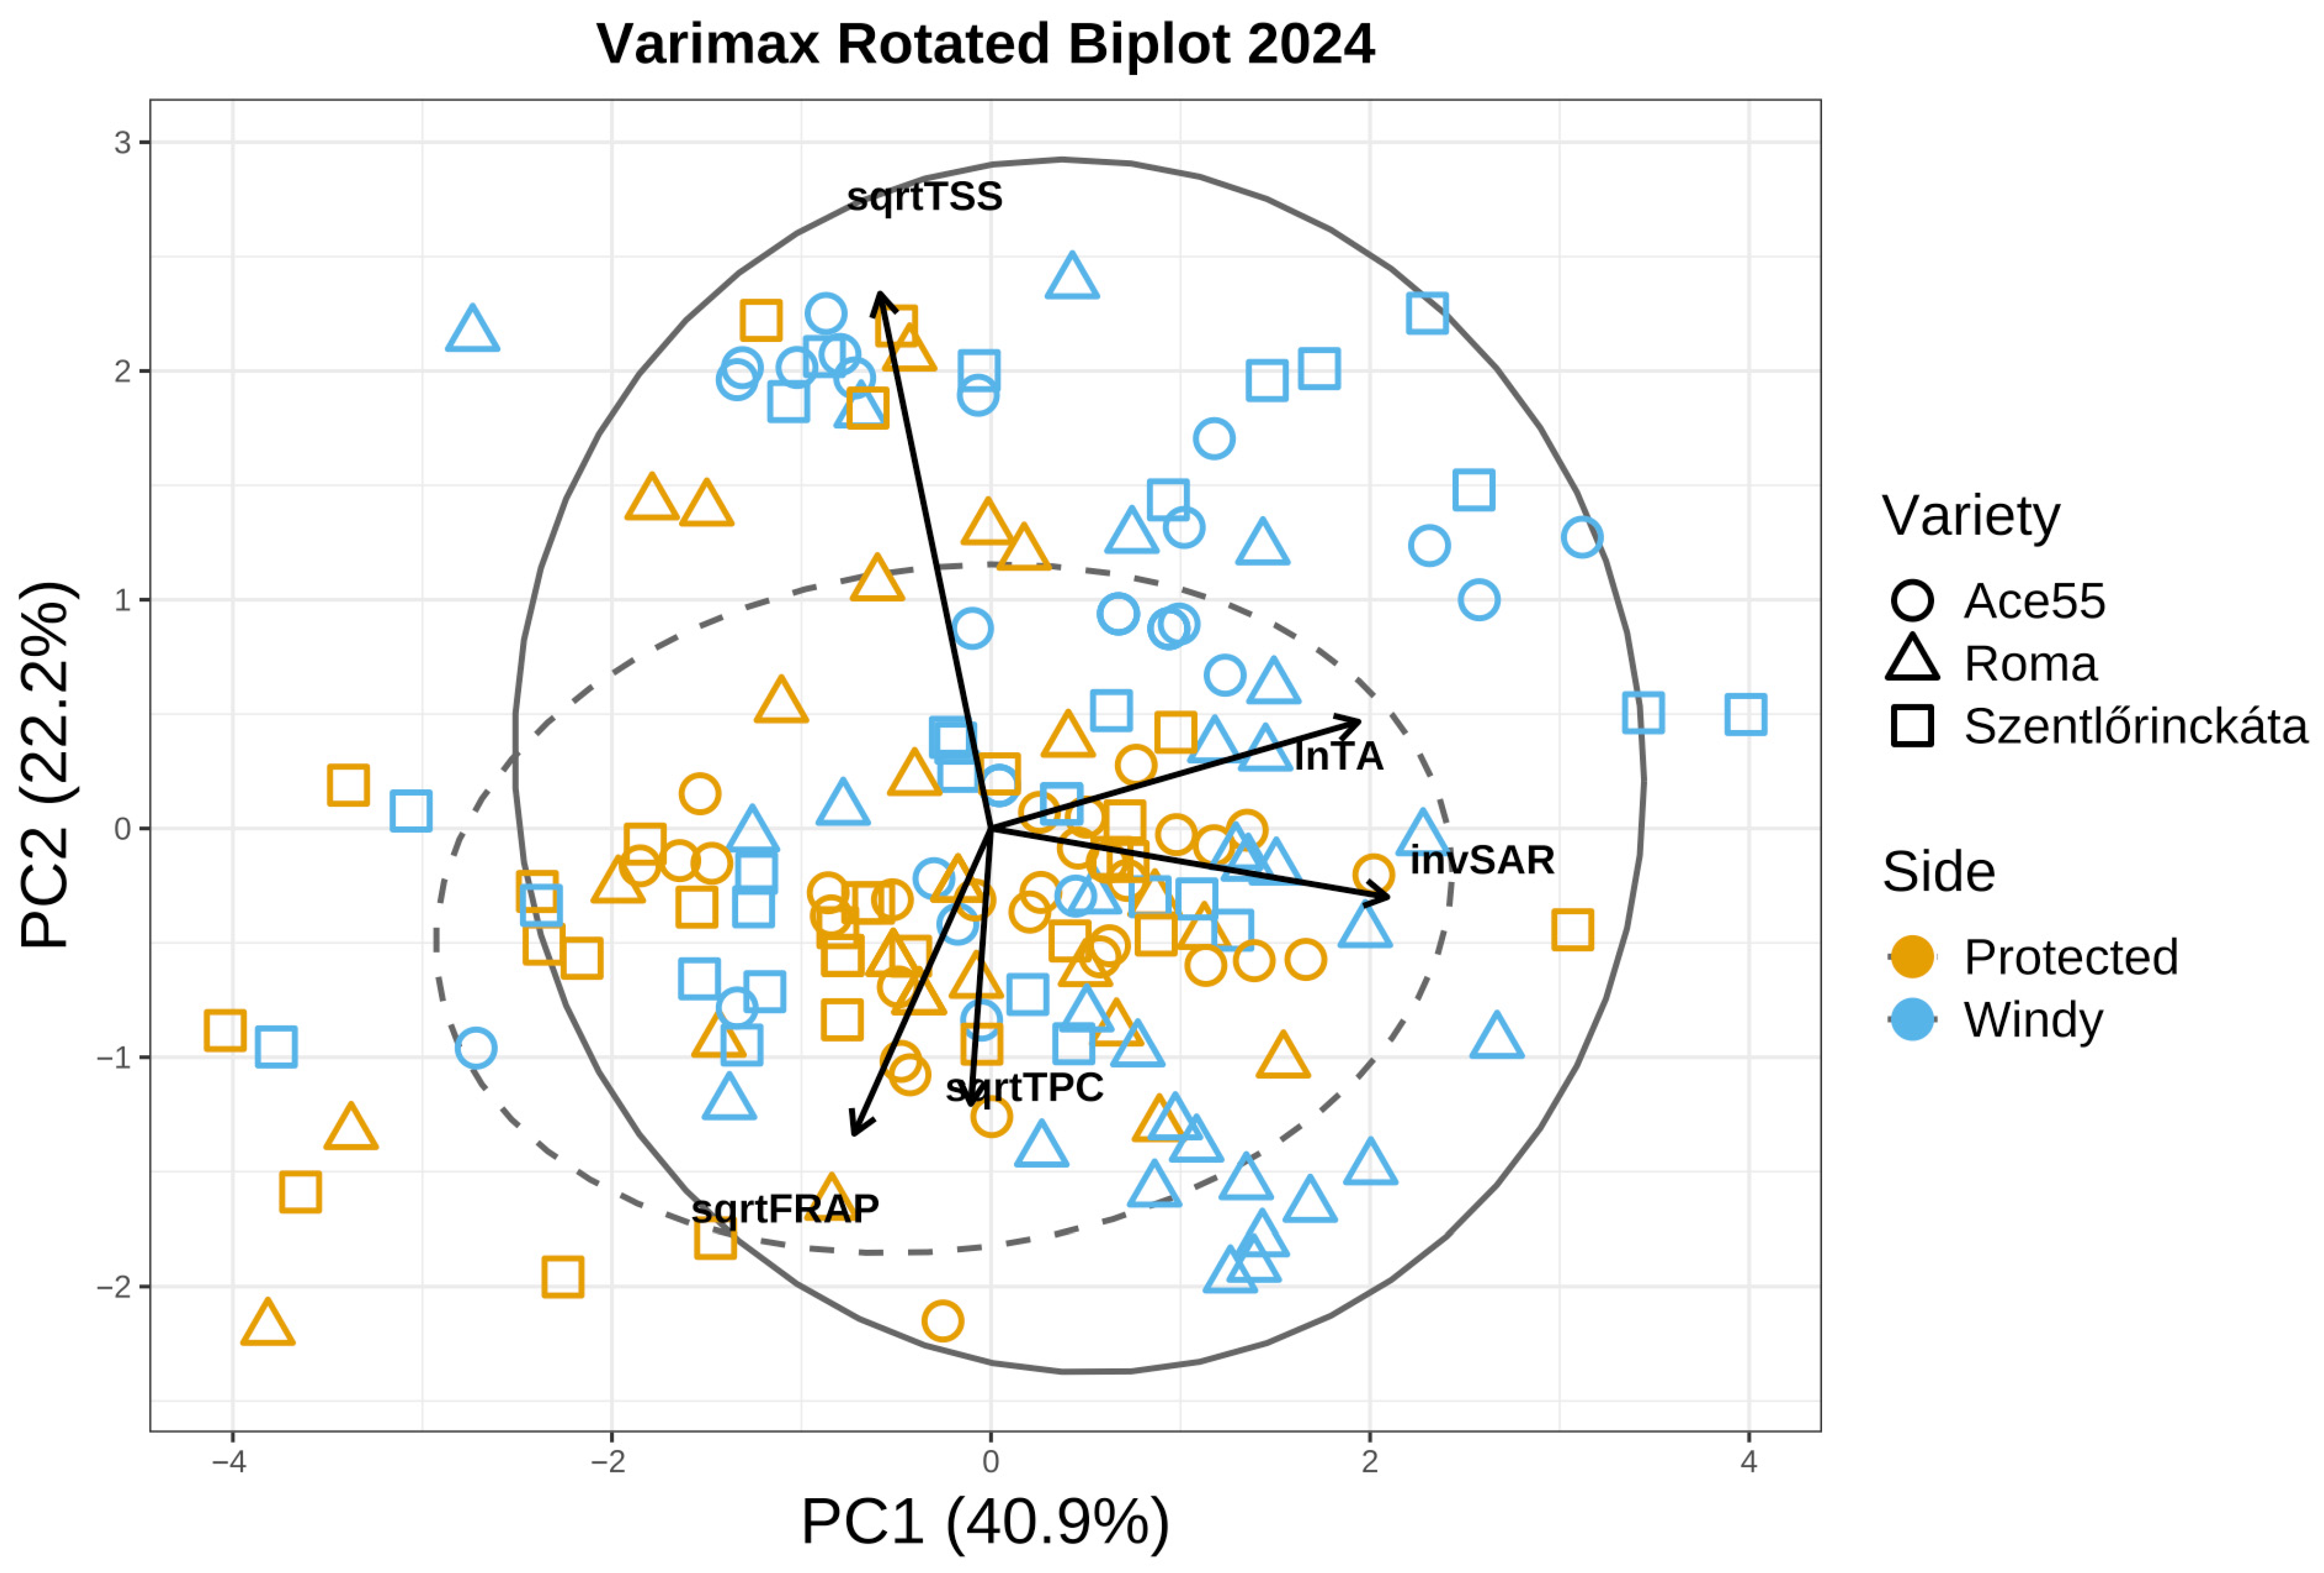
The separation between protected and windy samples (Figure 11) was most distinct in 2023. Windy samples showed stronger alignment with increased TPC and FRAP, while protected samples showed higher TSS and TA values, confirming that in 2023, the protected environment yielded tomatoes with significantly distinct acidity and sugar profiles compared to the windy condition. The first two components of the year 2024 explained 41.25 + 21.81 = 63.06% of the variance (Figure 12). Rotated Component 1 (PC1, 40.9% post-rotation variance) was characterized by strong positive loadings for sqrtTA (0.413) and inSAR (0.697). Rotated Component 2 (PC2, 22.2% post-rotation variance) was dominated by strong positive loadings for sqrtTSS (0.779), while sqrtFRAP and sqrtTPC resulted in strong negative loadings (−0.445 and −0.401, respectively).
In contrast to 2023, the 2024 data showed reduced separation between the protected and windy groups. While the protected samples were still clustered centrally, the windy samples overlapped and spread significantly. The vector for sqrtTSS in 2024 points almost orthogonally away from invSAR and lnTA, visually confirming the low KMO statistics. This indicates that in 2024, sugar content (TSS) varied independently of acidity and stress response mechanisms, likely due to seasonal environmental factors that affected fruit maturation differently than in 2023. Despite the low sampling adequacy (KMO) driven by the independent behavior of Total Soluble Solids (TSS) and Sugar–Acid Ratio (SAR), the PCA successfully condensed the multivariate data, explaining over 60% of the variance across datasets. The analysis confirms that growing condition (protected or windy) is a primary driver of chemical variance. The protected condition yields a more stable fruit profile. Conversely, windy conditions induce a high-stress, high-variability response, resulting in dispersed chemical profiles. The difference in separation quality between 2023 and 2024 suggests a year × treatment interaction, where the environmental distinctiveness of the windy side was dampened in the 2024 season (Figure 12).

4. Discussion

The comparative performance of the three tomato genotypes, Roma, Ace55, and Szentlőrinckáta, under ten distinct microclimatic conditions (windy and protected sides, hedgerow distances) and two harvest timings reveals critical genotype × environment and time interactions influencing fruit quality traits. This study presents a comprehensive evaluation of total soluble solids, titratable acid, Sugar–Acid Ratio, TPC, FRAP responses, Chroma, and Hue indices across two consecutive growing years. The average temperatures of a hedgerow varied between the windy and protected sides, with the protected side showing a higher average deviation of +3.54 °C. The hedge effect benefits the protected side, with an average increase of +1.04 °C at a distance P5. In both seasons (2023–2024), May was the coldest month, while July was the hottest, with the widest temperature ranges occurring at P4 and W5, at the greatest distances from the hedge, indicating greater exposure to temperature fluctuations at greater distances. However, hedgerows significantly stabilize microclimates and positively influence soil physical, biological, and chemical properties, with the protected side exhibiting higher nutrient levels, increased average temperatures, and reduced fluctuations compared to the windy side [51,52].
The CIELAB color space parameters (L*, a*, b*) are critical indicators of tomato fruit quality, particularly in terms of consumer preference and ripeness. Chroma (C*) and Hue angle are closely related to pigment accumulation, with Chroma generally increasing during ripening and the Hue angle decreasing (approaching 40°) in fully mature fruits, as reported by previous studies [53]. These parameters are also influenced by genotypes. In the present study, Roma demonstrated a Chroma value of 39.71 at W3 in the first year, while in the second year, a higher Chroma was observed on the protected side at P2 (38.11). Ace55 displayed similarly raised Chroma values, demonstrated at P4 (36.93) and W5 (35.12). Szentlőrinckáta exhibited the highest Chroma (39.44 at W4), indicating potential instability in pigment development under certain environmental conditions [54]. Hue angle stability was most consistently maintained in Roma in the first year at P2 (51.27 °) and Ace55 on the protected side at P3 (53.06 °), particularly during the first harvest [55]. Hue and Chroma values reflect a highly saturated fruit color, with a strong association between these parameters. No significant differences were detected among distances or sides, suggesting that the presence of a hedge did not markedly affect fruit coloration. However, genotypic variation contributed substantially to color differences among cultivars, as reported by the study findings [55,56].
Total Soluble Solids (TSS) are influenced by genotype and environment, with significant heritability estimates for lycopene content and total titratable acid [57], followed by a more consistent genotype-specific pattern. Ace55 outperformed Roma and Szentlőrinckáta genotypes in absolute TSS values [58,59], particularly under windy conditions in the first year, Roma demonstrated comparatively low TSS on the windy side, at distances W2 (6.70 °Bx) and W5 (6.67 °Bx), while W1 (7.00 °Bx) recorded the highest values during the second harvest, indicating localized improvements despite the overall trend. The second year yielded reduced TSS levels across all genotypes, though second harvests frequently demonstrated late-stage gains, such as P2 (5.23 °Bx) and P5 reaching (5.73 °Bx) for Ace55. Roma and Szentlőrinckáta showed more moderate TSS results, with protected-side rows performing best on P2–W3. However, our result agrees with the study that explores the impact of variety on the quality of tomatoes stored under ambient conditions [60]. Titratable Acidity (TA) patterns highlighted Roma’s strength in acid retention [12], particularly on the protected side of P3 (0.59%) in the second year. TA values increased prominently at W3 (0.71%) and W1 (0.68%), indicating strong wind-induced acid retention. Ace55’s TA decreased sharply in the second harvests, consistent with sugar-dominant maturation, with protected side values peaking at P3 (0.61%) and declining at P4 (0.48%), highlighting the advantage of early harvest. Windy plots substantiated more volatility, with W5 (0.52 ± 0.03%) losing acid rapidly, while Szentlőrinckáta recorded moderate TA at P3 (0.60%), especially under second-year conditions. TA at W3 (0.67%) was erratic, and W1 and W5 recorded no yield. These results support research findings that protected conditions yield more acidic fruits with higher Titratable Acidity than those produced in open fields [61].
According to recent research, tomatoes grown under protected conditions generally exhibit superior quality traits, higher TSS, and higher ascorbic acid levels than those grown under open conditions [12,62]. The Sugar–Acid Ratio (SAR), a critical quality index, aligned predictably with genotypic strengths. Roma achieved balanced profiles on the protected side, with distances P3 (10.38) in the second year and W1 (12.12) delivering the highest values. Ace55 again benefited from the second harvest timing, with consistent SAR improvements between harvests. Szentlőrinckáta confirmed high potential but high differences, with extremes ranging from 13.05 to 15.52, as a result of finding that high sugar and acid content in tomato cultivars can yield favorable taste [63].
Roma demonstrated higher FRAP under windy conditions in both years, with distances W4 and W5 being the most active positions in the second year (24.17 mg AAE 100 g−1 at W4). However, these results were accompanied by increased inconsistency and sharp post-harvest declines at W4 in the second harvest. The protected side showed lower, but more stable, FRAP levels. FRAP values increased 2.1–2.8-fold, with optimal accumulation shifting from hedge distances (W1, P1) in the first year to mid-distances (P3, W3) in the second year. Consistent with these findings, other studies have reported significant results in higher FRAP under open-field conditions. However, the effect of the side was not statistically significant, suggesting that specific environmental factors may not exert a major influence on FRAP levels when comparing open-field and polytunnel-grown tomatoes [64,65,66].
Research indicates that environmental stress, such as high temperatures and solar radiation, can enhance the phytonutrient content and antioxidant capacity of tomatoes, especially in low-tech greenhouses [67]. Ace55 displayed a distinct pattern. Unlike Roma, this genotype consistently showed higher FRAP in the second harvests, with significant late season increases observed in both years. Importantly, the second year exhibited larger relative gains between harvests. P4 rose from 4.04 to 10.45 mg AAE 100 g−1. Wind exposure enhanced FRAP activity, particularly at mid-distances. This reversed trend, favoring late-season antioxidant gains, was unique among genotypes and highlights Ace55’s adaptive metabolic plasticity. However, environmental factors may influence variations in antioxidant activity among tomato varieties, as attributed to the varietal factor [68,69]. Szentlőrinckáta exhibited strong interannual variation. While the first year identified a positive wind effect with FRAP results in higher values, the second year saw declines as steep as in the second harvests at W5 (13.77 to 1.66 mg AAE 100 g−1). These findings reflect the study of climate on yield, quality, and climate suitability and a high environmental sensitivity and suggest potential genotype × environment interactions that impair antioxidant resilience under fluctuating stress conditions [59].
Tomato antioxidants exhibit significant variability across cultivars, and environmental factors and agricultural techniques influence antioxidant levels, with temperature playing a crucial role in lycopene biosynthesis [13]. However, the correlation between TPC and antioxidant activity is not always robust, indicating the necessity for multiple assays to accurately evaluate antioxidant properties [65,70]. Previous results indicated that cultivar and climatic conditions significantly influenced tomato TPC [71]. Roma tomatoes demonstrated significantly higher TPC values on the windy side in the first year, recorded at W5 (144.00 mg GAE 100 g−1), while the protected side remained more stable but lower at P1 (135.33 ± 12.10). Ace55 followed a similar pattern, with the highest values at W5 (145.33 mg GAE 100 g−1), though W4 (79.67 mg GAE 100 g−1) consistently represented lower TPC across genotypes. Szentlőrinckáta displayed both the highest absolute TPC values and the least inconsistency, reaching at P1 (158.17 mg GAE 100 g−1), and significantly different TPC values between positions (p < 0.05). Distinctively, second-year results marked a significant result, particularly for Ace55, which recorded an exceptional value at P2 (188.33 mg GAE 100 g−1), nearly tripling its previous maximum. Szentlőrinckáta also attained increased TPC in the second year, especially at P2 (192.50 mg GAE 100 g−1) and at W3 (151.67 mg GAE 100 g−1). However, a consistent trend was observed across all genotypes: TPC values declined in the second harvest, highlighting the temporal sensitivity of phenolic compound biosynthesis. This observation aligns with findings of [70], who reported weak correlations between antioxidant activity and polyphenol content across seven tomato cultivars, suggesting a strong influence of genotype and environmental stress on phenolic expression [72]. While physiological stress markers were not directly measured, our FRAP and TPC results suggest possible activation of antioxidant pathways, aligning with responses to microclimatic stress reported in similar studies [73,74]. Genotype–microclimate interactions significantly influence tomato quality traits [75,76]. Ace55 responded dynamically to wind exposure, enhancing antioxidant and sugar levels late in the season. Roma remained compositionally stable but expressed susceptibility to pigment loss. Szentlőrinckáta exhibited strong spatial adaptability with consistent phenolic accumulation, particularly at terminal distances [77]. These patterns indicate that temperature and wind modulate physiological responses, driving variation in sugars, phenolics, and antioxidant compounds across genotypes. Temperature, in particular, influences fruit quality through genotype-specific metabolic adjustments, where heat stress can reduce fruit size and firmness but enhance soluble solids and antioxidant content depending on genotype [11,78,79]. Wind may further interact with these responses by altering transpiration and plant stress levels. Together, these findings highlight the importance of genotype selection in optimizing hedgerow-based agroforestry systems under varying microclimatic conditions. However, PCA of tomato quality traits indicated that variation was mainly governed by sugar–phenolic attributes versus acidity and stress-related responses [80,81], with a clear separation between protected and windy sides of the hedgerow in 2023, whereas in 2024 this distinction weakened due to higher environmental stress and variability, confirming a year × treatment interaction.

5. Conclusions

Agroforestry systems such as hedgerows play a crucial role in enhancing environmental stability and climate resilience in tomato production systems by generating distinct microclimatic conditions. The presence of hedgerow windy and protected sides influences key microclimatic factors, particularly temperature regulation across distance gradients. The protected side was significantly warmer, with an average deviation of +0.38 °C, compared to the windy side across both years, showing the hedgerows’ buffering effect across seasons. The study confirms that wind exposure enhances antioxidant metrics but intensifies fluctuations and pigment instability, indicating a clear trade-off in fruit quality responses driven by microclimatic conditions. The protected side and distances provide better consistency in TSS, acidity, and Hue. Spatial position also plays a role, with midfield distances (P3–P4, W3–W4) consistently yielding the highest-quality outcomes across metrics. The observed genotypes with hedgerow environment and time interactions provide critical guidance for precision agriculture for practical applications, showing that temperature and wind interact with genotypes to regulate key physiological processes affecting sugars, phenolics, and antioxidant compounds. These interactions lead to genotype-dependent differences in fruit quality traits under variable microclimatic conditions. Ace55 is ideal for systems targeting extended harvests and high sugars; Roma is suited to early harvests expressing acid-rich profiles; and Szentlőrinckáta requires protected sides of hedgerows with carefully timed harvests to capitalize on its phenolic and fruit-quality potential. Tomato plants respond differently to the varying microclimates created by hedgerows for the mitigation of abiotic stress factors, with these responses closely tied to their genetic traits. Protected positions generally stabilized acidity, flavor, and antioxidant traits, while windy sides increased variability. Selecting the most suitable variety is essential for successful cultivation in vegetable agroforestry systems, especially when aiming to optimize fruit quality. PCA revealed that tomato quality was driven by hedgerow exposure, with protected sides showing greater stability and seasonal stress weakening this effect in 2024.

Author Contributions

Conceptualization, M.M. (Mohammed Mustafa) and L.C.; methodology, M.M. (Mohammed Mustafa) and L.C.; formal analysis and data visualization, M.L.; investigation, M.M. (Mónika Máté), G.S., G.V. and G.F.; writing—original draft preparation, M.M. (Mohammed Mustafa) and L.C.; supervision, L.C. and Z.S. All authors have read and agreed to the published version of the manuscript.

Funding

This research received no external funding.

Data Availability Statement

The original contributions presented in this study are included in the article. Further inquiries can be directed to the corresponding author.

Acknowledgments

M.M. (Mohammed Mustafa) thanks for the support of the Stipendium Hungaricum Scholarship. L.C. is grateful for the support of the Research Excellence Program of the Hungarian University of Agriculture and Life Sciences.

Conflicts of Interest

Author Mohammed Mustafa was employed by the company Agriculture Research Corporation (ARC). The remaining authors declare that the research was conducted in the absence of any commercial or financial relationships that could be construed as a potential conflict of interest.

Abbreviations

The following abbreviations are used in this manuscript:
CIECommission Internationale de l’Éclairage
DWDistilled Water
FRAPFerric-Reducing Antioxidant Power
PProtected
SARSugar–Acid Ratio
SDStandard Deviation
TATitratable Acidity
TACTotal Antioxidant Capacity
TPCTotal Phenolic Content
TSSTotal Soluble Solids
WWindy

Appendix A

Table A1. Mean ± standard deviation and post hoc results for the first and second harvest of tomato fruit in terms of Sugar–Acid Ratio (SAR) analysis in (2023–2024). Results (mean ± SD) of tomato samples from two harvests, showing interaction plots for plants grown at varying distances (W1–W5, windy side; P1–P5, protected side) from a hedgerow in Soroksár, Hungary. Different lowercase letters indicate significant differences among distances (p < 0.05) within side and variety. Different uppercase letters indicate significant differences among varieties within side and distance (p < 0.05). Asterisks indicate significant differences between the two sides among the distances within a variety (p < 0.05).
VarietyDistancesSugar–Acid Ratio (SAR), 2023Sugar–Acid Ratio (SAR), 2024
Roma First harvestSecond harvest First harvestSecond harvest
P58.83 ± 0.06 AB7.73 ± 0.69 Aa10.59 ± 1.84-
P49.83 ± 1.039.43 ± 0.96 ab10.57 ± 3.3911.41 ± 2.00
P39.21 ± 1.1110.38 ± 0.38 b11.69 ± 2.1410.80 ± 1.06
P29.11 ± 0.84 AB10.28 ± 0.65 b8.38 ± 0.6915.33 ± 4.10
P19.76 ± 0.84 AB9.62 ± 1.15 ab--
W19.88 ± 1.21 AB10.92 ± 1.089.17 ± 0.51 A12.12 ± 4.28
W29.56 ± 1.019.31 ± 1.07 A10.32 ± 2.839.36 ± 0.82
W38.87 ± 0.93 A8.40 ± 0.47 A7.79 ± 0.51 A7.83 ± 0.75
W47.68 ± 0.41 A10.76 ± 2.328.20 ± 0.189.90 ± 2.01
W59.85 ± 0.78 B8.11 ± 0.94 A8.94 ± 0.6910.53 ± 2.43
Ace55P513.73 ± 0.79 B*7.94 ± 0.51 Aa10.34 ± 0.76 b9.47 ± 0.92 ab
P412.04 ± 1.929.70 ± 1.14 ab10.99 ± 3.09 ab9.98 ± 0.44 ab*
P311.83 ± 1.028.25 ± 1.28 ab8.08 ± 0.49 a12.18 ± 1.64 ab
P212.71 ± 0.72 B10.02 ± 0.14 b10.67 ± 2.85 ab9.26 ± 0.64 a
P112.15 ± 0.18 B9.24 ± 0.45 ab9.91 ± 0.39 ab12.40 ± 1.07 b
W112.48 ± 1.10 B9.34 ± 1.5612.48 ± 0.68 B*-
W29.98 ± 0.2813.66 ± 1.44 B*12.51 ± 0.50-
W312.45 ± 1.15 B11.19 ± 1.139.96 ± 0.65 B*-
W410.59 ± 0.36 B10.98 ± 0.9410.19 ± 1.206.84 ± 0.34
W59.81 ± 0.82 B13.04 ± 1.41 B*12.78 ± 3.118.98 ± 0.06
SzentlőrinckátaP59.69 ± 1.10 A11.02 ± 0.83 B12.28 ± 2.0412.89 ± 0.89 b*
P48.62 ± 0.219.92 ± 0.6313.50 ± 3.528.51 ± 1.60 ab
P39.05 ± 1.368.85 ± 0.9016.35 ± 5.4110.63 ± 1.54 ab
P210.43 ± 0.95 AB9.48 ± 1.2814.29 ± 4.839.73 ± 0.64 a
P18.92 ± 0.74 A11.15 ± 1.1914.77 ± 3.62-
W18.70 ± 0.41 Ab11.28 ± 0.2611.48 ± 1.19 AB-
W28.90 ± 0.72 ab8.83 ± 0.20 Aa15.52 ± 4.109.09 ± 2.66
W39.33 ± 1.29 ABab10.29 ± 0.06 Bb10.49 ± 2.49 AB8.89 ± 3.42
W48.28 ± 0.65 Aab10.84 ± 0.91 ab9.86 ± 2.0410.17 ± 2.29
W57.26 ± 0.35 Aa10.01 ± 0.51 ABab13.29 ± 4.939.28 ± 1.85

References

  1. Mustafa, M.; Mwangi, R.W.; Szalai, Z.; Kappel, N.; Csambalik, L. Sustainable Responses to Open Field Tomato (Solanum lycopersicum L.) Stress Impacts. J. Agric. Food Res. 2025, 21, 101825. [Google Scholar] [CrossRef]
  2. Gautier, H.; Diakou-Verdin, V.; Bénard, C.; Reich, M.; Buret, M.; Bourgaud, F.; Poëssel, J.L.; Caris-Veyrat, C.; Génard, M. How Does Tomato Quality (Sugar, Acid, and Nutritional Quality) Vary with Ripening Stage, Temperature, and Irradiance? J. Agric. Food Chem. 2008, 56, 1241–1250. [Google Scholar] [CrossRef]
  3. Solieman, T.H.I.; El-Gabry, M.A.H.; Abido, A.I. Heterosis, Potence Ratio and Correlation of Some Important Characters in Tomato (Solanum lycopersicum L.). Sci. Hortic. 2013, 150, 25–30. [Google Scholar] [CrossRef]
  4. Bianchi, A.R.; Vitale, E.; Guerretti, V.; Palumbo, G.; De Clemente, I.M.; Vitale, L.; Arena, C.; De Maio, A. Antioxidant Characterization of Six Tomato Cultivars and Derived Products Destined for Human Consumption. Antioxidants 2023, 12, 761. [Google Scholar] [CrossRef]
  5. Amr, A.; Raie, W. Tomato Components and Quality Parameters. A Review. Jordan J. Agric. Sci. 2022, 18, 199–220. [Google Scholar] [CrossRef]
  6. Agius, C.; von Tucher, S.; Poppenberger, B.; Rozhon, W. Quantification of Sugars and Organic Acids in Tomato Fruits. MethodsX 2018, 5, 537–550. [Google Scholar] [CrossRef] [PubMed]
  7. Djibrilla, A.S.M.; Rabani, A.; Illyassou, K.M.; Issa, S.M.; Abdourahimou, K.N.; Abdoulkader, A.H.; Aissetou, D.Y. Improving Tomatoes Quality in the Sahel through Organic Cultivation under Photovoltaic Greenhouse as a Climate Change Adaptation and Mitigation Strategy. Sci. Rep. 2024, 14, 19396. [Google Scholar] [CrossRef] [PubMed]
  8. Mustafa, M.; Szalai, Z.M.; Csambalik, L. Nutritional Quality Parameters of Tomato Genotypes in a Hedgerow System. Prog. Agric. Eng. Sci. 2023, 19, 113–122. [Google Scholar] [CrossRef]
  9. Ruggieri, V.; Calafiore, R.; Schettini, C.; Rigano, M.M.; Olivieri, F.; Frusciante, L.; Barone, A. Exploiting Genetic and Genomic Resources to Enhance Heat-Tolerance in Tomatoes. Agronomy 2019, 9, 22. [Google Scholar] [CrossRef]
  10. Mamatha, H.; Srinivasa Rao, N.K.; Laxman, R.H.; Shivashankara, K.S.; Bhatt, R.M.; Pavithra, K.C. Impact of Elevated CO2 on Growth, Physiology, Yield, and Quality of Tomato (Lycopersicon esculentum Mill) Cv. Arka Ashish. Photosynthetica 2014, 52, 519–528. [Google Scholar] [CrossRef]
  11. Morandin, L.A.; Long, R.F.; Kremen, C. Hedgerows Enhance Beneficial Insects on Adjacent Tomato Fields in an Intensive Agricultural Landscape. Agric. Ecosyst. Environ. 2014, 189, 164–170. [Google Scholar] [CrossRef]
  12. Rana, N.; Kumar, M.; Walia, A.; Sharma, S. Tomato Fruit Quality under Protected Environment and Open Field Conditions. Int. J. Bio-Resour. Stress Manag. 2014, 5, 422–426. [Google Scholar] [CrossRef]
  13. Dumas, Y.; Dadomo, M.; Di Lucca, G.; Grolier, P. Effects of Environmental Factors and Agricultural Techniques on Antioxidant Content of Tomatoes. J. Sci. Food Agric. 2003, 83, 369–382. [Google Scholar] [CrossRef]
  14. Jimenez, A.; Creissen, G.; Kular, B.; Firmin, J.; Robinson, S.; Verhoeyen, M.; Mullineaux, P. Changes in Oxidative Processes and Components of the Antioxidant System during Tomato Fruit Ripening. Planta 2002, 214, 751–758. [Google Scholar] [CrossRef]
  15. Moco, S.; Bino, R.J.; Vorst, O.; Verhoeven, H.A.; de Groot, J.; van Beek, T.A.; Vervoort, J.; Ric de Vos, C.H. A Liquid Chromatography-Mass Spectrometry-Based Metabolome Database for Tomato. Plant Physiol. 2006, 141, 1205–1218. [Google Scholar] [CrossRef]
  16. Cruz-Chamorro, I.; Santos-Sánchez, G.; Martín, F.; Fernández-Pachón, M.S.; Hornero-Méndez, D.; Cerrillo, I. Evaluation of the Impact of the Ripening Stage on the Composition and Antioxidant Properties of Fruits from Organically Grown Tomato (Solanum lycopersicum L.) Spanish Varieties. Foods 2024, 13, 2337. [Google Scholar] [CrossRef]
  17. Bayili, R.G.; Abdoul-Latif, F.; Kone, O.H.; Diao, M.; Imael, H.; Bassole, N.; Dicko, M.H. Phenolic Compounds and Antioxidant Activities in Some Fruits and Vegetables from Burkina Faso. Afr. J. Biotechnol. 2011, 10, 13543–13547. [Google Scholar] [CrossRef]
  18. Csambalik, L.; Divéky-Ertsey, A.; Pap, Z.; Orbán, C.; Stégerné Máté, M.; Gere, A.; Stefanovits-Bányai, É.; Sipos, L. Coherences of Instrumental and Sensory Characteristics: Case Study on Cherry Tomatoes. J. Food Sci. 2014, 79, 2192–2202. [Google Scholar] [CrossRef]
  19. Bertin, N.; Génard, M. Tomato Quality as Influenced by Preharvest Factors. Sci. Hortic. 2018, 233, 264–276. [Google Scholar] [CrossRef]
  20. Dell’aversana, E.; Cirillo, V.; Van Oosten, M.J.; Di Stasio, E.; Saiano, K.; Woodrow, P.; Ciarmiello, L.F.; Maggio, A.; Carillo, P. Ascophyllum Nodosum Based Extracts Counteract Salinity Stress in Tomato by Remodeling Leaf Nitrogen Metabolism. Plants 2021, 10, 1044. [Google Scholar] [CrossRef]
  21. Arruda de Brito, A.; Campos, F.; dos Reis Nascimento, A.; Damiani, C.; Alves da Silva, F.; de Almeida Teixeira, G.H.; Cunha Júnior, L.C. Non-Destructive Determination of Color, Titratable Acidity, and Dry Matter in Intact Tomatoes Using a Portable Vis-NIR Spectrometer. J. Food Compos. Anal. 2022, 107, 104288. [Google Scholar] [CrossRef]
  22. Nair, P.K.R.; Kumar, B.M.; Nair, V.D. Definition and Concepts of Agroforestry. In An Introduction to Agroforestry; Springer: Cham, Switzerland, 2021; pp. 21–28. [Google Scholar] [CrossRef]
  23. Mustafa, M.; Szalai, Z.; Divéky-Ertsey, A.; Gál, I.; Csambalik, L. Conceptualizing Multiple Stressors and Their Consequences in Agroforestry Systems. Stresses 2022, 2, 242–255. [Google Scholar] [CrossRef]
  24. Montagnini, F.; Nair, P.K.R. Carbon Sequestration: An Underexploited Environmental Benefit of Agroforestry Systems. Agrofor. Syst. 2004, 61–62, 281–295. [Google Scholar] [CrossRef]
  25. Brandle, J.R.; Takle, E.; Zhou, X. Windbreak Practices. In North American Agroforestry, 3rd ed.; ACSESS: Paso Robles, CA, USA, 2022; pp. 89–126. [Google Scholar] [CrossRef]
  26. Nerlich, K.; Graeff-Hönninger, S.; Claupein, W. Agroforestry in Europe: A Review of the Disappearance of Traditional Systems and Development of Modern Agroforestry Practices, with Emphasis on Experiences in Germany. Agrofor. Syst. 2013, 87, 475–492. [Google Scholar] [CrossRef]
  27. Ladux, F.J.; Cecilia Rousseaux, M.; Trentacoste, E.R. Characterization of Light Intensity and Quality, Vegetative, Flowering and Fruiting Traits in High and Super-High Density Olive Hedgerows. J. Saudi Soc. Agric. Sci. 2023, 23, 267–276. [Google Scholar] [CrossRef]
  28. Litza, K.; Alignier, A.; Closset-Kopp, D.; Ernoult, A.; Mony, C.; Osthaus, M.; Staley, J.; Van Den Berge, S.; Vanneste, T.; Diekmann, M. Hedgerows as a Habitat for Forest Plant Species in the Agricultural Landscape of Europe. Agric. Ecosyst. Environ. 2022, 326, 107809. [Google Scholar] [CrossRef]
  29. Sulistyowati, D.; Chozin, M.A.; Syukur, M.; Melati, M.; Guntoro, D. Selection of Shade-Tolerant Tomato Genotypes. J. Appl. Hortic. 2016, 18, 154–159. [Google Scholar] [CrossRef]
  30. Jose, S.; Gordon, A.M. Ecological Knowledge and Agroforestry Design: An Introduction. In Toward Agroforestry Design; Springer: Dordrecht, The Netherlands, 2008; pp. 3–9. [Google Scholar] [CrossRef]
  31. Nair, P.K.R. Agroforestry Systems and Environmental Quality: Introduction. J. Environ. Qual. 2011, 40, 784–790. [Google Scholar] [CrossRef]
  32. Baharuddin, R.; Chozin, M.; Indonesia, M.S.-J.A. Toleransi 20 Genotipe Tanaman Tomat Terhadap Naungan. Indones. J. Agron. 2014, 42, 130–135. [Google Scholar]
  33. Chandra, H.M.; Shanmugaraj, B.M.; Srinivasan, B.; Ramalingam, S. Influence of Genotypic Variations on Antioxidant Properties in Different Fractions of Tomato. J. Food Sci. 2012, 77, C1174–C1178. [Google Scholar] [CrossRef]
  34. Mustafa, M.; Adjei, J.A.; Szalai, Z. Pest and Disease Impact on Tomato Genotypes in a Hedgerow System. Biol. Life Sci. Forum 2023, 27, 47. [Google Scholar] [CrossRef]
  35. Botella, M.Á.; Hernández, V.; Mestre, T.; Hellín, P.; García-Legaz, M.F.; Rivero, R.M.; Martínez, V.; Fenoll, J.; Flores, P. Bioactive Compounds of Tomato Fruit in Response to Salinity, Heat and Their Combination. Agriculture 2021, 11, 534. [Google Scholar] [CrossRef]
  36. Arias, R.; Lee, T.C.; Logendra, L.; Janes, H. Correlation of Lycopene Measured by HPLC with the L*, A*, B* Color Readings of a Hydroponic Tomato and the Relationship of Maturity with Color and Lycopene Content. J. Agric. Food Chem. 2000, 48, 1697–1702. [Google Scholar] [CrossRef]
  37. Tabasi, A.; Nemati, H.; Akbari, M. The Effects of Planting Distances and Different Stages of Maturity on the Quality of Three Cultivars of Tomatoes (Lycopersicon esculentum mill). Not. Bot. Horti Agrobot. Cluj-Napoca 2013, 5, 371–375. [Google Scholar] [CrossRef][Green Version]
  38. Ripoll, J.; Urban, L.; Staudt, M.; Lopez-Lauri, F.; Bidel, L.P.R.; Bertin, N. Water Shortage and Quality of Fleshy Fruits—Making the Most of the Unavoidable. J. Exp. Bot. 2014, 65, 4097–4117. [Google Scholar] [CrossRef]
  39. Wu, M.; Buck, J.S.; Kubota, C. Effects of nutrient solution ec, plant microclimate and cultivars on fruit quality and yield of hydroponic tomatoes (Lycopersicon esculentum). Acta Hortic. 2004, 659, 541–547. [Google Scholar] [CrossRef]
  40. Boziné-Pullai, K.; Csambalik, L.; Drexler, D.; Reiter, D.; Tóth, F.; Bogdányi, F.T.; Ladányi, M. Tomato Landraces Are Competitive with Commercial Varieties in Terms of Tolerance to Plant Pathogens-a Case Study of Hungarian Gene Bank Accessions on Organic Farms. Diversity 2021, 13, 195. [Google Scholar] [CrossRef]
  41. Rácz, É.V.P.; Környei, L. Local Scale Wind Regime Changes and Their Consequences on Sustainability in the Carpathian Basin (Hungary). Chem. Eng. Trans. 2023, 107, 475–480. [Google Scholar] [CrossRef]
  42. Bošković, J.; Prijić, Ž.; Aleksandar, I. Economical and Ecological Impact of Shelterbelts. Econ. Agric. 2010, 57, 51–57. [Google Scholar]
  43. Mcguire, R.G. Reporting of Objective Color Measurements. Hortscience 1992, 27, 1254–1255. [Google Scholar] [CrossRef]
  44. DivékyErtsey, A.; Ladányi, M.; Biró, B.; Máté, M.; Drexler, D.; Tóth, F.; Boziné Pullai, K.; Gere, A.; Pusztai, P.; Csambalik, L. Tomato Landraces May Benefit from Protected Production Evaluation on Phytochemicals. Horticulturae 2022, 8, 937. [Google Scholar] [CrossRef]
  45. Alamo, J.M.; Maquieira, A.; Puchades, R.; Sagrado, S. Determination of Titratable Acidity and Ascorbic Acid in Fruit Juices in Continuous-Flow Systems. Fresenius. J. Anal. Chem. 1993, 347, 293–298. [Google Scholar] [CrossRef]
  46. Benzie, I.F.F.; Strain, J.J. The Ferric Reducing Ability of Plasma (FRAP) as a Measure of “Antioxidant Power”: The FRAP Assay. Anal. Biochem. 1996, 239, 70–76. [Google Scholar] [CrossRef]
  47. Singleton, V.L.; Rossi, J.A. Colorimetry of Total Phenolics with Phosphomolybdic-Phosphotungstic Acid Reagents. Am. J. Enol. Vitic. 1965, 16, 144–158. [Google Scholar] [CrossRef]
  48. Bobo-García, G.; Davidov-Pardo, G.; Arroqui, C.; Vírseda, P.; Marín-Arroyo, M.R.; Navarro, M. Intra-Laboratory Validation of Microplate Methods for Total Phenolic Content and Antioxidant Activity on Polyphenolic Extracts, and Comparison with Conventional Spectrophotometric Methods. J. Sci. Food Agric. 2015, 95, 204–209. [Google Scholar] [CrossRef]
  49. Koné, S. R Core Team: R A Language and Environment for Statistical Computing. R Foundation for Statistical Computing, Vienna, Austria; R Core Team: Vienna, Austria, 2024; Available online: https://www.R-project.org/ (accessed on 1 October 2025).
  50. Stekhoven, D.J.; Bühlmann, P. Missforest-Non-Parametric Missing Value Imputation for Mixed-Type Data. Bioinformatics 2024, 28, 112–118. [Google Scholar] [CrossRef] [PubMed]
  51. Wickham, H. Elegant Graphics for Data Analysis; Springer: New York, NY, USA, 2016; pp. 189–201. [Google Scholar] [CrossRef]
  52. Vanneste, T.; Govaert, S.; Spicher, F.; Brunet, J.; Cousins, S.A.O.; Decocq, G.; Diekmann, M.; Graae, B.J.; Hedwall, P.O.; Kapás, R.E.; et al. Contrasting Microclimates among Hedgerows and Woodlands across Temperate Europe. Agric. For. Meteorol. 2020, 281, 107818. [Google Scholar] [CrossRef]
  53. Stoutjesdijk, P. The open shade, an interesting microclimate. Acta Bot. Neerl. 1974, 23, 125–130. [Google Scholar] [CrossRef]
  54. Ilahy, R.; Siddiqui, M.W.; Tlili, I.; Montefusco, A.; Piro, G.; Hdider, C.; Lenucci, M.S. When Color Really Matters: Horticultural Performance and Functional Quality of High-Lycopene Tomatoes. Crit. Rev. Plant Sci. 2018, 37, 15–53. [Google Scholar] [CrossRef]
  55. Brandt, S.; Pék, Z.; Barna, É.; Lugasi, A.; Helyes, L. Lycopene Content and Colour of Ripening Tomatoes as Affected by Environmental Conditions. J. Sci. Food Agric. 2006, 86, 568–572. [Google Scholar] [CrossRef]
  56. Shi, J.; Le Maguer, M.; Kakuda, Y.; Liptay, A.; Niekamp, F. Lycopene Degradation and Isomerization in Tomato Dehydration. Food Res. Int. 1999, 32, 15–21. [Google Scholar] [CrossRef]
  57. Panthee, D.R.; Cao, C.; Debenport, S.J.; Rodríguez, G.R.; Labate, J.A.; Robertson, L.D.; Breksa, A.P.; van der Knaap, E.; McSpadden Gardener, B.B. Magnitude of Genotype × Environment Interactions Affecting Tomato Fruit Quality. Hortscience 2012, 47, 721–726. [Google Scholar] [CrossRef]
  58. Helyes, L.; Dimény, J.; Pék, Z.; Lugasi, A. Effect of the Variety and Growing Methods as Well as Cultivation Conditions on the Composition of Tomato (Lycopersicon lycopersicum (L.) Karsten) Fruit. Acta Hortic. 2006, 712, 511–516. [Google Scholar] [CrossRef]
  59. Jayasinghe, S.L.; Kumar, L. Potential Impact of the Current and Future Climate on the Yield, Quality, and Climate Suitability for Tea [Camellia sinensis (L.) O. Kuntze]: A Systematic Review. Agronomy 2021, 11, 619. [Google Scholar] [CrossRef]
  60. Tigist, M.; Workneh, T.S.; Woldetsadik, K. Effects of Variety on the Quality of Tomato Stored under Ambient Conditions. J. Food Sci. Technol. 2013, 50, 477–486. [Google Scholar] [CrossRef]
  61. Ilić, Z.; Milenković, L.; Hristov, N. The Influence of Photo-Selective Shade Nets on Quality of Tomatoes Grown under Plastic Tunnels and Field Conditions. Sci. Hortic. 2012, 139, 90–95. [Google Scholar] [CrossRef]
  62. Brunele Caliman, F.R.; Henriques da Silva, D.J.; Stringheta, P.C.; Rezende Fontes, P.C.; Rodrigues Moreira, G.; Chartuni Mantovani, E. Quality of Tomatoes Grown under a Protected Environment and Field Conditions. Idesia 2010, 28, 75–82. [Google Scholar] [CrossRef]
  63. Davies, J.N.; Hobson, G.E. The Constituents of Tomato Fruit—The Influence of Environment, Nutrition, and Genotype. CRC Crit. Rev. Food Sci. Nutr. 1981, 15, 205–280. [Google Scholar] [CrossRef]
  64. Fidrianny, I.; Natalia, S.; Res, M.I.-I.J.P.C. Antioxidant Capacities of Various Fruit Extracts from Three Varieties of Tomato and Correlation with Total Phenolic, Flavonoid, Carotenoid Content. Int. J. Pharm. Clin. Res. 2015, 7, 283–289. [Google Scholar]
  65. Csambalik, L.; Orbán, C.; Stéger-Máté, M.; Pusztai, P.; Divéky-Ertsey, A. Antioxidant Profile of Tomato Landraces for Freshconsumption. Acta Biol. Szeged. 2016, 60, 177–182. [Google Scholar]
  66. Periago, M.J.; Martínez-Valverde, I.; Chesson, A.; Provan, G. Phenolic Compounds, Lycopene and Antioxidant Activity in Commercial Varieties of Tomato (Lycopersicum esculentum). J. Sci. Food Agric. 2002, 82, 323–330. [Google Scholar] [CrossRef]
  67. Rosales, M.A.; Cervilla, L.M.; Sánchez-Rodríguez, E.; Rubio-Wilhelmi, M.d.M.; Blasco, B.; Ríos, J.J.; Soriano, T.; Castilla, N.; Romero, L.; Ruiz, J.M. The Effect of Environmental Conditions on Nutritional Quality of Cherry Tomato Fruits: Evaluation of Two Experimental Mediterranean Greenhouses. J. Sci. Food Agric. 2011, 91, 152–162. [Google Scholar] [CrossRef]
  68. Mostapha, B.B.; Hayette, L.; Zina, M. Antioxidant Activity of Eight Tomato (Lycopersicon esculentum L.) Varieties Grown in Algeria. J. Food Technol. Res. 2014, 1, 133–145. [Google Scholar] [CrossRef][Green Version]
  69. Perea-Domínguez, X.P.; Hernández-Gastelum, L.Z.; Olivas-Olguin, H.R.; Espinosa-Alonso, L.G.; Valdez-Morales, M.; Medina-Godoy, S. Phenolic Composition of Tomato Varieties and an Industrial Tomato By-Product: Free, Conjugated and Bound Phenolics and Antioxidant Activity. J. Food Sci. Technol. 2018, 55, 3453–3461. [Google Scholar] [CrossRef]
  70. Čeryová, N. Total Polyphenol Content and Antioxidant Activity of Solanum lycopersicum L. Agrobiodivers. Improv. Nutr. Health Life Qual. 2022, 6, 61–66. [Google Scholar] [CrossRef]
  71. Kacjan Maršić, N.; Gašperlin, L.; Abram, V.; Budič, M.; Vidrih, R. Quality Parameters and Total Phenolic Content in Tomato Fruits Regarding Cultivar and Microclimatic Conditions. Turkish J. Agric. For. 2011, 35, 185–194. [Google Scholar] [CrossRef]
  72. Balogh, E.; Hegedus, A.; Stefanovits-Bányai, É. Application of and Correlation among Antioxidant and Antiradical Assays for Characterizing Antioxidant Capacity of Berries. Sci. Hortic. 2010, 125, 332–336. [Google Scholar] [CrossRef]
  73. Machado, J.; Vasconcelos, M.W.; Soares, C.; Fidalgo, F.; Heuvelink, E.; Carvalho, S.M.P. Enzymatic and Non-Enzymatic Antioxidant Responses of Young Tomato Plants (Cv. Micro-Tom) to Single and Combined Mild Nitrogen and Water Deficit: Not the Sum of the Parts. Antioxidants 2023, 12, 375. [Google Scholar] [CrossRef] [PubMed]
  74. Gil-Ortiz, R.; Naranjo, M.Á.; Atares, S.; Vicente, O. Antioxidant Responses of Water-Stressed Cherry Tomato Plants to Natural Biostimulants. Agronomy 2023, 13, 8–10. [Google Scholar] [CrossRef]
  75. Šalagovič, J.; Vanhees, D.; Verboven, P.; Holsteens, K.; Verlinden, B.; Huysmans, M.; Van de Poel, B.; Nicolaï, B. Microclimate Monitoring in Commercial Tomato (Solanum lycopersicum L.) Greenhouse Production and Its Effect on Plant Growth, Yield and Fruit Quality. Front. Hortic. 2024, 3, 1425285. [Google Scholar] [CrossRef]
  76. Parisi, M.; Lo Scalzo, R.; Migliori, C.A. Postharvest Quality Evolution in Long Shelf-Life “Vesuviano” Tomato Landrace. Sustainability 2021, 13, 11885. [Google Scholar] [CrossRef]
  77. Burato, A.; Tava, A.; Biazzi, E.; Parisi, M.; Tripodi, P.; Lo Scalzo, R.; Bianchi, G.; Picchi, V.; Ronga, D. Changes in Processing Tomato Fruit Quality in Heirloom and Modern Varieties Developed over the Past Decades. J. Food Compos. Anal. 2025, 146, 107956. [Google Scholar] [CrossRef]
  78. Dasgan, H.Y.; Dere, S.; Akhoundnejad, Y.; Arpaci, B.B. Effects of High-Temperature Stress during Plant Cultivation on Tomato (Solanum lycopersicum L.) Fruit Nutrient Content. J. Food Qual. 2021, 2021, 7994417. [Google Scholar] [CrossRef]
  79. Alhaithloul, H.A.S.; Galal, F.H.; Seufi, A.E.M. Effect of Extreme Temperature Changes on Phenolic, Flavonoid Contents and Antioxidant Activity of Tomato Seedlings (Solanum lycopersicum L.). PeerJ 2021, 9, e11193. [Google Scholar] [CrossRef] [PubMed]
  80. Kumar, K.; Debnath, P.; Singh, S.; Kumar, N. An Overview of Plant Phenolics and Their Involvement in Abiotic Stress Tolerance. Stresses 2023, 3, 570–585. [Google Scholar] [CrossRef]
  81. Ahlawat, Y.K.; Singh, M.; Manorama, K.; Lakra, N.; Zaid, A.; Zulfiqar, F. Plant Phenolics: Neglected Secondary Metabolites in Plant Stress Tolerance. Braz. J. Bot. 2023, 47, 703–721. [Google Scholar] [CrossRef]
Figure 1. Illustrations of the position of tomato experimental plots on one side of the hedgerow (A), plant health (B), or fruit development stage (C).
Horticulturae 12 00516 g001
Figure 2. Experimental design of tomato plants on the windy and protected sides of a hedge, located in the organic land of Soroksár Experimental Research Farm, Hungarian University of Agriculture and Life Sciences, Budapest, Hungary, Northwest–Southeast orientation. The experimental blocks are 3, 6, 9, 12, and 15 m from the hedge.
Horticulturae 12 00516 g002
Figure 3. Total Soluble Solids (TSS) values (mean ± SD) of tomato samples from two harvests in the first year (2023), showing interaction plots for plants grown at varying distances (W1–W5, windy side; P1–P5, protected side) from a hedgerow in Soroksár, Hungary. Different lowercase letters indicate significant differences among distances (p < 0.05) within side and variety. Different uppercase letters indicate significant differences among varieties within side and distance (p < 0.05). Asterisks indicate significant differences between the two sides in the distances within a variety (p < 0.05).
Horticulturae 12 00516 g003
Figure 4. Titratable Acidity (TA) results (mean ± SD) of tomato samples from two harvests in the second year (2024), showing interaction plots for plants grown at varying distances (W1–W5, windy side; P1–P5, protected side) from a hedgerow in Soroksár, Hungary. Different lowercase letters indicate significant differences among distances (p < 0.05) within side and variety. Different uppercase letters indicate significant differences among varieties within side and distance (p < 0.05). Asterisks indicate significant differences between the two sides in the distances within a variety (p < 0.05).
Horticulturae 12 00516 g004
Figure 5. Chroma (C*) results (mean ± SD) of tomato fruits from two harvests in the first and second year (2023–2024). Interaction plots show the effects of distance from a hedgerow (W1–W5: windy side; P1–P5: protected side) in Soroksár, Hungary. Within a side and variety, different lowercase letters indicate significant differences among distances (p < 0.05). Within a side and distance, different uppercase letters indicate significant differences among varieties (p < 0.05). Asterisks (*) denote significant differences between sides (windy vs. protected) within a specific variety and distance (p < 0.05).
Horticulturae 12 00516 g005
Figure 6. Hue (h°) results (mean ± SD) of tomato samples from two harvests in the first and second year (2023–2024), showing interaction plots for plants grown at varying distances (W1–W5, windy side; P1–P5, protected side) from a hedgerow in Soroksár, Hungary. Different lowercase letters indicate significant differences in distances (p < 0.05) within side and variety. Different uppercase letters indicate significant differences among varieties within side and distance (p < 0.05). Asterisks indicate significant differences between the two sides in distances within a variety (p < 0.05).
Horticulturae 12 00516 g006
Figure 7. Lycopene estimation results (mean ± SD) of tomato samples from two harvests in the first and second year (2023–2024), based on (a*/b*)2 values, showing interaction plots for plants grown at varying distances (W1–W5, windy side; P1–P5, protected side) from a hedgerow in Soroksár, Hungary.
Horticulturae 12 00516 g007
Figure 8. Ferric-Reducing Antioxidant Power (FRAP) results (mean ± SD) of tomato samples from two harvests in the first year (2023), showing interaction plots for plants grown at varying distances (W1–W5, windy side; P1–P5, protected side) from a hedgerow in Soroksár, Hungary. Different lowercase letters indicate significant differences among distances (p < 0.05) within side and variety. Different uppercase letters indicate significant differences among varieties within side and distance (p < 0.05). Asterisks indicate significant differences between the two sides in distances within a variety (p < 0.05).
Horticulturae 12 00516 g008
Figure 9. Total Phenolic Content (TPC) results (mean ± SD) of tomato samples from two harvests of the second year (2024), showing interaction plots for plants grown at varying distances (W1–W5, windy side; P1–P5, protected side) from a hedgerow in Soroksár, Hungary. Different lowercase letters indicate significant differences among distances (p < 0.05) within side and variety. Different uppercase letters indicate significant differences among varieties within side and distance (p < 0.05). Asterisks indicate significantly higher values of the two sides among distances within a variety (p < 0.05).
Horticulturae 12 00516 g009
Figure 10. The biplot of the varimax rotated result of the PCA model with the recalculated rotated explained variance rates (45.6% + 36.1% = 81.77%), for years 2023 and 2024, respectively. Arrows represent the scaled and transformed continuous variables square-root of Total Soluble Solids (sqrtTSS), logarithm of Titratable Acidity (lnTA), inverse Sugar–Acid Ratio (invSAR), square root of Ferric-Reducing Antioxidant Power (sqrtFRAP), and square root of Total Phenolic Content (sqrtTPC). Sample scores are differentiated by shape according to varieties (Ace55, Roma, Szentlőrinckáta) and by color according to protected or windy sides, with a transparency gradient applied to visualize years 2023 and 2024 (dark and light, respectively). For the year groups, 95% confidence-level solid and dashed ellipses (assuming a multivariate t-distribution) are plotted.
Horticulturae 12 00516 g010
Figure 11. The biplot of the varimax rotated result of the PCA model for 2023 with the recalculated rotated explained variance rates (45.6% + 36.1% = 81.77%). Arrows represent the scaled and transformed continuous variables square-root of Total Soluble Solids (sqrtTSS), logarithm of Titratable Acidity (lnTA), inverse Sugar–Acid Ratio (invSAR), square root of Ferric-Reducing Antioxidant Power (sqrtFRAP), and square root of Total Phenolic Content (sqrtTPC). Sample scores are differentiated by shape according to variety (Ace55, Roma, Szentlőrinckáta) and by color according to protected or windy sides, with a transparency gradient applied to visualize protected and windy sides. For the side groups protected and windy, 95% confidence-level solid and dashed ellipses (assuming a multivariate t-distribution) are plotted, respectively.
Horticulturae 12 00516 g011
Figure 12. The biplot of the varimax rotated result of the PCA model for 2024 with the recalculated rotated explained variance rates (45.6% + 36.1% = 81.77%). Arrows represent the scaled and transformed continuous variables square-root of Total Soluble Solids (sqrtTSS), logarithm of Titratable Acidity (lnTA), inverse Sugar–Acid Ratio (invSAR), square root of Ferric-Reducing Antioxidant Power (sqrtFRAP), and square root of Total Phenolic Content (sqrtTPC). Sample scores are differentiated by shape according to variety (Ace55, Roma, Szentlőrinckáta) and by color according to protected or windy sides, with a transparency gradient applied to visualize protected and windy sides. For the side groups protected and windy, 95% confidence-level solid and dashed ellipses (assuming a multivariate t-distribution) are plotted, respectively.
Horticulturae 12 00516 g012
Table 1. Characteristics of employed tomato genotypes and their fruits.
GenotypeUseFruit Weight (g)ShapeGrowing TypeGene Bank CodeOrigin
SzentlőrinckátaProcessing50–55OvateDeterminateRCAT078726Hungary
Ace55Fresh, Processing95–120RoundDeterminateCommercialUSA
Roma Fresh, Processing57–85OblongDeterminateCommercialFrance
Table 2. Monthly average air temperature (°C) recorded at varying distances from a hedgerow in protected and wind-exposed positions during the 2023 and 2024 vegetation seasons at Soroksár Experimental and Research Farm, Hungarian University of Agriculture and Life Sciences, Budapest, Hungary. The heatmap utilizes row-wise scaling, with blue representing the minimum and red the maximum temperature per row.
Year/MonthP5
(15 m)
P4
(12 m)
P3
(9 m)
P2
(6 m)
P1
(3 m)
HW1
(3 m)
W2
(6 m)
W3
(9 m)
W4
(12 m)
W5
(15 m)
2023-May22.0324.4221.4121.1821.5319.3521.4122.0222.1421.8321.92
2023-June 24.7424.3124.0223.6423.8619.9723.6423.7523.823.3123.88
2023-July27.1322.1525.9425.9427.4922.9523.0527.1827.0826.822.69
2023-August27.9828.3824.0525.126.6122.5824.2225.6625.4324.5424.42
2023-September 19.8219.4621.8721.3121.6119.7520.821.220.5120.3419.66
2024-May18.4618.818.2919.6220.2618.2519.6218.2919.3719.5119.46
2024-June26.0225.8125.3125.3126.5321.1225.5125.7525.7824.6225.64
2024-July28.9828.5728.0928.6328.9424.8826.2727.6826.9927.3626.89
2024-August26.2326.0125.3225.8526.1223.6623.9725.9925.8825.8525.52
2024-September24.2324.6622.7123.423.7721.1220.4923.1422.6322.6122.89
Table 3. Multivariate test results for fruit quality traits (TSS, TA, SAR, TPC, and FRAP) in 2023 and 2024. Wilk’s lambda is the unexplained variance rate, F is the MANOVA test value, and df1 is the degree of freedom of the numerator.
TreatmentsQuality
Traits
Wilk’s Lambda20232024
<0.50 ***<0.77 ***
df1 of FF(df1, 149)F(df1, 126)
VarietyTSS2248.19 ***4.37 *
TA20.098 ns2.57 +
SAR222.66 ***3.96 *
TPC29.18 ***5.17 **
FRAP213.55 ***3.88 *
DistanceTSS46.06 ***6.07 ***
TA43.47 *2.1 +
SAR40.856 ns2.21 +
TPC45.68 ***7.33 ***
FRAP423.44 ***5.52 ***
SideTSS10.33 ns4.05 *
TA10.03 ns10.01 **
SAR10.06 ns5.95 *
TPC127.74 ***20.9 ***
FRAP1141.09 ***16.54 ***
2023: all two- and three-way interactions are significant (p < 0.05); 2024: all two- and three-way interactions are significant (p < 0.001); significance codes: *** p < 0.001, ** p < 0.01, * p < 0.05, + p < 0.10, ns = not significant.
Table 4. Multivariate test results for Chroma and Hue (2023–2024). Wilk’s lambda is the unexplained variance rate, F is the MANOVA test value, and df1 is the degree of freedom of the numerator.
TreatmentQualityWilk’s Lambda20232024
Traits <0.76 ***<0.90 ***
df1 of FF(df1, 149)F(df1, 133)
VarietyChroma231.66 ***0.94 ns
Hue216.97 ***17.56 ***
DistanceChroma41.18 ns5.26 ***
Hue412.46 ***3.05 *
SideChroma14.81 *9.42 **
Hue141.74 ***9.81 **
2023: all two- and three-way interactions are significant (p < 0.05); 2024: all two- and three-way interactions are significant (p < 0.001); Significance codes: *** p < 0.001, ** p < 0.01, * p < 0.05, ns = not significant.
Disclaimer/Publisher’s Note: The statements, opinions and data contained in all publications are solely those of the individual author(s) and contributor(s) and not of MDPI and/or the editor(s). MDPI and/or the editor(s) disclaim responsibility for any injury to people or property resulting from any ideas, methods, instructions or products referred to in the content.