Article

Biochar Boosts Pepper Yield and Soil Health in Protected Continuous Cropping Systems in China

1
National Navel Orange Engineering Research Center, Life Sciences College, Gannan Normal University, Ganzhou 341000, China
2
Jiangxi Plant Protection and Plant Quarantine Station, Nanchang 330096, China
*
Author to whom correspondence should be addressed.
Horticulturae 2026, 12(5), 515; https://doi.org/10.3390/horticulturae12050515
Submission received: 16 March 2026 / Revised: 15 April 2026 / Accepted: 20 April 2026 / Published: 23 April 2026

Abstract

Protected cultivation of pepper in southern China’s red soil region often leads to soil degradation and continuous cropping obstacles. To investigate whether biochar can alleviate these problems by regulating the soil microenvironment, pot and incubation experiments were conducted from 2021 to 2023 with biochar application rates of 0~10% (w/w). The results showed that appropriate biochar application significantly improved pepper yield and soil quality. Under the 6% biochar treatment, pepper yield and dry matter accumulation increased by 89.05% and 36.79%, respectively, compared to the control. Soil bacterial and fungal abundances increased by 346.61% and 107.37%, and their OTU numbers rose by 64.13% and 35.15%, respectively. Biochar application also elevated soil pH, organic matter, available potassium, and total nitrogen contents, improved aggregate stability, and enhanced the activities of urease, catalase, sucrase, and acid phosphatase. Furthermore, biochar altered the rhizosphere microbial community structure and increased bacterial diversity. These findings demonstrate that biochar can promote pepper growth by improving soil physicochemical properties, enzyme activities, and microbial community structure, providing a viable strategy for mitigating continuous cropping obstacles in protected cultivation.

1. Introduction

Pepper (Capsicum annuum L.) is a globally important vegetable crop and condiment, which is rich in vitamin C and polyphenolic antioxidants. It plays a significant role in stimulating the appetite, improving digestive function, and promoting blood circulation [1]. In recent years, the area of pepper cultivated in China has exceeded 2.13 × 10⁶ hm2, with an output value that surpassed 35.63 billion US dollars and ranked first in the vegetable industry [2]. However, long-term continuous cropping has led to issues, such as soil degradation, reduced pepper yield, and a deterioration in quality, which have severely restricted the sustainable development of the protected pepper industry [3,4]. In practice, farmers commonly rely heavily on chemical fertilizers, often in combination with traditional organic amendments such as livestock manure compost, to maintain crop yields. Against this backdrop, achieving high yields and cultivating pepper at high efficiency under protected conditions has become a critical issue that merits urgent study.
Soil health refers to the continuous capacity of soil to deliver ecosystem services, emphasizing its integrated functions in agriculture and ecosystems [5]. Its assessment typically encompasses physical, chemical, and biological attributes [6]. In continuous cropping systems, soil health degradation often manifests as a synergistic deterioration of these attributes [7]. Therefore, developing integrated management strategies that simultaneously and synergistically improve soil physical, chemical, and biological properties is key to alleviating continuous cropping obstacles and enhancing soil health.
Biochar is a highly aromatic, carbon-rich solid particulate material produced by pyrolysis of biomass under oxygen-limited conditions at elevated temperatures (typically >400 °C, e.g., 500–700 °C). This high-temperature process confers a stable porous structure and pronounced alkaline properties to the material—primarily due to the formation of carbonate components [8]. These characteristics enable biochar not only to ameliorate acidic soils, sequester carbon effectively, and enhance soil nutrient content and aggregate stability [9], but also improve crop yields [10] and increase the abundance and diversity of microbial communities [11]. Furthermore, biochar can sequester atmospheric C in the soil, reduce nutrient leaching and emissions of carbon dioxide (CO2) [12], and mitigate adverse environmental impacts [13]. Therefore, biochar is widely used as a soil amendment in the agricultural sector [14]. Unlike compost, which primarily increases readily mineralizable active organic carbon, biochar more effectively raises the pH of acidic red soil and enhances the stable soil organic carbon pool under equivalent carbon input. This characteristic gives it a significant advantage in restoring the health of degraded cultivated red soils [15].
Soil microorganisms, as the most active living component of soil, have their diversity and functional stability directly affecting nutrient cycling efficiency and crop productivity, and are therefore regarded as key biological indicators reflecting dynamic changes in soil health [16]. Goldberg et al. [17] found that microorganisms can directly or indirectly mediate the degradation, migration, and transformation of biochar. Additionally, biochar exhibits potential regulatory effects on increasing the abundance of bacteria, enhancing community diversity, and altering the community composition [18,19].
However, the impact of biochar on soil microorganisms is not always positive, as its effects are modulated by a combination of biochar properties, application rate, and initial soil conditions [20,21,22]. Studies indicate that components potentially generated during biochar pyrolysis, such as polycyclic aromatic hydrocarbons (PAHs) and volatile organic compounds (VOCs), may inhibit microbial growth and metabolism under specific circumstances [23]. Concurrently, alterations in soil physicochemical properties induced by biochar can differentially influence various microbial taxa [24]. Furthermore, Most studies focus on the ability of biochar to promote the growth of plants [25] or the individual effects of biochar on soil physicochemical properties and microbial community structure, as well as their interactions [26]. However, systematic research on the regulatory role of biochar in plant–soil–microbe interactions in the acidic red soil of vegetable fields remains lacking. Therefore, this study conducted pot and laboratory incubation experiments to explore the effects of biochar on the yield of pepper, soil physicochemical properties, and microecological environment. We hypothesize that, in the protected continuous pepper cropping system on southern red soil, appropriate biochar application can break continuous cropping obstacles and increase pepper yield through comprehensive improvement of soil health. To test this hypothesis, the specific research objectives are as follows: (1) to clarify the effects of adding different rates of biochar on the yield of pepper, physicochemical properties of the soil, and contents of nutrients; (2) to elucidate the impacts of adding different rates of biochar on the structure and stability of soil aggregates and the distribution of soil organic C; and (3) to reveal the characteristics in the variation in soil microorganisms after adding different rates of biochar and their relationships with the physicochemical properties of soil. The results of this study aim to provide a theoretical basis for the high-quality development of the protected pepper industry and the healthy management of red soils in southern China.

2. Materials and Methods

2.1. Experimental Materials

The pot experiment was conducted from March 2021 to December 2022 in a glass greenhouse at the vegetable experimental base on the Baita Campus of Gannan Normal University (Ganzhou, China) (114°93′ E, 25°90′ N). Acidic red soil was collected from the 0~20 cm surface layer of local protected vegetable fields. The soil was air-dried; visible impurities were removed by hand, and it was passed through a 2 mm sieve. According to the World Reference Base for Soil Resources (WRB) classification, the soil is a Ferralsol, characterized by moderate desilication and ferralitization, with a clayey and acidic texture [27]. Its physico-chemical properties were as follows: pH 6.12 ± 0.15, maximum water-holding capacity 42.70 ± 3.26%, soil organic matter (OM) 15.58 ± 1.63 g·kg−1, total nitrogen (TN) 0.29 ± 0.07 g·kg−1, alkaline hydrolysable N (AHN) 69.61 ± 3.87 mg·kg−1, available potassium (AK) 128.23 ± 7.28 mg·kg−1, and available phosphorus (AP) 14.11 ± 1.05 mg·kg−1.
The pepper varieties were selected as representative cultivars commonly grown in local protected cultivation to ensure the practical relevance of the findings. ‘Seminis 2579’ was used for the winter–spring stubble in 2021, and ‘Bolon (37–94)’ was planted for all subsequent stubble. The pepper seedlings were provided by the Southern Agricultural Base in Datangbu Town, Xinfeng County, Jiangxi Province, China (114°92′ E, 25°32′ N). Throughout the experimental period, the greenhouse environmental conditions were maintained within ranges suitable for pepper growth. The air temperature was maintained at 25~30 °C during the day and 18~22 °C at night. The relative humidity was controlled at 65~80%.
The indoor incubation experiment was conducted from January 2021 to July 2023. Acidic red soil was collected from the 0~20 cm plow layer of a long-term vegetable cultivation base located in Wanxing Village, Datangbu Town, Xinfeng County, Jiangxi Province, China (114°92′56″ E, 25°31′53″ N). After air-drying and the manual removal of visible impurities, the soil was passed through a 2 mm sieve. Its basic physicochemical properties were as follows: pH 5.43 ± 0.09, maximum water-holding capacity 36.54 ± 2.66%, OM 12.60 ± 0.36 g·kg−1, TN 3.24 ± 0.51 g·kg−1, AHN 86.32 ± 3.95 mg·kg−1, AK 51.20 ± 2.47 mg·kg−1, and AP 10.93 ± 1.48 mg·kg−1.
The biochar used in both experiments was produced from local late rice (Oryza sativa L.) straw. This feedstock is a regionally representative agricultural waste that is readily available. Biochar produced from it at 500 °C exhibits high alkalinity and a stable carbon structure, thus being suitable for soil amendment [15]. The straw was dried at 80 °C to constant weight, ground, and passed through a 2 mm sieve. The prepared material was placed in a lidded crucible and positioned inside a muffle furnace (SX-4–10 box-type resistance furnace; Tianjin Teste Instruments Co., Ltd., Tianjin, China). A small amount of charcoal was placed beside the crucible to consume residual oxygen during the initial heating stage, thereby establishing an oxygen-limited condition. The temperature was then raised to 500 °C at a rate of 5 °C min−1, maintained for 2 h, and allowed to cool naturally inside the furnace. The resulting biochar was passed through a 0.25 mm sieve for subsequent use. The physicochemical properties of the biochar were as follows: pH 9.92, water content 8.0%, pore volume 0.51%, specific surface area 600 m2·g−1, OC 325.82 g·kg−1, TN 3.13 g·kg−1, C:N ratio 104:1 and AP 2.13 g·kg−1. Its zeta potential and FTIR spectrum are presented in Figure S1.

2.2. Experimental Design

2.2.1. Pot Experiment

Two consecutive crops (winter–spring and autumn–winter stubble) were planted annually in the pot experiment, and there were five treatments. The ratios of biochar to air-dried soil mass were 0, 2%, 4%, and 6% for the winter–spring stubble in 2021. The ratios were adjusted to 0, 2%, 4%, 6%, and 10% for the autumn–winter stubble in 2021 and all subsequent stubble. Therefore, in this study, the data analysis for the winter–spring 2021 stubble was based solely on the four biochar levels (0, 2%, 4% and 6%), whereas the analyses for all subsequent crops included all five application levels (0, 2%, 4%, 6% and 10%). The biochar application rates were selected and adjusted to investigate the full dose–response relationship of biochar in a pot experiment. The initial gradient (0~6%, w/w) was established based on typical agronomic amendment levels. After observing a significant promotion of pepper growth at the 6% rate in the first crop season, we intentionally introduced a 10% application rate in subsequent seasons. This high rate was not intended for direct field recommendation, but rather to determine the optimal application rate while evaluating the potential negative effects of excessive biochar input [28,29].
The pots were 31 cm high with a 28 cm diameter on top and a 22 cm diameter on the bottom. Each pot was filled with 10.8 kg of air-dried soil. Pot experiments were employed in this study to precisely quantify the dose-dependent effects of biochar and elucidate the underlying mechanisms under strictly controlled conditions. This approach minimizes interference from field heterogeneity while facilitating multi-gradient treatments and systematic destructive sampling. To quantify the input load of biochar, calculations were performed based on its application rate (w/w), the mass of soil per pot, and the component contents of biochar determined in Section 2.1. The input amount of a given component (g per pot) was calculated as: the biochar application rate (g per pot) × the content of that component in the biochar (g·kg−1)/1000 (Table S1).
There were 10 pots per treatment, and one vigorous pepper seedling with uniform growth was transplanted into each pot. The biochar was mixed with the soil in a single application before transplantation for each stubble, which resulted in a total of four applications over two years. Labels were fixed to the pots after transplantation, and they were then randomly arranged in a 5 × 10 layout with the pots spaced at 40 cm. All the treatments were managed with identical water and fertilizer conditions. All potted plants were uniformly irrigated with tap water that had been allowed to stand to remove residual chlorine (pH 6.5~8.0). Apart from the basal application of biochar, nitrogen, phosphorus, and potassium were supplied as urea, calcium magnesium phosphate, and potassium chloride, respectively, with total application rates of 2.783 g N, 1.35 g P2O5, and 2.704 g K2O per pot. Phosphorus fertilizer was applied entirely as basal fertilizer, while nitrogen and potassium fertilizers were split-applied in a ratio of basal application: first-fruit stage: peak-fruiting stage = 4:3:3.

2.2.2. Indoor Incubation Experiment

Five treatments were established for the indoor incubation experiment, with biochar to air-dried soil mass ratios of 0, 2.5%, 5%, 7.5%, and 10%, and three replicates per treatment. For the incubation experiment, different application rates with a finer and more uniform gradient were established to investigate the effects of biochar on soil aggregate composition and stability under plant-free conditions. A 10% application rate was included as a common high-dose treatment in both experiments, allowing for the comparison and assessment of the impact of excessive biochar application on soil structure. Each 1 L plastic bucket was filled with 500 g of air-dried soil. Biochar was added at the designated rates and thoroughly mixed. Distilled water was then added to achieve a soil moisture content of 70% of the maximum water-holding capacity. The total mass of the bucket at this point was weighed and recorded as the target weight for subsequent moisture maintenance. The bucket was sealed with a plastic film fitted with a breathable filter paper and placed in an incubator set at 25 ± 1 °C and 80% relative humidity. To maintain the constant soil moisture content at 70%, each bucket was weighed every 7 days during the incubation. Distilled water was added to compensate for any mass loss, thereby restoring the total weight to the initial target value.

2.3. Determination of Plant Growth and Yield

Six pots of plants were randomly selected from each treatment after the plants had grown for 90 days. Mature peppers were harvested every 10 days until the harvest period ended. An electronic balance was used to measure the weight of single fruit, and the total harvested yield per pepper plant was recorded at the end of the harvest period.
The stems, leaves, and fruits of the plants were separated. The plant samples were first deactivated at 105 °C for 30 min in an oven and dried to a constant weight at 75 °C. The accumulation of dry matter was then determined [30].

2.4. Determination of Soil Physicochemical Properties and Enzyme Activities

Soil samples for determining physicochemical properties and assaying enzyme activities were collected in January and July of each year. A multi-point sampling method was adopted. The surface soil was removed, and a soil auger (5 cm in diameter) was used to collect samples from the 0~30 cm soil layer. Four sub-samples were taken from each pot to form one composite sample. The composite soil samples were air-dried, after which impurities and plant roots were removed. The samples were then passed through a 2 mm sieve and stored at room temperature for subsequent analysis.
The soil physicochemical properties were measured as described by Bao [31]. The soil pH was determined by potentiometry, The soil’s maximum water-holding capacity was determined using the gravity drainage method, soil OM by potassium dichromate external heating, AHN by the alkaline hydrolysis-diffusion, AP by the molybdenum-antimony anti-colorimetric after extraction with sodium bicarbonate, AK by flame photometry after extraction with ammonium acetate, and TN by an automatic discrete chemical analyzer (Smart Chem 200, AMS Alliance, Rome, Italy). The enzymes were assayed as described by Guan [32]: catalase by potassium permanganate titration, amylase and sucrase by 3,5-dinitrosalicylic acid colorimetry, urease by sodium phenolate-sodium hypochlorite colorimetry, acid phosphatase by sodium phenylphosphate colorimetry, and polyphenol oxidase (PPO) by pyrogallol colorimetry. The number of soil microorganisms was determined as described by Xu and Zhen [33].

2.5. Determination of Soil Microbial Community

After 2 consecutive years of monocropped pepper, the rhizosphere soil was collected by shaking the roots [34]. Soil clods with intact root systems were selected from the 10~30 cm soil layer of the potted plants, and the soil that tightly adhered to the root surface after gentle shaking was regarded as the rhizosphere soil. The residual soil on the root hairs was collected with a brush, fully mixed, placed in a sterile sealed bag and transported to the laboratory in an ice bath. The soil was then passed through a 2 mm pore size sieve, and the plant residues were removed. One portion was stored at −80 °C to determine the pepper rhizosphere microbial community composition, and the other portion was stored at 4 °C to quantify the microbes in soil [18].
The amount of 16S rDNA and ITS rDNA in the soil samples was measured by Suzhou Genewiz Biotechnology Co., Ltd. (Suzhou, China) using a HiPure Soil DNA Kit (Magen Biotechnology Co., Ltd., Guangzhou, China). A Qubit® dsDNA HS Assay Kit (Thermo Fisher Scientific, Waltham, MA, USA) was used to measure the concentration of DNA, and the next-generation sequencing libraries were constructed and sequenced. Two hypervariable regions (V3 and V4) on the 16S rDNA of prokaryotes were amplified by PCR primers. The forward primer was “CCTACGGRRBGCASCAGKVRVGAAT,” and the reverse primer was “GGACTANVGGGTWTCTAATCC.” The PCR product library was detected by 1.5% agarose gel electrophoresis, with a target fragment of 600 bp (Table S2). The eukaryotic ITS rDNA was amplified using a forward primer of “GTGAATCATCGARTC” and a reverse primer of “TCCTCCGCTTATTGATGAT.” The PCR product library was detected by 1.5% agarose gel electrophoresis, and the target fragment was 400 bp (Table S3). The library concentration was measured using Tecan Infinite 200 Pro (Tecan Group Ltd., Mannedorf, Switzerland) and then sequenced as described by Illumina MiSeq/NovaSeq (Illumina, San Diego, CA, USA). After quality filtering and the removal of chimeric sequences, the sequences obtained were used for operational taxonomic unit (OTU) clustering. VSEARCH (v. 1.9.6) (Rognes et al., GitHub, San Francisco, CA, USA) was used for sequence clustering with a sequence similarity of 97%. The Silva 138 database was used as the reference database for 16S rRNA alignment, and the UNITE ITS database was used as the reference database for ITS rRNA alignment. The Bayesian algorithm of RDP classifier (Ribosomal Database Program) was used to conduct a taxonomic analysis of the representative sequences of OTUs, and the community composition of each sample was counted at different taxonomic levels.

2.6. Fractionation and Stability Determination of Soil Aggregates

After the completion of the indoor incubation experiment, soil samples were collected by the destructive sampling method. The soil from each pot was poured out, and a quartering method was used to take soil for air-drying treatment; during the air-drying process, the soil was broken into clods of 10 mm in size along natural fracture surfaces to determine the quantity and stability characteristics of aggregates of each size fraction. An additional portion of air-dried soil was passed through a 0.125 mm pore size sieve to determine the soil organic carbon content.
The dry sieving method and wet sieving method were used to determine the quantity of mechanically stable aggregates and water-stable aggregates of each size fraction in air-dried soil [35]. For the dry sieving method: 500 g of air-dried soil was placed on top of a set of nested sieves with pore sizes of 2, 1, 0.5, and 0.25 mm; after covering the sieves, they were shaken, and the soil retained on each sieve was collected and weighed for later use. For the wet sieving method: according to the proportion of aggregate content of each particle size obtained by the dry sieving method, the air-dried samples were mixed according to the proportion of each size fraction to form 100 g soil samples, which were sequentially placed on nested sieves with pore sizes of 2, 1, 0.5, and 0.25 mm; after soaking for 15 min, determination was carried out using a soil aggregate analyzer (TPF-100, Zhejiang Top Cloud-Agri Technology Co., Hangzhou, China). After the determination, the aggregates of different particle sizes remaining on each sieve were rinsed into aluminum boxes; after clarification, the supernatant was discarded, and the remaining aggregates were dried to constant weight in an oven at 50 °C. The soil aggregates of each size fraction separated by the dry sieving method were ground and passed through a 0.15 mm sieve, and the organic carbon content of aggregates of different size fractions was determined by the potassium dichromate external heating method of Bao [31].
Soil aggregate stability was evaluated using mean weight diameter (MWD), geometric mean diameter (GMD), content of aggregates larger than 0.25 mm (R0.25), aggregate destruction rate (PAD), unstable aggregate index (ELT), and fractal dimension (D) and the calculation formulas are as follows [36,37]:
M W D = i = 1 n ( x - i w i )
where x - i refers to the average diameter of aggregates in each size fraction, and w i represents the proportion of aggregates in each size fraction;
  G M D = e x p [ i = 1 n m i ln x - i i = 1 n m i ]
where m i refers to the weight of soil aggregates in different size fractions;
R 0.25 = M T > 0.25 M T
where M T refers to the total weight of aggregates; M T > 0.25 represents the weight of aggregates > 0.25 mm;
P A D ( % ) = W dry   -   W wet W dry × 100
where W dry denotes the content of dry-sieved aggregates > 0.25 mm, and W wet denotes the content of wet-sieved aggregates > 0.25 mm;
E LT ( % ) = W T W > 0.25 W T × 100
where W T refers to the total weight of the tested soil, and W > 0.25 represents the weight of water-stable aggregates;
M ( r < x - i ) M T = [ x - i x max ] 3 - D
where M ( r < x - i ) denotes the weight of aggregates with particle size smaller than a specific size, and x max represents the maximum particle size of aggregates.
The contribution rate of soil mechanically stable aggregates in each size fraction to organic carbon was calculated using the following formula:
P ( % ) = W 1 × W 2 W 3
where P refers to the contribution rate of water-stable aggregates to soil organic carbon; W 1 (g·kg−1) represents the organic carbon content in aggregates of this size fraction; W 2 (%) denotes the mass percentage of aggregates of this size fraction relative to the total aggregates; and W 3 (g·kg−1) represents the organic carbon content in the soil.

2.7. Data Processing and Analysis

Experimental data were organized using Microsoft Office Excel 2019 (Microsoft Corp., Redmond, WA, USA), and figures were generated with R v.3.3.1 (R Foundation for Statistical Computing, Vienna, Austria) and Origin 8.5 (OriginLab Corp., Northampton, MA, USA). Data in figures and tables are presented as the mean ± standard deviation of three biological replicates. In the pot experiment, each treatment comprised ten pots. For sampling and analysis, the ten pots within the same treatment were randomly divided into three groups (with 3, 3, and 4 pots per group, respectively). Soil from the pots within each group was thoroughly mixed to prepare three independent composite biological replicates for subsequent experimental measurements. In the incubation experiment, each treatment was conducted with three independent replicates, all of which were treated as separate samples in statistical models. Prior to analysis, the normality of data distribution was verified using the Shapiro–Wilk test, and homogeneity of variances was confirmed with Levene’s test. Results were analyzed using one-way ANOVA. Mean values across treatments were compared by the least significant difference (LSD) test.
For microbial community analysis, differences in relative abundance were estimated with LEfSe v.1.0 (Harvard School of Public Health, Boston, MA, USA), alpha-diversity indices were calculated using QIIME v.1.91 (University of Colorado, Boulder, CO, USA), and variations in the relative abundance of microbial taxa were assessed with linear discriminant analysis effect size. Statistical analysis and visualization of microbial data were performed in STAMP v.2.1.3 (University of Maryland, College Park, MD, USA), with the significance threshold set at p < 0.05.

3. Results

3.1. Pepper Yield and Dry Matter Weight

After two years of continuous cropping, pepper yield showed a clear declining trend. In the control treatment, the yield of the autumn–winter stubble in 2022 (the fourth crop) decreased by 44.60% compared to that of the autumn–winter stubble in 2021 (the second crop), and it was also notably lower than the yield of the third crop (Table 1). Given that the greenhouse environmental conditions remained stable and controlled throughout the experiment, the sharp yield decline in the later cropping cycles highlights the severe negative impact of continuous cropping over time. The 2%, 4%, 6%, and 10% biochar treatments significantly increased the yield of pepper by 23.45%, 52.32%, 89.05%, and 71.81%, respectively, compared to the control. The 6% biochar treatment produced the optimal yield.
With the increase in continuous cropping years, the total dry matter weight of the plants and the dry matter weight of each organ first increased and then decreased; the peak appeared in the third crop (Table 2). The biochar treatments significantly increased the weight of the plant dry matter. The 4%, 6%, and 10% biochar treatments in the fourth crop increased the total dry matter weight by 20.64%, 36.79%, and 25.36%, respectively, and the 6% biochar treatment resulted in the maximum total dry matter weight.

3.2. Soil Physicochemical Properties

A total of 2 years of continuous cropping led to significant degradation of the soil. The pH of the soil control group decreased by 1.22 units over 2 years, and the soil organic matter content decreased by 55.58% (Table 3). In the fourth crop, with the increase in the ratio of biochar applied, the soil pH and the contents of OM and TN increased and reached significant levels in the 6%~10%, 4%~10%, and 10% biochar treatments, respectively. The content of AP and AK first increased and then decreased, with peaks appearing in the 2% and 6% biochar treatments, respectively; the content of AHN also increased first and then decreased (p > 0.05). Among all the treatments, the 6% biochar treatment was more effective at improving the soil, and most of its nutrient indicators were superior to those of the other treatment groups.

3.3. Soil Enzyme Activities and Microbial Population

The activities of urease, catalase, sucrase, and amylase in the soil all decreased in the fourth continuous cropping stubble, while the activities of PPO and acid phosphatase increased (Table 4). The application of biochar enhanced the activities of urease, catalase, sucrase, and acid phosphatase in the soil. The activity of amylase first increased and then decreased. It reached its peak at a 2% rate of biochar, while the PPO activity decreased with no significant difference.
The application of biochar significantly promoted the proliferation of soil microorganisms. In particular, the populations of bacteria, fungi, and actinomycetes increased significantly under the 2%~10%, 4%~6%, and 6%~10% biochar treatments, respectively. The 6% biochar treatment had the most significant comprehensive effect at promoting the growth of microorganisms. Compared with the control group, the populations of soil bacteria, fungi, and actinomycetes in this treatment increased significantly by 346.61%, 107.37%, and 46.47%, respectively (Table 5).

3.4. Composition and Carbon Distribution of Soil Aggregates

The increase in the rate of biochar applied led to a change in the mechanically stable aggregates in the soil. The proportion of the >2 mm size fraction decreased gradually, and the proportion of the 2.00~1.00 mm size fraction increased gradually. The 7.5% and 10% biochar treatments showed a significant increase of 36.64% and 49.95% compared with the control group, respectively. The proportion of the <0.25 mm size fraction decreased gradually. No significant differences were observed in the proportions of the other size of fractions compared with the control group. In addition, the composition of soil water-stable aggregates changed as follows: the proportion of the 2.00~1.00 mm and <0.25 mm fractions decreased gradually as the proportions of the 0.50~0.25 mm fractions increased, and the proportions of the >2.00 mm and 1.00~0.50 mm fractions were not significantly affected by the application of biochar (Table 6).
The increase in rate of biochar applied did not result in any significant differences in the MWD, GMD, R0.25 and D of the mechanically stable aggregates. The MWD and GMD of the water-stable aggregates first increased and then decreased and reached its maximum values in the 7.5% biochar treatment. The R0.25 value increased significantly (p < 0.05), and the D value decreased significantly in the 5%~10% biochar treatments (p < 0.05) (Table 7). Both the PAD and ELT decreased significantly with the increase in rate of biochar applied (p < 0.05), and the 10% biochar treatment resulted in a significant decrease of 54.66% and 53.44% compared with the control group, respectively (Table 8).
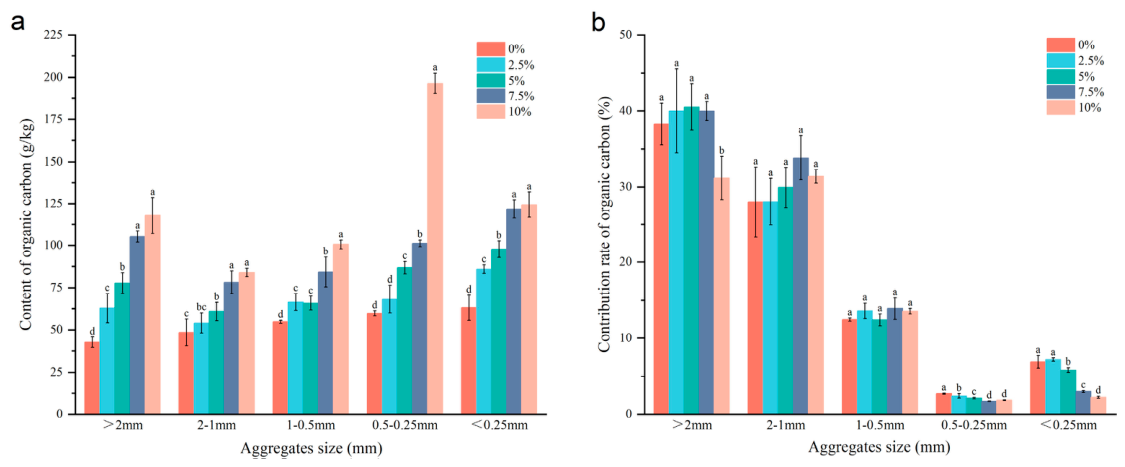
Compared with the control treatment, the biochar treatments significantly increased the content of OC in the soil. The contents of OC in the 2.5%, 5%, 7.5%, and 10% biochar treatments increased by 25.60%, 44.74%, 82.57%, and 131.85%, respectively (Table S4). Except for the 0.5~0.25 mm aggregate fraction in the 2.5% biochar treatment (where no significant difference in the content of OC was observed compared with the control), all the other biochar treatments significantly increased the content of OC in the aggregates with different particle sizes (p < 0.05), and this content increased with the increase in rate of biochar applied (Figure 1a). Compared with the control, the biochar treatments had no significant effect on the contribution rate of OC in the aggregates >0.5 mm (except for the >2 mm aggregate fraction in the 10% biochar treatment), while the contribution rate of OC in the aggregates <0.5 mm decreased significantly with the increase in rate of biochar applied (p < 0.05) (Figure 1b).

3.5. Analysis of Rhizosphere Microbial Diversity in Pepper

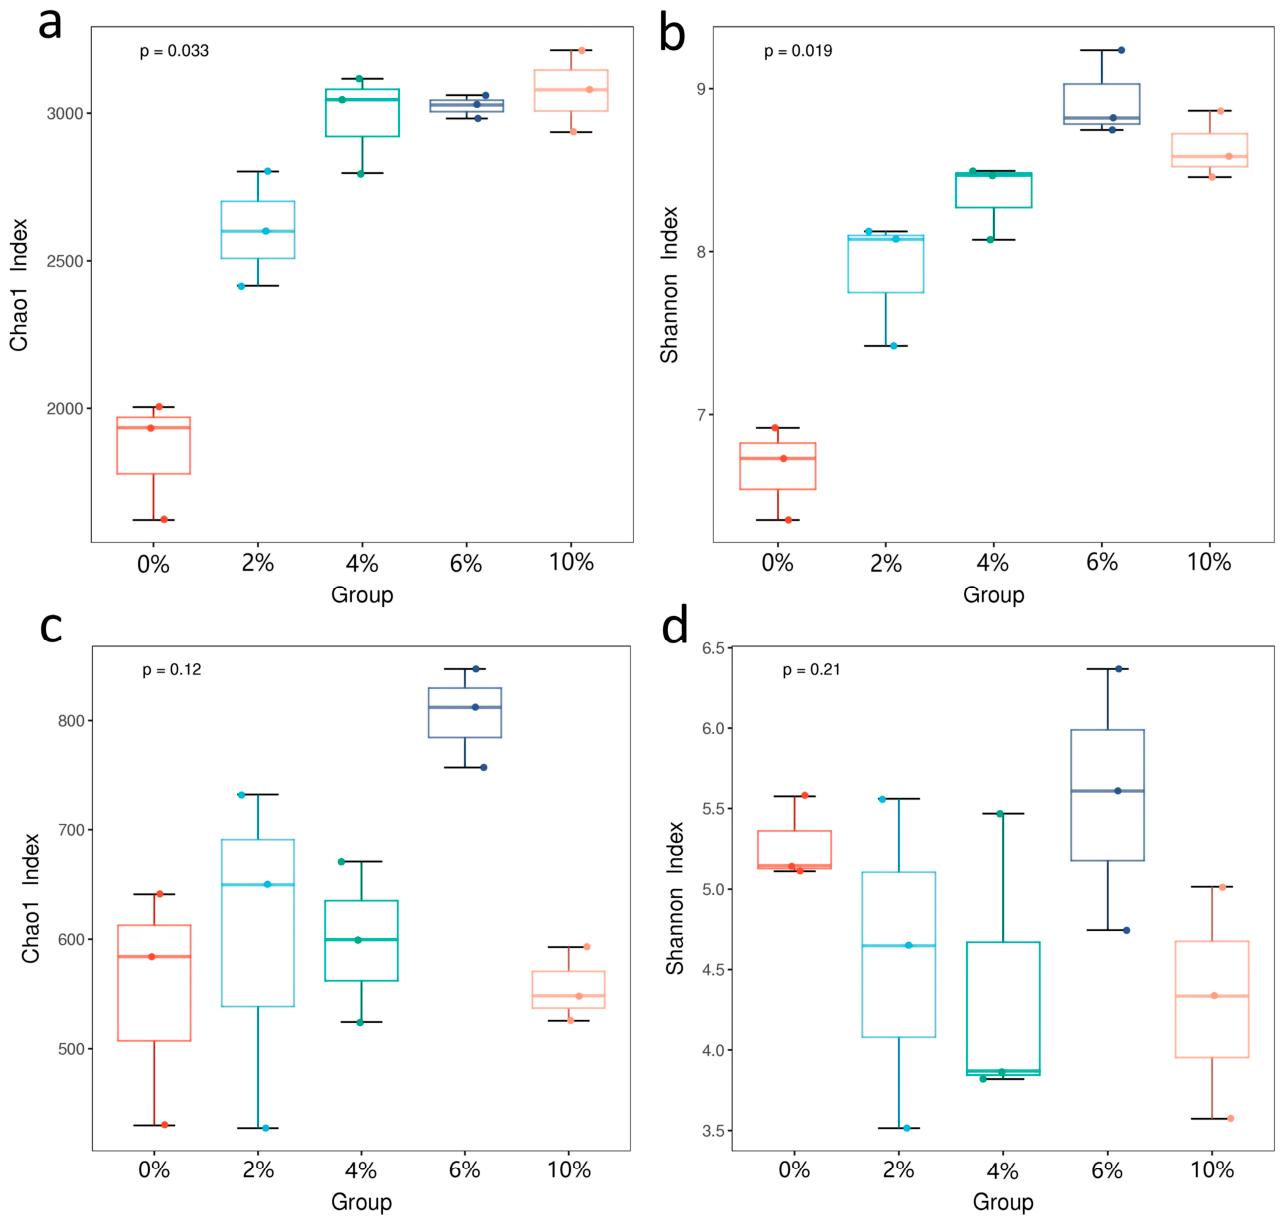
After 2 years of continuous cropping, the application of biochar significantly increased the bacterial Chao1 index and Shannon index (Figure 2a,b), and higher rates of biochar applied (6%~10%) facilitated the enhancement of bacterial diversity (Table S5). The Rank-abundance curve of the 6% biochar treatment was flatter than that of the other groups (Figure S2), which indicated that the species distribution of its bacterial community was more uniform, and it had a better effect on maintaining the species richness of the community. The Chao1 index of the fungal community only increased significantly in the 6% biochar treatment, and the Shannon index showed no significant difference among the different rates of biochar applied (Figure 2c,d; Table S5).
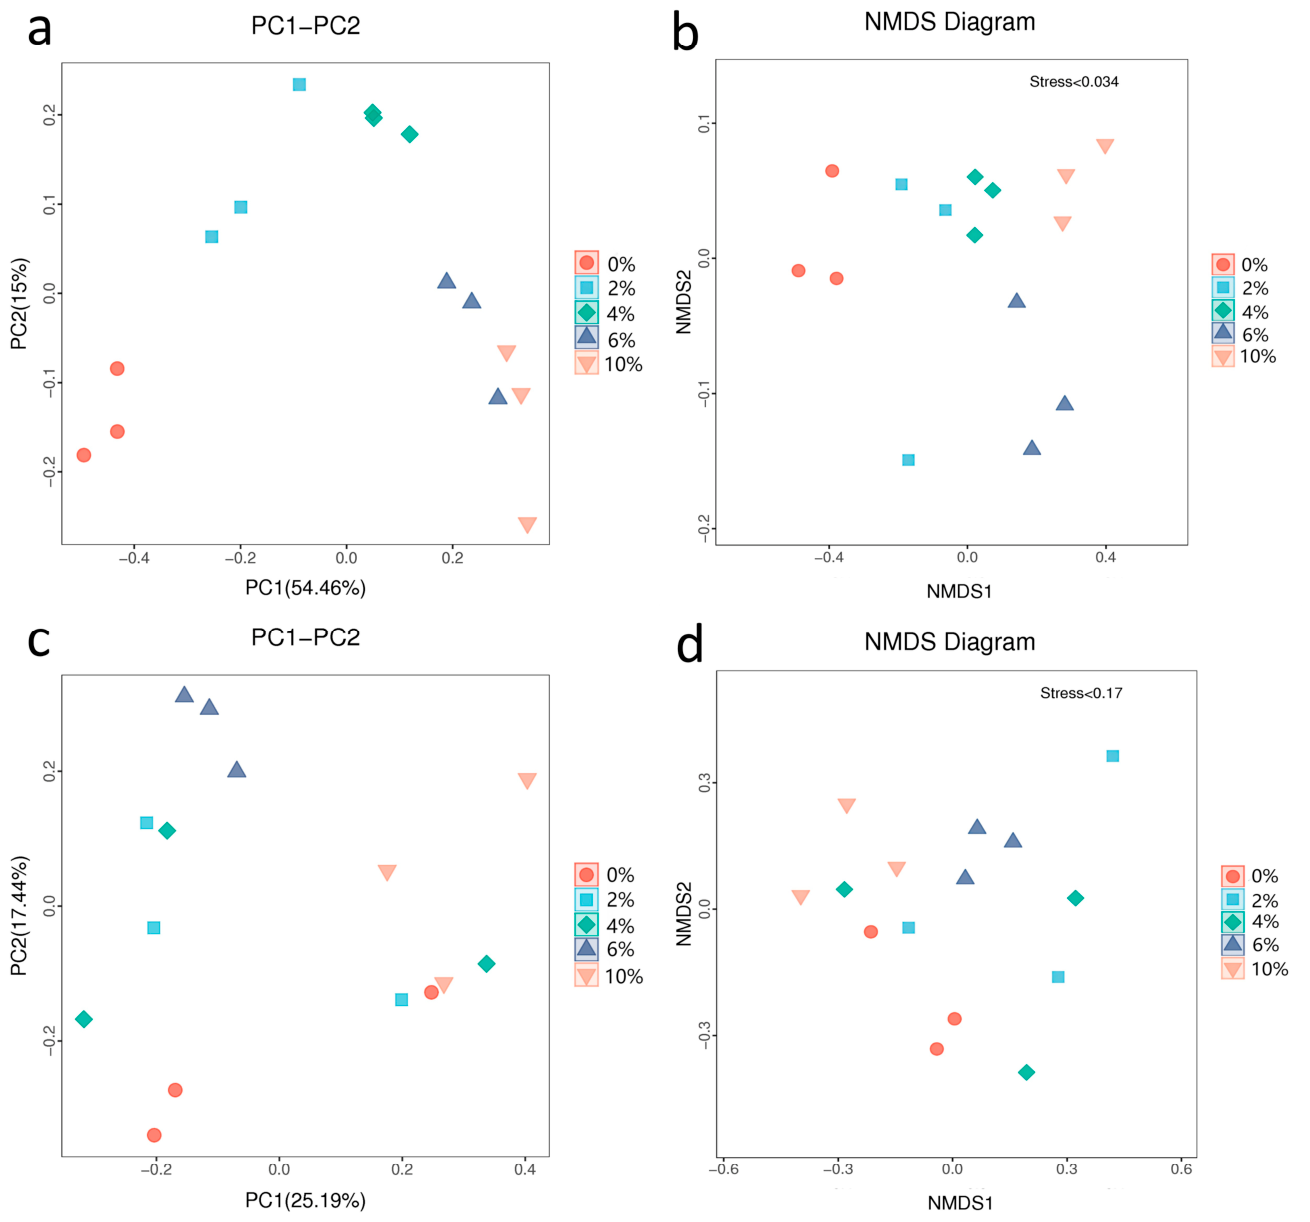
In the Principle Coordinates Analysis (PCoA) of the bacterial community, the cumulative contribution rate of the PC1 and PC2 axes was 69.46%, and the three replicate samples of each treatment group were highly clustered. The biochar treatment groups were significantly separated from the control group (Figure 3a). The NMDS analysis (Stress < 0.034) indicated that the biochar treatments caused significant changes in the bacterial community structure (Figure 3b). In addition, the results of the ANOSIM analysis showed that the application of biochar significantly expanded the differences in bacterial communities among the groups (ANOSIM R = 0.91, p = 0.001), and there were significant differences in the bacterial community structure among the different treatment groups (Figure S3). For the fungal community, the cumulative contribution rate of the PC1 and PC2 axes in the PCoA analysis was only 42.63% (Figure 3c), and the Stress value of the NMDS analysis was <0.17 (Figure 3d). This indicated that the different rates of biochar applied could not significantly distinguish the differences in fungal community structure.

3.6. Analysis of Pepper Rhizosphere Microbial Community Structure

The sequencing depth (coverage > 98%) of all the soil microbial sequencing samples met the requirements for analysis (Table S5). The average number of valid sequencing reads for bacterial samples under the 0~10% biochar treatments was 54,810, 73,685, 76,540, 60,295, and 85,528 reads, respectively, while that for the fungal samples was 65,838, 85,692, 81,200, 79,644, and 82,535 reads, respectively (Table S6).
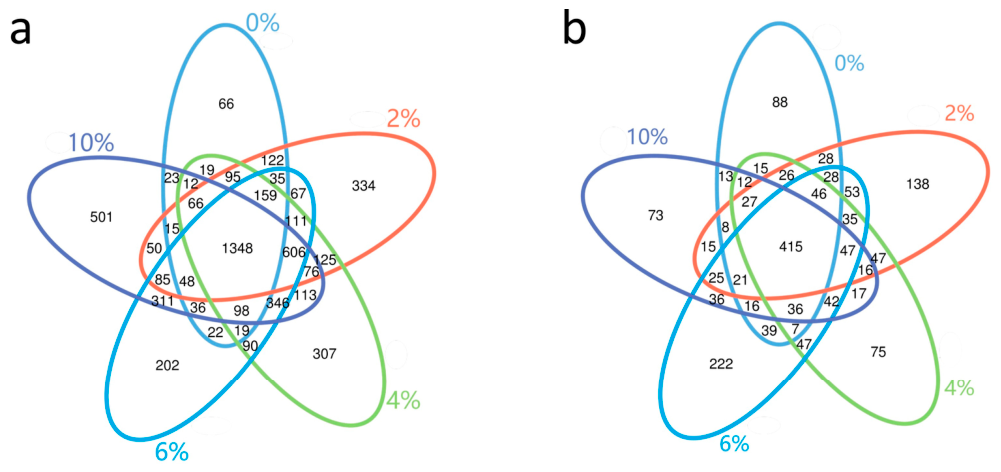
A Venn diagram analysis of the soil microorganisms showed that there were 2183, 3342, 3590, 3583, and 3734 bacterial OTUs in the 0~10% biochar treatment groups, respectively. In contrast, there were 825, 975, 910, 1115, and 819 fungal OTUs, respectively. Among these, the 6% biochar treatment increased the number of bacterial and fungal OTUs by 64.13% and 35.15% compared with the control group, respectively (Figure 4a,b). In terms of species richness, there were 478 and 152 bacterial and fungal species in this treatment, respectively, which were the highest among all the treatment groups (Table S7).
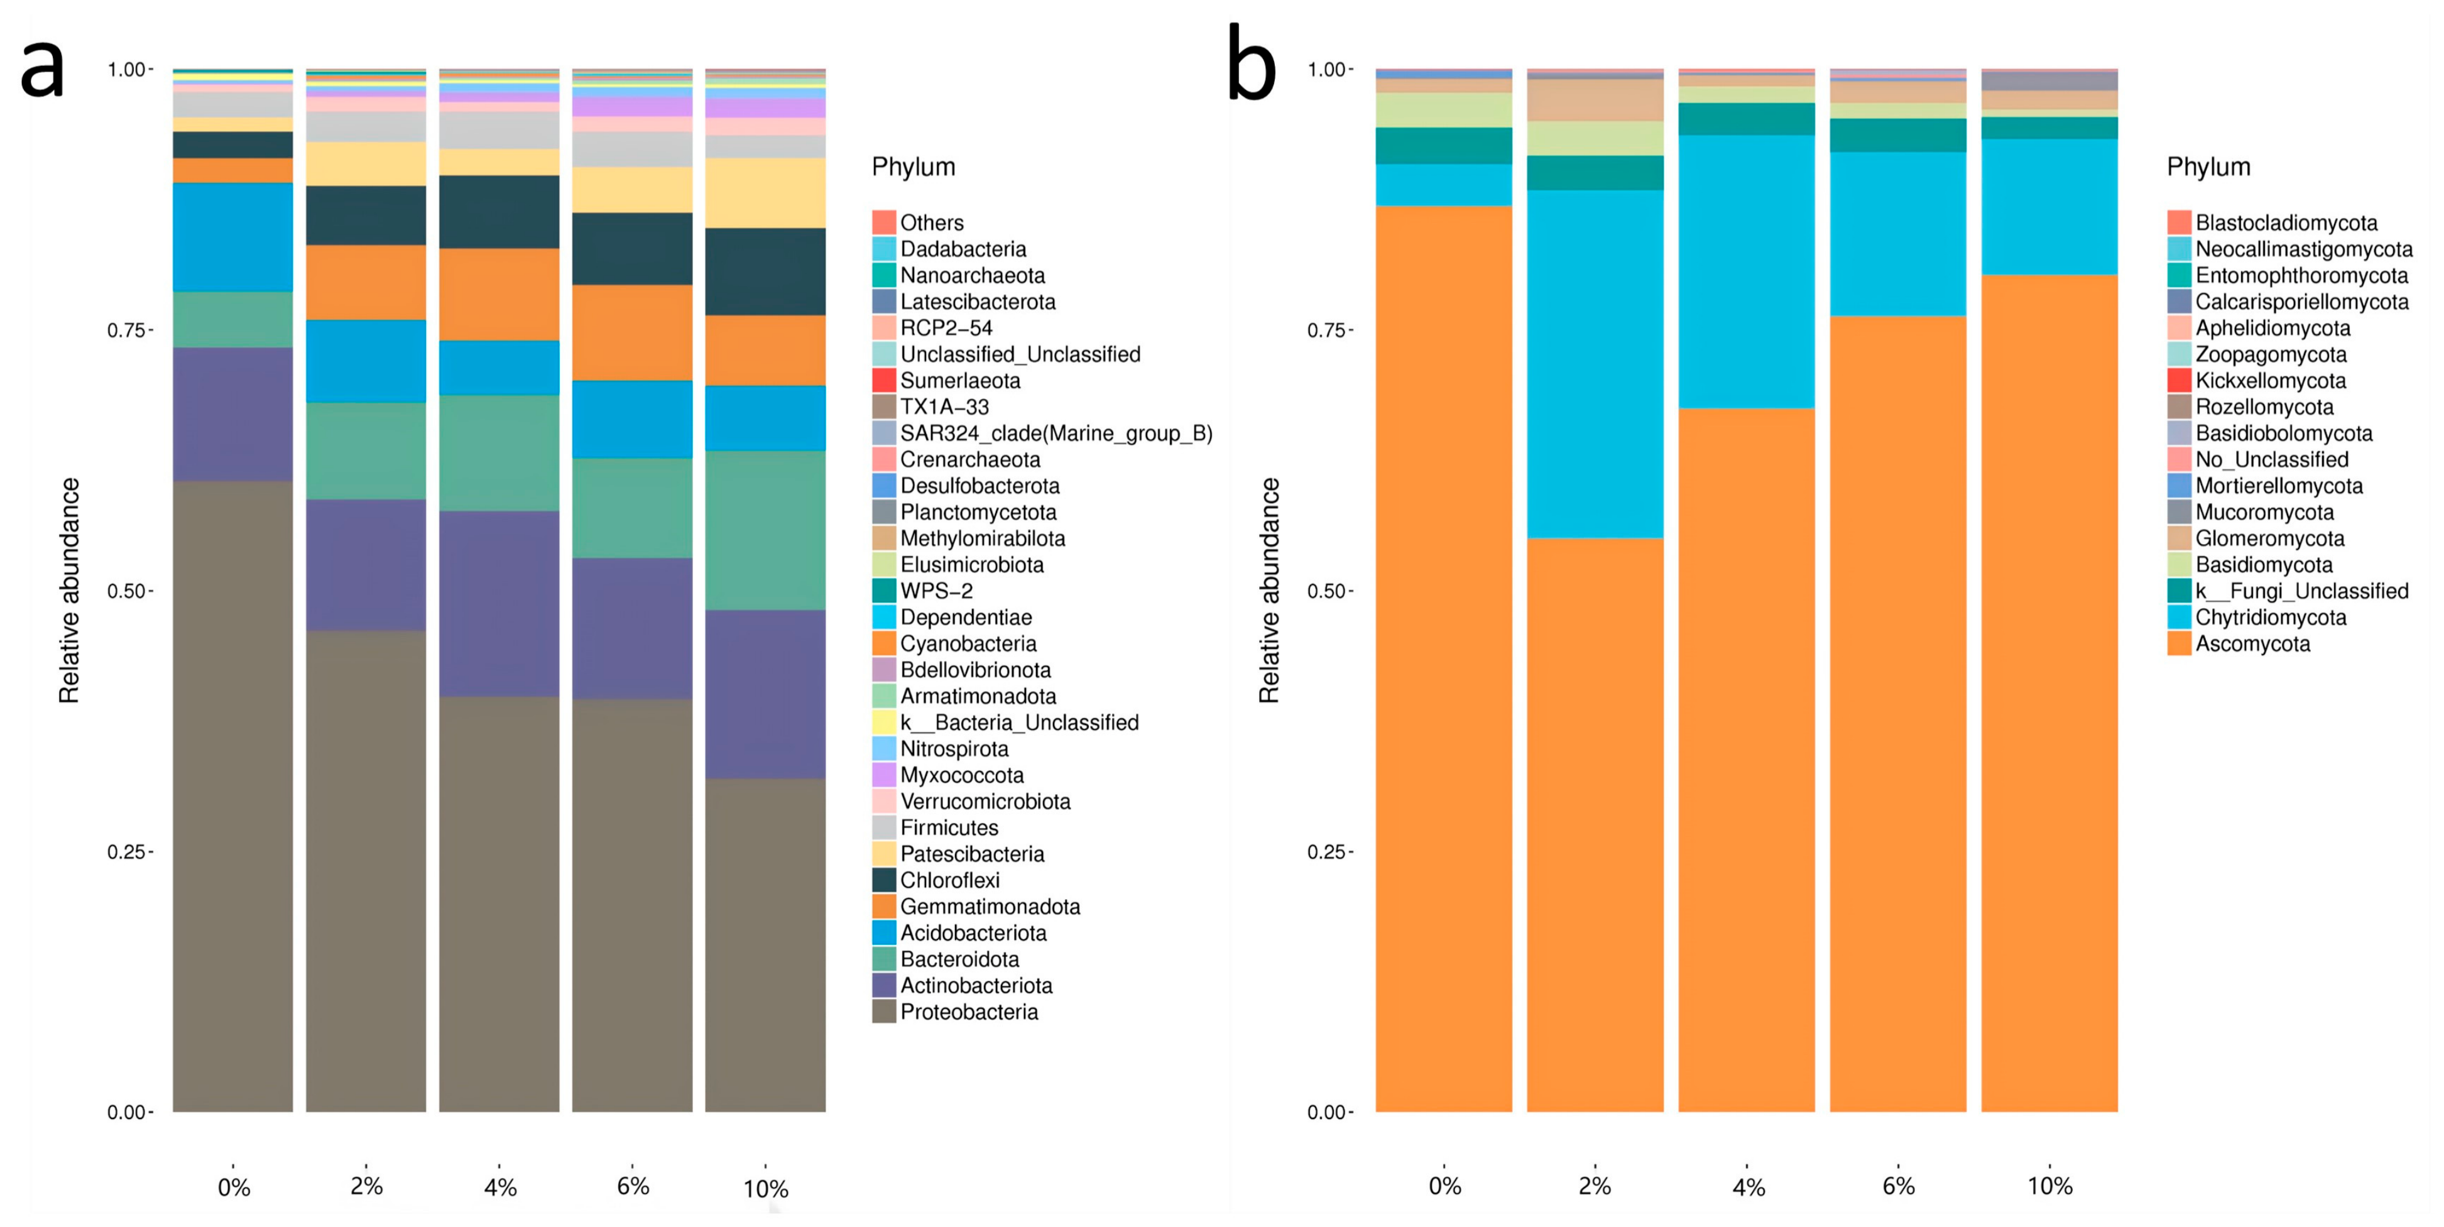
At the phylum level, Proteobacteria and Actinobacteriota were the stable dominant phyla common to all the treatments in the bacterial community, while Gemmatimonadota, Chloroflexi, Patescibacteria, and Firmicutes were the stable subdominant phyla. After the application of biochar, the abundance of phyla, such as Bacteroidota, increased significantly, and the abundance of phyla, such as Nitrospirota, increased slightly; the abundance of Proteobacteria and Acidobacteriota decreased significantly, and Actinobacteriota tended to decrease (Figure 5a). In the fungal community, the dominant status of Ascomycota remained unchanged, but the biochar treatment significantly increased the relative abundance of Chytridiomycota (Figure 5b).
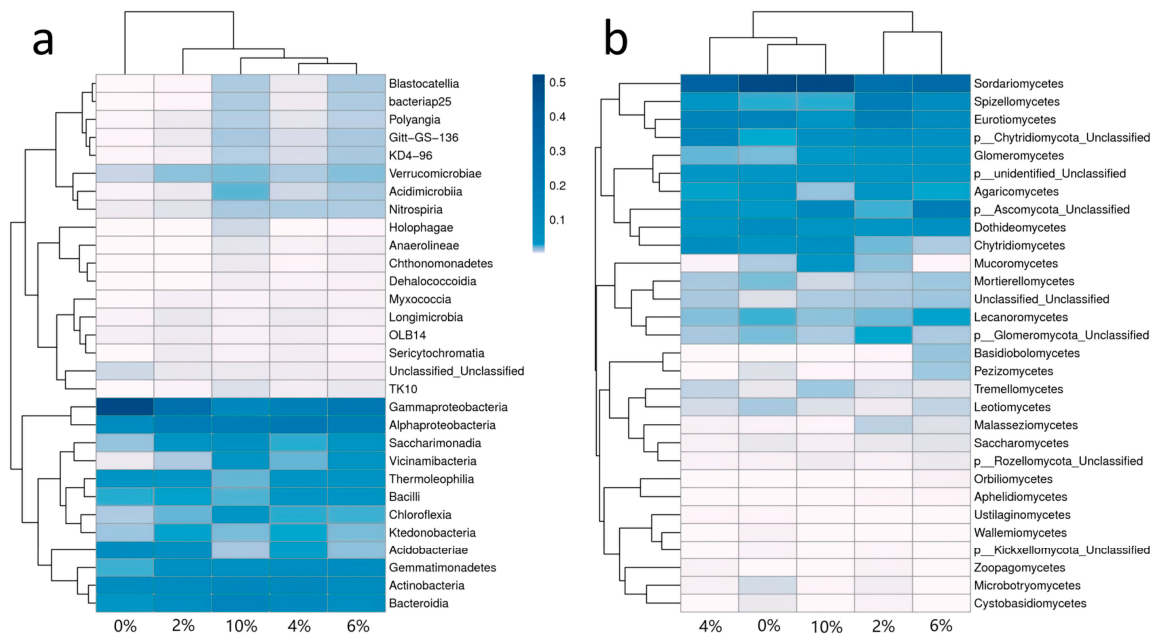
At the class level, Gammaproteobacteria was the core dominant group common to the bacterial communities of different treatments, and its abundance decreased significantly after the application of biochar; the abundances of Gemmatimonadetes and Alphaproteobacteria increased significantly (Figure 6a). In the fungal community, the dominant status of Sordariomycetes was maintained, but the abundance of Eurotiomycetes decreased under the biochar treatment (Figure 6b).
An LEfSe (Linear Discriminant Analysis Effect Size) analysis further identified the genera with significant differences in abundance among the different treatments. A total of 24, 5, 8, 20, and 21 differentially abundant bacterial species were identified in the 0~10% biochar treatments. There was significant enrichment of the taxa in the 6% biochar treatment group, such as f_Gemmatimonaceae; the 10% biochar treatment group was characterized by taxa, such as f_Microscillaceae. For the fungi, only g_Leucocoprinus in the 2% biochar treatment group had a Linear Discriminant Analysis (LDA) score (Figure S4). In terms of the relative abundance of dominant taxa in the microbial community, the biochar treatment significantly increased the abundance of bacterial taxa, such as Chitinophaga and Flavisolibacter. After the biochar treatment, the abundance of Chujaibacter (the most abundant taxon) decreased significantly, while the abundance of taxa, such as Burkholderia-Caballeronia-Paraburkholderia, decreased extremely significantly. In the fungal community, the 6% biochar treatment group had the highest abundance of Trichoderma, and the abundance of Myceliophthora in the control group was significantly higher than that in all the biochar treatment groups (Figure S5).

3.7. Correlation Analysis Between Pepper Rhizosphere Microbial Community Composition and Soil Environmental Factors

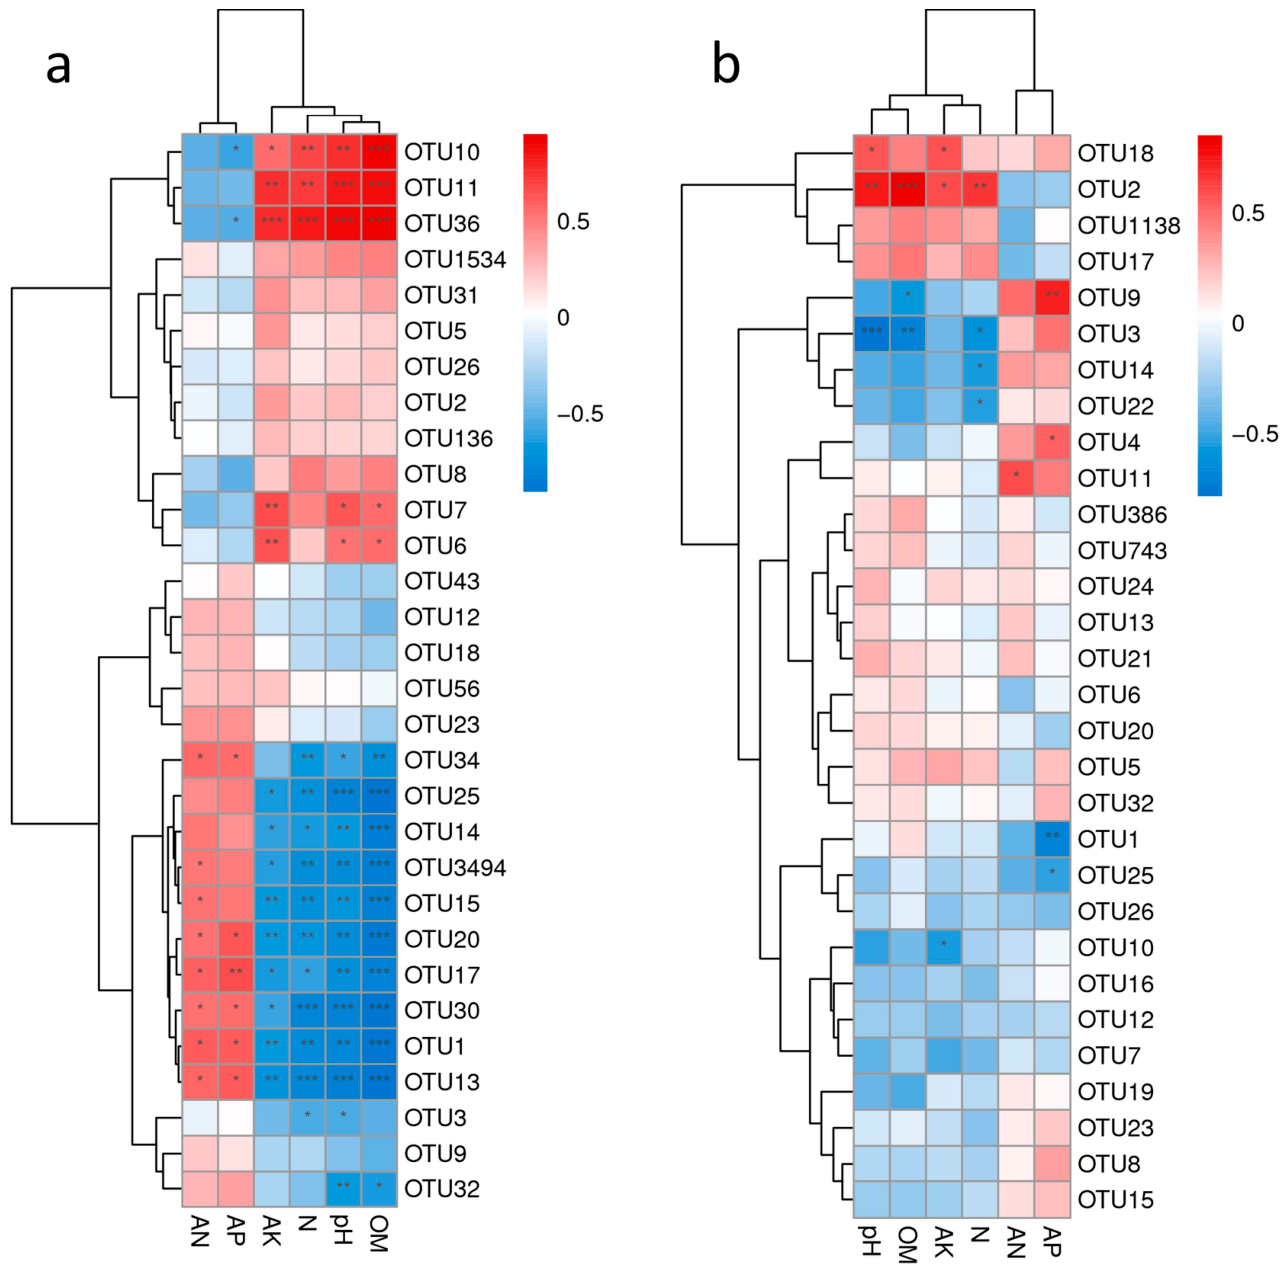
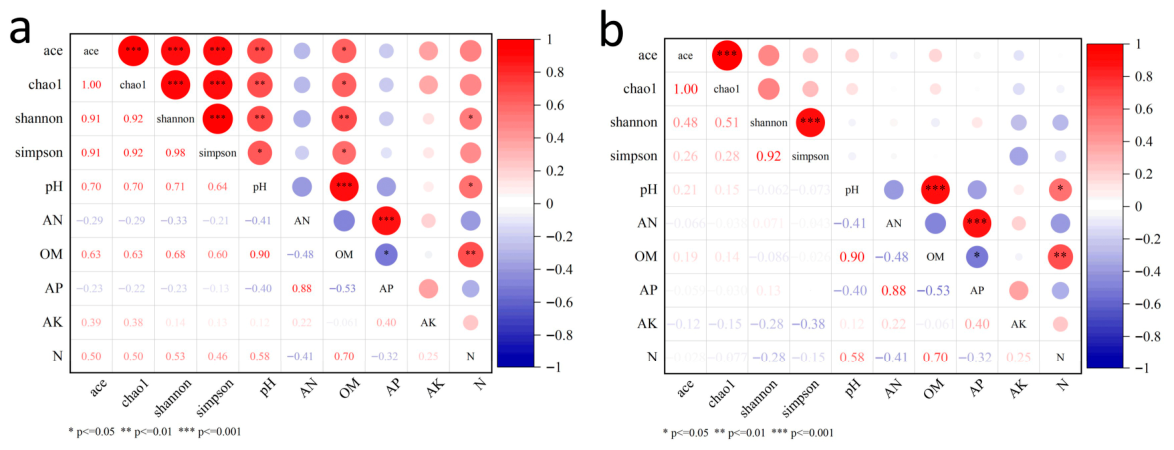
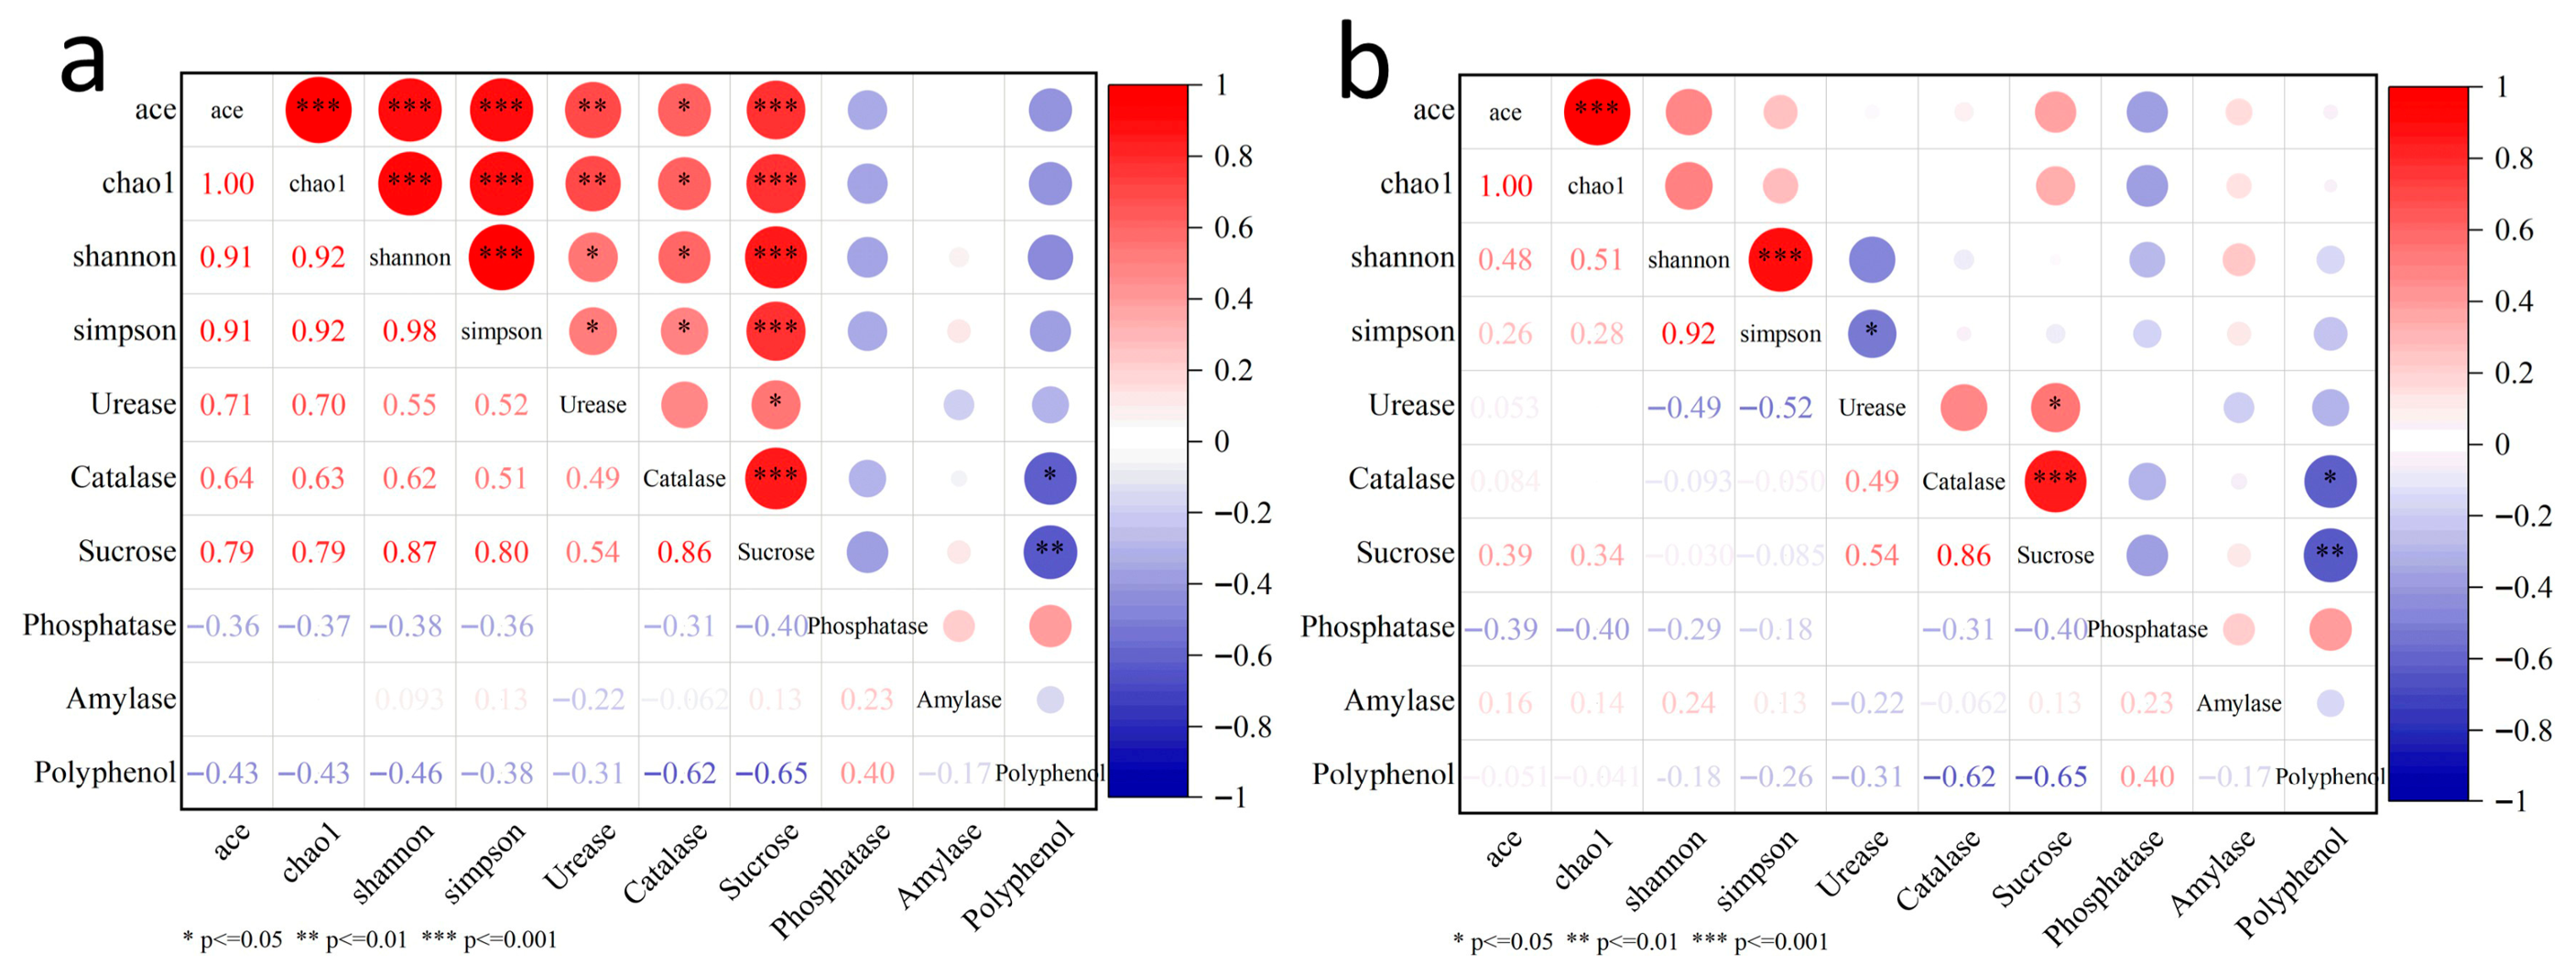
A Spearman correlation analysis showed that OTU10, OTU11, and OTU36 significantly positively correlated with the soil pH, OM, AK, and TN and negatively correlated with the AHN and AP. In contrast, eight bacterial taxa, including OTU34 and OTU3494, responded oppositely to the physicochemical indicators described above (Figure 7a). The fungi had a generally weak correlation between most of the taxa and soil physicochemical properties (Figure 7b). A Pearson analysis indicated that the soil pH and content of OM significantly positively correlated with the bacterial diversity indices (Ace, Chao1, Shannon, and Simpson), and the TN in the soil only significantly positively correlated with the Shannon index (Figure 8a). However, the diversity indices of the fungal community did not significantly correlate with any of the physicochemical indicators (Figure 8b). In the correlation analysis between the rhizosphere microorganisms and enzyme activities, the Ace, Chao1, Shannon, and Simpson indices of the bacteria significantly positively correlated with the activities of urease, catalase, and sucrase in the soil (Figure 9a). Only the Simpson index of the fungi significantly negatively correlated with the activity of urease (Figure 9b).

4. Discussion

4.1. Effects of Biochar Application Rate on the Growth and Yield of Pepper in a Continuous Cropping Protected System

As a common soil amendment, the significant effects of biochar on improving the soil environment and promoting an increase in crop yields have been confirmed by previous studies [38,39]. The sharp decline in pepper yield induced by continuous cropping in the pot experiment reflects the severe growth impairment caused by continuous cropping obstacles in red soil facility systems. This decline resulted from the synergistic deterioration of multiple factors, including soil acidification, structural degradation, organic matter depletion (Table 3), and decreased microbial functionality. The present study demonstrates that biochar application can effectively alleviate such obstacles, which is consistent with the findings of Cakmakcı et al. [40]. Notably, the yield enhancement observed in this study primarily stemmed from the systematic remediation of key constraints in the continuously cropped red soil by biochar acting as a “soil system amendment”, rather than from its direct nutrient supply. Biochar significantly increased soil pH (Table 3), alleviating acid stress, and concurrently elevated soil organic matter, thereby optimizing the microbial habitat. These changes were directly linked to increased bacterial diversity and a general enhancement in the activities of key soil enzymes (Figure 8 and Figure 9), which collectively improved soil health and nutrient cycling efficiency [41]. However, the relationship between biochar application rate and yield increase is not a simple linear one, as it is influenced by multiple factors including soil type, crop variety, and the complex interactive mechanisms described above. Sanchez et al. [42] found that the 2% biochar treatment resulted in fruit that weighed more; Pokovai et al. [43] showed that the yield of pepper first increased and then decreased with the increase in the rate of biochar applied (0~5.0%), and the highest yield was achieved when 2.5% biochar was applied. The results of this study are relatively consistent. The soil organic matter content in the control group decreased significantly over the two-year period, which can be attributed to the inherently low organic matter content of the red soil, this process has an optimal threshold. The core mechanism lies in the indirect regulation of soil biological function mediated by improvements in physicochemical properties, not merely the direct addition of nutrients.

4.2. Effects of Biochar Application Rate on Soil Physicochemical Properties in Red Soil Under Protected Continuous Cropping

The improvement of soil physicochemical properties by biochar in the pot experiment is consistent with the findings of Schulz et al. [44]. The carbonate components in biochar can bind hydrogen ions in the soil solution, thereby significantly increasing soil pH, which creates favorable conditions for enhancing soil biological activity and nutrient availability [45]. Under continuous cropping, soil organic matter in the control treatment decreased significantly over two years, due to the inherently low organic matter content of the red soil, the absence of exogenous carbon input, and the continuous uptake and removal of carbon nutrients by the pepper plants. In contrast, the organic matter content in the biochar-treated groups (6–10%) was significantly higher than that in the control, which agrees with the results of Ding et al. [46]. This may be attributed to the fact that biochar, as a carbon-rich material, is decomposed and utilized by soil microorganisms, thereby promoting the mineralization of soil organic carbon [47,48]. Furthermore, the temporary decrease in alkali-hydrolyzable nitrogen following biochar application is likely associated with the stimulation of microbial proliferation by the added carbon source, leading to increased immobilization of inorganic nitrogen into microbial biomass nitrogen [49]. Overall, biochar application synergistically improved soil fertility and health through three interrelated aspects: raising soil pH, enhancing organic carbon sequestration, and promoting microbial nitrogen immobilization.

4.3. Effects of Biochar Application Rate on Soil Aggregate Composition and the Distribution of Soil Organic Carbon

The physical basis for the increased yield of pepper and improvement in soil physicochemical properties observed in the pot experiment may be linked to optimization of the soil aggregate structure [45]. The laboratory incubation experiments revealed that the content of mechanically stable aggregates in the >2 mm size fraction decreased significantly as the rate of biochar applied increased. This finding is consistent with the observations by Liu et al. [50] in Lou soil but contradicts those by Sun et al. [51]. This discrepancy could potentially be attributed to differences in the texture of the test soil and the raw materials used to produce biochar [50].
Unlike the findings reported by Joseph et al. [52], where the MWD and GMD of the soil aggregates increased, in this study, the MWD and GMD of the mechanically stable aggregates decreased with the increase in the rate of biochar applied. This trend can probably be explained by the dry-sieving method utilized in this study. This method dispersed the macroaggregates into microaggregates, thereby reducing the mechanical stability of the aggregates. However, when higher rates of biochar were applied, the percentage of PAD and ELT in the soil decreased significantly by 30.34%~54.66% and 26.16%~53.44%, respectively. This indicates that the application of biochar can notably enhance the resistance to erosion of the soil and inhibit the degradation of its structure [53].
Organic C acts as a key binding agent for the formation of aggregates and is critical to improve their stability [54]. In this study, the content of total OC in the soil increased significantly by 25.60%~131.85% when increasing rates of biochar were applied, which is consistent with the findings of previous studies [55]. While some studies have suggested that the changes in OC depend primarily on macroaggregates [56], this study found that the content of OC in the aggregates of all the sizes of fractions increased significantly with higher inputs of biochar. This implies that biochar not only directly introduces exogenous C into aggregates across different sizes of fractions, but it can also adsorb organic molecules and promote the formation of aggregates owing to its porous structure and surface properties. Thus, it comprehensively enhances the ability of OC to sequester C [57]. Additionally, Luan et al. [58] observed that the soil OC is preferentially enriched in the macroaggregates, which may explain why the >2 mm aggregate fraction exhibited the highest rate of contribution of OC in this study.

4.4. Effects of Biochar Application Rate on Soil Enzyme Activities in a Protected Continuous Cropping System

Soil enzymes, which are secreted by soil microorganisms and plant roots, act as key biocatalysts to catalyze the decomposition of soil OM and nutrient cycling [59]. This study found that the addition of biochar significantly increased the activity of catalase, which is consistent with the findings of Masto et al. [60]. The underlying reason may be that biochar promotes the metabolic activities of microorganisms by improving the soil microenvironment [48]. The enhanced activities of urease and invertase might be associated with the increase in soil pH induced by biochar [61,62]. Zhang et al. [63] reported a significant negative correlation between the activity of PPO and the contents of OC and TN. In this study, the application of biochar increased the contents of OC and TN. Thus, it is hypothesized that the activity of this enzyme was inhibited.
Therefore, biochar application enhanced the activities of key enzymes involved in soil carbon and nitrogen cycling. This increase not only reflects an enhancement of soil biochemical activity but also provides a catalytic foundation for microbially driven nutrient transformation, thereby facilitating the recovery of soil metabolic functions.

4.5. Regulation of the Rhizosphere Soil Microbial Environment by Biochar Application Rate

Soil microorganisms are the core mediators that drive the decomposition of organic matter and nutrient cycling, and their community dynamics serve as sensitive indicators to assess soil quality [64,65]. This study revealed that biochar amendment significantly increased microbial abundance, reflecting a pronounced microbial response to the alleviation of key soil constraints, such as low pH and limited organic matter [66]. However, this microbial proliferation did not intensify competition with plants for nitrogen, as evidenced by the concurrent improvement in pepper growth and yield. The key lies in the stoichiometric balance of the soil carbon-to-nitrogen (C/N) ratio: when the soil C/N ratio remains below the threshold of 25:1—a condition met across all biochar treatments in this experiment—microbial activity tends to promote net nitrogen mineralization rather than net immobilization, thereby helping to maintain plant-available nitrogen pools [67]. Consequently, the increase in microbial biomass was primarily driven by the input of exogenous carbon and improved habitat conditions, rather than by competition for mineral nitrogen. The enhanced microbial activity further stimulated the turnover and mineralization of organic nitrogen, establishing a more efficient and sustainable nutrient-supply pattern [68]. Furthermore, biochar application significantly increased soil microbial diversity and community richness, which is consistent with the findings of Chen et al. [69] and Gul et al. [47]. The variation in microbial community abundance is primarily attributed to the porous structure of biochar and the optimized soil aggregate structure, which provide sufficient space for growth and attachment sites for microorganisms [48]. Moreover, the changes in soil nutrients and pH induced by biochar also directly affect the composition of bacterial communities [70,71].
At the phylum level, the abundance of Acidobacteriota, an acidophilic oligotrophic group [19], decreased in the groups treated with biochar. This is consistent with the findings of Taketani et al. [72] and indicates that biochar inhibits the proliferation of this group by increasing the contents of nutrients in the soil. As shown by Nicol et al. [73], the increase in soil pH is a key driver for the enhanced abundance of Nitrospirota. Bacteroidota, as the main mineralizer of soil OC [74], was directly stimulated to proliferate by the increased OC from the application of biochar. This not only provides energy for its own growth but also promotes the enhancement of other microorganisms and the activities of soil enzymes [75]. The dominant fungal phylum Ascomycota, which can decompose organic matter and thus, plays an important role in the C cycle, shows increased abundance in environments with high nutrients and enrichment of N [76].
At the class level, the relative abundance of Alphaproteobacteria increased significantly, while that of Gammaproteobacteria decreased, which differs from the findings of Wang et al. [77]. This discrepancy might have arisen because the study by Wang et al. focused on alkaline soil in which the soil pH increased further after the addition of biochar. In contrast, the slightly acidic soil in this study maintained a pH range of 5.2~5.9 following the application of biochar. Such variation in soil acidity is probably the key driver of the divergent results. The extracellular enzymes secreted by Alphaproteobacteria can facilitate the mineralization of recalcitrant OM. Their metabolic activities not only enhance the ability of plants to take up the available nutrients, such as N and P, but also convert complex OC into low molecular weight organic acids, thus providing metabolic substrates for other microorganisms [78,79].
At the genus level, the application of biochar increased the abundance of Flavisolibacter, a genus associated with C sequestration, which is consistent with the findings of Zhang et al. [45] and presumably linked to the improved stability of soil aggregates (Table 8). The abundances of Sphingomonas and Streptomyces (with biocontrol potential) increased in the soil amended with biochar. The reason could be that these genera grow better because they secrete extracellular enzymes to degrade the aromatic compounds in biochar [80,81]. There was a significant increase in the abundance of Chitinophaga since this genus can secrete chitinases to degrade the cell walls of fungi and release intracellular nutrients, thereby promoting the growth of crops [75]. Additionally, the abundance of Burkholderia-Caballeronia-Paraburkholderia decreased significantly in the group treated with biochar [82,83], possibly owing to the elevated soil pH. Despite the fluctuations in individual genera, the marked improvement in pepper growth indicators in the group treated with biochar suggests that the promotion of crop growth by biochar is a multi-factor coupling process, with synergistic effects of multiple beneficial microbial communities jointly driving positive crop growth responses.
In summary, biochar application not only altered the abundance and community composition of soil microorganisms but also drove the shift in the soil microbial community from an acidic oligotrophic type to a eutrophic and metabolically active type. This reshaped microbial community exhibited stronger capabilities in organic matter decomposition, nutrient transformation, and ecological stability. The changes in the microbial community and the enhancement of key soil enzyme activities were functionally interrelated and synergistically reinforced, collectively contributing to the improvement of soil health.

4.6. Linkages Between Rhizosphere Microbial Community Structure and Soil Physicochemical Properties as Well as Enzyme Activities

A multi-dimensional comparative analysis revealed that the soil bacterial communities are more sensitive to the changes in environmental factors. The Spearman correlation analysis showed that the different OTUs exhibited distinct clustering patterns in their correlations with various soil nutrient indicators, which probably stemmed from inherent differences in the bacterial metabolic pathways and ecological functions. Consistent with Hou et al. [84], the soil pH and content of OM in this study strongly positively correlated with the Ace, Chao1, Simpson, and Shannon indices of the bacterial community. This correlation indicated that both are key drivers of the changes in soil bacterial community structure. This finding is because the pH not only directly affects the microbial habitat [85] but also indirectly modulates the microbial activities by regulating the availability of nutrients in the soil [86]. Moreover, the bacterial diversity and indices of abundance in the soil significantly positively correlated with the activities of urease, catalase, and invertase. The increase in microbial abundance directly stimulated the secretion of enzymes after biochar was added to the soil [87]. Concurrently, the enhanced enzyme activity also accelerated the mineralization of OM [88,89]. This positive feedback loop of “increased microorganisms—enhanced enzyme activity—rapid turnover of organic matter” exerts a beneficial effect on improving the soil microenvironment.
Appropriate biochar application improves pepper growth and soil health in protected continuous cropping systems by driving a physicochemical-biological synergistic improvement of the soil. The porous structure of biochar enhances soil aeration and adsorbs nutrients, reducing nutrient leaching [90]; its alkaline nature and high organic matter content effectively raise the pH of acidic red soil and optimize nutrient availability [91]; furthermore, biochar promotes the formation of soil macroaggregates and increases the storage of organic carbon within aggregates, providing an ample carbon source and habitat for microorganisms [92]. These improvements in soil physicochemical properties optimize the microbial habitat, not only facilitating the enrichment of functional microbial groups but also enhancing the activities of key enzymes involved in carbon and nitrogen cycling, thereby promoting a positive feedback loop among microorganisms, enzymes, and substrates. This feedback loop is progressively strengthened over the continuous cropping period, allowing a single biochar application to exert cross-seasonal lasting effects, ultimately reflected in an overall enhancement of soil nutrient cycling efficiency, system buffering capacity, and resilience. However, biochar application is not beneficial at excessive rates: over-application may release or accumulate harmful substances, reduce available inorganic nitrogen, and destabilize the soil microbial community structure, ultimately leading to reduced pepper yield [93].

5. Limitations and Future Perspectives

Although this study provides evidence under controlled conditions that biochar can alleviate continuous cropping obstacles in red soil, it has certain limitations. While the two-year pot experiment was sufficient to reveal initial dose–response trends, it may not have fully captured the long-term dynamics of biochar effects and soil degradation. Moreover, although the pot experimental design allows precise management, it likely cannot fully simulate the complex interactions and environmental variability encountered in actual agricultural production. Therefore, future research should prioritize multi-site field trials across different ecological regions or farm soils. Such trials would not only quantify the absolute yield-enhancing effects of biochar under real production conditions, but also systematically evaluate the stability and generalizability of its effects across diverse environmental and soil contexts, thus comprehensively evaluating its field application potential and promotional value. In addition, our findings are based on a single biochar type; therefore, generalizability to biochars produced from other feedstocks or under different production processes requires further investigation.

6. Conclusions

This study evaluated the effects of biochar application rates on alleviating continuous cropping obstacles of pepper in protected red soil systems, and explored the synergistic mechanisms in terms of soil physicochemical properties, enzyme activities, and microbial communities. Appropriate biochar application (6% as the optimal rate) increased pepper yield and improved soil health. Specifically, biochar synergistically improved soil physicochemical properties, enhanced aggregate stability and organic carbon sequestration, and, by raising soil pH and organic matter content, drove the microbial community shift from acidophilic oligotrophs to eutrophic taxa. These findings indicate that biochar effectively restores continuous cropping soil health by synergistically modifying multiple key soil attributes, providing a theoretical basis for red soil health management and sustainable protected pepper production in southern China.

Supplementary Materials

The following supporting information can be downloaded at: https://www.mdpi.com/article/10.3390/horticulturae12050515/s1, Table S1: Input loads of key components under different biochar application rates, Table S2: 16S method: PCR amplification conditions; Table S3: ITS method: PCR amplification conditions; Table S4: Effect of biochar addition on soil carbon content; Table S5: Alpha rarefaction of the rhizosphere soil under different biochar application after two years of pepper continuous cropping; Table S6: Effective sequence numbers for bacteria and fungi in the rhizosphere soil under different biochar application after two years of pepper continuous cropping; Table S7: Quantities of bacterial and fungal communities in the rhizosphere soil at different levels under different biochar application after two years of pepper continuous cropping; Figure S1: (a) Zeta potential of the biochar as a function of pH (measured at pH 3, 7, and 10), and (b) Fourier transform infrared (FTIR) spectrum of the biochar; Figure S2: Analysis of Rank-abundance curves of the rhizosphere soil bacteria (a) and fungi (b) under different biochar application after two years of pepper continuous cropping; Figure S3: Similarity analysis of the rhizosphere soil bacteria (a) and fungi (b) under different biochar addition after two years of pepper continuous cropping; Figure S4: LEfSe analysis of bacterial genera and fungal genera in soil under different biochar addition. (a) LDA score diagram of bacteria (b) Cladogram of bacteria (c) LDA score diagram of fungi (d) Cladogram of fungi. The Cladogram is a species clustering evolutionary tree, with different background regions representing different subgroups, and different color nodes in the branches representing microbial groups that play an important role in corresponding different treatments. Yellow nodes indicate that the taxon is not significantly different across all groups; Figure S5: Relative abundance of the rhizosphere soil bacteria (a) and fungi (b) groups at the genus level under different biochar addition after two years of pepper continuous cropping. The x axis represents the average relative abundance in different groups of species, and the columns of different colors represent different groups. Different lowercase letters indicate significant differences (ANOVA, Tukey’s HSD test; p < 0.05) among the three salinity gradients. On the far right is the p value: *, p < 0.05; **, p < 0.01; ***, p <0.001. NA, not available, indicates that the taxa cannot be detected in some groups.

Author Contributions

Z.R. designed, implemented experiments, and write this manuscript. A.W., H.C., Y.L. and Z.Q. collected the data. S.S., B.C., Q.S., H.Y. and F.Y. analyzed and interpreted the data. C.C. contributed to the conception, design, implementation, and funding acquisition. All authors have read and agreed to the published version of the manuscript.

Funding

This study was funded by the Central-Guided Local Science and Technology Development Fund Program of China (20261BDF030013), the Natural Science Foundation of Jiangxi Province, China (20252BAC200403), the Science and technology research project of Jiangxi Provincial Department of Education (GJJ2401107), and the Key Research and Development Project of Ganzhou city, Jiangxi Province of China (GZ2024ZDY032).

Data Availability Statement

The original contributions presented in this study are included in thearticle/Supplementary Material. Further inquiries can be directed to the corresponding author.

Acknowledgments

We would like to thank MogoEdit (https://www.mogoedit.com (accessed on 12 April 2026)) for its English editing during the preparation of this manuscript.

Conflicts of Interest

The authors declare that they have no conflicts of interest.

References

  1. Duan, Y.H.; Hanson, B.S.G. Effects of biochar and fertilizer sources on nitrogen uptake by chilli pepper plants under Mediterranean climate. Soil Use Manag. 2022, 38, 714–728. [Google Scholar] [CrossRef]
  2. Wang, L.H.; Zhang, B.X.; Zhang, Z.H.; Cao, Y.C.; Yu, H.L.; Feng, X.G. Status in Breeding and Production of Capsicum spp. in China During “The Thirteenth Five-Year Plan” Period and Future Prospect. China Veg. 2021, 41, 21–29. [Google Scholar] [CrossRef]
  3. Zhao, Y.; Lv, H.; Qasim, W.; Wan, L.; Wang, Y.; Lian, X.; Liu, Y.; Hu, J.; Wang, Z.; Li, G.; et al. Drip fertigation with straw incorporation significantly reduces N2O emission and N leaching while maintaining high vegetable yields in solar greenhouse production. Environ. Pollut. 2021, 273, 116521. [Google Scholar] [CrossRef] [PubMed]
  4. Chen, F.; Xie, Y.; Jia, Q.; Li, S.; Li, S.; Shen, N.; Jiang, M.; Wang, Y. Effects of the Continuous Cropping and Soilborne Diseases of Panax Ginseng C. A. Meyer on Rhizosphere Soil Physicochemical Properties, Enzyme Activities, and Microbial Communities. Agronomy 2023, 13, 210. [Google Scholar] [CrossRef]
  5. Lehmann, J.; Bossio, D.A.; Kögel-Knabner, I.; Rillig, M.C. The concept and future prospects of soil health. Nat. Rev. Earth Environ. 2020, 1, 544–553. [Google Scholar] [CrossRef]
  6. Cardoso, E.J.B.N.; Vasconcellos, R.L.F.; Bini, D.; Miyauchi, M.Y.H.; dos Santos, C.A.; Alves, P.R.L.; de Paula, A.M.; Nakatani, A.S.; Pereira, J.d.M.; Nogueira, M.A. Soil health: Looking for suitable indicators. What should be considered to assess the effects of use and management on soil health? Sci. Agric. 2013, 70, 274–289. [Google Scholar] [CrossRef]
  7. Pervaiz, Z.H.; Iqbal, J.; Zhang, Q.; Chen, D.; Wei, H.; Saleem, M. Continuous Cropping Alters Multiple Biotic and Abiotic Indicators of Soil Health. Soil Syst. 2020, 4, 59. [Google Scholar] [CrossRef]
  8. Yuan, J.; Xu, R.; Zhang, H. The forms of alkalis in the biochar produced from crop residues at different temperatures. Bioresour. Technol. 2011, 102, 3488–3497. [Google Scholar] [CrossRef]
  9. Liu, X.; Zheng, J.; Zhang, D.; Cheng, K.; Zhou, H.; Zhang, A.; Li, L.; Joseph, S.; Smith, P.; Crowley, D. Biochar has no effect on soil respiration across Chinese agricultural soils. Sci. Total Environ. 2016, 554–555, 259–265. [Google Scholar] [CrossRef]
  10. Lychuk, T.E.; Izaurralde, R.C.; Hill, R.L.; McGill, W.B.; Williams, J.R. Biochar as a global change adaptation: Predicting biochar impacts on crop productivity and soil quality for a tropical soil with the Environmental Policy Integrated Climate (EPIC) model. Mitig. Adapt. Strateg. Glob. Change 2015, 20, 1437–1458. [Google Scholar] [CrossRef]
  11. Chagas, J.K.M.; Figueiredo, C.C.; de Lacerda, L.; Ramos, M.L.; Gerosa, C.E. Biochar increases soil carbon pools: Evidence from a global meta-analysis. J. Environ. Manag. 2022, 305, 114403. [Google Scholar] [CrossRef]
  12. Kocsis, T.; Ringer, M.; Biró, B. Characteristics and Applications of Biochar in Soil–Plant Systems: A Short Review of Benefits and Potential Drawbacks. Appl. Sci. 2022, 12, 4051. [Google Scholar] [CrossRef]
  13. Cayuela, M.L.; van Zwieten, L.; Singh, B.P.; Jeffery, S.; Roig, A.; Sánchez-Monedero, M.A. Biochar’s role in mitigating soil nitrous oxide emissions: A review and meta-analysis. Agric. Ecosyst. Environ. 2014, 191, 5–16. [Google Scholar] [CrossRef]
  14. Cheng, J.; Lee, X.; Tang, Y.; Zhang, Q. Long-term effects of biochar amendment on rhizosphere and bulk soil microbial communities in a karst region, southwest China. Appl. Soil Ecol. 2019, 140, 126–134. [Google Scholar] [CrossRef]
  15. Pan, X.; Shu, T.; Shi, R.; Mao, X.; Li, J.; Nkoh, J.N.; Xu, R. The Synergistic Effects of Rice Straw-Pyrolyzed Biochar and Compost on Acidity Mitigation and Carbon Sequestration in Acidic Soils: A Comparative Study. Sustainability 2025, 17, 4408. [Google Scholar] [CrossRef]
  16. Zhang, N.; Nunan, N.; Hirsch, P.; Sun, B.; Zhou, J.; Liang, Y. Theory of microbial coexistence in promoting soil–plant ecosystem health. Biol. Fertil. Soils 2021, 57, 897–911. [Google Scholar] [CrossRef]
  17. Goldberg, E.D. Black Carbon in the Environment: Properties and Distribution; Wiley: New York, NY, USA, 1985. [Google Scholar]
  18. Chen, H.; Ma, J.; Wei, J.; Gong, X.; Yu, X.; Guo, H.; Zhao, Y. Biochar increases plant growth and alters microbial communities via regulating the moisture and temperature of green roof substrates. Sci. Total Environ. 2018, 635, 333–342. [Google Scholar] [CrossRef] [PubMed]
  19. Chen, J.H.; Liu, X.Y.; Li, L.Q.; Zheng, J.W.; Qu, J.J.; Zheng, J.F.; Zhang, X.H.; Pan, G.X. Consistent increase in abundance and diversity but variable change in community composition of bacteria in topsoil of rice paddy under short term biochar treatment across three sites from South China. Appl. Soil Ecol. 2015, 91, 68–79. [Google Scholar] [CrossRef]
  20. Demisie, W.; Liu, Z.; Zhang, M. Effect of biochar on carbon fractions and enzyme activity of red soil. CATENA 2014, 121, 214–221. [Google Scholar] [CrossRef]
  21. Durenkamp, M.; Luo, Y.; Brookes, P. Impact of black carbon addition to soil on the determination of soil microbial biomass by fumigation extraction. Soil Biol. Biochem. 2010, 42, 2026–2029. [Google Scholar] [CrossRef]
  22. Khan, T.F.; Ahmed, M.M.; Huq, S.M.I. Effects of Biochar on the Abundance of Three Agriculturally Important Soil Bacteria. J. Agric. Chem. Environ. 2014, 3, 2. [Google Scholar] [CrossRef][Green Version]
  23. Kong, L.; Gao, Y.; Zhou, Q.; Zhao, X.; Sun, Z. Biochar accelerates PAHs biodegradation in petroleum-polluted soil by biostimulation strategy. J. Hazard. Mater. 2018, 343, 276–284. [Google Scholar] [CrossRef]
  24. Palansooriya, K.N.; Wong, J.T.F.; Hashimoto, Y.; Huang, L.; Rinklebe, J.; Chang, S.X.; Bolan, N.; Wang, H.; Ok, Y.S. Response of microbial communities to biochar-amended soils: A critical review. Biochar 2019, 1, 3–22. [Google Scholar] [CrossRef]
  25. Wang, Y.; Ma, Z.; Wang, X.; Sun, Q.; Dong, H.; Wang, G.; Chen, X.; Yin, C.; Han, Z.; Mao, Z. Effects of biochar on the growth of apple seedlings, soil enzyme activities and fungal communities in replant disease soil. Sci. Hortic. 2019, 256, 108641. [Google Scholar] [CrossRef]
  26. Zhao, X.; Wang, S.; Xing, G. Nitrification, acidification, and nitrogen leaching from subtropical cropland soils as affected by rice straw-based biochar: Laboratory incubation and column leaching studies. J. Soils Sediments 2014, 14, 471–482. [Google Scholar] [CrossRef]
  27. Mantel, S.; Dondeyne, S.; Deckers, S. World reference base for soil resources (WRB). In Encyclopedia of Soils in the Environment, 2nd ed.; Goss, M.J., Oliver, M., Eds.; Academic Press: Oxford, UK, 2023; pp. 206–217. [Google Scholar] [CrossRef]
  28. Chen, X.; Liu, L.; Yang, Q.; Xu, H.; Shen, G.; Chen, Q. Optimizing Biochar Application Rates to Improve Soil Properties and Crop Growth in Saline-Alkali Soil. Sustainability 2024, 16, 2523. [Google Scholar] [CrossRef]
  29. Deenik, J.L.; McClellan, T.; Uehara, G.; Antal, M.J.; Campbell, S. Charcoal Volatile Matter Content Influences Plant Growth and Soil Nitrogen Transformations. Soil Sci. Soc. Am. J. 2010, 74, 1259–1270. [Google Scholar] [CrossRef]
  30. Wang, X.K.; Huang, J.L. (Eds.) Principles and Techniques of Plant Physiological and Biochemical Experiments, 3rd ed.; Science Press: Beijing, China, 2015; p. 308. [Google Scholar]
  31. Bao, S.D. (Ed.) Soil Agrochemical Analysis, 3rd ed.; China Agriculture Press: Beijing, China, 2000; p. 495. [Google Scholar]
  32. Guan, S.Y.; Zhang, D.; Zhang, Z. (Eds.) Soil Enzymes and Their Assay Methods; China Agriculture Press: Beijing, China, 1986; p. 376. [Google Scholar]
  33. Xu, G.H.; Zheng, H.Y. (Eds.) Handbook of Soil Microbial Analysis Methods; China Agriculture Press: Beijing, China, 1986; p. 314. [Google Scholar]
  34. Liang, J.-P.; Xue, Z.-Q.; Yang, Z.-Y.; Chai, Z.; Niu, J.-P.; Shi, Z.-Y. Effects of microbial organic fertilizers on Astragalus membranaceus growth and rhizosphere microbial community. Ann. Microbiol. 2021, 71, 11. [Google Scholar] [CrossRef]
  35. Covaleda, S.; Pajares, S.; Gallardo, J.F.; Etchevers, J.D. Short-term changes in C and N distribution in soil particle size fractions induced by agricultural practices in a cultivated volcanic soil from Mexico. Org. Geochem. 2006, 37, 1943–1948. [Google Scholar] [CrossRef]
  36. Bavel, C. Mean Weight-Diameter of Soil Aggregates as a Statistical Index of Aggregation1. Soil Sci. Soc. Am. J. 1950, 14, 20–23. [Google Scholar] [CrossRef]
  37. Gardner, W.R. Representation of Soil Aggregate-Size Distribution by a Logarithmic-Normal Distribution1, 2. Soil Sci. Soc. Am. J. 1956, 20, 151–153. [Google Scholar] [CrossRef]
  38. Jeffery, S.; Verheijen, F.G.A.; van der Velde, M.; Bastos, A.C. A quantitative review of the effects of biochar application to soils on crop productivity using meta-analysis. Agric. Ecosyst. Environ. 2011, 144, 175–187. [Google Scholar] [CrossRef]
  39. Renner, R. Rethinking biochar. Environ. Sci. Technol. 2007, 41, 5932–5933. [Google Scholar] [CrossRef]
  40. Cakmakcı, T.; Sahın, U. Yield, Physiological Responses and Irrigation Water Productivity of Capia Pepper (Capsicum annuum L.) at Deficit Irrigation and Different Biochar Levels. Gesunde Pflanz. 2023, 75, 317–327. [Google Scholar] [CrossRef]
  41. Rutigliano, F.A.; Romano, M.; Marzaioli, R.; Baglivo, I.; Baronti, S.; Miglietta, F.; Castaldi, S. Effect of biochar addition on soil microbial community in a wheat crop. Eur. J. Soil Biol. 2014, 60, 9–15. [Google Scholar] [CrossRef]
  42. Sanchez, E.; Zabaleta, R.; Navas, A.L.; Torres-Sciancalepore, R.; Fouga, G.; Fabani, M.P.; Rodriguez, R.; Mazza, G. Assessment of Pistachio Shell-Based Biochar Application in the Sustainable Amendment of Soil and Its Performance in Enhancing Bell Pepper (Capsicum annuum L.) Growth. Sustainability 2024, 16, 4429. [Google Scholar] [CrossRef]
  43. Pokovai, K.; Tóth, E.; Horel, Á. Growth and Photosynthetic Response of Capsicum annuum L. in Biochar Amended Soil. Appl. Sci. 2020, 10, 4111. [Google Scholar] [CrossRef]
  44. Schulz, H.; Dunst, G.; Glaser, B. No Effect Level of Co-Composted Biochar on Plant Growth and Soil Properties in a Greenhouse Experiment. Agronomy 2014, 4, 34–51. [Google Scholar] [CrossRef]
  45. Zhang, C.; Liang, A.J.; Li, Y.Y.; Song, Q.Y.; Li, X.Y.; Li, D.P.; Hou, N. Insight into the Soil Aggregate-Mediated Restoration Mechanism of Degraded Black Soil via Biochar Addition: Emphasizing the Driving Role of Core Microbial Communities and Nutrient Cycling. Environ. Res. 2023, 228, 115895. [Google Scholar] [CrossRef]
  46. Ding, X.; Li, G.; Zhao, X.; Lin, Q.; Wang, X. Biochar Application Significantly Increases Soil Organic Carbon Under Conservation Tillage: An 11-Year Field Experiment. Biochar 2023, 5, 28. [Google Scholar] [CrossRef]
  47. Gul, S.; Whalen, J.; Thomas, B.; Sachdeva, V.; Deng, H. Physico-Chemical Properties and Microbial Responses in Biochar-Amended Soils: Mechanisms and Future Directions. Agric. Ecosyst. Environ. 2015, 206, 46–59. [Google Scholar] [CrossRef]
  48. Lehmann, J.; Rillig, M.C.; Thies, J.; Masiello, C.A.; Hockaday, W.C.; Crowley, D. Biochar Effects on Soil Biota—A Review. Soil Biol. Biochem. 2011, 43, 1812–1836. [Google Scholar] [CrossRef]
  49. Wang, D.; Li, H.; Chen, L.K.; Zhao, P.; Long, G.Q. Effects of Intercropping and Nitrogen Application on Soil Microbial Metabolic Functional Diversity in Maize Cropping Soil. J. Appl. Ecol. 2022, 33, 793–800. [Google Scholar] [CrossRef]
  50. Liu, X.; Han, F.; Zhang, X. Effect of Biochar on Soil Aggregates in the Loess Plateau: Results from Incubation Experiments. Int. J. Agric. Biol. 2012, 14, 975–979. [Google Scholar]
  51. Sun, J.; Sun, J.; Lu, X.; Chen, G.; Luo, N.; Zhang, Q.; Zhang, Q.; Li, X.; Li, X. Biochar Promotes Soil Aggregate Stability and Associated Organic Carbon Sequestration and Regulates Microbial Community Structures in Mollisols from Northeast China. SOIL 2023, 9, 261–275. [Google Scholar] [CrossRef]
  52. Joseph, U.E.; Toluwase, A.O.; Kehinde, E.O.; Omasan, E.E.; Tolulope, A.Y.; George, O.O.; Zhao, C.; Hongyan, W. Effect of Biochar on Soil Structure and Storage of Soil Organic Carbon and Nitrogen in the Aggregate Fractions of an Albic Soil. Arch. Agron. Soil Sci. 2020, 66, 1–12. [Google Scholar] [CrossRef]
  53. Sheng, M.H.; Ai, X.Y.; Huang, B.C.; Zhu, M.K.; Liu, Z.Y.; Ai, Y.W. Effects of Biochar Additions on the Mechanical Stability of Soil Aggregates and Their Role in the Dynamic Renewal of Aggregates in Slope Ecological Restoration. Sci. Total Environ. 2023, 898, 165478. [Google Scholar] [CrossRef] [PubMed]
  54. Li, S.; Gu, X.; Zhuang, J.; An, T.; Pei, J.; Xie, H.; Li, H.; Fu, S.; Wang, J. Distribution and Storage of Crop Residue Carbon in Aggregates and Its Contribution to Organic Carbon of Soil with Low Fertility. Soil Tillage Res. 2016, 155, 199–206. [Google Scholar] [CrossRef]
  55. Wang, C.; Liu, J.; Shen, J.; Chen, D.; Li, Y.; Jiang, B.; Wu, J. Effects of Biochar Amendment on Net Greenhouse Gas Emissions and Soil Fertility in a Double Rice Cropping System: A 4-Year Field Experiment. Agric. Ecosyst. Environ. 2018, 262, 83–96. [Google Scholar] [CrossRef]
  56. Chen, Z.; Ti, J.; Chen, F. Soil Aggregates Response to Tillage and Residue Management in a Double Paddy Rice Soil of Southern China. Nutr. Cycl. Agroecosyst. 2017, 109, 103–114. [Google Scholar] [CrossRef]
  57. Xu, P.D.; Duan, C.J.; Huang, G.Y.; Dong, K.H.; Wang, C.H. Biochar Addition Promotes Soil Organic Carbon Sequestration Dominantly Contributed by Macro-Aggregates in Agricultural Ecosystems of China. J. Environ. Manag. 2024, 359, 121042. [Google Scholar] [CrossRef]
  58. Li, H.A.; Wei, G.; Tian, J.W.; Liu, R.N.; Liu, M.Y.; Zhang, H.Z.; Chen, X.P.; Masiliūnas, D.; Huang, S.W. Aggregate-Associated Changes in Nutrient Properties, Microbial Community and Functions in a Greenhouse Vegetable Field Based on an Eight-Year Fertilization Experiment of China. J. Integr. Agric. 2020, 19, 2530–2548. [Google Scholar] [CrossRef]
  59. Burns, R.G.; DeForest, J.L.; Marxsen, J.U.; Sinsabaugh, R.L.; Stromberger, M.E.; Wallenstein, M.D.; Weintraub, M.N.; Zoppini, A. Soil Enzymes in a Changing Environment: Current Knowledge and Future Directions. Soil Biol. Biochem. 2013, 58, 216–234. [Google Scholar] [CrossRef]
  60. Masto, R.E.; Kumar, S.; Rout, T.K.; Sarkar, P.; George, J.; Ram, L.C. Biochar from Water Hyacinth (Eichornia crassipes) and Its Impact on Soil Biological Activity. CATENA 2013, 111, 64–71. [Google Scholar] [CrossRef]
  61. Wang, X.; Song, D.; Liang, G.; Zhang, Q.; Ai, C.; Zhou, W. Maize Biochar Addition Rate Influences Soil Enzyme Activity and Microbial Community Composition in a Fluvo-Aquic Soil. Appl. Soil Ecol. 2015, 96, 265–272. [Google Scholar] [CrossRef]
  62. Yang, Y.; Yan, J.; Ding, C. Effects of Biochar Amendment on the Dynamics of Enzyme Activities from a Paddy Soil Polluted by Heavy Metals. Prog. Environ. Sci. Eng. 2013, 610–613, 2129. [Google Scholar] [CrossRef]
  63. Zhang, C.; Liu, G.B.; Xue, S.; Song, Z.L.; Fan, L.X. Evolution of Soil Enzyme Activities of Robinia pseudoacacia Plantation at Different Ages in Loess Hilly Region. Sci. Silvae Sin. 2010, 46, 23–29. [Google Scholar]
  64. Volpiano, C.G.; Lisboa, B.B.; José, J.F.B.d.S.; Beneduzi, A.; Granada, C.E.; Vargas, L.K. Soil-Plant-Microbiota Interactions to Enhance Plant Growth. Rev. Bras. Cienc. Solo 2022, 46, e0210098. [Google Scholar] [CrossRef]
  65. Prudnikova, S.; Streltsova, N.; Volova, T. The Effect of the Pesticide Delivery Method on the Microbial Community of Field Soil. Environ. Sci. Pollut. Res. 2021, 28, 8681–8697. [Google Scholar] [CrossRef]
  66. Aciego Pietri, J.C.; Brookes, P.C. Relationships between soil pH and microbial properties in a UK arable soil. Soil Biol. Biochem. 2008, 40, 1856–1861. [Google Scholar] [CrossRef]
  67. Wang, Z.X.; Chen, Q.M.; Huang, Y.Y.; Deng, H.N.; Shen, X.; Tang, S.Y.; Zhang, J.; Liu, Y. Response of soil respiration and microbial biomass carbon and nitrogen to nitrogen application in subalpine forests of western Sichuan. Acta Ecol. Sin. 2019, 39, 7197–7207. [Google Scholar] [CrossRef]
  68. Tang, H.; Chen, M.; Wu, P.; Faheem, M.; Feng, Q.; Lee, X.; Wang, S.; Wang, B. Engineered biochar effects on soil physicochemical properties and biota communities: A critical review. Chemosphere 2023, 311, 137025. [Google Scholar] [CrossRef]
  69. Chen, J.H.; Liu, X.Y.; Zheng, J.W.; Zhang, B.; Lu, H.F.; Chi, Z.Z.; Pan, G.X.; Li, L.Q.; Zheng, J.F.; Zhang, X.H.; et al. Biochar Soil Amendment Increased Bacterial but Decreased Fungal Gene Abundance with Shifts in Community Structure in a Slightly Acid Rice Paddy from Southwest China. Appl. Soil Ecol. 2013, 71, 33–44. [Google Scholar] [CrossRef]
  70. Jindo, K.; Sanchez-Monedero, M.A.; Hernandez, T.; Garcia, C.; Furukawa, T.; Matsumoto, K.; Sonoki, T.; Bastida, F. Biochar Influences the Microbial Community Structure During Manure Composting with Agricultural Wastes. Sci. Total Environ. 2012, 416, 476–481. [Google Scholar] [CrossRef] [PubMed]
  71. Yao, H.; Gao, Y.; Nicol, G.W.; Campbell, C.D.; Prosser, J.I.; Zhang, L.; Han, W.; Singh, B.K. Links Between Ammonia Oxidizer Community Structure, Abundance, and Nitrification Potential in Acidic Soils. Appl. Environ. Microbiol. 2011, 77, 4618–4625. [Google Scholar] [CrossRef] [PubMed]
  72. Taketani, R.G.; Lima, A.B.; Jesus, E.D.; Teixeira, W.G.; Tiedje, J.M.; Tsai, S.M. Bacterial Community Composition of Anthropogenic Biochar and Amazonian Anthrosols Assessed by 16S rRNA Gene 454 Pyrosequencing. Antonie Van Leeuwenhoek 2013, 104, 233–242. [Google Scholar] [CrossRef] [PubMed]
  73. Nicol, G.W.; Leininger, S.; Schleper, C.; Prosser, J.I. The Influence of Soil pH on the Diversity, Abundance and Transcriptional Activity of Ammonia Oxidizing Archaea and Bacteria. Environ. Microbiol. 2008, 10, 2966–2978. [Google Scholar] [CrossRef]
  74. Li, Y.; Lee, C.G.; Watanabe, T.; Murase, J.; Asakawa, S.; Kimura, M. Identification of Microbial Communities That Assimilate Substrate from Root Cap Cells in an Aerobic Soil Using a DNA-SIP Approach. Soil Biol. Biochem. 2011, 43, 1928–1935. [Google Scholar] [CrossRef]
  75. Lu, Z.J.; Ergenlioglu, I.; Rämgård, C.; McKee, L.S. Strategies for Glycan Acquisition by Bacteroidetes in the Soil: The Carbohydrate Enzymology of Chitinophaga pinensis. Access Microbiol. 2020, 2, 290. [Google Scholar] [CrossRef]
  76. Duan, Y.; Lei, X.G.; Cao, Y.; Liu, L.F.; Zou, Z.W.; Ma, Y.C.; Zhu, X.J.; Fang, W.P. Leguminous Green Manure Intercropping Changes the Soil Microbial Community and Increases Soil Nutrients and Key Quality Components of Tea Leaves. Hortic. Res. 2024, 11, uhae018. [Google Scholar] [CrossRef]
  77. Wang, Y.; Sun, C.C.; Zhou, J.H.; Wang, T.T.; Zheng, J.Y. Effects of Biochar Addition on Soil Bacterial Community in Semi-Arid Region. China Environ. Sci. 2019, 39, 2170–2179. [Google Scholar] [CrossRef]
  78. Jorquera, M.; Inostroza, N.; Lagos, L.; Barra, P.; Marileo, L.; Rilling, J.; Campos, D.; Crowley, D.; Richardson, A.; Mora, M. Bacterial Community Structure and Detection of Putative Plant Growth-Promoting Rhizobacteria Associated with Plants Grown in Chilean Agro-Ecosystems and Undisturbed Ecosystems. Biol. Fertil. Soils 2014, 50, 1141–1153. [Google Scholar] [CrossRef]
  79. Yu, L.; Homyak, P.M.; Li, L.F.; Gu, H.P. Succession of Bacterial Community Structure in Response to a One-Time Application of Biochar in Barley Rhizosphere and Bulk Soils. Elementa 2023, 11, 00101. [Google Scholar] [CrossRef]
  80. Sukweenadhi, J.; Kim, Y.; Kang, C.; Farh, M.; Nguyen, N.; Hoang, V.; Choi, E.; Yang, D. Sphingomonas panaciterrae sp. nov., a plant growth-promoting bacterium isolated from soil of a ginseng field. Arch. Microbiol. 2015, 197, 973–981. [Google Scholar] [CrossRef] [PubMed]
  81. Khodadad, C.L.M.; Zimmerman, A.R.; Green, S.J.; Uthandi, S.; Foster, J.S. Taxa-Specific Changes in Soil Microbial Community Composition Induced by Pyrogenic Carbon Amendments. Soil Biol. Biochem. 2011, 43, 385–392. [Google Scholar] [CrossRef]
  82. Zou, X.; Liu, Y.; Huang, M.; Li, F.; Si, T.; Wang, Y.; Yu, X.; Zhang, X.; Wang, H.; Shi, P. Rotational Strip Intercropping of Maize and Peanut Enhances Productivity by Improving Crop Photosynthetic Production and Optimizing Soil Nutrients and Bacterial Communities. Field Crops Res. 2023, 291, 108770. [Google Scholar] [CrossRef]
  83. Luo, L.; Wang, L.; Deng, L.; Mei, X.; Liu, Y.; Huang, H.; Du, F.; Zhu, S.; Yang, M. Enrichment of Burkholderia in the Rhizosphere by Autotoxic Ginsenosides to Alleviate Negative Plant-Soil Feedback. Microbiol. Spectr. 2021, 9, e0140021. [Google Scholar] [CrossRef]
  84. Hou, J.W.; Xing, C.F.; Lu, Z.H.; Chen, F.; Yu, G. Effects of the Different Crop Straw Biochars on Soil Bacterial Community of Yellow Soil in Guizhou. Sci. Agric. Sin. 2018, 51, 4485–4495. [Google Scholar] [CrossRef]
  85. Scarlett, K.; Denman, S.; Clark, D.R.; Forster, J.; Vanguelova, E.; Brown, N.; Whitby, C. Relationships between Nitrogen Cycling Microbial Community Abundance and Composition Reveal the Indirect Effect of Soil pH on Oak Decline. ISME J. 2021, 15, 623–635. [Google Scholar] [CrossRef]
  86. Wan, W.; Hao, X.; Xing, Y.; Liu, S.; Zhang, X.; Li, X.; Chen, W.; Huang, Q. Spatial Differences in Soil Microbial Diversity Caused by pH-Driven Organic Phosphorus Mineralization. Land Degrad. Dev. 2020, 32, 766–776. [Google Scholar] [CrossRef]
  87. Xiao, D.R.; Tian, K.; Zhang, L.Q. Relationship between Plant Diversity and Soil Fertility in Napahai Wetland of Northwestern Yunnan Plateau. Acta Ecol. Sin. 2008, 28, 3116–3124. [Google Scholar]
  88. Zhang, X.; Song, Y.; Yang, X.; Hu, C.; Wang, K. Regulation of Soil Enzyme Activity and Bacterial Communities by Food Waste Compost Application During Field Tobacco Cultivation Cycle. Appl. Soil Ecol. 2023, 192, 105016. [Google Scholar] [CrossRef]
  89. Zhou, Y.X.; Chen, J.; Li, Y.; Hou, Z.A.; Min, W. Effects of Cotton Stalk Returning on Soil Enzyme Activity and Bacterial Community Structure Diversity in Cotton Field with Long-term Saline Water Irrigation. Environ. Sci. 2022, 43, 2192–2203. [Google Scholar] [CrossRef]
  90. Bapat, H.; Manahan, S.E.; Larsen, D.W. An Activated Carbon Product Prepared from Milo (Sorghum vulgare) Grain for Use in Hazardous Waste Gasification by ChemChar Cocurrent Flow Gasification. Chemosphere 1999, 39, 23–32. [Google Scholar] [CrossRef]
  91. Suppadit, T.; Phumkokrak, N.; Poungsuk, P. The Effect of Using Quail Litter Biochar on Soybean (Glycine max [L.] Merr.) Production. Chil. J. Agric. Res. 2012, 72, 244–251. [Google Scholar] [CrossRef]
  92. Liao, Y.; Awan, M.I.; Aamer, M.; Liu, J.; Liu, J.; Hu, B.; Gao, Z.; Zhu, B.; Yao, F.; Cheng, C. Evaluating Short-term Effects of Rice Straw Management on Carbon Fractions, Composition and Stability of Soil Aggregates in an Acidic Red Soil with a Vegetable Planting History. Heliyon 2023, 10, e23724. [Google Scholar] [CrossRef]
  93. Xiang, L.; Liu, S.; Ye, S.; Yang, H.; Song, B.; Qin, F.; Shen, M.; Tan, C.; Zeng, G.; Tan, X. Potential Hazards of Biochar: The Negative Environmental Impacts of Biochar Applications. J. Hazard. Mater. 2021, 420, 126611. [Google Scholar] [CrossRef]
Figure 1. Effects of biochar addition rate on the distribution of organic carbon content and contribution rate of organic carbon in mechanically stable aggregates. (a) Distribution of organic carbon content; (b) Contribution rate of organic carbon. Different lowercase letters indicate significant differences between different treatments within the same size fraction (p < 0.05).
Horticulturae 12 00515 g001
Figure 2. Boxplots of the alpha diversity of bacteria and fungi in the rhizosphere soil under different biochar application after two years of pepper continuous cropping. (a) and (b) represent Chao 1 and Shannon index of bacteria in the rhizosphere soil of different treatments, respectively. (c) and (d) represent Chao 1 and Shannon index of fungi in the rhizosphere soil of different treatments, respectively.
Horticulturae 12 00515 g002
Figure 3. PCoA and NMDS were analyzed for bacteria and fungi in the rhizosphere soil under different biochar application after two years of pepper continuous cropping. (a) PCoA analysis of bacterial community structure. (b) NMDS analysis of bacterial community structure. (c) PCoA analysis of fungal community structure. (d) NMDS analysis of fungal community structure.
Horticulturae 12 00515 g003
Figure 4. Venn diagrams of bacterial and fungal OTUs in the rhizosphere soil under different biochar application after two years of pepper continuous cropping. (a) Venn diagram of bacterial OTUs. (b) Venn diagram of fungal OTUs.
Horticulturae 12 00515 g004
Figure 5. Relative abundance distribution of the rhizosphere soil microbial community at phylum level under different biochar application after two years of pepper continuous cropping. (a) Bar plot of the bacterial community at the phylum level. (b) Bar plot of the fungal community at the phylum level. The relative abundance in each sample was calculated on the basis of the percentage of the total effective sequences, which were classified using the RDP classifier. ‘Other’ represents the sum of the relative abundances of phylum level except the top 30 relative abundances.
Horticulturae 12 00515 g005
Figure 6. Heatmaps of bacterial and fungal communities at the class level in the rhizosphere soil under different biochar application after two years of pepper continuous cropping. (a) Heatmap of the bacterial community at the class level. (b) Heatmap of the fungal community at the class level. The relative abundance in each sample was calculated on the basis of the percentage of the total effective sequences, which were classified using the RDP classifier.
Horticulturae 12 00515 g006
Figure 7. Correlation analysis between the composition of rhizosphere microbial community and soil physicochemical properties under continuous cultivation of pepper cropping. (a) rhizosphere bacteria; (b) rhizosphere fungi. Soil physicochemical properties are labeled horizontally at the bottom of the graph, and OTUs are labeled vertically on the right side of the graph. AP: available phosphorus, OM: organic matter, N: total nitrogen, AN: Alkali hydrolyzed nitrogen, AK: available K. The value corresponding to each square in the heat map presents the Spearman correlation coefficient r [−1~1] between OTUs and soil physicochemical properties, with r > 0 being a positive correlation, and r < 0 being a negative correlation. Significance test p values less than 0.001 are labeled ***, p values between 0.01 and 0.001 are labeled **, and p values between 0.01 and 0.05 are labeled *.
Horticulturae 12 00515 g007
Figure 8. Pearson correlation analysis between soil microbial community diversity and soil environmental factors. (a) Rhizosphere bacteria; (b) Rhizosphere fungi. AP: Effective phosphorus; OM: Organic matter; N: Total nitrogen; AN: Alkaline hydrolyzed nitrogen; AK: Available potassium. The significance test with a p-value less than 0.001 is marked as ***, The annotation for p values between 0.01 and 0.001 is **, p values between 0.01 and 0.05 are marked as *.
Horticulturae 12 00515 g008
Figure 9. Pearson correlation analysis of soil microbial community diversity and soil enzyme activity. (a) Rhizosphere bacteria; (b) Rhizosphere fungi. The significance test with a p-value less than 0.001 is marked as ***, The annotation for p values between 0.01 and 0.001 is **, p values between 0.01 and 0.05 are marked as *.
Horticulturae 12 00515 g009
Table 1. Effects of different biochar application on yield and appearance quality of pepper in facility continuous cropping.
YearRotationsTreatmentFruit Longitude/(cm)Fruit Width/(mm)Sing Fruit Weight/(g)Individual Yield/(g·plant−1)
2021Winter–spring stubble0%13.71 ± 1.91 a9.82 ± 1.92 a7.34 ± 1.49 a66.30 ± 2.69 e
2%14.41 ± 1.19 a11.56 ± 0.66 a8.30 ± 1.73 a106.62 ± 10.28 c
4%14.78 ± 0.81 a11.74 ± 0.80 a8.71 ± 0.77 a129.91 ± 9.80 b
6%15.54 ± 1.66 a12.30 ± 2.11 a9.11 ± 0.21 a148.60 ± 12.26 a
Autumn–winter stubble0%15.10 ± 1.38 a11.46 ± 1.12 a8.29 ± 1.74 a100.92 ± 11.10 b
2%15.41 ± 0.91 a11.53 ± 1.49 a8.31 ± 1.36 a109.58 ± 13.28 b
4%15.55 ± 1.89 a11.66 ± 1.91 a8.42 ± 2.98 a123.83 ± 11.66 b
6%15.75 ± 2.43 a11.46 ± 1.63 a8.75 ± 3.17 a165.86 ± 16.20 a
10%15.28 ± 2.02 a12.36 ± 2.53 a8.70 ± 1.98 a150.10 ± 13.81 a
2022Winter–spring stubble0%16.12 ± 0.73 b11.69 ± 0.67 c8.45 ± 0.69 b252.73 ± 11.47 d
2%16.72 ± 0.70 ab12.46 ± 0.57 b8.63 ± 0.68 ab329.74 ± 6.45 c
4%17.75 ± 1.79 a13.07 ± 0.64 ab9.36 ± 1.07 a349.65 ± 12.18 b
6%17.17 ± 1.13 ab13.15 ± 0.61 a9.18 ± 1.22 ab374.18 ± 7.52 a
10%17.08 ± 0.46 ab13.31 ± 1.14 a8.96 ± 0.42 ab366.64 ± 0.94 a
Autumn–winter stubble0%10.41 ± 1.38 a14.44 ± 2.74 a8.41 ± 2.15 a55.91 ± 0.46 e
2%10.70 ± 2.46 a16.06 ± 2.68 a8.49 ± 2.06 a69.02 ± 3.06 d
4%10.84 ± 2.05 a14.96 ± 1.86 a8.56 ± 2.01 a85.16 ± 2.96 c
6%11.69 ± 1.93 a14.50 ± 3.84 a8.63 ± 1.39 a105.70 ± 4.54 a
10%12.15 ± 1.26 a15.49 ± 2.00 a8.43 ± 0.97 a96.06 ± 2.99 b
Note: The table data was means of three independent replicates, values were in the form of mean ± standard deviation. Different lowercase letters indicate significant differences between different treatments (p < 0.05). The 10% biochar treatment was absent in the winter–spring 2021 stubble. Therefore, dose–response analyses involving all five treatment levels are not applicable for this specific season.
Table 2. Effects of different biochar application on dry matter production of pepper in facility continuous cropping.
YearRotationsTreatmentStem/(g·plant−1)Leaf/(g·plant−1)Fruit/(g·plant−1)Total/(g·plant−1)
2021Winter–spring
stubble
0%14.67 ± 2.48 b13.07 ± 2.34 b18.71 ± 4.68 b46.45 ± 5.99 c
2%21.52 ± 6.88 a19.21 ± 1.07 a35.66 ± 7.28 ab76.39 ± 14.82 b
4%22.69 ± 7.01 a20.36 ± 2.03 a46.51 ± 8.54 a89.56 ± 5.37 ab
6%24.31 ± 3.67 a21.00 ± 1.09 a50.26 ± 5.98 a95.58 ± 6.49 a
Autumn–winter
stubble
0%17.55 ± 2.18 b14.28 ± 2.21 b30.25 ± 7.29 c62.08 ± 10.38 e
2%25.61 ± 7.40 a19.07 ± 4.82 a36.25 ± 9.87 c80.94 ± 13.14 d
4%25.93 ± 4.21 a21.02 ± 3.71 a48.08 ± 8.11b c95.02 ± 10.83 c
6%27.60 ± 5.52 a21.84 ± 3.86 a79.08 ± 6.22 a128.52 ± 8.01 a
10%26.01 ± 4.58 a21.74 ± 3.57 a68.54 ± 7.67 a116.29 ± 6.93 b
2022Winter–spring stubble0%33.47 ± 6.39 a24.46 ± 5.10 c44.75 ± 4.30 c101.08 ± 8.29 c
2%33.75 ± 5.60 a25.31 ± 3.28 c52.93 ± 3.26 b111.28 ± 7.66 b
4%33.86 ± 3.00 a25.71 ± 2.64b c52.99 ± 6.54 b112.16 ± 5.37 b
6%36.74 ± 4.55 a29.80 ± 3.85 a62.80 ± 3.49 a131.78 ± 7.24 a
10%35.75 ± 3.89 a28.64 ± 2.13 ab53.42 ± 1.12 b117.89 ± 6.41 b
Autumn–winter
stubble
0%14.66 ± 2.83 a13.90 ± 2.53 b27.78 ± 3.14 ab56.34 ± 5.04 c
2%14.67 ± 5.10 a14.36 ± 2.31 b27.78 ± 3.26 ab56.81 ± 7.62 c
4%15.08 ± 3.36 a14.95 ± 3.13 b37.94 ± 4.26 a67.97 ± 9.16 b
6%15.95 ± 4.21 a17.89 ± 3.65 a43.23 ± 3.02 a77.07 ± 7.46 a
10%15.49 ± 5.46 a15.04 ± 2.66 b40.11 ± 6.98 a70.63 ± 10.72 ab
Note: The table data was means of three independent replicates, values were in the form of mean ± standard deviation. Different lowercase letters indicate significant differences between different treatments (p < 0.05). The 10% biochar treatment was absent in the winter–spring 2021 stubble. Therefore, dose–response analyses involving all five treatment levels are not applicable for this specific season.
Table 3. Effects of different biochar application on soil physicochemical properties of pepper in facility continuous cropping.
YearRotationsTreatmentpHOrganic Matter (g·kg−1)Available P (mg·kg−1)Avail
K (mg·kg−1)
Alkeline-N (mg·kg−1)Total Nitrogen (g·kg−1)
2021Winter–spring stubble0%6.26 ± 0.12 b16.21 ± 1.80 c9.78 ± 2.58 c135.33 ± 8.50 e72.33 ± 4.04 a0.33 ± 0.10 c
2%6.73 ± 0.21 b23.30 ± 1.63 b15.34 ± 5.56 bc160.33 ± 9.43 c68.60 ± 4.24 a0.55 ± 0.11 b
4%6.84 ± 0.11 ab36.05 ± 6.22 a19.38 ± 3.14 ab176.67 ± 7.21 b67.67 ± 10.10 a0.69 ± 0.07 a
6%7.22 ± 0.41 a31.13 ± 1.47 a26.61 ± 4.44 a189.00 ± 10.83 a66.50 ± 7.00 a0.76 ± 0.04 a
Autumn–winter stubble0%5.46 ± 0.07 d16.10 ± 1.57 d24.12 ± 0.85 c94.67 ± 4.50 e83.83 ± 9.07 a0.42 ± 0.07 c
2%5.67 ± 0.07 cd21.28 ± 2.85 d24.59 ± 3.69 c108.67 ± 7.02 d88.67 ± 5.35 a0.54 ± 0.01 bc
4%5.90 ± 0.18 bc29.90 ± 4.73 c42.27 ± 2.32 b122.67 ± 4.51 c86.33 ± 2.02 a0.60 ± 0.04 bc
6%6.13 ± 0.09 b40.44 ± 5.07 b48.23 ± 0.45 a178.00 ± 1.00 a78.17 ± 2.02 a0.77 ± 0.14 ab
10%6.52 ± 0.32 a53.02 ± 0.83 a41.69 ± 3.74 b145.33 ± 8.81 b77.83 ± 4.80 a0.90 ± 0.26 a
2022Winter–spring stubble0%5.40 ± 0.05 c8.19 ± 1.71 c20.09 ± 3.28 ab66.67 ± 6.51 b84.00 ± 3.50 ab0.48 ± 0.04 c
2%5.58 ± 0.39 bc10.69 ± 1.21 c30.15 ± 8.78 a72.00 ± 5.57 b94.50 ± 3.50 a0.61 ± 0.21 bc
4%5.88 ± 0.04 ab14.42 ± 3.62 c23.22 ± 2.56 ab74.33 ± 6.66 b82.83 ± 8.69 ab0.68 ± 0.24 b
6%6.02 ± 0.22 a31.13 ± 5.17 b19.49 ± 4.24 ab98.33 ± 8.62 a78.17 ± 4.04 b0.79 ± 0.14 ab
10%6.26 ± 0.08 a45.30 ± 3.84 a15.20 ± 3.17 b100.00 ± 10.15 a78.67 ± 2.02 b0.92 ± 0.29 a
Autumn–winter stubble0%5.04 ± 0.07 b7.20 ± 3.25 d25.92 ± 1.20 ab86.67 ± 5.89 d127.33 ± 10.91 ab0.61 ± 0.04 b
2%5.26 ± 0.22 b9.89 ± 1.49 cd34.94 ± 8.36 a102.00 ± 3.15 b152.83 ± 9.58 a0.73 ± 0.10 ab
4%5.31 ± 0.08 b12.24 ± 1.07 c27.85 ± 7.70 ab108.67 ± 4.77 a122.50 ± 10.65 ab0.77 ± 0.07 ab
6%5.68 ± 0.19 a27.64 ± 1.68 b25.28 ± 4.10 ab111.33 ± 6.86 c112.00 ± 6.06 b0.83 ± 0.07 ab
10%5.86 ± 0.20 a40.02 ± 0.85 a20.03 ± 1.93 b101.67 ± 9.40 c110.83 ± 8.50 b1.01 ± 0.30 a
Note: The table data was means of three independent replicates, values were in the form of mean ± standard deviation. Different lowercase letters indicate significant differences between different treatments (p < 0.05). Alkeline-N: alkaline hydrolysable nitrogen, Available P: available phosphorus, Avail K: available potassium. The 10% biochar treatment was absent in the winter–spring 2021 stubble. Therefore, dose–response analyses involving all five treatment levels are not applicable for this specific season.
Table 4. The effect of different biochar application rates on changes in soil enzyme activity.
YearRotationsTreatmentUrease
/[mg/(g·d)]
Catalase
/[ml/(g·h)]
Invertase
/[mg/(g·d)]
Amylase
/[mg/(g·d)]
Acid Phosphatase
/[mg/(g·d)]
Polyphenol Oxidase
/[mg/(g·d)]
2021Winter–spring stubble0%0.29 ± 0.09 b1.25 ± 0.26 b0.64 ± 0.22 a2.68 ± 0.13 b0.24 ± 0.06 a4.41 ± 0.40 a
2%0.32 ± 0.01 b1.43 ± 0.05 ab2.69 ± 0.09 a3.81 ± 0.40 ab0.51 ± 0.07 a3.30 ± 0.67 b
4%0.34 ± 0.03 b1.62 ± 0.12 a2.86 ± 0.16 a3.55 ± 0.15 b0.43 ± 0.06 a2.09 ± 0.49 b
6%0.43 ± 0.07 a1.59 ± 0.10 a2.67 ± 0.12 a3.17 ± 0.97 b0.29 ± 0.05 a2.05 ± 0.21 b
Autumn–winter stubble0%0.71 ± 0.15 b1.07 ± 0.14 b2.75 ± 0.07 b3.41 ± 0.25 b0.41 ± 0.35 b4.52 ± 0.04 a
2%0.74 ± 0.34 b1.30 ± 0.06 ab2.95 ± 0.08 b3.45 ± 0.72 b0.47 ± 0.45 ab4.53 ± 0.11 a
4%1.35 ± 0.54 b1.32 ± 0.54 ab2.97 ± 0.05 b3.41 ± 0.11 b1.24 ± 0.34 ab3.36 ± 0.98 b
6%1.47 ± 0.25 ab1.44 ± 0.44 ab3.07 ± 0.10 b3.85 ± 0.43 a1.34 ± 0.54 a3.02 ± 0.77 b
10%1.75 ± 0.15 a1.50 ± 0.51 a3.50 ± 0.10 a3.22 ± 0.24 ab1.57 ± 0.21 a2.61 ± 0.06 b
2022Winter–spring stubble0%0.51 ± 0.36 b1.84 ± 0.07 b3.49 ± 0.01 b3.85 ± 0.54 b1.62 ± 0.47 a4.71 ± 0.24 a
2%0.97 ± 0.47 b1.91 ± 0.06 b3.54 ± 0.13 b3.95 ± 0.33 b1.45 ± 0.25 a4.70 ± 0.11 a
4%1.74 ± 0.45 b1.92 ± 0.24 b3.67 ± 0.13 b4.66 ± 0.77 ab1.21 ± 0.60 a3.61 ± 0.34 ab
6%1.80 ± 0.46 ab1.99 ± 0.67 b3.81 ± 0.04 ab4.38 ± 0.64 a1.51 ± 0.20 b3.39 ± 0.06 b
10%1.91 ± 0.44 a2.47 ± 0.24 a5.14 ± 0.09 a3.54 ± 0.21 b1.63 ± 0.11 c3.21 ± 0.58 b
Autumn–winter stubble0%0.43 ± 0.07 b0.53 ± 0.06 c2.40 ± 0.18 c3.56 ± 0.60 a1.97 ± 0.09 a4.75 ± 0.00 a
2%1.35 ± 0.05 ab0.63 ± 0.22 c2.86 ± 0.07 b4.36 ± 0.74 a2.24 ± 0.04 b4.71 ± 0.43 a
4%1.59 ± 0.54 ab0.67 ± 0.01 c2.91 ± 0.04 b4.07 ± 0.79 a2.41 ± 0.11 b4.47 ± 0.63 a
6%1.67 ± 0.41 ab1.08 ± 0.10 b3.53 ± 0.16 a4.01 ± 0.08 a2.29 ± 0.31 bc3.58 ± 0.39 a
10%1.85 ± 0.84 a1.45 ± 0.30 a3.57 ± 0.21 a3.88 ± 0.81 a2.54 ± 0.52 c3.40 ± 0.17 a
Note: The table data was means of three independent replicates, values were in the form of mean ± standard deviation. Different lowercase letters indicate significant differences between different treatments (p < 0.05). The 10% biochar treatment was absent in the winter–spring 2021 stubble. Therefore, dose–response analyses involving all five treatment levels are not applicable for this specific season.
Table 5. Effects of different biochar application on rhizosphere soil microbial quantity of pepper in facility continuous cropping.
YearRotationsTreatmentBacteria
/(×106 cfu·g−1)
Fungi
/(×104 cfu·g−1)
Actinomycete
/(×105 cfu·g−1)
2022Autumn–winter stubble0%2.36 ± 0.10 c4.07 ± 0.07 b13.90 ± 0.78 b
2%7.82 ± 0.35 b6.48 ± 1.00 b15.69 ± 0.52 ab
4%8.89 ± 0.42 b7.59 ± 1.21 a17.23 ± 0.17 ab
6%10.54 ± 0.03 a8.44 ± 2.43 a20.36 ± 1.36 a
10%12.46 ± 0.11 a5.67 ± 0.96 b26.77 ± 2.07 a
Note: The table data was means of three independent replicates, values were in the form of mean ± standard deviation. Different lowercase letters indicate significant differences between different treatments (p < 0.05).
Table 6. Effect of biochar addition on aggregate composition.
MethodTreatment >2 mm 2.00~1.00 mm 1.00~0.50 mm0.50~0.25 mm <0.25 mm
MSA0%48.36 ± 2.31 a31.09 ± 2.37 d12.23 ± 3.56 a2.45 ± 1.02 a5.87 ± 0.47 a
2.5%42.95 ± 3.10 b35.01 ± 2.49 cd13.82 ± 0.82 a2.40 ± 1.45 a5.67 ± 0.39 ab
5%40.51 ± 2.02 bc38.25 ± 1.06 bc14.66 ± 1.66 a1.91 ± 0.55 a4.66 ± 0.55 b
7.5%37.27 ± 1.10 c42.48 ± 3.55 ab16.21 ± 2.42 a1.66 ± 0.94 a2.41 ± 0.71 c
10%32.98 ± 0.67 d46.62 ± 2.99 a16.80 ± 1.32 a1.18 ± 0.67 a2.26 ± 0.53 c
WSA0%0.62 ± 0.01 a13.2 ± 2.04 a24.3 ± 2.86 b9.79 ± 0.71 d52.16 ± 2.49 a
2.5%0.19 ± 0.08 a13.12 ± 1.27 ab26.63 ± 1.5 b21.79 ± 2.04 c38.17 ± 1.92 b
5%0.11 ± 0.01 a12.26 ± 0.14 ab27.59 ± 2.46 b29.56 ± 2.22 b30.48 ± 0.71 c
7.5%0.06 ± 0.03 a9.46 ± 2.82 b32.99 ± 1.48 a30.65 ± 0.91 b26.92 ± 1.12 d
10%0.03 ± 0.03 a5.00 ± 2.19 c34.23 ± 1.53 a36.48 ± 2.82 a24.26 ± 2.66 d
Note: The table data was means of three independent replicates, values were in the form of mean ± standard deviation. Different lowercase letters indicate significant differences between different treatments (p < 0.05). MSA (mechanically stable aggregates), WSA (waterstable aggregates).
Table 7. Effect of biochar addition on soil aggregate stability.
MethodTreatmentMWD/mmGMD/mmDR0.25/%
MSA0%1.79 ± 0.14 a1.50 ± 0.20 a1.81 ± 0.20 a94.13 ± 3.13 a
2.5%1.72 ± 0.17 a1.45 ± 0.24 a1.75 ± 0.23 a94.18 ± 4.02 a
5%1.71 ± 0.07 a1.46 ± 0.14 a1.63 ± 0.30 a95.34 ± 3.83 a
7.5%1.70 ± 0.11 a1.50 ± 0.12 a1.42 ± 0.11 a97.62 ± 0.68 a
10%1.66 ± 0.03 a1.48 ± 0.02 a1.29 ± 0.32 a97.58 ± 1.26 a
WSA0%0.51 ± 0.06 a0.34 ± 0.04 b2.53 ± 0.06 ab47.9 ± 3.05 d
2.5%0.54 ± 0.02 a0.39 ± 0.03 ab2.70 ± 0.20 a61.53 ± 3.48 c
5%0.55 ± 0.02 a0.41 ± 0.02 a2.34 ± 0.01 bc69.53 ± 0.86 b
7.5%0.55 ± 0.03 a0.42 ± 0.02 a2.28 ± 0.06 c73.17 ± 0.99 ab
10%0.51 ± 0.07 a0.41 ± 0.04 a2.25 ± 0.06 c75.74 ± 3.81 a
Note: The table data was means of three independent replicates, values were in the form of mean ± standard deviation. Different lowercase letters indicate significant differences between different treatments (p < 0.05). MSA (mechanically stable aggregates), WSA (water-stable aggregates), MWD (mean weight diameter), GMD (geometric mean diameter), D (fractal dimension), R0.25 (aggregate content greater than 0.25 mm).
Table 8. Effect of biochar addition on PAD and ELT.
TreatmentPAD/%ELT/%
0%49.25 ± 2.35 a52.1 ± 2.54 a
2.5%34.31 ± 1.93 b38.47 ± 3.43 b
5%26.97 ± 1.99 c30.47 ± 0.86 c
7.5%25.07 ± 1.37 cd26.83 ± 1.79 cd
10%22.33 ± 1.54 d24.26 ± 1.17 d
Note: The table data was means of three independent replicates, values were in the form of mean ± standard deviation. Different lowercase letters indicate significant differences between different treatments (p < 0.05). PAD (aggregate failure rate), ELT (unstable aggregate index).
Disclaimer/Publisher’s Note: The statements, opinions and data contained in all publications are solely those of the individual author(s) and contributor(s) and not of MDPI and/or the editor(s). MDPI and/or the editor(s) disclaim responsibility for any injury to people or property resulting from any ideas, methods, instructions or products referred to in the content.